Abstract
In this study, we compare two contrasting years within the 2020–2025 period—one characterized by extreme heat and drought, and another by unusually high precipitation. We used five years of climatic data provided by the Hungarian Meteorological Service (OMSZ), along with vegetation activity indices (NDVI—Normalized Difference Vegetation Index; NDWI—Normalized Difference Water Index) derived from Sentinel-2A satellite imagery. In parallel, during three years of the study period (2020, 2022, and 2025), we collected five phytosociological relevés in each of the five vegetation types subjected to different management regimes. For data analysis, we applied Principal Component Analysis (PCA), Detrended Correspondence Analysis (DCA), and the Additive Main Effects and Multiplicative Interaction (AMMI) model. Vegetation index patterns were compared with the relative water requirements of the constituent plant species. In the ungrazed dry sandy site, climatic fluctuations did not significantly affect vegetation composition and the habitat remained a stable open sandy grassland. Among the four grazed sites, grazing intensity remained unchanged during the study in three cases (N1, N2, and SZ). Thus, vegetation changes observed in these areas can be attributed to climatic factors. Vegetation composition shifted in N1 and N2, whereas no significant change was detected in the drier SZ site. This indicates higher resistance to grazing in SZ, which can therefore be sustainably used as pasture, while the N1–N2 sites responded sensitively to precipitation variability under identical grazing pressure and are better suited for use as meadows. The most pronounced changes occurred at the P site, which had previously functioned as an animal resting area and began regenerating after abandonment in 2022. Vegetation composition shifted markedly within two years, demonstrating that land-use practices exert a stronger influence on sandy grassland vegetation than climatic fluctuations. Overall, the drier habitats were more resilient to both grazing pressure and climatic variability and are suitable for grazing, whereas the moister vegetation types were more sensitive and should preferably be managed as hay meadows.
1. Introduction
In recent decades, significant climatic extremes have been observed across Europe as a result of global climate change [1]. In the Carpathian Basin, the most common extremes are irregular alternations between droughts and floods [2,3]. Global climate change exerts a profound impact on vegetation across Europe, causing shifts in species distribution and a decline in biodiversity. Rising temperatures and altered precipitation patterns are expected to continue, affecting plant growth, leading to a gradual northward migration of species and transformations in ecosystem composition [4]. In regions such as the Carpathian Basin, the erratic succession of droughts and floods exacerbates these trends, placing additional stress on plants and the ecosystem functions of vegetation [5,6].
Simultaneously, the territory of wetlands have undergone substantial decline worldwide, with some areas experiencing losses of 50–90% over the past centuries [7,8]. In Europe, and particularly in the Carpathian Basin, the decline of wetlands has been significant; various studies estimate that nearly two-thirds of European wetlands have vanished since the early 19th century [9] and that more than 60% of wetlands have been lost since the 1980s, primarily due to anthropogenic activities [10,11].
Intensified drought conditions reduce plant productivity and biodiversity, while increased flooding disrupts plant growth cycles and significantly alters soil condition [12,13]. The interplay of these factors endangers numerous native species, triggering a shift toward more drought-tolerant or flood-resilient species. These dynamics underscore the urgent need for targeted conservation strategies to mitigate the harmful effects of climate-induced hydrological extremes on vegetation health in the Carpathian Basin and beyond [4]. However, in this mosaic-like, constantly changing system, monitoring is a methodological challenge. Advancements in remote sensing technology enable researchers to efficiently quantify vegetation responses to climatic extremes [14]. The Normalized Difference Vegetation Index (NDVI) provides an effective means of quantifying vegetation cover and monitoring changes over time, making it particularly useful in grasslands where vegetation dynamics are highly influenced by climatic factors [15,16]. Remote sensing has been applied less extensively to the study of natural grasslands, with its primary use rooted in agricultural practice. Hyperspectral analyses likewise support crop production techniques [17,18,19]. In cultivated crops, remote sensing is used most successfully for yield estimation [20,21,22,23,24,25,26]. In addition, the integration of satellite data and field-based observations enhances the reliability and accuracy of ecological analyses. Field data collection allows researchers to validate satellite observations, ensuring that variations detected by NDVI and Normalized Difference Water Index (NDWI) accurately reflect the conditions of vegetation and soil moisture [27].
In regions such as the Carpathian Basin, the irregular occurrence of droughts and floods further disrupts the ecological balance of these systems. Moreover, deviations from typical soil moisture levels—either through excessive rainfall or prolonged drought—can lead to shifts in species composition, often in favour of invasive species that are more tolerant of extreme conditions [28]. Thus, understanding soil moisture dynamics caused by extreme climatic events is critical, as they mediate the extent of vegetation response in grasslands [25].
Anthropogenic activities, including overgrazing and land-use changes, amplify the adverse effects of climatic irregularities on grasslands. Overgrazing reduces plant cover, diminishing the soil’s ability to retain moisture, thereby exacerbating the impacts of droughts and floods [29]. Therefore, land use plays a particularly significant role in the management of such sensitive areas. Variations in groundwater levels clearly influence the spatial distribution of vegetation types [30,31]. In the study area, the River Ipoly runs in a linear course, yet within its floodplain—shaped over time by the meandering, unregulated river—a mosaic-like habitat distribution has emerged, largely due to topography [32]. Typical land use types in these floodplains include plough-land, pasture, and urban development [33,34]. The terrain influences how floodplains are used; areas with fertile soil are often turned into farmland, which in turn results in habitat loss and environmental degradation [35]. Conversely, grazing—when managed appropriately—can be a sustainable way of land use [30,36,37]. However, intensive grazing practices can cause soil compaction, erosion, and salinization, and all of these severely affect both biodiversity and water quality [38]. Trampling of vegetation may damage root systems, leaving soil more vulnerable to erosion and limiting its capacity to recover after flood events. Moreover, nutrient runoff from overgrazed areas may contribute to the eutrophication of adjacent water bodies [39]. Based on our previous phytosociological and habitat-mapping studies in the Ipoly region, the area is highly responsive to environmental variability and as riverine wetland serves as a reliable indicator of environmental conditions and change [32,40,41].
Objective Hypotheses, and Research Questions
Preliminary investigations indicated that this floodplain grassland is an ideal site for exploring habitat dynamics. Due to its ecological sensitivity, the area is well suited for studying vegetation responses to climatic extremes. We assumed that vegetation would closely track climatic fluctuations in spring time.
A key question was how the ecological indicator values of plant species occurring in the study area relate to vegetation-index-based satellite imagery. Do these ecological values corroborate satellite-derived patterns, or does the vegetation respond more slowly than expected?
We also asked whether climatic change or land-use practices—specifically livestock grazing—exert a stronger influence on vegetation dynamics. Given that the livestock resting area was relocated, it is also important to assess whether the vegetation can regenerate within two years, and to what extent the species composition undergoes change. Finally, we investigated how climatic fluctuations and the cessation of grazing are reflected in the five examined vegetation types, using the species’ relative ecological indicator values.
2. Materials and Methods
2.1. Study Area
The study area is located in the northern part of Hungary, on the left bank of the River Ipoly, between the villages of Dejtár and Patak, in a total area of about 3.35 km2 (Figure 1) where five sampling areas were selected (N1, N2, Sz, P and H). Meteorological data was downloaded from the database of the National Meteorological Service, Hungary (OMSZ). The nearest station is Tésa-Vízmű.
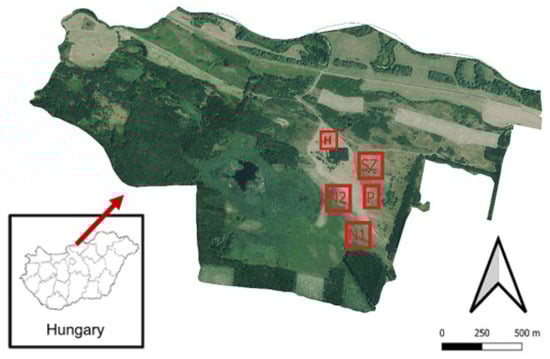
Figure 1.
The Ipoly Valley study area with presentation of the studied grassland sample areas (FF/268/1/2019, Levente Nagy, 29.03.2019, Prepared using state basic data, based on the work) N1—semi-wet sandy grassland, N2—dry sandy grassland 2, SZ—cattle pasture, P—cattle resting place, H—dry sandy grassland dominated by Corynephorus canescens.
The River Ipoly is one of the last rivers in Hungary that is little affected by water management, in addition the entire area of the Ipoly valley is protected by law. It is also an area conforming to special bird protection (HUDI10008) and special habitat protection directives (HUDI20026), as well as a Ramsar site [42,43]. Despite its linear appearance, the area of the Ipoly valley is characterized by mosaic habitats due to the natural, unregulated river [32].
2.2. Materials
A total of 5 sample areas were selected (Figure 1). We chose representative grasslands with specific characteristics of the area and respond well to microclimatic changes due to their sensitivity:
1. (H): Untreated, calcareous sandy grassland dominated by Corynephorus canescens. Ecological classification: Thymo serpylli–Festucetum pseudo-vinae Borhidi 1958. The area is not subject to grazing and represents a natural grassland state.
2–3. (N1 and N2): These sites share the common feature of being grazed by Charolais-type cattle. The difference between the two areas lies in moisture conditions: site N1 represents a wetter habitat, whereas site N2 is comparatively drier. Their phytosociological classification is Cynodonti–Poetum angustifoliae Rapaics ex Soó 1957.
4. (SZ): The higher-lying section marked as SZ is grazed by Hungarian Grey cattle. Owing to the lower grazing pressure, this area can be assigned to the Salvio nemorosae–Festucetosum rupicolae Zólyomi ex Soó 1964 association.
5. (P): Within the SZ area, this site served as the resting place for Hungarian Grey cattle. Its ecological classification in 2020 and 2022 corresponded to a degraded state of the Cynodonti–Poetum angustifoliae Rapaics ex Soó 1957 association. However, the resting site was discontinued in 2022, and the grazing animals no longer used this location for resting. This allowed us to analyse its regeneration over the two-year period.
In addition to analysing vegetation dynamics, satellite-derived vegetation indices were used to evaluate the effects of environmental variability. The synthesized use of these remote sensing indices has been proven beneficial in evaluating specific ecological conditions and predicting responses to environmental stressors. For instance, NDWI can highlight areas of altered water availability which may affect overall vegetation growth, while NDVI can reveal how these changes impact biodiversity and ecosystem health [44].
We used Sentinel-2 MSI imagery exclusively for the vegetation analyses. Preprocessing was performed with the Sen2Cor algorithm, which applies atmospheric correction and provides surface reflectance values [45,46]. Cloud and shadow masking was carried out using the Scene Classification Layer (SCL) included in Sentinel-2 products, ensuring that only cloud-free pixels were used [47]. For temporal consistency, we selected images from the spring phenological phase (April–May), when vegetation is highly sensitive to water availability and climatic extremes. This period enabled reliable comparison between years and the detection of vegetation responses to precipitation–temperature variability [48]. The study applied the NDVI (Normalized Difference Vegetation Index) and NDWI (Normalized Difference Water Index):
NDVI = (NIR − RED)/(NIR + RED) (Sentinel 2 B8 = NIR; B4 = RED)
NDWI = (NIR − SWIR)/(NIR + SWIR) (Sentinel 2B8 = NIR; B11 = SWIR)
NDWI is particularly suitable for detecting near-surface water content, as it is sensitive to water presence in vegetation and soils, especially during flood or drought conditions. It complements NDVI by providing additional insights into plant water status and environmental stress [49,50,51].
For the NDVI vegetation index, a green-to-red colour scale was applied, where higher pixel values correspond to increased biological activity (Figure 2). The analysis spans from 2020 onwards, with noticeable annual variations in vegetation vigor, according to differences in precipitation levels. The driest year within the dataset was 2020, marked by dominant red hues that indicated minimal biological activity. In contrast, 2025 —the wettest year—exhibited the highest NDVI values, with large areas covered in green tones, signifying robust vegetation growth.
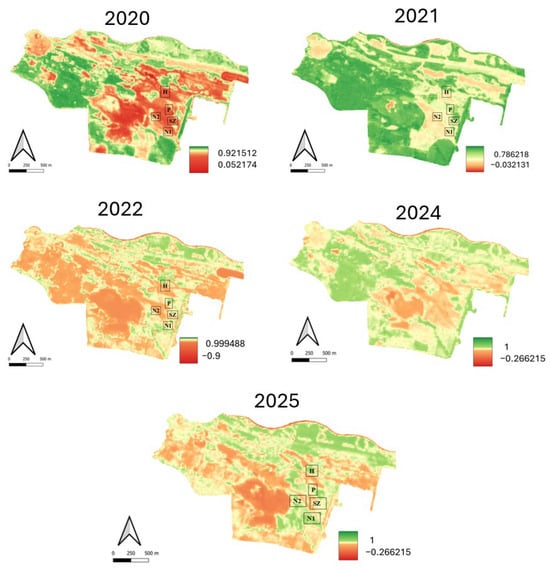
Figure 2.
The Ipoly Valley study area and sample areas coloured according to NDVI values in the study years (2020–2025.) N1—semi-wet sandy grassland, N2—dry sandy grassland 2, SZ—cattle pasture, P—cattle resting place, H—dry sandy grassland dominated by Corynephorus canescens.
NDWI effectively tracks vegetation responses to variations in water availability, both under dry and wet conditions. Used together, NDVI and NDWI offer a more complete understanding of vegetation structure and condition: while NDVI reflects plant cover and activity, NDWI reveals moisture-related stress. Combined, these indices provide a detailed picture of spatial and temporal vegetation changes, making them valuable tools in conservation and sustainable land management [52,53].
The NDWI demonstrated high efficiency in identifying drought conditions: elevated NDWI values (depicted as blue pixels) correspond to high vegetation water content, whereas diminished values (red pixels) signify low water content. Water stress manifests as a reduction in NDWI values (Figure 3). The NDWI-derived satellite image for 2025 reveals that water scarcity was most pronounced during the early part of the study period (2020–2022). Although there was a modest improvement in moisture availability in 2024 relative to 2022, the increase was not substantial (Figure 3, 2022).
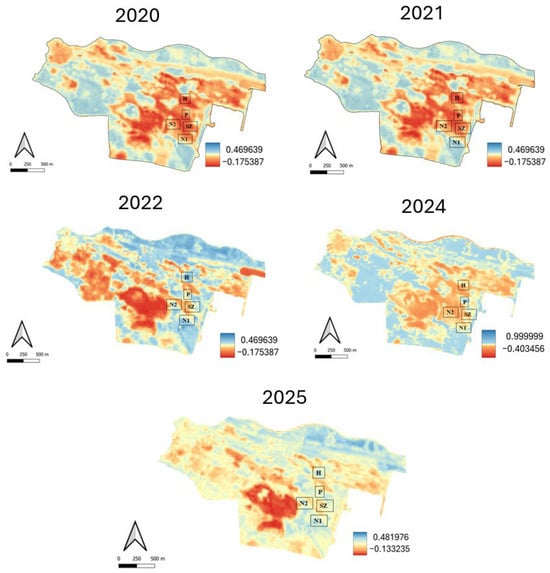
Figure 3.
The Ipoly Valley study area and the sample areas coloured according to NDWI values in the study years (2020–2025). N1—semi-wet sandy grassland, N2—dry sandy grassland 2, SZ—cattle pasture, P—cattle resting place, H—dry sandy grassland dominated by Corynephorus canescens.
2.3. Methods
To explore vegetation patterns, three complementary multivariate methods were applied: Principal Component Analysis (PCA), Detrended Correspondence Analysis (DCA), and the Additive Main effects and Multiplicative Interaction (AMMI) model. PCA is a linear ordination technique that reduces dimensionality by summarizing variance among vegetation indices (NDVI, NDWI) into principal components, allowing identification of gradients in vegetation productivity and water balance [54]. DCA, a unimodal ordination method, is suitable for ecological community data where species responses to gradients are nonlinear; it corrects for the arch effect observed in Correspondence Analysis [55]. Axis lengths in standard deviation units provide an indication of ecological gradient lengths.
The AMMI model, although more common in agronomy, has been increasingly applied in ecology to partition environmental vs. site-specific effects [56,57,58]. It combines ANOVA with PCA to separate additive main effects (year/site) from multiplicative interaction effects (year × habitat), providing insight into how vegetation responses differ across climatic extremes [59]. In our analysis, habitat categories were treated as “genotypes” and years as “environments.” The significance of the ENV, GEN, and ENV × GEN terms was evaluated using F-tests in the ANOVA step.
Following ANOVA decomposition, the interaction matrix was subjected to PCA to obtain interaction principal components (IPCs). The significance of each IPC was assessed using Gollob’s F-test, and only statistically significant components (p < 0.05) were retained for interpretation. Model residuals were examined using Q–Q plots and residual-versus-fitted plots, which showed no substantial deviations from normality or homoscedasticity. Eigenvalues and the percentage of interaction variance explained by the IPCs are reported in the Results.
PCA and DCA were performed with the vegan R package 4.5.1 using species cover and NDVI/NDWI datasets [60]. For DCA, detrending by segments was applied and rare species were down-weighted. The AMMI framework thus complemented PCA and DCA by quantifying how habitat types differentially responded to the contrasting climatic conditions of the study years. R package, using species cover and NDVI/NDWI datasets. Eigenvalues and % variance explained for the first two axes are reported in the Results. For DCA, detrending by segments was used and rare species down-weighted. For AMMI, habitat categories were treated as “genotypes” and years as “environments”; significance was tested by F-tests, and variance explained by the first two interaction PCs is reported. These three methods were chosen because they are complementary: PCA summarizes continuous vegetation indices (NDVI and NDWI), DCA captures compositional differences in species data, while AMMI disentangles how habitats (as functional vegetation units) interact with different climatic years. Together they provide a robust, multi-perspective understanding of grassland responses to climate extremes.
The coenological surveys were carried out with 5 random 2 × 2 m squares in each grassland types, recording the cover values in percentage based on the Braun-Blanquet method [61]. The species names follow the nomenclature of Király [62]. The vegetation were assessed according to the Borhidi’s [63] relative water demand and relative nitrogen demand.
For the analysis on the species coverage, the non-parametric Kruskal–Wallis test (α = 0.05) was used. In the case where the Kruskal–Wallis test was significant, the non-parametric Dunn’s test with Bonferroni corrections was performed for multiple pairwise comparisons. The statistical analyses were performed using the XLSTAT statistical and data analysis solution software version 2025.1.3 [64].
3. Results
3.1. Precipitation Data
Considering the meteorological data (Figure 4), the years 2020 and 2025 were selected for detailed analysis. The figure illustrates cumulative precipitation over the 10 days preceding the surveys. For broader context, data from the years 2020, 2022, and 2024 were also included to reflect variability. Between 2020 and 2024, precipitation levels remained relatively low and stable, with 2020 showing the lowest value. In contrast, 2021 exhibited a sharp increase—more than triple the 2020 value—while 2025 showed a remarkable peak. These fluctuations suggest notable changes in short-term rainfall patterns, justifying the selection of the extreme years for further analysis.
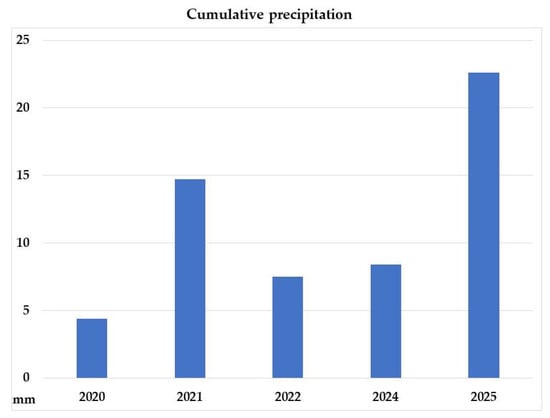
Figure 4.
Cumulative precipitation in the 10 days preceding the recording based on data from the National Meteorological Service, Hungary (OMSZ).
3.2. Principal Component Analysis (PCA) in Relation to Habitat Types and Vegetation Indices
The aim of principal component analysis (PCA) (Figure 5) is to identify structured patterns among variables while reducing data dimensionality, preserving as much variance as possible. In this case, the PCA performed on NDVI and NDWI values projects the sampling sites along two principal axes, with colours representing the different habitat categories (H, N1, N2, P, and SZ). The first principal component (PC1), which explains 68.5% of the total variance, effectively separates the habitat types. The N1 and N2 areas, characterized by positive PC1 values, are clearly distinguished from the H, P, and SZ sites, which fall into the negative PC1 range. This indicates that, based on the NDVI–NDWI combination, the N1 and N2 sites have structurally distinct vegetation and water balance characteristics compared to the other areas. The second component (PC2), explaining 15.1% of the variance, captures within-category variability. For example, the N2 group is primarily dispersed along the horizontal axis, suggesting internal structural homogeneity. In contrast, the N1 samples show greater dispersion along PC2, in addition to their positive PC1 values, indicating that this grazed, relatively mesic sandy grassland responds more variably to environmental conditions across different years. Samples from the P category cluster clearly in the lower-left quadrant, with negative values on both PC1 and PC2. Sample P_10 (PC1 = −4.06/PC2 = 1.12) occupies the most extreme position, indicating a highly degraded state with significant water loss. H-category samples also fall within the negative PC1 range, but show greater vertical dispersion along PC2, likely reflecting microclimatic heterogeneity within the pioneer sandy grassland type. The SZ category holds a particularly interesting position in the PCA space. Although three samples (P, H, SZ) lie to the left, their placement is transitional along the other axe. This supports the interpretation that steppe meadows exhibit intermediate vegetation and water balance characteristics: partially degraded, but with higher regeneration potential than the P sites. The N2 samples with positive PC1 values are tightly clustered—for example, N2_24 (PC1 = 4.55) and N2_23 (PC1 = 3.86)—indicating homogeneity within this formerly mown, now grazed habitat with balanced vegetation structure. N1 samples also appear in the positive PC1 range but display a more scattered pattern along PC2 (e.g., N1_25 = 1.99/1.89 and N1_30 = 2.00/1.25), reflecting greater interannual variability in vegetation dynamics.
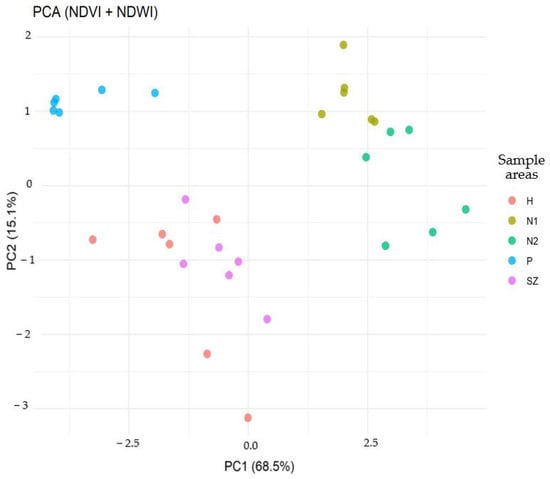
Figure 5.
Sample areas and vegetation indices in PCA analysis.
3.3. Result of Detrended Correspondence Analysis (DCA)
The results of the detrended correspondence analysis (DCA) serve to visually explore the ecological differences between grassland sites, particularly in relation to vegetation structure and spatial distribution. The ordination diagram, based on the first two DCA axes, illustrates both separation and overlap among the sampling sites, where each point represents a vegetation sample and colours correspond to vegetation categories (H, N1, N2, P, SZ) (Figure 6). Along the DCA1 axis, a clear east–west separation is evident: N1 and N2 categories cluster in the negative domain, while P, H, and SZ samples appear in the positive domain. This distribution suggests that the vegetation composition of N1 and N2 sample areas differs markedly from the others, likely due to microclimatic conditions and land-use history (e.g., past mowing, current grazing). The N1 samples, for instance, are clearly shifted to the left, with DCA1 values ranging between −0.046 and −0.029, indicating a relatively homogeneous but distinct vegetation structure. N2 samples are also separated in the lower-left quadrant. Some of them (e.g., N2_20 with a DCA2 value of 0.0705) exhibit higher positions along the vertical axis, while others (e.g., N2_22) are located closer to the origin, possibly indicating transitional communities between dry and mesic habitat types. H category samples are positioned in the positive domain of the DCA1 axis, typically ranging from 0.0139 to 0.0461, clearly distinct from the N1 and N2 samples. A similar pattern is observed for the P category, though these samples are more narrowly distributed along the DCA2 axis. The P samples form a relatively compact cluster, indicating ecological similarity—likely due to repeated trampling, soil compaction, and the dominance of disturbance-tolerant species in this resting area. SZ (steppe meadow and pasture) samples are generally located in the central region of the ordination space, slightly shifted rightward and downward. This intermediate position suggests a transitional ecological status, showing partial overlap with H and P categories while maintaining unique and distinguishable structural characteristics. Two SZ samples—particularly samples 14 and 24—exhibit positive DCA2 values, which may indicate more dynamic species turnover or transitional community structure.
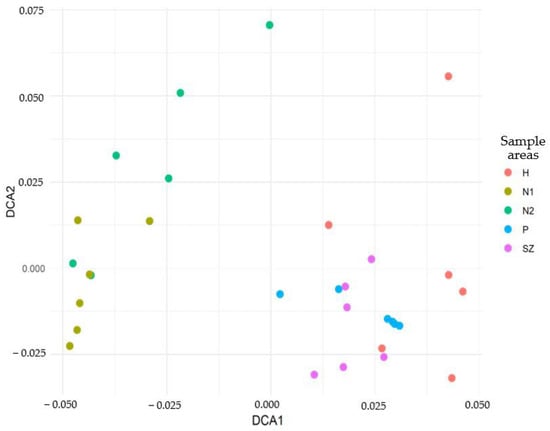
Figure 6.
Sample areas and vegetation indices in DCA analysis.
3.4. Result of AMMI Modell (Additive Main Effects and Multiplicative Interaction)
The AMMI model (Additive Main Effects and Multiplicative Interaction) evaluates the relative contributions of the environment (ENV), genotype or category (GEN), and their interaction (ENV × GEN) within a unified statistical framework (Figure 7). The complete AMMI ANOVA table and the decomposition of the interaction term into significant IPCs are presented in Table 1. The approach integrates the additive decomposition of analysis of variance (ANOVA) with the multiplicative structure of principal component analysis (PCA), enabling the identification of both main effects and interaction-driven response patterns. This makes AMMI particularly effective for datasets in which environmental variability and habitat-specific responses jointly shape the observed ecological traits.
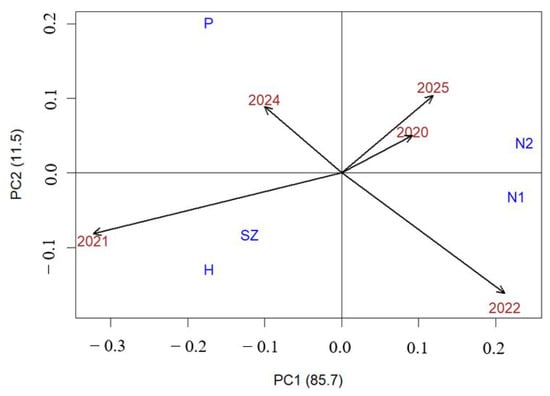
Figure 7.
Sample areas and vegetation indices in AMMI model.

Table 1.
AMMI ANOVA and interaction PCA decomposition for response variable Y.
According to the ANOVA results, the environmental effect (ENV) was overwhelmingly dominant (F(4,100) = 879.70, p < 0.001), indicating that the studied vegetation index (Y) was strongly and consistently influenced by differences among years. This reflects the substantial climatic variability across the sampling period. Genotypic or habitat-category differences (GEN) were also highly significant (F(4,100) = 73.31, p < 0.001), demonstrating that vegetation functional groups differ markedly in their baseline behaviour. Most importantly, the ENV × GEN interaction was strongly significant (F(16,100) = 20.03, p < 0.001), confirming that the relative performance of vegetation categories was not consistent across years. In other words, each habitat type responded differently under contrasting environmental conditions, and no habitat exhibited uniformly stable behaviour across all years.
To gain insight into the structure of this interaction, the ENV × GEN term was decomposed by PCA. The eigenvalue decomposition revealed that the first two interaction principal components (IPC1 and IPC2) accounted for 97.3% of the total interaction variance, with IPC1 explaining 85.7% and IPC2 an additional 11.5%. This indicates that the overwhelming majority of the year × habitat response pattern can be represented in a two-dimensional AMMI biplot, providing a robust basis for interpretation. Significance testing of interaction components (Gollob’s F-test) further confirmed that IPC1 and IPC2 were highly significant, whereas IPC3 contributed only marginally (2.7%) and IPC4 was not significant, supporting the decision to focus interpretation on the first two dimensions.
The AMMI biplot illustrates the differential responses across years. The year 2022 occupies a prominent position in the positive region of IPC1, indicating that it contributed disproportionately to the interaction structure. This suggests that 2022 represented an ecologically extreme or highly distinctive year—typically associated with severe drought or other anomalous climatic conditions—but nonetheless exerted a strong influence on vegetation behaviour. In contrast, 2021 appears in the negative range of both IPC1 and IPC2 and emerges as the most adverse environmental setting in the model. Its position indicates that vegetation dynamics that year were shaped by particularly unfavourable ecological circumstances, producing response patterns markedly different from those in 2022.
The years 2020 and 2025, situated in the positive IPC1 region but with moderate IPC2 values, represent more balanced climatic conditions. Their intermediate placement suggests that although these years deviated from the long-term average, they did not generate as extreme vegetation responses as 2021 or 2022. The position of 2023, which lies closer to the origin, indicates a year more representative of mean environmental conditions, exerting a weaker influence on the interaction structure.
The vegetation categories (treated as “genotypes”) are shown in blue on the biplot (N1, N2, H, P, SZ). The N2 and N1 categories occupy positive IPC1 values close to the vectors associated with 2020, 2022, and 2025, indicating that these habitats responded favourably in relatively productive or ecologically advantageous years. Their grouping suggests a shared sensitivity to favourable environmental conditions, with amplified vegetation index responses in wetter or otherwise beneficial periods.
By contrast, the SZ, H, and especially P habitat categories cluster on the negative side of IPC1 and IPC2. Their position indicates greater stability but generally poorer performance relative to N1 and N2, particularly under more challenging climatic conditions. The P category’s close proximity to 2021 implies that it coped comparatively better during this negative or ecologically stressed year, possibly due to its vegetation structure or species composition being more tolerant of adverse conditions. Thus, the substantial ENV × GEN interaction highlights the need to interpret vegetation dynamics in terms of both year effects and habitat characteristics rather than considering either factor alone.
3.5. Results of Vegetation Changes
Across the three study periods, the different vegetation types exhibited distinct responses, yet changes occurred in all cases. The most stable vegetation was the ungrazed sandy grassland (H). By 2022, total cover had increased by 5%, but by 2025 it had returned to a similarly low cover level as observed at the starting point in 2020. In the mesophilous area (N1), the proportion of tall grasses increased. In the drier N2 stands, cover values rose steadily, whereas in the wetter N1 plots cover declined by 2022, then reached its highest levels by 2025. The following species became dominant: Alopecurus pratensis, Dactylis glomerata, and Arrhenatherum elatius. In wetter years, Agrostis tenuis also showed increased cover. During drier years, Cynodon dactylon generally increased, becoming dominant in 2020 and 2022 in the former resting site (P). Its abundance declined by 2025, indicating grassland regeneration.
Figure 8 shows the development of four groups of species occurring in the sample areas. Overall, it can be concluded that the cover patterns show characteristic patterns. Based on the species groups and cover values, grass species have the highest proportion, followed by disturbance-tolerant species, then Fabaceae species and weed species. Part “A” of Figure 8 shows the distribution of grasses (average coverage (%)). In two sample areas, the distribution was similar, not significantly different in the sandy pasture (H) and the gray cattle pasture (Sz) during the three years studied. There were large significant differences in the N2 (2022) and N2 (2025) pastures, higher values were recorded in 2025. Part “B” of Figure 8 shows the distribution of Fabaceae species. High coverage values were recorded only in the Charolais pasture, also in 2025. Figure 8 “C” shows the distribution of weeds. There was an even distribution in the sandy grassland (H) and the gray cattle pasture (Sz). In the N1 area, in the fresher part of the area, their coverage was exceptionally high in 2022 and 2025. However, there was no significant difference between the years 2020, with a lower average coverage value, and 2022 and 2025, with a higher average coverage value. The highest values were in the resting, degraded stock (P) in 2020 and 2022, then by 2025 their proportion had significantly decreased to around 2%. In part “D” of Figure 8, the distribution of disturbance-tolerant species was similar to that of weeds, only with higher values.
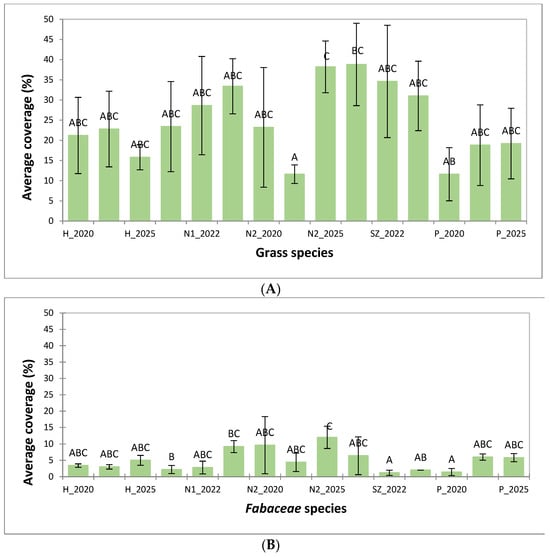
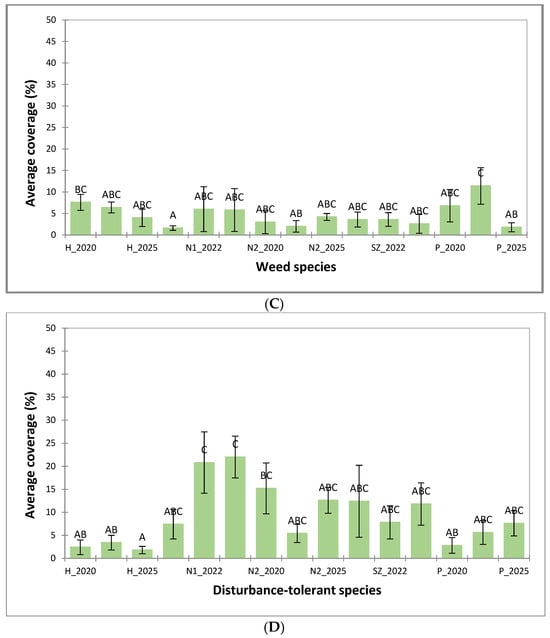
Figure 8.
Distribution of species groups important from a grassland management and nature conservation perspective in the sample areas ((A). Grass species; (B): Fabaceae species; (C): Weed species, (D): Disturbance-tolerant species). Based on statistical evaluation—Kruskal–Wallis test and Dunn’s post hoc test with Bonferroni correction—mean, standard deviation and letter codes for homogeneous and heterogeneous groups.
Between 2020 and 2025, changes in species composition and vegetation structure closely followed interannual climatic variability, as confirmed by both coenological observations and remote sensing data (NDVI, NDWI). The year 2022—identified by NDWI as having the lowest water availability yet showing the highest NDVI values—resulted in the expansion of drought-tolerant species across all study areas. Notably, the cover of Agropyron repens, Koeleria cristata, Festuca pseudovina, and Cynodon dactylon increased substantially, particularly in the N1 and N2 sites. In these areas, previous mowing and current grazing practices had created more open vegetation structures that favoured the dominance of such species. In the SZ steppe meadow grazed by Hungarian grey cattle and in the sandy open grasslands (H), the cover of Stipa borysthenica also increased. Due to the increased pressure caused by trampling, creeping species with strong regenerative capacity—such as Cynodon dactylon and Trifolium repens—gained more ground. Similarly, species with basal rosettes, such as Plantago lanceolata, increased in abundance, as they are well adapted to disturbed, open-surface microhabitats. The proliferation of disturbance-tolerant, spiny species such as Ononis spinosa and Eryngium campestre was also observed.
The DCA ordination emphasizes the ecological distance between formerly mown–now grazed mesic grasslands (N1, N2) and degraded or pioneer sandy sites (P, H). Underlying soil moisture gradients and land-use legacy is reflected in this pattern, consistent with the ecological theory that disturbance and hydrological conditions jointly shape species composition. The AMMI analysis, although rarely applied in vegetation ecology, provided additional insights by explicitly quantifying year × habitat interactions. The strong ENV × GEN interaction indicates that vegetation responses are not static but contingent on climatic conditions. Years 2022 and 2021 emerged as “extreme environments” driving much of the variance, confirming that drought and cold–wet conditions create non-linear vegetation responses. Thus, AMMI highlights the need for climate-responsive management strategies in grasslands.
The PCA ordination highlights distinct ecological mechanisms. The positive PC1 grouping of N1 and N2 reflects their mesic conditions and grazing history, which favour opportunistic species with high NDVI in wet years but also rapid response during a drought (e.g., Elymus repens, Cynodon dactylon). Negative PC1 habitats (H, P, SZ) represent drier or more degraded systems where vegetation response is less plastic. The strong clustering of N2 suggests stable community structure maintained by grazing-induced homogenization, whereas wider scatter of N1 indicates greater interannual variability and sensitivity to short-term climatic fluctuations. The PCA based on NDVI and NDWI clearly distinguished habitat types: N1 and N2 exhibited more dynamic vegetation with greater responsiveness to stress, while H and SZ represented more stable, less reactive systems. These results illustrate the differing resilience and response capacities of sandy grassland habitats in the face of prevailing climatic extremes.
The relative ecological indicator values of species clearly reflected the differing precipitation conditions of 2020–2022 and 2025 (Figure 9). In the open sandy, ungrazed site (H), vegetation changed very little, and total cover did not vary significantly. In the grazed areas, cover values generally decreased in 2022 and increased again by 2025. Among all sample sites, the N1 Charolais pasture showed the highest grassland cover and, correspondingly, the greatest abundance of species with high relative moisture demands (NW 7–9), reaching a maximum in 2025. These wetter stands also contained the largest average proportion of species indicating fresh, mesic habitat conditions. Mean values increased across all examined stands by 2025. The sandy grassland (H) consistently had the lowest values (2.5) in all three study years. The cattle resting site (P) showed somewhat higher values (3). Among the three grazing areas, the Hungarian Grey cattle pasture (SZ) had lower values (3.3). In the more mesic pastures, mean values exceeded 4, with the highest values recorded in the N1 sample area.
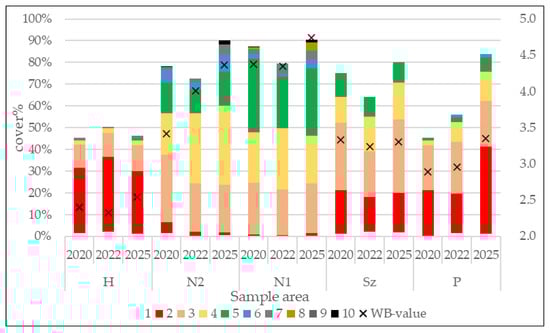
Figure 9.
Distribution of species according to their relative ecological indicator values across the surveyed sample sites. 1: Plants of extremely dry habitats, 2: Xero-indicators on habitats with long dry period, 3: Xero-tolerants but eventually occurring on fresh soils, 4: Plant of semi dry habitats, 5: Plants of semihumid habitats, 6: Plants of fresh soils, 7: Plants of moist soils not drying out and well aerated, 8: Plants of moist soils tolerating sort floods, 9: Plants of wet, not well aerated soils, 10: Plants of frequently flooded soils, WB-value: relative soil moisture indicator value.
4. Discussion
The present study confirms that Sentinel-2A satellite imagery is an effective tool for monitoring vegetation dynamics in dry grassland ecosystems, even at fine spatial and temporal scales. Our findings corroborate earlier research [30,36,65,66], which demonstrated that habitat patches previously considered homogeneous can exhibit substantial spatial variability driven by microclimatic and management-related factors. In particular, 2022 emerged as a critical year, characterized by extreme drought (low NDWI) and, paradoxically, high NDVI values in the grazed areas (N1, N2), indicating a rapid yet stress-induced vegetation response [67,68,69]. These patterns align with previous observations that short-term precipitation preceding field surveys exerts strong predictive influence, while the legacy effects of prior droughts also shape current vegetation states [36,47].
Our results further confirm that the vegetation of sandy grasslands is highly sensitive to fluctuations in soil moisture, as evidenced by both PCA ordinations and species-level responses, which also correspond with international findings and biomass patterns [9]. The increase in drought-tolerant and disturbance-adapted species (e.g., Cynodon dactylon, Trifolium repens, Plantago lanceolata) under grazing pressure—particularly in 2022—reflects shifts in competitive dynamics driven by water scarcity and biomass removal. This outcome is consistent with earlier studies identifying soil moisture as a key determinant of species composition, plant height, rooting depth, and drought tolerance [28,47,70].
Differences in vegetation responses across the study sites—such as the relative stability of H and SZ compared with the more dynamic N1 and N2—underscore the strong interactions between management history, topographic position, and climatic factors. Our findings align with the broader ecological understanding that soil-moisture patterns influence not only local plant responses, but also landscape-level diversity and ecosystem functioning [71]. The AMMI analysis, although rarely applied in vegetation ecology [57,58], provided additional insights by explicitly quantifying year × habitat interactions. The strong ENV × GEN interaction indicates that vegetation responses are not static but contingent on climatic conditions. Years 2022 and 2021 emerged as ‘extreme environments’ driving much of the variance, confirming that drought and cold–wet conditions create non-linear vegetation responses. Thus, AMMI highlights the need for climate-responsive management strategies in grasslands.
As demonstrated in floodplain systems as well [40,52,72,73], spatial and temporal variation in water av67ailability can promote niche differentiation, species coexistence, and ecological resilience. Although our study area does not include true wetland habitats, detectable vegetation changes associated with moisture availability were observed even on higher-lying sandy sites, reflecting mechanisms similar to those described in riparian and fen ecosystems. From a management perspective, our results reinforce the importance of balanced grazing regimes in sandy grasslands [62,67,74]. While moderate cattle grazing can maintain species diversity and suppress the dominance of tall grasses, overgrazing leads to soil compaction, vegetation degradation, and an elevated risk of invasive species spread. Conversely, once intensive use ceases, natural grassland regeneration can occur rapidly—as demonstrated by the two-year recovery observed in our study.
5. Conclusions
The combined use of Sentinel-2A satellite imagery and phytosociological field surveys proved effective for accurately monitoring the condition of natural vegetation. The NDVI and NDWI time series revealed substantial interannual climatic variability—primarily associated with fluctuations in precipitation—which was also reflected in the distribution of species’ relative indicator values within the different vegetation types. However, statistically significant differences in vegetation structure were detected only in the plot (P) that had previously served as a livestock resting area and subsequently underwent regeneration. Changes in species dominance patterns were also observed in the grazed areas (N1, N2, and SZ), emphasizing that grazing intensity must be reduced during drought periods in order to maintain the integrity and ecological functioning of dry grasslands.
Vegetation responses were complex and strongly habitat dependent. Consequently, effective conservation management must account for the differing sensitivities of habitat types and their interactions with climatic factors. We recommend that maximum grazing intensity in sandy grasslands should not exceed 0.4 livestock units per hectare during dry years and should range between 0.5 and 1 in wetter years. In moister habitats, appropriate grazing intensities are approximately 0.5 in dry years and 1–1.5 in wet years. The findings clearly demonstrate that preserving the ecological stability of sandy grasslands requires flexible and adaptive management strategies.
The comprehensive statistical analyses—including multi-year comparisons of NDVI and NDWI indices as well as PCA, DCA, and AMMI models—consistently showed that grassland condition is shaped primarily by two key drivers: the climatic characteristics of individual years and the specific land-use practices applied at each site. NDVI effectively captured interannual variation in vegetation activity and biomass, whereas NDWI sensitively reflected short-term anomalies in water balance, particularly during drought. Grazed and more mesophilic categories—especially N1 and N2—were characterized not only by higher biomass but also by more favorable moisture conditions, especially in wetter years. These areas were clearly distinguishable in multivariate analyses, exhibited structural homogeneity, and showed the highest adaptive capacity. By contrast, more degraded and livestock resting areas (such as P and, to some degree, H) consistently exhibited lower NDVI and NDWI values irrespective of annual climatic variability. The year × category interactions identified in this study further confirm that grazing-management decisions should be aligned with prevailing climatic conditions rather than being static. Future refinement of these results may be achieved through expanded analyses of climatic variability and long-term time series from representative sampling locations. Grassland systems that can respond flexibly to climatic extremes appear to perform best. Thus, the findings are not only scientifically relevant but also provide practical guidance for nature-based grassland management, ecological landscape planning, and strategic climate adaptation.
Regarding the central question of whether grazing or climatic change exerts the stronger influence—and thus which factor induces more rapid vegetation change—the results clearly indicate that grazing, particularly intensive grazing and physical disturbance, has the greater impact. This is corroborated by the regeneration trajectory of the abandoned and severely degraded livestock resting area. At the same time, the data also confirm that the site was suitable for detecting vegetation changes driven by climatic variability.
Author Contributions
Conceptualization, K.P., S.S. and Z.W.; methodology, K.P. and S.S.; software, P.P., L.S. (László Sipos) and Z.W.; formal analysis, T.S.-S. and E.S.-F.; investigation, K.P., E.S.-F., S.S. and I.T.-J.; writing—original draft preparation, K.P., E.S.-F., I.T.-J., S.S., L.S. (Leonárd Sári), G.F. and Z.K.; writing—review and editing, I.T.-J., G.P.K., K.P. and E.S.-F.; supervision, S.S. and K.P.; funding acquisition, K.P. and G.P.K.; All authors have read and agreed to the published version of the manuscript.
Funding
This study was supported by OTKA K-147342, the strategic research fund of the University of Veterinary Medicine Budapest (Grant No. SRF-002) and the Research Excellence Programme of the Hungarian University of Agriculture and Life Sciences.
Data Availability Statement
The raw data supporting the conclusions of this article will be made available by the authors on request.
Conflicts of Interest
Author Péter Penksza was employed by the company Anton Paar Hungary. The remaining author declare that the research was conducted in the absence of any commercial or financial relationships that could be construed as a potential conflict of interest.
References
- IPPC. Climate Change 2023: Synthesis Report. Contribution of Working Groups I, II and III to the Sixth Assessment Report of the Intergovernmental Panel on Climate Change; IPCC: Geneva, Switzerland, 2023; p. 184. [Google Scholar]
- Bartholy, J.; Pongrácz, R.; Pieczka, I. How the Climate Will Change in This Century? Hung. Geogr. Bull. 2014, 63, 55–67. [Google Scholar] [CrossRef]
- Bartholy, J.; Pongracz, R.; Torma, C.; Pieczka, I.; Kardos, P.; Hunyady, A. Analysis of Regional Climate Change Modelling Experiments for the Carpathian Basin. Int. J. Glob. Warm. 2009, 1, 238–252. [Google Scholar] [CrossRef]
- Anav, A.; Mariotti, A. Sensitivity of Natural Vegetation to Climate Change in the Euro-Mediterranean Area. Clim. Res. 2011, 46, 277–292. [Google Scholar] [CrossRef]
- Blauhut, V.; Stoelzle, M.; Ahopelto, L.; Brunner, M.I.; Teutschbein, C.; Wendt, D.E.; Akstinas, V.; Bakke, S.J.; Barker, L.J.; Bartošová, L.; et al. Lessons from the 2018–2019 European Droughts: A Collective Need for Unifying Drought Risk Management. Nat. Hazards Earth Syst. Sci. 2022, 22, 2201–2217. [Google Scholar] [CrossRef]
- Reinelt, L.; Whitaker, J.; Kazakou, E.; Bonnal, L.; Bastianelli, D.; Bullock, J.M.; Ostle, N.J. Drought Effects on Root and Shoot Traits and Their Decomposability. Funct. Ecol. 2023, 37, 1044–1054. [Google Scholar] [CrossRef]
- Davidson, N.C. How Much Wetland Has the World Lost? Long-Term and Recent Trends in Global Wetland Area. Mar. Freshw. Res. 2014, 65, 934–941. [Google Scholar] [CrossRef]
- Clavero, M.; Franch, N.; López, V.; Pou-Rovira, Q.; Queral, J. Native and Non-Native Fish across Aquatic Habitats in the Ebro Delta. Fishes Mediterr. Environ. 2021. [Google Scholar] [CrossRef]
- Čížková, H.; Květ, J.; Comín, F.A.; Laiho, R.; Pokorný, J.; Pithart, D. Actual State of European Wetlands and Their Possible Future in the Context of Global Climate Change. Aquat. Sci. 2013, 75, 3–26. [Google Scholar] [CrossRef]
- Väli, Ü.; Dombrovski, V.; Treinys, R.; Bergmanis, U.; Daróczi, S.J.; Dravecky, M.; Ivanovski, V.; Lontowski, J.; Maciorowski, G.; Meyburg, B.-U.; et al. Widespread Hybridization between the Greater Spotted Eagle Aquila Clanga and the Lesser Spotted Eagle Aquila Pomarina (Aves: Accipitriformes) in Europe. Biol. J. Linn. Soc. 2010, 100, 725–736. [Google Scholar] [CrossRef]
- Dawson, L.; Elbakidze, M.; Schellens, M.; Shkaruba, A.; Angelstam, P. Bogs, Birds, and Berries in Belarus: The Governance and Management Dynamics of Wetland Restoration in a State-Centric, Top-down Context. Ecol. Soc. 2021, 26. [Google Scholar] [CrossRef]
- Albert, K.R.; Ro-Poulsen, H.; Mikkelsen, T.N.; Michelsen, A.; Van Der Linden, L.; Beier, C. Effects of Elevated CO2, Warming and Drought Episodes on Plant Carbon Uptake in a Temperate Heath Ecosystem Are Controlled by Soil Water Status. Plant Cell Environ. 2011, 34, 1207–1222. [Google Scholar] [CrossRef] [PubMed]
- Zhang, Y.; Li, H.; Zhang, S. Study on Multiple Cropping Index of North China Plain Based on LAI Time Series. In Proceedings of the Second International Conference on Environmental Remote Sensing and Geographic Information Technology (ERSGIT 2023), Xi’an, China, 10–12 November 2023; SPIE: Washington, DC, USA, 2024; Volume 12988, pp. 83–92. [Google Scholar]
- Wang, Y.; Shen, X.; Tong, S.; Zhang, M.; Jiang, M.; Lu, X. Aboveground Biomass of Wetland Vegetation Under Climate Change in the Western Songnen Plain. Front. Plant Sci. 2022, 13, 941689. [Google Scholar] [CrossRef]
- Li, Y.; Wu, D.; Yang, L.; Zhou, T. Declining Effect of Precipitation on the Normalized Difference Vegetation Index of Grasslands in the Inner Mongolian Plateau, 1982–2010. Appl. Sci. 2021, 11, 8766. [Google Scholar] [CrossRef]
- Zhao, Q.; Ma, X.; Liang, L.; Yao, W. Spatial–Temporal Variation Characteristics of Multiple Meteorological Variables and Vegetation over the Loess Plateau Region. Appl. Sci. 2020, 10, 1000. [Google Scholar] [CrossRef]
- Toth, K.; Milics, G.; Fűrész, E.; Nagy, A.; Amariel, D. Integrated System for Precision Agriculture through Aerial Remote Sensing and Soil Characterization: A Case Study In Hungary. Int. J. Eng. Manag. Humanit. 2024, 5, 45–51. [Google Scholar]
- Sári-Barnácz, F.E.; Zalai, M.; Milics, G.; Tóthné Kun, M.; Mészáros, J.; Árvai, M.; Kiss, J. Monitoring Helicoverpa armigera Damage with PRISMA Hyperspectral Imagery: First Experience in Maize and Comparison with Sentinel-2 Imagery. Remote Sens. 2024, 16, 3235. [Google Scholar] [CrossRef]
- Zsebő, S.; Bede, L.; Kukorelli, G.; Kulmány, I.M.; Milics, G.; Stencinger, D.; Teschner, G.; Varga, Z.; Vona, V.; Kovács, A.J. Yield Prediction Using NDVI Values from GreenSeeker and MicaSense Cameras at Different Stages of Winter Wheat Phenology. Drones 2024, 8, 88. [Google Scholar] [CrossRef]
- Šupčík, A.; Milics, G.; Matečný, I. Predicting Grape Yield with Vine Canopy Morphology Analysis from 3D Point Clouds Generated by UAV Imagery. Drones 2024, 8, 216. [Google Scholar] [CrossRef]
- Pellegrini, P.; Cossani, C.M.; Di Bella, C.M.; Piñeiro, G.; Sadras, V.O.; Oesterheld, M. Simple regression models to estimate light interception in wheat crops with Sentinel-2 and a handheld sensor. Crop Sci. 2020, 60, 1607–1616. [Google Scholar] [CrossRef]
- Bűdi, K.; Bűdi, A.; Tarcsi, Á.; Milics, G. Variable Rate Seeding and Accuracy of Within-Field Hybrid Switching in Maize (Zea mays L.). Agronomy 2025, 15, 718. [Google Scholar] [CrossRef]
- Ngoune Tandzi, L.; Mutengwa, C.S. Estimation of Maize (Zea mays L.) Yield Per Harvest Area: Appropriate Methods. Agronomy 2020, 10, 29. [Google Scholar] [CrossRef]
- Sári-Barnácz, F.E.; Zalai, M.; Toepfer, S.; Milics, G.; Iványi, D.; Tóthné Kun, M.; Mészáros, J.; Árvai, M.; Kiss, J. Suitability of Satellite Imagery for Surveillance of Maize Ear Damage by Cotton Bollworm (Helicoverpa armigera) Larvae. Remote Sens. 2023, 15, 5602. [Google Scholar] [CrossRef]
- Vannoppen, A.; Gobin, A. Estimating Farm Wheat Yields from NDVI and Meteorological Data. Agronomy 2021, 11, 946. [Google Scholar] [CrossRef]
- Khodjaev, S.; Kuhn, L.; Bobojonov, I.; Glauben, T. Combining multiple UAV-Based indicators for wheat yield estimation, a case study from Germany. Eur. J. Remote Sens. 2023, 57, 2294121. [Google Scholar] [CrossRef]
- Reinermann, S.; Asam, S.; Kuenzer, C. Remote Sensing of Grassland Production and Management—A Review. Remote Sens. 2020, 12, 1949. [Google Scholar] [CrossRef]
- Chen, X.; Song, Z.; Chen, B.; Yu, W.; Dong, H. Soil Moisture Is the Key Factor Facilitating Giant Ragweed Invasions in Grasslands of the Yili Vally, China. Biology 2025, 14, 249. [Google Scholar] [CrossRef] [PubMed]
- Abdalla, M. Unveiling Innovations in Grasslands Productivity and Sustainability. Agronomy 2023, 13, 2537. [Google Scholar] [CrossRef]
- Verrasztó, Z. Környezeti monitoring vizsgálatok az Ipoly vízgyűjtőjén (célkitűzések és általános tájékoztatás). Tájökológia Lapok 2010, 8, 535–561. [Google Scholar] [CrossRef]
- Nagy, G.; Déri, E.; Lengyel, S. Irányelvek a Pannon Száraz Lösz—És Szikespuszta Gyepek Rekonstrukciójához és Természetvédelmi Szempontú Kezeléséhez; Hortobágyi Nemzeti Park Igazgatóság: Debrecen, Hungary, 2010; p. 57. [Google Scholar]
- Penksza, K.; Nagy, A.; Laborczi, A.; Pintér, B.; Házi, J. Wet Habitats along River Ipoly (Hungary) in 2000 (Extremely Dry) and 2010 (Extremely Wet). J. Maps 2012, 8, 157–164. [Google Scholar] [CrossRef]
- Mossa, J.; Chen, Y.-H.; Kondolf, G.M.; Walls, S.P. Channel and Vegetation Recovery from Dredging of a Large River in the Gulf Coastal Plain, USA. Earth Surf. Process. Landf. 2020, 45, 1926–1944. [Google Scholar] [CrossRef]
- Noe, G.B.; Hopkins, K.G.; Claggett, P.R.; Schenk, E.R.; Metes, M.J.; Ahmed, L.; Doody, T.R.; Hupp, C.R. Streambank and Floodplain Geomorphic Change and Contribution to Watershed Material Budgets. Environ. Res. Lett. 2022, 17, 064015. [Google Scholar] [CrossRef]
- Hancock, G.J.; Wilkinson, S.N.; Hawdon, A.A.; Keen, R.J. Use of Fallout Tracers 7Be, 210Pb and 137Cs to Distinguish the Form of Sub-Surface Soil Erosion Delivering Sediment to Rivers in Large Catchments. Hydrol. Process. 2014, 28, 3855–3874. [Google Scholar] [CrossRef]
- T.-Járdi, I.; Saláta, D.; S.-Falusi, E.; Kovács, G.P.; Láposi, R.; Zachar, Z.; Penksza, K. Habitat Changes along Ipoly River Valley (Hungary) in Extreme Wet and Dry Years. Water 2022, 14, 787. [Google Scholar] [CrossRef]
- Török, P.; Penksza, K.; Tóth, E.; Kelemen, A.; Sonkoly, J.; Tóthmérész, B. Vegetation Type and Grazing Intensity Jointly Shape Grazing Effects on Grassland Biodiversity. Ecol. Evol. 2018, 8, 10326–10335. [Google Scholar] [CrossRef]
- Wang, L.; Liu, H.; Liu, Y.; Li, J.; Shao, H.; Wang, W.; Liang, C. Soil Characteristic Comparison of Fenced and Grazed Riparian Floodplain Wetlands in the Typical Steppe Region of the Inner Mongolian Plateau, China. Sci. World J. 2014, 2014, 765907. [Google Scholar] [CrossRef]
- Jeffres, C.A.; Holmes, E.J.; Sommer, T.R.; Katz, J.V.E. Detrital Food Web Contributes to Aquatic Ecosystem Productivity and Rapid Salmon Growth in a Managed Floodplain. PLoS ONE 2020, 15, e0216019. [Google Scholar] [CrossRef]
- Mosner, E.; Weber, A.; Carambia, M.; Nilson, E.; Schmitz, U.; Zelle, B.; Donath, T.; Horchler, P. Climate Change and Floodplain Vegetation—Future Prospects for Riparian Habitat Availability along the Rhine River. Ecol. Eng. 2015, 82, 493–511. [Google Scholar] [CrossRef]
- Borhidi, A.; Kevey, B.; Lendvai, G. Plant Communities of Hungary; Akadémiai Kiadó: Budapest, Hungary, 2013; ISBN 978-963-05-9278-9. [Google Scholar]
- Fodor, I.; Gálosi-Kovács, B. Kárpát-Medence Határokon Átnyúló Természeti Értékei Tiszteletkötet Nagy Imre 65. Születésnapja Alkalmából; Regionális Tudományi Társaság: Szabadka, Serbia, 2019; ISBN 978-86-86929-07-5. [Google Scholar]
- Brown, A.G.; Lespez, L.; Sear, D.A.; Macaire, J.-J.; Houben, P.; Klimek, K.; Brazier, R.E.; Van Oost, K.; Pears, B. Natural vs Anthropogenic Streams in Europe: History, Ecology and Implications for Restoration, River-Rewilding and Riverine Ecosystem Services. Earth-Sci. Rev. 2018, 180, 185–205. [Google Scholar] [CrossRef]
- Bartold, M.; Wróblewski, K.; Kluczek, M.; Dąbrowska-Zielińska, K.; Goliński, P. Examining the Sensitivity of Satellite-Derived Vegetation Indices to Plant Drought Stress in Grasslands in Poland. Plants 2024, 13, 2319. [Google Scholar] [CrossRef] [PubMed]
- Louis, J.; Debaecker, V.; Pflug, B.; Main-Korn, M.; Bieniarz, J.; Mueller-Wilm, U.; Cadau, E.; Gascon, F. Sentinel-2 Sen2Cor: L2A Processor for Users. In Proceedings of the Living Planet Symposium 2016, Prague, Czech Republic, 9–13 May 2016; Volume 740, p. 91. [Google Scholar]
- Main-Knorn, M.; Pflug, B.; Louis, J.; Debaecker, V.; Müller-Wilm, U.; Gascon, F. Sen2Cor for Sentinel-2. In Proceedings of the Image and Signal Processing for Remote Sensing XXIII, Warsaw, Poland, 11–14 September 2017; SPIE: Washington, DC, USA, 2017; Volume 10427, pp. 37–48. [Google Scholar]
- Hollstein, A.; Segl, K.; Guanter, L.; Brell, M.; Enesco, M. Ready-to-Use Methods for the Detection of Clouds, Cirrus, Snow, Shadow, Water and Clear Sky Pixels in Sentinel-2 MSI Images. Remote Sens. 2016, 8, 666. [Google Scholar] [CrossRef]
- Vrieling, A.; Meroni, M.; Darvishzadeh, R.; Skidmore, A.K.; Wang, T.; Zurita-Milla, R.; Oosterbeek, K.; O’Connor, B.; Paganini, M. Vegetation Phenology from Sentinel-2 and Field Cameras for a Dutch Barrier Island. Remote Sens. Environ. 2018, 215, 517–529. [Google Scholar] [CrossRef]
- Beck, P.S.A.; Jönsson, P.; Høgda, K.-A.; Karlsen, S.R.; Eklundh, L.; Skidmore, A.K. A Ground-validated NDVI Dataset for Monitoring Vegetation Dynamics and Mapping Phenology in Fennoscandia and the Kola Peninsula. Int. J. Remote Sens. 2007, 28, 4311–4330. [Google Scholar] [CrossRef]
- Bekkema, M.E. The Potential of Sentinel-2 Data for Detecting Grassland Management Intensity to Support Monitoring of Meadow Bird Populations. Master’s Thesis, Vrije Universiteit Amsterdam, Amsterdam, The Netherlands, 2017. [Google Scholar]
- Shafroth, P.B.; Stromberg, J.C.; Patten, D.T. Riparian Vegetation Response to Altered Disturbance and Stress Regimes. Ecol. Appl. 2002, 12, 107–123. [Google Scholar] [CrossRef]
- Maier, N.; Breuer, L.; Chamorro, A.; Kraft, P.; Houska, T. Multi-Source Uncertainty Analysis in Simulating Floodplain Inundation under Climate Change. Water 2018, 10, 809. [Google Scholar] [CrossRef]
- Vicca, S.; Balzarolo, M.; Filella, I.; Granier, A.; Herbst, M.; Knohl, A.; Longdoz, B.; Mund, M.; Nagy, Z.; Pintér, K.; et al. Remotely-Sensed Detection of Effects of Extreme Droughts on Gross Primary Production. Sci. Rep. 2016, 6, 28269. [Google Scholar] [CrossRef] [PubMed]
- Legendre, P.; Legendre, L. Chapter 1—Complex Ecological Data Sets. In Numerical Ecology; Developments in Environmental Modelling; Legendre, P., Legendre, L., Eds.; Elsevier: Amsterdam, The Netherlands, 2012; Volume 24, pp. 1–57. [Google Scholar]
- Jolliffe, I.T.; Cadima, J. Principal Component Analysis: A Review and Recent Developments. Philos. Trans. R. Soc. A Math. Phys. Eng. Sci. 2016, 374, 20150202. [Google Scholar] [CrossRef]
- Bruno, C.; Balzarini, M. Comparison of additive main effect–multiplicative interaction model and factor analytic model for genotypes ordination from multi-environment trials. Agron. J. 2024, 116, 1869–1881. [Google Scholar] [CrossRef]
- Bocianowski, J.; Nowosad, K.; Rejek, D. Genotype-environment interaction for grain yield in maize (Zea mays L.) using the additive main effects and multiplicative interaction (AMMI) model. J. Appl. Genet. 2024, 65, 653–664. [Google Scholar] [CrossRef] [PubMed]
- Jędzura, S.; Bocianowski, J.; Matysik, P. The AMMI model application to analyze the genotype–environmental interaction of spring wheat grain yield for the breeding program purposes. Cereal Res. Commun. 2022, 51, 197–205. [Google Scholar] [CrossRef]
- Hill, M.O.; Gauch, H.G. Detrended Correspondence Analysis: An Improved Ordination Technique. Vegetatio 1980, 42, 47–58. [Google Scholar] [CrossRef]
- Gauch, H.G., Jr. Statistical Analysis of Yield Trials by AMMI and GGE. Crop Sci. 2006, 46, 1488–1500. [Google Scholar] [CrossRef]
- Braun-Blanquet, J. Pflanzensoziologie, 2nd ed.; Springer: Vienna, Austria, 1964. [Google Scholar]
- Király, G. Új magyar Füvészkönyv: Magyarország Hajtásos Növényei; Határozókulcsok; Aggteleki Nemzeti Park Igazgatóság: Jósvafő, Hungary, 2009; ISBN 978-963-87082-9-8. [Google Scholar]
- Borhidi, A. Social Behavior Types, the Naturalness and Relative Ecological Indicator Values of the Highre Plants in the Hungarian Flora. Acta Bot. Acad. Sci. Hung. 1995, 39, 97–181. [Google Scholar]
- Lumivero. XLSTAT Statistical and Data Analysis Solution 2024. Available online: https://www.xlstat.com/download (accessed on 3 January 2025).
- Penksza, K.; Turcsányi-Járdi, I.; Fűrész, A.; Saláta-Falusi, E. Marhalegelők vegetációjának vizsgálata az Ipoly-völgy homoki gyepeiben. AWET 2023, 19, 68–74. [Google Scholar] [CrossRef]
- Járdi, I.; Saláta, D.; S.-Falusi, E.; Stilling, F.; Pápay, G.; Zachar, Z.; Falvai, D.; Csontos, P.; Péter, N.; Penksza, K. Habitat Mosaics of Sand Steppes and Forest-Steppes in the Ipoly Valley in Hungary. Forests 2021, 12, 135. [Google Scholar] [CrossRef]
- Marriott, C.; Fothergill, M.; Jeangros, B.; Scotton, M.; Louault, F. Long-term impacts of extensification of grassland management on biodiversity and productivity in upland areas. A review. Agronomie 2004, 24, 447–462. [Google Scholar] [CrossRef]
- Nooni, I.K.; Ogou, F.K.; Prempeh, N.A.; Saidou Chaibou, A.A.; Hagan, D.F.T.; Jin, Z.; Lu, J. Analysis of long-term vegetation trends and their climatic driving factors in equatorial Africa. Forests 2024, 15, 1129. [Google Scholar] [CrossRef]
- Xu, T.; Zhou, J.; Wu, H.; Zhu, K.; Chao, Z.; Li, J.; Guo, Q. Research on the dynamic changes of drought and vegetation coupling on the qinghai-tibet plateau in the context of global warming. Res. Sq. 2024; preprint. [Google Scholar] [CrossRef]
- Bandak, S.; Naeini, S.; Komaki, C.; Verrelst, J.; Kakooei, M.; Mahmoodi, M. Satellite-based estimation of soil moisture content in croplands: A case study in golestan province, north of Iran. Remote Sens. 2023, 15, 2155. [Google Scholar] [CrossRef]
- Xu, S.; Su, Y.; Yan, W.; Liu, Y.; Wang, Y.; Li, J.; Qian, K.; Yang, X.; Ma, X. Influences of ecological restoration programs on ecosystem services in sandy areas, northern China. Remote Sens. 2023, 15, 3519. [Google Scholar] [CrossRef]
- Capon, S.; Reid, M. Vegetation resilience to mega-drought along a typical floodplain gradient of the southern murray-darling basin, Australia. J. Veg. Sci. 2016, 27, 926–937. [Google Scholar] [CrossRef]
- McClain, S.; Hagy, H.; Hine, C.; Yetter, A.; Jacques, C.; Simpson, J. Energetic implications of floodplain wetland restoration strategies for waterfowl. Restor. Ecol. 2018, 27, 168–177. [Google Scholar] [CrossRef]
- Török, P.; Valkó, O.; Deák, B.; Kelemen, A.; Tóthmérész, B. Traditional Cattle Grazing in a Mosaic Alkali Landscape: Effects on Grassland Biodiversity along a Moisture Gradient. PLoS ONE 2014, 9, e97095. [Google Scholar] [CrossRef] [PubMed]
Disclaimer/Publisher’s Note: The statements, opinions and data contained in all publications are solely those of the individual author(s) and contributor(s) and not of MDPI and/or the editor(s). MDPI and/or the editor(s) disclaim responsibility for any injury to people or property resulting from any ideas, methods, instructions or products referred to in the content. |
© 2025 by the authors. Licensee MDPI, Basel, Switzerland. This article is an open access article distributed under the terms and conditions of the Creative Commons Attribution (CC BY) license.