Abstract
Ecological resilience (ER) describes an ecosystem’s capacity to resist, adapt to, and recover from external shocks. Enhancing ER has become a crucial issue of high-quality development in urban agglomerations. Based on the perspective of human–land relationship, this study takes the Chengdu–Chongqing urban agglomeration (CCUA) as its research subject and constructs a three-dimensional evaluation framework of “Resistance-Adaptation-Recovery” (Res-Ada-Rec), evaluates the spatial and temporal evolution characteristics of ER from 2003 to 2022, and uses a partial least squares structural equation model (PLS-SEM) to reveal the interaction mechanism of human and natural factors on ER. Results indicate that: (1) Temporally, ER in the CCUA showed a significant upward trend, with resistance, adaptation, and recovery demonstrating fluctuating evolutionary processes. (2) Spatially, ER presented a pattern of “small agglomeration and large dispersion”, with clear spatial heterogeneity observed across the three dimensions. (3) PLS-SEM analysis revealed that green innovation, institutional policies, and the natural environment had significant positive direct effects on ER, with path coefficients of 0.54, 0.53, and 0.12, respectively. Urbanization exerted a significant indirect negative effect on ER through its impact on the natural environment. These findings deepen our understanding of how green innovation, institutional policies, and urbanization influence ER, providing scientific references for urban agglomeration to achieve modernization characterized by harmonious coexistence between humans and nature.
1. Introduction
The “human–land relationship” refers to the complex relationship between human society and its activities and the natural environment [1]. Because urban boundaries continue to expand and the intensity of human activity has increased, ecosystem services such as climate regulation and habitat preservation are being degraded, constraining regional sustainable development [2,3,4]. As products of advanced industrialization and urbanization, urban clusters serve not only as crucial spatial units for sustainable economic governance [5,6], but their rapid development also alters ecosystem structure, processes, and functions. This manifests as land-use changes, biodiversity loss, urban heat island effects, and air, water, and soil pollution [7]. Against this backdrop, enhancing the resistance, adaptation, and recovery capacity of ecosystems in response to external shocks has become a core issue in coordinating human–land relationships within urban agglomerations and advancing regional sustainable development. Consequently, evaluating the spatiotemporal evolution characteristics of urban agglomeration ecological resilience (ER) and investigating its influencing factors will enrich the regional systems theory of human–land relationships within urban agglomerations, holding significant importance for promoting high-quality development of national territorial space.
ER has become a hot topic in the field of sustainable science as an important tool for analyzing the human–land relationship and depicting the impact of human activities on geographical environment. Holling first proposed the concept of “resilience” to describe the ability of ecosystems to return to a stable state after external disturbances [8]. This concept not only provides a theoretical framework for understanding the mechanism of ecosystem response to disturbances, but also provides practical guidance for ecosystem management practices. ER refers to an ecosystem’s capacity to resist shocks, adapt to changes, and recover to a steady state when subjected to external disturbances [9]. It manifests as the system’s ability to maintain structural, functional, and characteristic stability through intrinsic self-organization, learning capabilities, and adaptability amid disturbances [10]. This capacity can be summarized as resistance, adaptation, and recovery, which collectively support the system’s stability in changing environments [11]. In this study, “resistance” refers to an ecosystem’s capacity to withstand external disturbances, mitigating or avoiding their impacts [10], “adaptation” denotes an ecosystem’s ability to self-adjust and adapt under external risk pressures [12], and “recovery” describes the process through which an ecosystem returns to a new equilibrium via direct or indirect restoration after experiencing stress and resource degradation [13].
Existing ER assessments have focused on the physical attributes of ecosystems. By constructing single-dimensional or multi-dimensional indicator systems, they achieve a quantitative characterization of resilience, revealing ecosystems’ capacity to respond to external disturbances. Recovery time serves as a typical single-dimensional indicator, commonly used to measure the recovery period of ecosystems following extreme climate events such as heavy rainfall or drought. This provides crucial evidence for quantifying post-disaster ER levels [14]. In terms of integrated indicators, common models primarily include Pressures-States-Responses (PSR), Driving Forces-Pressures-States-Impacts-Responses (DPSIR) [15], Resistance-Adaptation-Recovery (Res-Ada-Rec) [10], Loss-Gain [16], and Scale-Density-Form [17]. Methods such as the barrier degree model [18], geographically and temporally weighted regression (GTWR) model [19], kernel density estimation [11], Dagum Gini coefficient [10], and Markov chains [20] are employed to analyze the barrier factors and spatiotemporal evolution characteristics of ER. Although these models integrate ecosystem complexity, they rarely explore the spatiotemporal patterns of individual systems within ER. Furthermore, ER evaluation frameworks often emphasize natural factors like adaptation and recovery, neglecting assessments of interannual changes from a human–land relationship perspective.
In urban and regional studies, ER serves as a crucial capacity for promoting sustainable urban development [21]. Related research primarily focuses on three aspects: (1) Conceptual research. Scholars primarily define ER through equilibrium or evolutionary theories. The equilibrium perspective emphasizes an ecosystem’s capacity to rapidly adjust, adapt, and restore ecological stability when confronting uncertain risks [22]. The evolutionary perspective focuses on an ecosystem’s adaptive response to change and the process of functional evolution and optimization [23]. (2) The influence of specific factors on ER. For instance, Ma et al. (2023) employed a random forest regression model to investigate the importance and nonlinear effects of landscape patterns on ER [24]. Ge et al. (2025) utilized text mining analysis to quantify environmental policies, confirming that such policies enhance ER, finding that environmental policies enhance ER [25]. (3) Regarding the interactive relationship between ER and other factors such as urbanization [26], urban-rural integration [27], technological progress [28], and climate change [29], Chen et al. (2024) evaluated the spatiotemporal interaction between green inclusive finance and urban ER using a coupling coordination degree model [18]; Yuan et al. (2022) developed an ER indicator framework for resource-based cities to examine their distribution patterns [30]. Furthermore, with the advancement of the digital economy, Tang and Wang (2023) found that the digital economy promotes ER and exhibits significant spatial spillover effects [31].
Overall, existing research has established multi-dimensional ER assessment frameworks and deeply explored its spatiotemporal evolution and influencing factors, providing crucial references for urban agglomeration development. As spatial vehicles for reducing inter-city ecological barriers and promoting integrated development, urban agglomerations also intensify ecological complexity due to frequent human activities [32]. Therefore, it is imperative to clarify the influencing mechanisms of agglomeration ER to enhance the modernization level and utilization efficiency of natural resource management [33]. However, research on the ER of the Chengdu–Chongqing Urban Agglomeration (CCUA) remains relatively scarce, particularly lacking studies on the impact of the interaction between human activities and natural factors on its ER.
The CCUA serves as a vital engine for economic growth in western China and as a spatial vehicle for implementing the Yangtze River Economic Belt’s principle of “ecological priority and green development.” It bears the dual responsibility of achieving coordinated socioeconomic and ecological development. However, its rapid development has also brought numerous challenges, including resource constraints such as environmental pollution, ecological degradation, and the conversion of natural and semi-natural land into construction sites [34]. These changes have not only altered ecosystem cycling patterns but also diminished ecosystem service functions such as regulation, provisioning, and support. To address these challenges, the Chinese government has implemented ecological restoration projects like the “Thousand-Mile Forest Belt” and “Ecological Corridors,” effectively promoting the recovery of some lakes and wetland ecosystems while enhancing biodiversity and ecological service functions [35]. Meanwhile, the CCUA is actively building a comprehensive ecological protection framework for the upper reaches of the Yangtze River, promoting joint construction and conservation of the ecological environment, and striving to achieve a win-win situation between economic development and environmental protection. Therefore, to address gaps in existing research and respond to practical development needs, this study takes the CCUA as its research subject to construct an ER evaluation framework adapted to changes in the human–land relationship within the urban agglomerations, analyze the spatiotemporal evolution characteristics of ER, and explore the impacts of human activities and natural factors on ER.
2. Materials and Methods
2.1. Study Area
The CCUA possesses outstanding natural endowments and plays an irreplaceable role in safeguarding the ecological security of the upper Yangtze River. According to the CCUA Development Plan, the urban agglomeration includes 16 municipal-level administrative units: Chongqing, Chengdu, Zigong, Luzhou, Deyang, Mianyang, Suining, Neijiang, Leshan, Nanchong, Meishan, Yibin, Guang’an, Dazhou, Ya’an, and Ziyang (Figure 1). From 2003 to 2022, land use in this region was dominated by farmland, forest land, water bodies, and construction land. Construction area expanded from 2381.80 km2 in 2003 to 5984.12 km2 in 2020, representing a growth rate of 151.2%. Newly added construction land primarily resulted from spatial displacement of farmland and forest land, leading to a trend of ecological barrier fragility in the region [35]. In 2022, the CCUA achieved an economic output of 7.7588 trillion yuan, accounting for 6.4% of China’s national GDP and 30.2% of the western region’s GDP. The permanent resident population of the urban agglomeration exceeded 98.745 million people, with both Chongqing and Chengdu being megacities with populations surpassing 20 million. Their permanent resident urbanization rates reached 79.9% and 71.0%, respectively. The high concentration of population and the continuous intensification of land development have led to a prominent conflict between urban space and ecological space competing for land [36]. Therefore, coordinating human activities with ecological conservation and safeguarding the ecological security of the CCUA are of great significance for building a development pattern where humans and nature coexist in harmony.
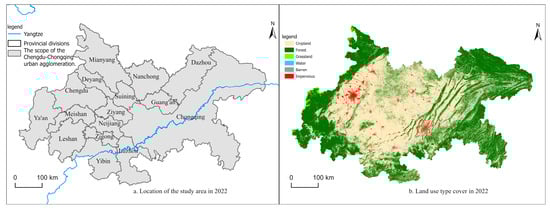
Figure 1.
Research area.
2.2. The Res-Ada-Rec Framework
The human–land relationship is a complex system formed by the interaction and mutual influence between human activities and the ecological environment. ER serves as a crucial means to characterize the coordinated relationship between humans and the land, representing the capacity of ecosystems to resist, adapt to, and recover from external shocks. Based on this, an ER evaluation framework is constructed from three dimensions—resistance, adaptation, and recovery—by integrating the internal dynamic evolution of ecosystems with the external impacts caused by human activities (Table 1).

Table 1.
Evaluation index system of ER.
Resistance indicates the degree to which the land responds to human-made pressures [37]. Ecosystem services (including provisioning, regulating, and supporting services) serve as key indicators for measuring ecosystem resilience [38]. Grain yield reflects an ecosystem’s capacity to provide essential material resources for human society. Ecological environment quality characterizes a region’s functions in soil and water conservation and pollution purification. Forest carbon storage directly demonstrates an ecosystem’s ability to sequester carbon, release oxygen, and regulate climate, and the net primary productivity of vegetation represents the net amount of organic matter absorbed by plants through photosynthesis, enabling assessment of ecosystem productivity.
Adaptation reflects the capacity of the land to adapt to human activities after experiencing shocks [12]. The scale of personnel in water resources, environmental, and public facilities management reflects resource allocation for environmental governance. Its expansion signifies enhanced water management and green space maintenance capabilities. The proportion of environmental protection investment represents fiscal support for urban environmental governance. Together, these factors underpin improvements in environmental governance capacity. Centralized sewage treatment rates and domestic waste harmless treatment rates directly demonstrate environmental governance outcomes. Their enhancement alleviates ecological and environmental burdens, thereby strengthening ecosystem adaptation.
Recovery reflects an ecosystem’s capacity to achieve a new equilibrium under the combined forces of humans and the land. Green coverage, per capita park green space area, and per capita water resources can promote ecosystem recovery by mitigating the urban heat island effect and improving air quality [39]. Optimization of land use reflects the scale of ecological land relative to developed land within a specific area, serving as a crucial indicator for assessing land structure rationality and ecosystem resilience levels.
2.3. Methods
This study first constructs an ER index system based on three dimensions (Resistance-Adaptation-Recovery) and applies the CRITIC method to measure the ER of the CCUA from 2003 to 2022. Second, it uses the Jenks natural breaks method to explore the spatiotemporal evolution of ER, resistance, adaptation, and recovery. Finally, it employs a partial least squares structural equation model (PLS-SEM) to examine how human activities and natural factors impact ER in the CCUA. The methodological framework is shown in Figure 2.
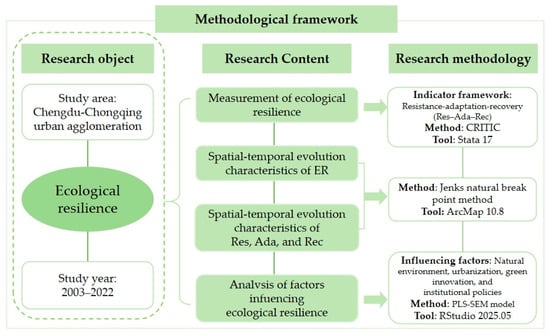
Figure 2.
Methodological framework.
2.3.1. CRITIC Method
This study employs the CRITIC weighting method to determine the weights of each indicator [40]. Common methods for weight determination include the Delphi method, the Analytic Hierarchy Process (AHP), the entropy weight method, principal component analysis (PCA), and the CRITIC weighting method. The first two methods are subjective weighting approaches susceptible to external influences. The entropy weight method struggles to handle scenarios with highly coupled indicators, while principal component analysis may diminish the practical significance of indicators after dimensionality reduction [41]. The CRITIC weighting method, however, emphasizes the interrelationships, comparative strengths, and conflicting nature among indicators while incorporating objective weighting, resulting in weights that more closely reflect reality. Given the inherent correlations and conflicts among indicators characterizing ER, following the approach of Liu et al. [42], the CRITIC weighting method was ultimately selected for weight determination. The calculation principle is as follows:
(1) Indicator normalization. To eliminate the effects of dimensional differences and the directionality of positive and negative indicators, the maximum-minimum method is employed to normalize each indicator:
(2) Objective weight determination. Calculate the standard deviation of the column vector in the contrast strength between the indicators:
Calculate the conflict between indicators:
Calculate the comprehensive information and the index weight , where represents the amount of information contained in the index:
(3) Calculate ER. The comprehensive evaluation value of ER was calculated using the linear weighting method:
In Equations (1)–(7), denotes the original statistical value of index in city (), , denotes the normalized value, is the standard deviation of index , reflecting its dispersion degree, is the Pearson correlation coefficient between and k, and represents the weight of index .
2.3.2. Partial Least Squares Structural Equation Model (PLS-SEM)
This study employs PLS-SEM model to evaluate the impact of human and natural factors on the ER of urban agglomerations. This model effectively handles analytical frameworks involving multiple constructs, indicators, and structural pathways while simultaneously assessing mediating effects [43]. Furthermore, it does not require assumptions of data normality, is less susceptible to multicollinearity and missing value bias, and offers greater reliability when estimating multi-path relationships [43]. The PLS-SEM model comprises a measurement model and a structural model. The measurement model is an explanatory model composed of latent and observed variables [44], where latent variables refer to variables that cannot be directly measured but can be represented by other variables; observed variables refer to variables that can be directly observed. The change values of each indicator from 2003 to 2022 were imported into the model as sample data to analyze the factors influencing ER. The calculation formula is as follows:
The internal model reflects the relationship between different latent variables, that is, the interaction. The formula is as follows:
In Equations (8)–(10), and represent latent variables and observed variables, respectively. represents the relationship between latent variables and corresponding observed variables, and and represent measurement errors. and represent different latent variables, and represent the influence coefficients between different latent variables, and represents the regression residual. In this model, the path coefficient represents the direct effect of the influencing factor on the outcome variable, and the product of the path coefficient can reflect the indirect effect of the factor on the outcome variable.
This study employs RStudio 2025.05 software to analyze the PLS-SEM model. The parameter estimation method uses a path-weighted scheme with a maximum iteration set to 300. For parameter significance testing, the bootstrap sampling method is selected with a sample size of 5000. Composite reliability (CR) is used to measure internal consistency reliability, average variance extraction (AVE) is employed to examine convergent validity, and variance inflation factor (VIF) is used to detect multicollinearity [44]. Among these methods, the CR is used to evaluate the internal consistency reliability of the construct by integrating the standardized factor load and error variance of the observed variables. The value needs to be greater than 0.7 to ensure good reliability. The minimum acceptable threshold is 0.6. If it is lower than this value, it indicates that the convergence of the construct item is insufficient. The AVE is used to test the convergence validity of the construct by calculating the ratio of the explanatory amount of the construct variance to the error variance. When the AVE value exceeds 0.5, it means that the construct can explain more than 50% of the variance variation of the observed variables and meet the convergence validity requirements. The VIF is used to detect the degree of multicollinearity between variables in the model. If the VIF value is less than 5, it shows that there is no serious multicollinearity between variables, which can ensure the effectiveness of model parameter estimation.
2.3.3. Selection of Influencing Factors of ER
From a human–land relationship perspective, this study selects “natural environment,” “urbanization,” “institutional policies,” and “green innovation” as latent variables influencing ER. “Natural environment” relates to climate, topography, and vegetation, serving as the dominant and fundamental factor determining the spatial distribution of ER [45]. Therefore, annual precipitation and cumulative sunshine hours are selected to characterize regional hydrothermal conditions, as these jointly determine the foundation of ecosystem productivity and material cycling [46]. Slope is used to reflect terrain undulation characteristics; steeper slopes typically face higher risks of soil erosion and development constraints, imposing natural limitations on ecosystem stability. Vegetation coverage intuitively reflects the structure and quality of surface ecosystems, serving as a key indicator for measuring ecosystem health.
Urbanization is a key factor driving changes in ER [45], manifested through three processes: economic agglomeration, spatial expansion, and population growth. Nighttime light intensity is selected to reflect economic activity intensity and agglomeration levels. Impervious surface serves as a metric for the spatial scale and intensity of urban land expansion, whose increase directly encroaches upon natural ecological spaces, constituting a primary mode of influencing ecological processes [47]. Population density reflects the degree of concentration of human activities. Moderate concentration facilitates intensive and efficient development, but excessive density may exacerbate local resource and environmental pressures.
Institutional policies guide the transformation of development patterns through a series of institutional tools, thereby promoting environmental protection and sustainable development [48]. Industrial restructuring is an essential pathway to enhancing land use efficiency, with green, low-carbon, and high-quality transformation directions improving ecological and environmental quality [49]. Although ecological conservation policies may temporarily impact economic output efficiency, they form the foundation for enhancing ER, guiding urban development trajectories, and achieving sustainable development of urban clusters in the long term and overall [50]. Thus, institutional policies are characterized by industrial restructuring (proactive burden reduction) and ecological conservation policies (bottom-line protection).
Green innovation relates to scientific research innovation, aiming to alleviate the pressure of human activities on the ecological environment and enhance resource utilization efficiency through technological advancement and structural optimization. Investment in scientific research innovation can optimize the efficiency of green factor allocation, reduce development dependence on traditional factors, and thereby strengthen the stability of ecosystems in responding to external shocks [51]. The number of green patent grants serves as an objective metric for measuring green technology output and is widely adopted in relevant research [52]. Therefore, green innovation is characterized by scientific and technological expenditure (input) and the number of green patent grants (output).
2.4. Data Sources
Land use data from 2003 to 2022 were derived from the China Land Cover Dataset, developed by Yang and Huang (2021) [53] based on available Landsat data. With an overall accuracy of 80%, this dataset classifies land use into six categories: cropland, forest, grassland, water, impervious, and barren. According to Eike’s research findings, this interpretation accuracy meets the requirements for analysis [54]. The ecological environment quality dataset originates from multi-source remote sensing data developed by Xu et al. (2021) [55]. The forest carbon storage dataset was calculated by Chen et al. (2023) using regression and machine learning methods [56], integrating remote sensing observations with dense field measurements to estimate above-ground and below-ground biomass carbon in Chinese forests. Vegetation net primary productivity (NPP) data were sourced from Limu et al. (2024) [57], representing the net accumulation of organic matter in ecosystems. Nighttime light data utilize DMSP-OLS and SNPP-VIIRS data [58] integrated by Wu et al. (2021), yielding annual China-wide DMSP-OLS data from 1992 to 2022. Missing data for individual years were completed using interpolation methods. Details of the data sources are provided in Table 2.
Table 2.
Data sources.
3. Results
3.1. Spatial-Temporal Evolution Characteristics of ER
From 2003 to 2022, the ER level of the CCUA exhibited phased characteristics and a fluctuating upward trend (Figure 3), with the average value rising from 0.29 to 0.52, representing an annual growth rate of 3.05%. Specifically: From 2007 to 2012, it entered a rapid growth phase, with the average value rising from 0.32 to 0.42 and an annual growth rate of 5.36%. From 2013 to 2018, it transitioned into a relatively stable period, with the average value increasing from 0.44 to 0.49 and an annual growth rate of 2.06%. From 2019 to 2022, it entered an adjustment phase with an annual growth rate of 1.17%.
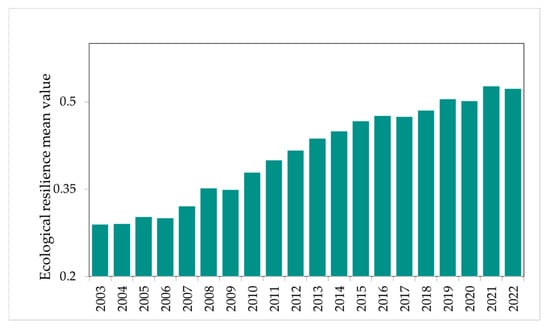
Figure 3.
Temporal characteristics of ER in the CCUA from 2003 to 2022.
This study uses the Jenks natural breakpoint method to classify ER into five tiers: low (<0.23), medium-low (0.23–0.33), medium (0.33–0.43), medium-high (0.43–0.56), and high (>0.56). Figure 4a–e displays the findings of the mapping.
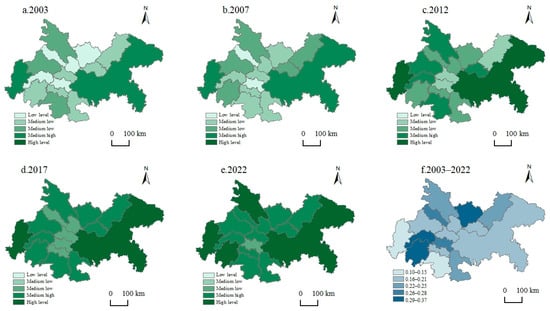
Figure 4.
(a–f) Spatial distribution characteristics of ER in CCUA from 2003 to 2022.
From 2003 to 2007, most cities exhibited low and medium-low levels of ER, with only Chengdu and Mianyang reaching medium resilience. Chongqing and Ya’an were classified as cities with high resilience. By 2012, the number of cities with medium-low resilience decreased. Yibin, Meishan, Chengdu, Mianyang, and Guang’an advanced to medium-high resilience, while Chongqing and Ya’an rose to high resilience. By 2017, all cities surpassed the medium-low resilience threshold, though central regions (such as Suining, Ziyang, Neijiang, and Zigong) still exhibited relatively low ER. By 2022, the number of medium-high and high resilience cities increased, with resilience levels becoming more balanced across tiers. Overall ER improved, with only Neijiang remaining at a medium resilience level.
Based on the change values (Figure 4f), the CCUA demonstrated a sustained overall improvement in ER from 2003 to 2022. Cities with high resilience were primarily distributed in Chongqing, Mianyang, Ya’an, and other regions, exhibiting a spatial pattern characterized by “small clusters and large dispersal.” Specifically, Nanchong and Leshan achieved the fastest ER gains through ecological initiatives like the Grain-for-Green Program, while Ya’an and Yibin, benefiting from strong ecological foundations, saw relatively limited improvements due to their already high baseline resilience.
3.2. Spatial-Temporal Evolution Characteristics of Res, Ada, and Rec
From 2003 to 2022, the ecosystem resistance, adaptation, and recovery of the CCUA exhibited fluctuating patterns (Figure 5). Resistance showed an overall fluctuating upward trend, with the average value increasing from 0.09 to 0.12, representing an annual growth rate of 1.15%. Adaptation exhibited a sustained growth trend, with the average value rising from 0.13 to 0.26, representing an annual growth rate of 3.89%. Recovery gradually transitioned from an early period of low fluctuation to a later phase of fluctuating increase, with the average value increasing from 0.07 to 0.14, achieving an annual growth rate of 4.04%.
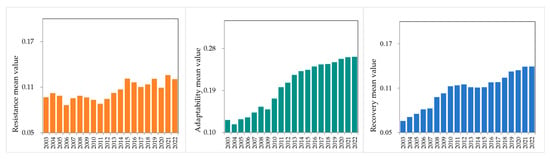
Figure 5.
Temporal Characteristics of Res, Ada, and Rec in the CCUA from 2003 to 2022.
The resistance, adaptation, and recovery of the ecosystem of CCUA showed obvious spatial heterogeneity (Figure 6).
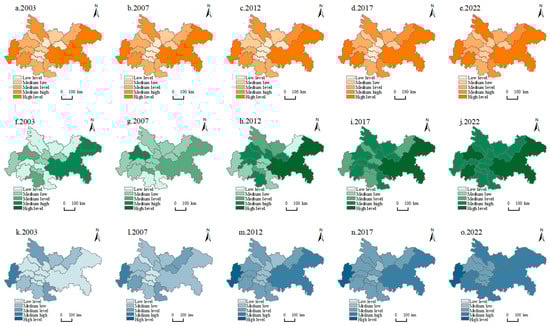
Figure 6.
(a–o) Spatial distribution characteristics of Res, Ada, and Rec of CCUA from 2003 to 2022.
Using the Jenks natural breakpoint method, resistance was classified into five tiers: low (<0.06), medium-low (0.06–0.08), medium (0.08–0.12), medium-high (0.12–0.16), and high (>0.16). The results are displayed in Figure 6a–e. The spatial distribution of resistance exhibits a pattern of “high-value clustering.” From 2003 to 2012, cities with medium-high and high resistance were concentrated in Mianyang, Leshan, Ya’an, and Chongqing, while cities with low resilience were distributed in central regions such as Zigong, Neijiang, and Suining. From 2017 to 2022, all cities surpassed the low resistance threshold. The proportion of cities with medium-high and high resistance increased to six, including Mianyang, Leshan, Ya’an, Chongqing, Luzhou, and Dazhou. Cities with medium-low resilience were primarily distributed in the densely populated central regions.
Using the Jenks natural breakpoint method, adaptation was classified into five tiers: low (<0.11), medium-low (0.11–0.19), medium (0.19–0.23), medium-high (0.23–0.27), and high (>0.27). The results are displayed in Figure 6f–j. From 2003 to 2007, most cities exhibited low and medium-low adaptation levels, with only Chongqing and Chengdu classified as cities with medium-high adaptation. By 2012, the number of cities with medium and medium-high adaptation increased, while the proportion of low adaptation cities decreased to just one (Dazhou). By 2017, the distribution of cities across adaptation tiers became more balanced, with medium-high and high adaptation cities increasing to 10, while medium-low adaptation cities disappeared. In 2022, all cities achieved medium-high or high adaptation levels, with high adaptation cities were concentrated in Chongqing, Chengdu, and Leshan.
Using the Jenks natural breakpoint method, recovery was classified into five tiers: low (<0.06), medium-low (0.06–0.10), medium (0.10–0.13), medium-high (0.13–0.18), and high (>0.18). The results are displayed in Figure 6k–o. From 2003 to 2007, most cities exhibited low and medium-low recovery levels, with only Ya’an, Mianyang, and Luzhou demonstrating medium and medium-high recovery. From 2012 to 2017, all cities surpassed the low recovery threshold, with a significant increase in the number of cities achieving medium recovery. Cities with medium-low recovery were primarily concentrated in central regions such as Suining and Neijiang. Chongqing rose to a medium-high recovery level, while Ya’an became the sole city with high recovery. By 2022, recovery exhibited clustered and contiguous distribution patterns. All cities achieved medium or higher recovery levels. However, recovery levels in central regions remained relatively low.
3.3. Analysis of Influencing Factors
To control for temporal autocorrelation effects, all observed variables were compared with their “current” data after a two-period lag. As shown in Table 3, regarding reliability testing, the CR of each latent variable exceeded 0.70, indicating strong internal consistency within the model. Regarding validity testing, the AVE of each latent variable surpassed 0.55, demonstrating ideal convergent validity. Simultaneously, VIF were used to detect multicollinearity among the 11 observed variables. All observed variables exhibited VIF values within the reasonable range of 1 to 5, indicating no severe multicollinearity issues in the model [60]. Furthermore, as shown by the factor loadings (Table 4), the standardized factor loadings () for most observed variables exceeded 0.6 and passed significance tests, confirming that observed variables effectively reflect their corresponding latent variables. In summary, these indicators largely meet ideal values, validating the reasonableness and reliability of the PLS-SEM model.
Table 3.
PLS-SEM model fitting results and validity.
Table 4.
Factor load results of PLS-SEM model fitting.
Table 5 reports the significance results of the influence paths in the PLS-SEM model. The variance explained (R2) by natural environment, urbanization, green innovation, and institutional policies on ER is 75.7%, while the variance explained by the two-period lag is 72.7%. This indicates that these factors possess strong explanatory power for the ER of the CCUA and exhibit relative stability. Furthermore, most path coefficients passed the significance test, indicating that each latent variable exerts varying degrees of influence on ER.
Table 5.
Effect values of impact factors on ER.
The direct effect of the natural environment on ER is positive and significant, with a path coefficient of 0.53. Natural factors do not act as an exogenous latent variable nor indirectly influence ER through other variables; the direct effect constitutes the total effect.
The direct effect of urbanization on ER is negatively insignificant, with a path coefficient of −0.03. The two-period lagged effect is positively insignificant, with a path coefficient of 0.11. Simultaneously, urbanization exerts an indirect negative influence on ER by affecting the natural environment, with a path coefficient of [−0.63 × 0.53 = −0.33]. The pathway is: urbanization → natural environment → ecological resilience.
The direct effect of institutional policies on ER is significantly positive, with a path coefficient of 0.54. Two indirect influence pathways exist between institutional policies and ER. Among these, the positive effect from institutional policies → natural environment → ecological resilience exhibits the strongest intensity, with a path coefficient of [0.58 × 0.53 = 0.31]. This indicates that institutional policies exert a positive indirect influence on ER by affecting the natural environment. Conversely, the path from institutional policies → urbanization → natural environment → ecological resilience exhibits the strongest negative effect, with a path coefficient of [0.67 × (−0.63) × 0.53 = −0.22].
The direct effect of green innovation on ER is significantly positive, with a path coefficient of 0.12. Five indirect pathways exist for green innovation’s influence on ER: green innovation → institutional policies → ecological resilience, green innovation → institutional policies → natural environment → ecological resilience, green innovation → urbanization → natural environment → ecological resilience, green innovation → institutional policies → urbanization → natural environment → ecological resilience, green innovation → natural environment → ecological resilience. Among these paths, the positive effect from green innovation → institutional policies → ecological resilience exhibits the strongest intensity, with a path coefficient of [0.59 × 0.54 = 0.32]. Conversely, the negative effect from green innovation → institutional policies → urbanization → natural environment → ecological resilience demonstrates the strongest intensity, with a path coefficient of [0.59 × 0.67 × (−0.63) × 0.53 = −0.13].
4. Discussion
4.1. Spatial-Temporal Characteristics of ER
ER has shown a fluctuating upward trend over time. From 2003 to 2006, as urban construction continued to expand in the CCUA, most cities maintained ER at medium-low levels. From 2007 to 2012, the concept of “ecological civilization construction” was first proposed and progressively implemented. The intensity of urban land expansion began to diminish, while a series of ecological restoration projects propelled ER into a phase of rapid enhancement. After 2013, the implementation of the CCUA Development Plan drove urbanization toward upgrading existing stock, further consolidating ER levels. From 2019 to 2022, ER experienced slight fluctuations amid transformation and upgrading but remained at a high overall level. This positive trend aligns with the practical achievements of ecological civilization construction [61]. Spatially, cities like Chongqing, Mianyang, and Ya’an—situated in the mountainous periphery of the basin and the ecological barrier zone of the upper Yangtze River—were able to maintain medium-high and high levels of ER due to their intact ecosystem networks and high landscape connectivity. This underscores the critical importance of protecting key ecological resources for enhancing ER [12]. In contrast, central hilly cities like Suining, Ziyang, Neijiang, and Zigong exhibit relatively low ER. This stems from accelerated urbanization, high population density, and urban sprawl, which exacerbate pollution and continuously squeeze ecological spaces—a finding consistent with Lei et al.’s [62] research conclusions.
4.2. Spatial-Temporal Characteristics of Res, Ada, and Rec
Over time, resistance exhibits a fluctuating upward trend, indicating that the stock of natural capital—primarily regional ecological foundations and stable agricultural output—serves as the foundation for maintaining ecosystem resilience. Adaptation exhibits a sustained growth trend, reflecting the positive impact of continuous environmental governance investments in enhancing infrastructure and service levels, thereby strengthening the land’s capacity to adapt to human activities. Recovery demonstrates a stepwise improvement pattern aligned with the implementation cycle of ecological restoration projects. Through expanding green spaces, optimizing land use, and ensuring water resource supply, these initiatives have effectively enhanced the ecosystem’s ability to recover from disturbances.
Spatially, regarding resistance, cities with medium-high and high resistance (such as Mianyang, Leshan, Ya’an, and Chongqing) have long been stably distributed in areas with excellent ecological foundations and relatively weak human disturbance. Conversely, cities with medium-low resistance (such as Ziyang, Neijiang, and Zigong) are concentrated in older industrial cities characterized by dense populations and industries. In terms of adaptation, most cities initially exhibited low and medium-low adaptation due to weak economic foundations and lagging environmental infrastructure development. During the later stages of development, the gap in adaptation among cities gradually narrowed. Cities like Chongqing and Chengdu achieved significant leaps in adaptation through policy and investment-driven initiatives, a phenomenon confirmed by Chen et al. [63]. Concerning recovery, most cities initially exhibited low and medium-low recovery levels. Ya’an consistently maintained medium-high and high recovery due to its relatively balanced ecosystem structure and strong environmental regulation capacity. In the middle and later stages, ongoing ecological restoration projects led to an overall improvement in recovery, revealing the critical role of human activities in promoting recovery [64], providing important insights for ecological restoration and sustainable ecosystem management.
4.3. Influencing Factors of ER
Analysis of influencing factors indicates that natural environment, institutional policies, and green innovation all exert significant positive effects on ER. As the foundational element of ecosystems, natural environment’s resource endowment serves as a crucial basis for enhancing ER [65]. Institutional policies effectively constrain excessive resource consumption and environmental damage by establishing stringent emission standards and delineating ecological protection red lines [66], providing institutional safeguards for ER. This finding aligns with Xu et al.’s research on the positive role of governance structures [50]. Furthermore, green innovation enhances ecosystem adaptability by promoting industrial upgrading and green technology adoption, thereby improving natural resource utilization efficiency. This aligns with ecological modernization theory’s perspective that technological innovation drives environmental protection and development [67]. In contrast, the direct impact of urbanization on ER is not statistically significant and exhibits distinct phased characteristics: in the short term, population growth and the expansion of construction land may exert pressure on ecosystems [68]; long-term, economic growth, technological advancements, and institutional improvements accompanying urbanization may mitigate these negative effects. This finding aligns with the relationship between developmental stages and environmental quality described by the environmental Kuznets curve [12]. Furthermore, urbanization exerts a significant negative influence on ER by affecting the natural environment, providing crucial insights into the complex relationship between human activities and ecosystems.
4.4. Policy Implications and Recommendations
Based on the research findings, policy recommendations are proposed to enhance ER and promote sustainable development in the CCUA and similar regions. First, implement differentiated spatial management and ecological restoration. In areas with low ER (such as Neijiang, Zigong, and Ziyang), prioritize ecological restoration by drawing on case studies like Xuzhou’s “mining pits transformed into wetlands.” Concurrently, establish a dynamic monitoring mechanism for resource and environmental carrying capacity, strictly control development scale, and reduce pollution emissions and ecological damage [69]. In ecologically endowed areas (such as Ya’an, Leshan, and Chongqing), draw inspiration from Costa Rica’s “Payments for Ecosystem Services” and China’s pilot programs for realizing the value of ecological products. Innovate mechanisms for preserving and increasing the value of ecological capital to convert ecological advantages into economic dividends. In highly urbanized regions (such as Chengdu and Chongqing), draw on the transformation experience of Germany’s Ruhr region [70] to strengthen rigid constraints on urban development boundaries. By enhancing economic density per unit of land use, guide urban agglomerations toward intensive expansion of construction land.
Second, strengthen regional coordination of institutional policies and market incentives. Deepen the linkage of ecological protection policies across administrative regions, establishing a comprehensive ecological compensation and collaborative supervision system with unified standards. Prioritize support for projects with carbon sequestration and ecological restoration benefits to stimulate market participation. Concurrently, establish a mechanism for dynamic policy evaluation and adjustment, promptly revising regulations that constrain the coordinated development of the economy and environment to ensure policy frameworks align with regional development strategies. Finally, establish a technology support system that leads with green innovation. Drawing on international experiences in “green innovation strategies,” we should establish dedicated R&D programs and optimize green patent review and incentive mechanisms to spur breakthroughs and commercialization of key low-carbon technologies. In innovation hubs like Chengdu and Chongqing, resources should be prioritized for green technology R&D and emerging industry development. In ecologically sensitive areas (such as Neijiang, Zigong, and Yibin), investments in environmental remediation technologies must be scaled up to fortify ecological security barriers through technological advancement.
Overall, the practical recommendations proposed in this study offer valuable guidance for policy formulation in the CCUA and other similar regions. The ongoing exploration of pathways to enhance ER aims not only to establish an analytical framework with general explanatory power but also represents a strategic investment in the sustainable development of urban agglomerations. Through the targeted policy actions outlined above, the ER of urban agglomerations is expected to steadily strengthen, ultimately achieving a more resilient and sustainable regional environment.
4.5. Contributions and Future Prospects
First, in terms of research scope, existing studies have focused on urban agglomerations such as the Pearl River Delta [33], Beijing-Tianjin-Hebei region [71], Yangtze River Delta [72], and the middle reaches of the Yangtze River [73], with relatively limited attention paid to the CCUA. As a key spatial vehicle for the Yangtze River Economic Belt’s “ecological priority and green development” strategy, the CCUA’s ecological conservation and restoration directly impact the sustainable development of the upper Yangtze River. This study provides targeted empirical analysis for this region. Second, regarding the assessment framework, drawing upon existing ER assessment frameworks [73], this study comprehensively considers both the dynamic evolution within ecosystems and external impacts caused by human activities. A comprehensive indicator system is constructed based on the three dimensions of “resistance-adaptation-recovery,” evaluating how ecosystems utilize their ecological baseline to resist disturbances. This approach places greater emphasis on the role of changes in human–land interactions in the process of ER. Third, in terms of research perspective, previous studies have primarily focused on the impact of human activities or natural factors on ER [22,74], with limited research on how institutional policies and green innovation influence the ER of urban agglomerations. This study integrates both dimensions into a comprehensive analysis of ER influences. By employing a PLS-SEM model to elucidate the driving factors of ER, it contributes to minimizing the negative impacts of urbanization and promoting the coordinated sustainable development of production, living, and ecological systems.
However, shortcomings remain: (1) Understanding of the mechanisms influencing ER has yet to encompass the full complexity of the system. There is still a lack of systematic analysis of the dynamic coupling relationships and potential pathways among various influencing factors, particularly failing to fully quantify the nonlinear impacts on ER resulting from multi-factor interactions. Future research could integrate the spatial structural characteristics of the CCUA by dividing the study area into distinct zones such as urban core areas, ecologically sensitive zones, and traditional industrial districts. Separate ER response models could be developed for each zone to reveal the differentiated response patterns of ER to driving factors across different regions. Concurrently, employing Moran’s I index and spatial Durbin models would enable more precise analysis of the spatiotemporal heterogeneity of each factor’s influence on ER. (2) Different regions exhibit varying natural conditions and developmental stages, leading to distinct resilience states when subjected to external shocks. Subsequent research should refine evaluation frameworks based on the developmental stage of urban agglomerations, analyzing the spatiotemporal differentiation of ER across different development levels through horizontal and vertical comparisons. Simultaneously, consider conducting regression analyses with resistance, adaptation, and recovery as separate dependent variables to examine the differentiated influence pathways of key drivers across different dimensions. For instance, investigate whether green innovation enhances recovery or whether urbanization processes strengthen adaptation.
5. Conclusions
Based on the perspective of the human–land relationship, this study constructs a three-dimensional ER evaluation framework of “resistance-adaptation-recovery.” Taking CCUA as the research subject, this study analyzes the spatial and temporal evolution characteristics of ER from 2003 to 2022, and uses PLS-SEM model to reveal the interaction mechanism of natural environment, urbanization, institutional policies, and green innovation on the ER. Key findings are as follows:
- (1)
- Temporal evolution characteristics: from 2003 to 2022, the ER of CCUA exhibited phased characteristics and a fluctuating upward trend, with the average value rising from 0.29 to 0.52, representing an annual growth rate of 3.05%. Resistance showed a fluctuating upward trend, adaptation maintained a sustained growth trend, and recovery demonstrated a stepwise upward trend. The three capacities exhibited the characteristic sequence: adaptation > recovery > resistance.
- (2)
- Spatial evolution characteristics: from 2003 to 2022, the CCUA exhibited pronounced spatial heterogeneity in ER, forming an overall distribution pattern characterized by “small clusters and large dispersions.” Resistance displayed a “high-value clustering” pattern, while adaptation and recovery gradually evolved from early low and medium-low levels to medium-high and high levels, presenting a clustered and contiguous distribution pattern.
- (3)
- Influencing factors analysis: PLS-SEM model analysis indicates that green innovation, institutional policies, and natural environment exert significant positive impacts on ER, with influence effects ranked as: institutional policies > natural environment > green innovation. While urbanization did not demonstrate a significant direct impact, it exerts an indirect negative influence on ER through the natural environment.
Author Contributions
Data curation, H.S. and Q.W.; Conceptualization, H.S.; Formal analysis, H.S., W.C. and Q.W.; Funding acquisition, W.C.; Methodology, W.C. and H.S.; Software, H.S. and Q.W.; Supervision, W.C.; Visualization, Q.W.; Writing—original draft, W.C. and H.S.; Writing—review & editing, H.S., W.C. and Q.W. All authors have read and agreed to the published version of the manuscript.
Funding
This work was supported by the major project of the National Social Science Fund “Action Research on the Implementation of Rural Construction” (Grant No: 21ZDA058), the Xinjiang Corps Social Science Fund “Research on the Innovation of Agricultural Land Management Model in Xinjiang Corps” (Grant No: KZ63710101) and “Research on the Cultivation and Development of New Agricultural Management Entities in the Corps” (Grant No: KZ024804).
Data Availability Statement
The data used to support the findings of this study are available from the corresponding authors upon request.
Conflicts of Interest
The authors declare no conflicts of interest.
References
- Ren, X.; Li, Y.; Luo, G.; Huang, J.; Zhang, Y.; Xu, Q.; Yang, L. The Rural Human-Land Relationship Transition in Southwest Karst Mountainous Areas Based on Rural Population, Agricultural Production Land, and Rural Settlement Coupling. Habitat Int. 2025, 163, 103493. [Google Scholar] [CrossRef]
- Metzger, M.J.; Rounsevell, M.D.A.; Acosta-Michlik, L.; Leemans, R.; Schröter, D. The Vulnerability of Ecosystem Services to Land Use Change. Agric. Ecosyst. Environ. 2006, 114, 69–85. [Google Scholar] [CrossRef]
- Li, G.; Fang, C.; Li, Y.; Wang, Z.; Sun, S.; He, S.; Qi, W.; Bao, C.; Ma, H.; Fan, Y.; et al. Global Impacts of Future Urban Expansion on Terrestrial Vertebrate Diversity. Nat. Commun. 2022, 13, 1628. [Google Scholar] [CrossRef]
- Wei, G.; He, B.-J.; Liu, Y.; Li, R. How Does Rapid Urban Construction Land Expansion Affect the Spatial Inequalities of Ecosystem Health in China? Evidence from the Country, Economic Regions and Urban Agglomerations. Environ. Impact Assess. Rev. 2024, 106, 107533. [Google Scholar] [CrossRef]
- He, Y.; Zhou, G.; Tang, C.; Fan, S.; Guo, X. The Spatial Organization Pattern of Urban-Rural Integration in Urban Agglomerations in China: An Agglomeration-Diffusion Analysis of the Population and Firms. Habitat Int. 2019, 87, 54–65. [Google Scholar] [CrossRef]
- Ma, X.; Li, C.; Li, Q.; Sun, Q. Toward Urban Agglomerations’ Sustainable Development: Impact of Economic Agglomeration on Green Economic Efficiency. Econ. Anal. Policy 2025, 87, 1342–1360. [Google Scholar] [CrossRef]
- Yu, P.; Wei, Y.; Ma, L.; Wang, B.; Yung, E.H.K.; Chen, Y. Urbanization and the Urban Critical Zone. Earth Crit. Zone 2024, 1, 100011. [Google Scholar] [CrossRef]
- Holling, C.S. Resilience and Stability of Ecological Systems. Annu. Rev. Ecol. Evol. Syst. 1973, 4, 1–23. [Google Scholar] [CrossRef]
- Wang, J.; Wang, J.; Zhang, J. Spatial Distribution Characteristics of Natural Ecological Resilience in China. J. Environ. Manag. 2023, 342, 118133. [Google Scholar] [CrossRef]
- Hu, H.; Yan, K.; Shi, Y.; Lv, T.; Zhang, X.; Wang, X. Decrypting Resilience: The Spatiotemporal Evolution and Driving Factors of Ecological Resilience in the Yangtze River Delta Urban Agglomeration. Environ. Impact Assess. Rev. 2024, 106, 107540. [Google Scholar] [CrossRef]
- Wang, K.; Ding, R.; Xiao, W.; Liang, J.; Peng, L.; Jiang, S. Ecological Economic Resilience in China: Systematic Performances, Structural Characteristics and Evolutionary Predictions. Environ. Dev. Sustain. 2025; in press. [Google Scholar] [CrossRef]
- Shi, C.; Zhu, X.; Wu, H.; Li, Z. Assessment of Urban Ecological Resilience and Its Influencing Factors: A Case Study of the Beijing-Tianjin-Hebei Urban Agglomeration of China. Land 2022, 11, 921. [Google Scholar] [CrossRef]
- Yu, X.; Liu, Y.; He, H.; Yang, B. Revealing the Spatial Effects of New-Type Urbanization on Urban Ecological Resilience: Evidence from 281 Prefecture-Level Cities in China. Land 2025, 14, 1851. [Google Scholar] [CrossRef]
- Fu, Z.; Li, D.; Hararuk, O.; Schwalm, C.; Luo, Y.; Yan, L.; Niu, S. Recovery Time and State Change of Terrestrial Carbon Cycle after Disturbance. Environ. Res. Lett. 2017, 12, 104004. [Google Scholar] [CrossRef]
- Zhao, R.; Fang, C.; Liu, H.; Liu, X. Evaluating Urban Ecosystem Resilience Using the DPSIR Framework and the ENA Model: A Case Study of 35 Cities in China. Sustain. Cities Soc. 2021, 72, 102997. [Google Scholar] [CrossRef]
- Shamsipour, A.; Jahanshahi, S.; Mousavi, S.S.; Shoja, F.; Ansari Golenji, R.; Tayebi, S.; Alavi, S.A.; Sharifi, A. Assessing and Mapping Urban Ecological Resilience Using the Loss-Gain Approach: A Case Study of Tehran, Iran. Sustain. Cities Soc. 2024, 103, 105252. [Google Scholar] [CrossRef]
- Feng, X.; Xiu, C.; Bai, L.; Zhong, Y.; Wei, Y. Comprehensive Evaluation of Urban Resilience Based on the Perspective of Landscape Pattern: A Case Study of Shenyang City. Cities 2020, 104, 102722. [Google Scholar] [CrossRef]
- Chen, X.; Huang, X.; Yu, T.; Zhang, Y.; Cui, X. From Imbalance to Synergy: The Coupling Coordination of Digital Inclusive Finance and Urban Ecological Resilience in the Yangtze River Economic Belt. Land 2024, 13, 1617. [Google Scholar] [CrossRef]
- Zhou, X.; Wang, H.; Duan, Z.; Zhou, G. Exploring the Impacts of Urbanization on Ecological Resilience from a Spatiotemporal Heterogeneity Perspective: Evidence from 254 Cities in China. Environ. Dev. Sustain. 2024; in press. [Google Scholar] [CrossRef]
- Li, G.; Wang, L. Study of Regional Variations and Convergence in Ecological Resilience of Chinese Cities. Ecol. Indic. 2023, 154, 110667. [Google Scholar] [CrossRef]
- Büyüközkan, G.; Ilıcak, Ö.; Feyzioğlu, O. A Review of Urban Resilience Literature. Sustain. Cities Soc. 2022, 77, 103579. [Google Scholar] [CrossRef]
- Feng, X.; Zeng, F.; Loo, B.P.Y.; Zhong, Y. The Evolution of Urban Ecological Resilience: An Evaluation Framework Based on Vulnerability, Sensitivity and Self-Organization. Sustain. Cities Soc. 2024, 116, 105933. [Google Scholar] [CrossRef]
- Viñals, E.; Maneja, R.; Rufí-Salís, M.; Martí, M.; Puy, N. Reviewing Social-Ecological Resilience for Agroforestry Systems under Climate Change Conditions. Sci. Total Environ. 2023, 869, 161763. [Google Scholar] [CrossRef]
- Ma, X.; Zhang, J.; Wang, P.; Zhou, L.; Sun, Y. Estimating the Nonlinear Response of Landscape Patterns to Ecological Resilience Using a Random Forest Algorithm: Evidence from the Yangtze River Delta. Ecol. Indic. 2023, 153, 110409. [Google Scholar] [CrossRef]
- Ge, T.; Hao, Z.; Chen, Y. How Environmental Policy Synergy Can Enhance Urban Ecological Resilience: Insights from Text Mining Analysis in China. Humanit. Soc. Sci. Commun. 2025, 12, 656. [Google Scholar] [CrossRef]
- Ning, X.; Zhao, J.; An, Y. Urbanization and Urban Ecological Resilience in Resource-Based Cities: Coupling Coordination and Its Key Factors. Environ. Dev. Sustain. 2024; in press. [Google Scholar] [CrossRef]
- Wang, Y.; Song, M.; Zhu, S.; Jiang, Z.; Zhang, Z. Coupling Study on Ecological Resilience and Urban-Rural Integrated Development in China. Front. Environ. Sci. 2025, 13, 1552533. [Google Scholar] [CrossRef]
- Li, D.; Yang, W.; Huang, R. The Multidimensional Differences and Driving Forces of Ecological Environment Resilience in China. Environ. Impact Assess. Rev. 2023, 98, 106954. [Google Scholar] [CrossRef]
- Zhan, S.; Zhang, X. Coupled Climate–Environment–Society–Ecosystem Resilience Coordination Analytical Study—A Case Study of Zhejiang Province. Sustainability 2024, 16, 5746. [Google Scholar] [CrossRef]
- Yuan, Y.; Bai, Z.; Zhang, J.; Xu, C. Increasing Urban Ecological Resilience Based on Ecological Security Pattern: A Case Study in a Resource-Based City. Ecol. Eng. 2022, 175, 106486. [Google Scholar] [CrossRef]
- Tang, Y.; Wang, Y. Impact of Digital Economy on Ecological Resilience of Resource-Based Cities: Spatial Spillover and Mechanism. Environ. Sci. Pollut. Res. 2023, 30, 41299–41318. [Google Scholar] [CrossRef] [PubMed]
- Li, J.; Nie, W.; Zhang, M.; Wang, L.; Dong, H.; Xu, B. Assessment and Optimization of Urban Ecological Network Resilience Based on Disturbance Scenario Simulations: A Case Study of Nanjing City. J. Clean. Prod. 2024, 438, 140812. [Google Scholar] [CrossRef]
- Zhang, T.; Sun, Y.; Zhang, X.; Yin, L.; Zhang, B. Potential Heterogeneity of Urban Ecological Resilience and Urbanization in Multiple Urban Agglomerations from a Landscape Perspective. J. Environ. Manag. 2023, 342, 118129. [Google Scholar] [CrossRef]
- Lei, Y.; Xiao, Y.; Wang, F.; Wang, R.; Huang, H. Investigation on the Complex Relationship between Urbanization and Eco-Efficiency in Urban Agglomeration of China: The Case Study of Chengdu-Chongqing Urban Agglomeration. Ecol. Indic. 2024, 159, 111704. [Google Scholar] [CrossRef]
- Zhang, Y.; Yang, R.; Sun, M.; Lu, Y.; Zhang, L.; Yin, Y.; Li, X. Identification of Spatial Protection and Restoration Priorities for Ecological Security Pattern in a Rapidly Urbanized Region: A Case Study in the Chengdu–Chongqing Economic Circle, China. J. Environ. Manag. 2024, 366, 121789. [Google Scholar] [CrossRef]
- Zhang, H.; Deng, W.; Zhang, S.; Peng, L.; Liu, Y. Impacts of Urbanization on Ecosystem Services in the Chengdu-Chongqing Urban Agglomeration: Changes and Trade-Offs. Ecol. Indic. 2022, 139, 108920. [Google Scholar] [CrossRef]
- Liu, L.; Liang, Y.; Hashimoto, S. Integrated Assessment of Land-Use/Coverage Changes and Their Impacts on Ecosystem Services in Gansu Province, Northwest China: Implications for Sustainable Development Goals. Sustain. Sci. 2020, 15, 297–314. [Google Scholar] [CrossRef]
- Xiao, R.; Liu, Y.; Fei, X.; Yu, W.; Zhang, Z.; Meng, Q. Ecosystem Health Assessment: A Comprehensive and Detailed Analysis of the Case Study in Coastal Metropolitan Region, Eastern China. Ecol. Indic. 2019, 98, 363–376. [Google Scholar] [CrossRef]
- Wang, K.; Ma, H.; Fang, C. The Relationship Evolution between Urbanization and Urban Ecological Resilience in the Northern Slope Economic Belt of Tianshan Mountains, China. Sustain. Cities Soc. 2023, 97, 104783. [Google Scholar] [CrossRef]
- Diakoulaki, D.; Mavrotas, G.; Papayannakis, L. Determining Objective Weights in Multiple Criteria Problems: The Critic Method. Comput. Oper. Res. 1995, 22, 763–770. [Google Scholar] [CrossRef]
- Vinogradova-Zinkevič, I. Centroidous Method for Determining Objective Weights. Mathematics 2024, 12, 2269. [Google Scholar] [CrossRef]
- Liu, L.; Dong, X.; Fu, T. The Spatiotemporal Dynamics of Regional Resilience in China from 2000 to 2022. J. Ind. Ecol. 2025, 29, 1151–1166. [Google Scholar] [CrossRef]
- Hair, J.F.; Risher, J.J.; Sarstedt, M.; Ringle, C.M. When to Use and How to Report the Results of PLS-SEM. Eur. Bus. Rev. 2019, 31, 2–24. [Google Scholar] [CrossRef]
- Wang, C.; Ma, L.; Zhang, Y.; Chen, N.; Wang, W. Spatiotemporal Dynamics of Wetlands and Their Driving Factors Based on PLS-SEM: A Case Study in Wuhan. Sci. Total Environ. 2022, 806, 151310. [Google Scholar] [CrossRef] [PubMed]
- Zhao, Z.; Fu, B.; Lü, Y.; Li, T.; Deng, L.; Wang, Y.; Lü, D.; Wang, Y.; Wu, X. Variable Climatic Conditions Dominate Decreased Wetland Vulnerability on the Qinghai—Tibet Plateau: Insights from the Ecosystem Pattern-Process-Function Framework. J. Clean. Prod. 2024, 458, 142496. [Google Scholar] [CrossRef]
- Yang, L.; Li, Y.; Yu, L.; Chen, M.; Yu, M.; Zhang, Y. Theory and Case of Land Use Transition Promoting Ecological Restoration in Karst Mountain Areas of Southwest China. Ecol. Indic. 2024, 158, 111393. [Google Scholar] [CrossRef]
- Tang, J.; Zhou, L.; Dang, X.; Hu, F.; Yuan, B.; Yuan, Z.; Wei, L. Impacts and Predictions of Urban Expansion on Habitat Quality in the Densely Populated Areas: A Case Study of the Yellow River Basin, China. Ecol. Indic. 2023, 151, 110320. [Google Scholar] [CrossRef]
- Li, L.; Ma, S.; Zheng, Y.; Xiao, X. Integrated Regional Development: Comparison of Urban Agglomeration Policies in China. Land Use Policy 2022, 114, 105939. [Google Scholar] [CrossRef]
- Cumming, G.S.; Buerkert, A.; Hoffmann, E.M.; Schlecht, E.; Von Cramon-Taubadel, S.; Tscharntke, T. Implications of Agricultural Transitions and Urbanization for Ecosystem Services. Nature 2014, 515, 50–57. [Google Scholar] [CrossRef]
- Xu, C.; Huo, X.; Hong, Y.; Yu, C.; De Jong, M.; Cheng, B. How Urban Greening Policy Affects Urban Ecological Resilience: Quasi-Natural Experimental Evidence from Three Megacity Clusters in China. J. Cleaner Prod. 2024, 452, 142233. [Google Scholar] [CrossRef]
- Radmehr, R.; Shayanmehr, S.; Baba, E.A.; Samour, A.; Adebayo, T.S. Spatial Spillover Effects of Green Technology Innovation and Renewable Energy on Ecological Sustainability: New Evidence and Analysis. Sustain. Dev. 2024, 32, 1743–1761. [Google Scholar] [CrossRef]
- Block, J.; Lambrecht, D.; Willeke, T.; Cucculelli, M.; Meloni, D. Green Patents and Green Trademarks as Indicators of Green Innovation. Res. Policy 2025, 54, 105138. [Google Scholar] [CrossRef]
- Yang, J.; Huang, X. The 30 m Annual Land Cover Dataset and Its Dynamics in China from 1990 to 2019. Earth Syst. Sci. Data 2021, 13, 3907–3925. [Google Scholar] [CrossRef]
- Luedeling, E.; Buerkert, A. Typology of Oases in Northern Oman Based on Landsat and SRTM Imagery and Geological Survey Data. Remote Sens. Environ. 2008, 112, 1181–1195. [Google Scholar] [CrossRef]
- Xu, D.; Yang, F.; Yu, L.; Zhou, Y.; Li, H.; Ma, J.; Huang, J.; Wei, J.; Xu, Y.; Zhang, C.; et al. Quantization of the Coupling Mechanism between Eco-Environmental Quality and Urbanization from Multisource Remote Sensing Data. J. Cleaner Prod. 2021, 321, 128948. [Google Scholar] [CrossRef]
- Chen, Y.; Feng, X.; Fu, B.; Ma, H.; Zohner, C.M.; Crowther, T.W.; Huang, Y.; Wu, X.; Wei, F. Maps with 1 Km Resolution Reveal Increases in Above- and Belowground Forest Biomass Carbon Pools in China over the Past 20 Years. Earth Syst. Sci. Data 2023, 15, 897–910. [Google Scholar] [CrossRef]
- Limu, M.; Huang, S.; Wang, J. Temporal and Spatial Changes of Vegetation Phenology and Its Correlation with Net Primary Productivity in Northeast China from 2001 to 2022. IEEE Geosci. Remote Sens. Lett. 2024, 21, 1–5. [Google Scholar] [CrossRef]
- Wu, Y.; Shi, K.; Chen, Z.; Liu, S.; Chang, Z. An Improved Time-Series DMSP-OLS-like Data (1992-2024) in China by Integrating DMSP-OLS and SNPP-VIIRS; Harvard Dataverse: Cambridge, MA, USA, 2021. [Google Scholar] [CrossRef]
- Xia, J.; Wei, W.; Yin, L.; Hong, M. Spatiotemporal Characteristics and Mechanisms of Agricultural Space Urbanization in Yangtze River Economic Belt, China. J. Geogr. Sci 2025, 35, 1159–1182. [Google Scholar] [CrossRef]
- O’Brien, R.M. A Caution Regarding Rules of Thumb for Variance Inflation Factors. Qual. Quant. 2007, 41, 673–690. [Google Scholar] [CrossRef]
- Meng, F.; Guo, J.; Guo, Z.; Lee, J.C.K.; Liu, G.; Wang, N. Urban Ecological Transition: The Practice of Ecological Civilization Construction in China. Sci. Total Environ. 2021, 755, 142633. [Google Scholar] [CrossRef] [PubMed]
- Lei, X.; Liu, H.; Li, S.; Luo, Q.; Cheng, S.; Hu, G.; Wang, X.; Bai, W. Coupling Coordination Analysis of Urbanization and Ecological Environment in Chengdu-Chongqing Urban Agglomeration. Ecol. Indic. 2024, 161, 111969. [Google Scholar] [CrossRef]
- Chen, Y.; Tian, W.; Zhou, Q.; Shi, T. Spatiotemporal and Driving Forces of Ecological Carrying Capacity for High-Quality Development of 286 Cities in China. J. Cleaner Prod. 2021, 293, 126186. [Google Scholar] [CrossRef]
- Chen, L.; Guo, H.; He, S.; Chen, Z.; Lou, Z.; Lu, R.; Zhou, L.; Shi, Z.; Ye, S. Human Activities Accelerate Recovery of Gross Ecosystem Product Following Vegetation Disturbances. Earth Crit. Zone 2025, 2, 100048. [Google Scholar] [CrossRef]
- Turner, B.; Devisscher, T.; Chabaneix, N.; Woroniecki, S.; Messier, C.; Seddon, N. The Role of Nature-Based Solutions in Supporting Social-Ecological Resilience for Climate Change Adaptation. Annu. Rev. Environ. Resour. 2022, 47, 123–148. [Google Scholar] [CrossRef]
- Gao, J.; Zou, C.; Zhang, K.; Xu, M.; Wang, Y. The Establishment of Chinese Ecological Conservation Redline and Insights into Improving International Protected Areas. J. Environ. Manag. 2020, 264, 110505. [Google Scholar] [CrossRef]
- Li, H.; Du, G.; Qamri, G.M.; Li, S. Green Innovation and Natural Resource Efficiency: The Role of Environmental Regulations and Resource Endowment in Chinese Cities. J. Environ. Manag. 2024, 370, 122338. [Google Scholar] [CrossRef] [PubMed]
- Aşıcı, A.A. Economic Growth and Its Impact on Environment: A Panel Data Analysis. Ecol. Indic. 2013, 24, 324–333. [Google Scholar] [CrossRef]
- Li, C.J.; Razzaq, A.; Irfan, M.; Luqman, A. Green Innovation, Environmental Governance and Green Investment in China: Exploring the Intrinsic Mechanisms under the Framework of COP26. Technol. Forecast. Soc. Change 2023, 194, 122708. [Google Scholar] [CrossRef]
- Radzi, A. The Ruhr Innovation Ecosystem—From Industrial Brownfields to Regenerative Smart Environments. In Intelligent Environments; Elsevier: Amsterdam, The Netherlands, 2023; pp. 33–85. [Google Scholar] [CrossRef]
- Wang, H.; Ge, Q. Ecological Resilience of Three Major Urban Agglomerations in China from the “Environment–Society” Coupling Perspective. Ecol. Indic. 2024, 169, 112944. [Google Scholar] [CrossRef]
- Zhang, C.; Zhou, Y.; Yin, S. Interaction Mechanisms of Urban Ecosystem Resilience Based on Pressure-State-Response Framework: A Case Study of the Yangtze River Delta. Ecol. Indic. 2024, 166, 112263. [Google Scholar] [CrossRef]
- Lee, C.-C.; Yan, J.; Li, T. Ecological Resilience of City Clusters in the Middle Reaches of Yangtze River. J. Clean. Prod. 2024, 443, 141082. [Google Scholar] [CrossRef]
- Huang, J.; Zhong, P.; Zhang, J.; Zhang, L. Spatial-Temporal Differentiation and Driving Factors of Ecological Resilience in the Yellow River Basin, China. Ecol. Indic. 2023, 154, 110763. [Google Scholar] [CrossRef]


Disclaimer/Publisher’s Note: The statements, opinions and data contained in all publications are solely those of the individual author(s) and contributor(s) and not of MDPI and/or the editor(s). MDPI and/or the editor(s) disclaim responsibility for any injury to people or property resulting from any ideas, methods, instructions or products referred to in the content. |
© 2026 by the authors. Licensee MDPI, Basel, Switzerland. This article is an open access article distributed under the terms and conditions of the Creative Commons Attribution (CC BY) license.