Abstract
This study empirically examines the impact of the Areas subject to permission of transaction (ASPLT) implemented by Seoul City on local real estate markets. Focusing on the case of the Seoul International District (MICE project area), where the regulated area (the geo-graphical districts subject to ASPLT) was initially designated, lifted, and later re-imposed, the analysis employs a modified repeat sales Difference-in-Differences (DID) methodology to assess its policy effect on housing price stabilization. The results indicate that the regulated areas experienced more subdued transaction volumes and price increases compared to non-regulated areas, suggesting the policy was effective in curbing short-term speculative demand. Additionally, neighboring areas exhibited signs of spillover effects due to displaced investment interest. The findings highlight both the utility and limitations of localized real estate controls and offer empirical insights for future policy design.
1. Introduction
Many countries implement various real estate policies to suppress speculation and promote housing stability for their citizens. Broadly, these interventions in urban and regional planning can be categorized into people-based policies and place-based policies [1]. For instance, as people-based interventions, countries like Canada and Hong Kong utilize taxation-based frameworks, while Singapore suppresses market overheating through loan-to-value (LTV) ratio regulations. On the other hand, place-based policies, which stabilize the market by restricting housing acquisitions within specific geographic zones, are observed in countries such as China and the Netherlands [2,3,4,5].
South Korea also enforces various systems to stabilize housing prices, employing place-based interventions like those in China and the Netherlands. Several policies aim to suppress short-term price surges by designating specific areas, including Speculative areas (투기지역), Overheated speculative zones (투기과열지구), and Areas subject to adjustment (조정대상지역). Specifically, Speculative areas focuses on tightening tax-related regulations, such as capital gains taxes, whereas Overheated speculative zones apply comprehensive restrictions across the housing market, including stringent loan-to-value (LTV) limits. Areas subject to adjustment impose similar controls but with relatively lower intensity. These systems are designated in regions where housing price appreciation significantly exceeds inflation, aimed at stabilizing the real estate market through either broad or localized zoning controls. Among them, the Areas subject to permission of transaction (토지거래허가구역, hereafter, ASPLT) requires prior approval from local authorities before finalizing land transaction contracts. This system applies to areas with active speculative trades or where land price increases are expected and is typically enforced for up to five years. It not only applies to land transactions but also to buildings traded along with land shares, imposing constraints on housing transactions to curb rapid price increases.
As of December 2025, the area designated as ASPLT by the Mayor of Seoul covers 164.51 km2, accounting for 27.18% of the city’s total area. Most of these areas are locations where redevelopment or reconstruction projects are either underway or planned [6]. Notably, in October 2025, the Minister of Land, Infrastructure, and Transport designated 12 locations in the Gyeonggi region along with the entirety of Seoul as the ASPLT, resulting in an unprecedented wide-scale designation.
In Seoul’s Gangnam district, the Seoul International District development project is currently underway. On 23 June 2020, the Mayor of Seoul designated the surrounding area as the ASPLT. This designation drew significant attention as it imposed stringent restrictions over a much broader geographic area than previous site-specific interventions. The regulatory history of this zone involves a unique temporal sequence: it was initially designated on 23 June 2020, briefly lifted on 12 February 2025, and subsequently re-designated only a month later on 24 March 2025. This sequence mirrors the concerns raised by Li et al. [7] regarding housing purchase restrictions in China; in the case of Seoul, the immediate re-designation suggests an inability to mitigate the rapid rebound in market prices that occurred following the temporary easing of restrictions. Regarding this re-designation, some proponents argued that the measures were necessary to maintain policy consistency and ensure market stabilization, while critics contended that the abrupt shifts in regulatory status caused undue confusion within the real estate market.
The Gangnam district is characterized by the highest price levels in Seoul and has long been a focal point for speculative investment. Consequently, numerous studies have examined whether the ASPLT designations in this area have effectively fostered housing market stability. Some scholars argue that the regulation has had a limited impact, observing a decrease in transaction volumes without a significant corresponding effect on prices [8]. Others have pointed out that the price suppression effect remains ambiguous, instead triggering substitution effects in unregulated neighboring areas [9,10]. However, a critical limitation of most existing literature is the reliance on administrative “Dong” units to analyze the ripple effects of the regulation. These studies tend to estimate price increases by assuming that demand simply shifts to areas within a certain distance. Yet, such an approach makes it difficult to definitively attribute these shifts to the ASPLT designation alone, as it fails to isolate the policy effect from other confounding market factors [1].
In contrast, empirical research on similar interventions in China, such as the Home-Purchase Limit policy, demonstrates that while these restrictions suppress local price appreciation and transaction volumes, they simultaneously trigger spillover effects that drive up prices in adjacent areas [3,4,5]. These findings underscore the necessity of accounting for the immediate spatial proximity to regulated zones. In the domestic context, studies by Kim (2022, 2025) [1,11] have sought to verify these spillover effects based on distance from the ASPLT, providing a more granular spatial perspective than traditional administrative boundary-based analyses.
Therefore, this study aims to empirically assess the effects of the ASPLT on the real estate market. The primary goal is to quantify the impact of the regulation on property prices and evaluate both its effectiveness and its unintended consequences. Specifically, this study addresses two primary research questions. First, we examine whether housing prices in the regulated area (the geographical districts subject to ASPLT) stabilized following the designation, compared to non-regulated area. In this context, “price stabilization” is defined as a state where price appreciation in the regulated area—which originally stood to gain significant development premiums—is moderated to a level consistent with general market trends, showing no disproportionate increase over the non-regulated area.
Second, we investigate the presence and extent of the spillover effect in adjacent areas. As stringent restrictions made transactions difficult within the Seoul International District, demand likely shifted toward neighboring properties in anticipation of reflected benefits. To capture this dynamic, we conduct a granular analysis to quantify how these unintended consequences manifested in adjacent regions at varying distances.
To empirically test these questions, we employ a Difference-in-Differences (DID) framework combined with a Modified Repeat Sales Model. This approach is a widely utilized methodology for evaluating the impact of policy interventions.
2. Existing Research on Method
To analyze these policy impacts in Korea, several studies have utilized the Difference-in-Differences method to analyze the effects of regulatory zone designations or loan regulations [12,13]. This methodology allows for the analysis of impacts stemming from specific regulations or physical facilities. It measures policy effectiveness by calculating the difference in target variables before and after policy implementation between a treatment group and a control group [14].
In the real estate field, there has been active debate on how public housing for low-income populations affects surrounding property prices. Koschinsky (2009) [15] analyzed the effects of both assisted and unassisted rental housing on neighboring home prices using an Adjusted Interrupted Time Series (AITS) DID model. The study found that assisted rental housing contributed to price increases in low-income areas, while unassisted rental housing had a negative impact. Ko and Kim (2022) [16] evaluated the effect of public rental housing in South Korea using a hedonic DID model, focusing on the Happy Housing Project in Seoul. The findings indicated that proximity to these developments negatively affected home values, demonstrating a NIMBY response. Blanco Fernández (2022) [17] studied estate regeneration projects in London involving mixed-income public housing using an Event Study DID approach, showing modest increases in property and rental prices within 100 m due to improved local amenities.
The DID methodology has also been applied beyond real estate. R. Tan et al. (2022) [18] investigated the practical effectiveness of the Ecological Redline (ERL) policy implemented in Wuhan, China. Their results indicated that the policy failed to meet its intended goals, as development activities actually increased within the designated restricted areas. David Maddison et al. (2023) [19] used a hedonic DID model to show that large-scale solar farms in Wales had no statistically significant effect on homes more than 750 m away.
Some studies have opted for repeat sales models over hedonic models to address omitted variable bias. While hedonic models require extensive work to construct variables and may suffer from insufficient controls, repeat sales models naturally remove time-invariant variables to mitigate bias. Jeong et al. (2018) [20] analyzed the effects of public rental housing in Seoul using the DID-based modified Repeat Sales Model. Results showed that National Rental Housing and Self-Built Long-Term Jeonse Housing had negative effects on nearby prices, while the impact of Self-Built Long-Term Jeonse Housing (Redevelopment-Purchase types) was inconclusive. Beltrán et al. (2018) [21] also used the DID-based modified Repeat Sales Model to analyze the impact of flood prevention infrastructure on nearby housing prices in England, finding that prices increased by 8.6% to 12.8% in urban areas but fell in rural areas.
Following these precedents, this study applies a Difference-in-Differences (DID) framework integrated with a Modified Repeat Sales Model to analyze the spatial impact of ASPLT designations on surrounding housing prices. Since the South Korean housing market is dominated by standardized apartment units (comprising approximately 60% of Seoul’s total housing stock), the identical housing unit assumption provides a distinct econometric advantage by effectively controlling for time-invariant individual property characteristics.
Accordingly, we have selected a methodological approach that integrates the repeat sales model into the Difference-in-Differences (DID) framework—a standard methodology widely utilized for evaluating place-based regulations—to effectively leverage the unique characteristics of the Korean housing market. This methodological choice was specifically made to establish a sustainable analytical framework; given that the regulated areas and policies in this study require continuous monitoring, this approach reduces the computational and data-related burden for providing periodic feedback on the policy’s evolving impact over time.
3. Materials and Methods
3.1. Study Area and Data
This study analyzes housing actual transaction data from apartment complexes located in the same Daily Activity Area as the Seoul International District development area, known as the Gangnam 4 Districts (Seocho-gu, Gangnam-gu, Songpa-gu, Gangdong-gu). The temporal scope spans from January 2006 to February 12, 2025, when the ASPLT was lifted. While earlier transactions are utilized for the repeat sales model, trends are primarily represented from January 2014, when the project was first announced. The study area includes the Gangnam 4 Districts and the Seoul International District project site (see Figure 1).
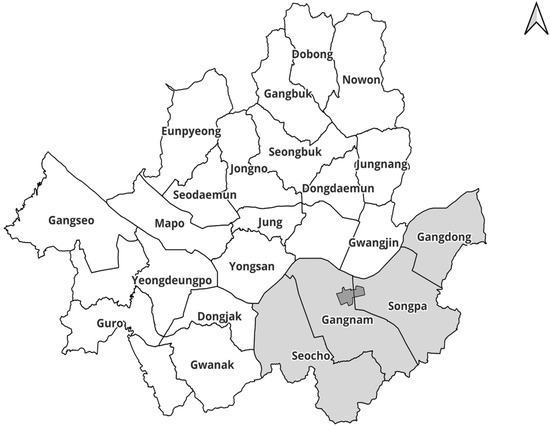
Figure 1.
Seoul International District development area and Gangnam 4 Districts. Light gray indicates Gangnam 4 Districts, and dark gray indicates the location of the Seoul International Distrct development area.
As noted in the introduction, the temporary lifting of the ASPLT followed by its rapid re-designation caused significant market volatility. Therefore, we excluded the period following the lifting from this analysis. We determined that a longer-term observation is required to accurately assess market trends after deregulation and that incorporating this brief, high-volatility window could necessitate additional analytical adjustments that fall outside the scope of this study.
As shown in Figure 2, the MICE project is underway in the dark gray area, and a restricted area (outlined in blue) has been designated under the ASPLT since 23 June 2020. This area spans 14.4 km2 and includes 305 apartment complexes. Unlike other ASPLT that typically cover only the project site, this designation encompassed a much broader area than the project boundary.
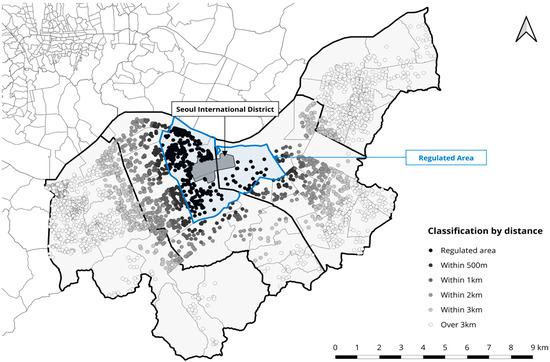
Figure 2.
Seoul International District and Regulated area.
The compiled dataset includes 315,053 apartment sales records. Specifically, the study area was divided into several sections based on the distance from the project site (Regulated Area, 500 m, 1 km, 2 km, 3 km, and over 3 km), and Table 1 presents the transaction volumes for each of these categorized groups across annual intervals. A sharp decline is observed after 2021 following the policy’s implementation. However, as seen in Figure 3, this period aligns with a broader market downturn across all of Seoul, requiring cautious interpretation.

Table 1.
Annual Apartment Transaction Volumes by Distance from the Project Site (unit: Number of transactions).
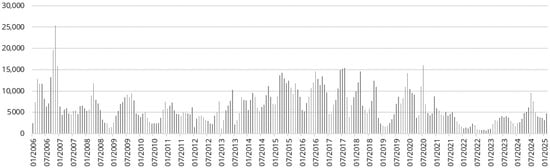
Figure 3.
Seoul Apartment Transaction Volume Trends.
Table 2 shows the descriptive statistics for prices per unit area (10,000 KRW/m2) within the study area. The average price exhibits a steady annual upward trend, with a particularly sharp increase observed between 2017 and 2021. Table 3 presents the price levels and changes per unit area across several sections based on the distance from the project site. Housing prices within 1 km of the regulated area were found to be relatively high. Based on the observed price differentials at the 1 km threshold, the study area can be categorized into three main analytical zones: the regulated area, areas within 1 km, and areas beyond 1 km. This 1 km threshold is also consistent with the 4000-feet impact radius identified by Kim (2025) [11] in the same geographical context.
Table 2.
Descriptive Statistics of Apartment Prices per Unit Area (10,000 KRW/m2) by Year.
Table 3.
Descriptive Statistics of Apartment Prices per Unit Area (10,000 KRW/m2) by section.
However, as seen in the transaction volumes and Table 1, the number of transaction cases in areas beyond 3 km is disproportionately high. Furthermore, as shown in Figure 4, the number of households as of 2024 varies by up to 3.4 times across different sections. Such disparities in sample size and residential density, illustrated in Figure 4, require cautious interpretation when evaluating average values across these distance-based segments.
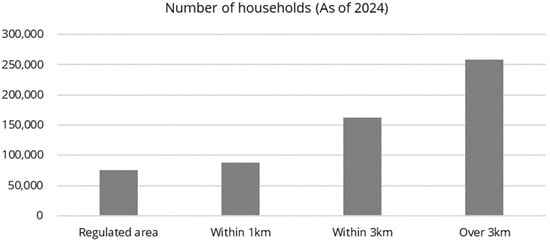
Figure 4.
Annual Trends of Average Apartment Prices per Unit Area by Distance Category.
3.2. Assumption of Identical Housing Units
This study constructs repeat sales pairs based on the assumption of identical housing units, a prerequisite for the repeat sales model. Since the model requires data pairs where the same asset is sold at least twice, establishing criteria to identify identical units is essential. Since individual building numbers are often unavailable in the accessible data, units were matched based on their address, year of construction, floor level, and unit size. Table 4 presents variations in the matching criteria for Assumptions 1 and 2, the repeat-sales data under each assumption, and the corresponding data utilization rates.
Table 4.
Summary of Data Filtering under Assumptions 1 and 2.
3.3. Methodology
3.3.1. General Repeat Sales Model
The repeat sales model was originally proposed by Bailey et al. (1963) [22]. While hedonic price models—which measure price impacts by controlling for key housing attributes—can utilize all available transaction data, they are susceptible to omitted variable bias if significant control variables are missing. Additionally, constructing a comprehensive set of control variables for each property can be data-intensive and challenging.
In contrast, the repeat sales model measures price appreciation by focusing solely on properties sold more than once, utilizing actual transaction prices without decomposing them into individual attributes. Although the requirement for repeated transactions limits the usable sample size, this limitation can be mitigated by adjusting the strictness of the identical housing unit assumption. More importantly, this approach avoids the biases and errors associated with attribute-level data construction and offers greater efficiency by not artificially decomposing prices.
The price index is constructed using the first and second transaction prices for a property that has been sold more than once. The model uses the natural logarithm of the price ratio as the dependent variable:
where takes the value 1 at the time of the second sale , −1 at the time of the first sale , and 0 otherwise. The cumulative price growth rate at each point is used to calculate the price index :
3.3.2. Modified Repeat Sales Model
Cross-sectional analyses using hedonic pricing face limitations such as bias and reduced efficiency when evaluating the spatial and temporal impacts of regulations. The repeat sales framework eliminates time-invariant characteristics by differencing, thus removing the need to explicitly control for all time-varying attributes [21]. This allows for a more accurate estimation of the effects of time-varying variables. To address the limitations of hedonic models while leveraging the advantages of the repeat sales approach, this study applies a modified repeat sales model incorporating the Difference-in-Differences (DID) concept [20,21].
This modified model estimates coefficients by considering time-varying variables alongside the standard time dummies. By differencing the prices from two transaction points of the same property, time-invariant attributes are eliminated. The model is specified as follows:
where is a policy implementation dummy (1 if the transaction occurred after 23 June 2020; 0 otherwise), and is a spatial dummy (1 if located within the regulated area; 0 otherwise). The coefficient represents the time dummy effect, and captures the treatment effect after policy implementation. Since the dependent variable is log-transformed, the coefficient must be exponentiated for interpretation: represents the gross change rate, and represents the net change rate. However, a limitation of the coefficients estimated through the modified repeat sales DID model is that they represent the relative price difference between the treatment and control groups, rather than the absolute price effect within a single area [20].
While a visual examination of price level differences across various sections is conducted using the general repeat sales model, additional econometric models were constructed to ensure the robustness of the final analytical results. First, to observe the overall effects before and after the policy implementation across the entire study area, a model using dummy variables for transaction timing and implementation status was developed as follows:
where denotes the change in price growth following the implementation of the regulation relative to the pre-regulation period.
Furthermore, to verify whether the model design performs as intended, we estimate whether the regulated area exhibited inherently different price growth rates regardless of the actual timing of the policy implementation. The following equation aims to identify the specific price appreciation effects in the regulated area compared to other areas based on its spatial location:
where denotes the change in price growth in the regulated area relative to the non-regulated area.
On the other hand, as previously mentioned, considering the potential for spillover effects in neighboring areas, an additional analysis was conducted by further subdividing the spatial structure. In this framework, the area is categorized into the regulated area and the adjacent impact area (buffer area, , set within a specific distance range) to account for localized policy impacts more comprehensively.
where denotes the treatment effect after policy implementation for , respectively.
4. Results and Discussion
The study divided the spatial scope based on the 1 km threshold, where price levels are similar to those of the regulated area. The general repeat sales indices for each section are illustrated in the figures below. The vertical dotted lines in the graphs represent the time of policy designation (June 2020). For each assumption, the left graphs show the long-term trends from January 2014, while the right graphs provide a zoomed-in view of the indices from January 2020 (Figure 5 and Figure 6).
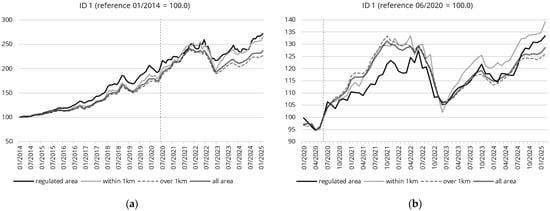
Figure 5.
Index of Assumption 1 (relaxed assumptions). (a) This graph depicts the long-term time series of price increases in each district, with January 2014 as the base year; (b) This graph depicts the price increases in each district compared to the time of regulation implementation, with June 2020 (the base year) as the base year. The dotted lines in both graphs indicate June 2020, when the policy was implemented.
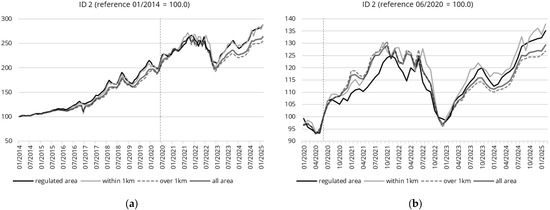
Figure 6.
Index of Assumption 2 (strengthened assumptions). (a) This graph depicts the long-term time series of price increases in each district, with January 2014 as the base year; (b) This graph depicts the price increases in each district compared to the time of regulation implementation, with June 2020 (the base year) as the base year. The dotted lines in both graphs indicate June 2020, when the policy was implemented.
The analysis from January 2014 indicates that the regulated area experienced higher price appreciation compared to other areas prior to the regulation. Furthermore, the zoomed-in graphs from June 2020 show that in both assumptions, price growth in the regulated area was suppressed immediately following the designation. Specifically, three months after the regulation, prices in the regulated area rose by only 3–6%, whereas non-regulated areas saw a more substantial increase of 6–10%. However, during the general market downturn in 2022, all areas declined simultaneously, after which the regulated area showed a slightly higher growth rate compared to the overall study area. This suggests that the policy was effective in terms of price stabilization for approximately two years immediately after the designation, but the regulatory effect diminished following the market downturn.
Prior to the primary DID analysis, we examined the parallel trends assumption through a quarterly repeat-sales event study model to compare the treatment and control groups (Figure 7). By aggregating monthly data into quarters, we aimed to mitigate short-term volatility and capture medium-to-long-term dynamics. The results show that most coefficients for the pre-treatment period fluctuate around zero, with confidence intervals consistently including zero and no evident systematic trend. This indicates that there were no significant systematic differences in price trends between the two groups prior to the policy intervention, thereby supporting the validity of the parallel trends assumption for our DID framework.
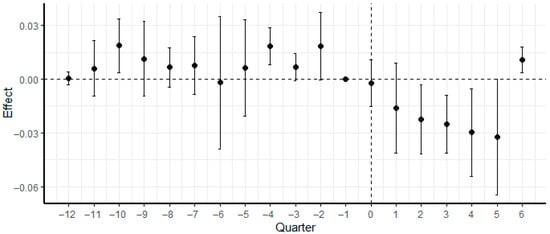
Figure 7.
Parallel trends effect on ∆log(price). The vertical dotted line in the graph marks the quarter including June 2020, when the policy was implemented, while the horizontal dotted line represents zero.
Table 5 and Table 6 presents the results of the policy effectiveness analysis using the modified repeat sales model. Model -1 (where ‘’ denotes the assumption identification number) aims to verify the price stabilization effect by comparing the regulated area with the non-regulated group. Model -2 considers the adjacent 1 km buffer area alongside the regulated area to examine both the stabilization effect relative to the unaffected area and the occurrence of a “balloon effect” (spillover effect) in the adjacent area. Model -3 measures the relative price growth rate across the entire study area after implementation compared to the period before. Model -4 examines the inherent price growth rate of the regulated area relative to other areas to supplement the interpretation of Models -1 and -2. Model -2 is the primary focus for identifying the relative price effects in the regulated and adjacent impact areas. Consequently, all models indicate that prices in the regulated area rose relatively less, while areas within the 1 km buffer saw slightly higher increases, suggesting the presence of a spillover effect.
Table 5.
Result of modified repeat sales model (Assumption 1).
Table 6.
Result of modified repeat sales model (Assumption 2).
Examining each model in detail, Model -1, which identifies the effect through the interaction term between the regulated area and policy implementation, shows that post-implementation, the regulated area’s growth was lower than that of the exterior by −2.2% −2.2% (), −1.9%() for each assumption, respectively; these results were statistically significant. This suggests a clear price stabilization effect following the regulation, as visually observed in the general repeat sales model. However, as identified in prior research [11], there was a concern that the inclusion of areas within 1 km—where spillover effects are present—could lead to an overestimation of the regulatory impact (downward bias in price estimates). To address this potential bias, we considered Model -2, which explicitly separates the adjacent impact area from the control group to ensure a more robust evaluation of the policy effect.
Model -2, which includes an additional interaction term for the adjacent impact area (within 1 km) where a spillover effect might occur, shows that prices in this area rose by 1.1%(), 0.3%() more, respectively. This suggests a potential spillover effect where some demand from the regulated area migrates to adjacent areas. However, the estimate for Assumption 2 was not statistically significant.
However, the estimate for Assumption 2 was not statistically significant. This lack of significance may be attributed to the increasingly stringent matching criteria, which significantly reduced the number of paired transaction cases—particularly in more recent periods—thereby diminishing statistical power. Nevertheless, both Assumption 1 (which leverages a broader market dataset) and Assumption 2 (which utilizes strictly identical housing units) consistently show the inclusion of spillover effects in adjacent areas, reinforcing the robustness of our spatial interpretation.
Furthermore, the results of Model -3 show that the overall price growth rate of the study area increased by approximately 1.7–2.2% after the regulation. As shown in Model -4, the regulated area inherently possesses a price growth rate approximately 0.3–0.4% higher than the exterior, regardless of policy implementation. These results indicate that the regulation was implemented during a period of overall market appreciation and that the regulated area inherently exhibited a higher price growth trend. When these factors are considered alongside the findings from Models -1 and -2, the relative decrease in the price growth rate of the regulated area—even after accounting for general market fluctuations and district-specific trends—supports the robustness of the conclusion that the policy functioned to stabilize prices. However, as the model characteristics derive average values for the entire period before and after the regulation, caution is required in interpretation.
5. Conclusions
This study aimed to empirically analyze whether the Areas subject to permission of land transaction (ASPLT)—a regulatory measure designed to curb real estate speculation in Seoul’s Gangnam district—in stabilizing the housing market. To achieve this, we employed a Modified Repeat Sales Model integrated with a Difference-in-Differences (DID) framework.
While this specific methodological combination has been rarely applied in evaluating the impact of place-based regulations, it presents a viable analytical framework for economically assessing such policies, particularly in standardized markets like the South Korean apartment sector. By leveraging the unique characteristics of these standardized units, this approach offers a more refined perspective on how geographic restrictions influence market dynamics over time.
Visual examination of the market price indices calculated through the general repeat sales model confirmed that the price growth rate in the regulated area became lower than that of non-regulated areas after the policy implementation. Furthermore, the estimates from the modified repeat sales model also confirmed a clear reduction in the price growth rate within the regulated area.
In the model that did not account for the adjacent impact area, the price appreciation of those adjacent areas was included within the overall control group. This led to a relative overestimation of the price suppression effect in the regulated area. In contrast, when the adjacent impact area was explicitly isolated, it exhibited a slight increase in price growth compared to the non-affected areas, suggesting a spatial shift in demand. Consequently, the observed reduction in the price growth rate within the regulated area appeared more moderate than in the results that focused solely on the regulated zone.
These findings align with the outcomes of place-based interventions such as China’s Home-Purchase Limit and the Netherlands’ purchase protection (Opkoopbescherming), both of which identified significant spillover effects in adjacent regions [2,3,4,5]. This underscores that accounting for such spatial externalities is a critical requirement for research evaluating the effectiveness of localized transaction-restricting regulations. Ultimately, we conclude that the interpretations based on Model -2 provide a more robust and accurate reflection of the policy’s impact.
Across the entire study area, the price growth rate in the regulated area was found to be approximately 0.3–0.4% lower relative to the exterior. This shows that the regulated area effectively slowed down price increases and calmed the speculative market. By aligning growth rates with the rest of the region, it suggests that the policy contributed to the stabilization of the housing market in the regulated area. Additionally, by incorporating the adjacent areas into the model, the existence of a spillover effect was confirmed. We expect this research to serve as a viable methodological alternative for the quantitative analysis of localized policy impacts.
However, this study has limitations, as it utilized the entire five years period following the policy implementation without further temporal subdivision. While the general repeat sales model visually suggested a stabilization effect for approximately two years followed by a return to pre-regulation growth rates, this study was unable to quantitatively distinguish the exact duration of the stabilization effect or the subsequent changes in growth rates.
Additionally, as noted in the introduction, the South Korean housing market continues to experience significant shifts, including the temporary lifting and subsequent re-designation of the ASPLT, alongside the progressive expansion of regulatory boundaries. A limitation of this study is that it does not account for the period following the deregulation due to the complexities in isolating policy effects amidst such rapid transitions. Consequently, future research should incorporate longer-term longitudinal data to evaluate how these evolving regulatory environments and market dynamics influence housing stability over an extended period. Specifically, there is a need for future studies to segment the analysis periods further to account for temporal heterogeneity. Research should also be expanded in both spatial and temporal scopes to address market fluctuations aligned with project progression, as well as regulatory shifts such as the lifting, re-designation, or expansion of designated zones. These aspects are deferred to future research.
Author Contributions
Conceptualization, C.-M.L. and K.-H.P.; methodology, C.-M.L., K.-H.P. and S.-H.C.; software, K.-H.P. and S.-H.C.; validation, C.-M.L., K.-H.P. and S.-H.C.; formal analysis, C.-M.L., K.-H.P. and S.-H.C.; investigation, K.-H.P.; data curation, K.-H.P.; writing—original draft preparation, writing—review and editing, C.-M.L., K.-H.P. and S.-H.C.; visualization, K.-H.P.; supervision, C.-M.L.; project administration, C.-M.L. All authors have read and agreed to the published version of the manuscript.
Funding
This research received no external funding.
Data Availability Statement
The original contributions presented in this study are included in the article. Further inquiries can be directed to the corresponding author.
Acknowledgments
During the preparation of this manuscript, the author(s) used Gemini 3 for the purposes of translating and refining grammar for improved readability and academic tone. The authors would like to acknowledge the support of AsRES International Real Estate Conference 2025, which enabled this work following the Best Paper Award recognition. The authors have reviewed and edited the output and take full responsibility for the content of this publication.
Conflicts of Interest
The authors declare no conflicts of interest.
Abbreviations
The following abbreviations are used in this manuscript:
| ASPLT | Areas subject to permission of land transaction |
| DID | Difference in Differences |
| MICE | A composite industry consisting of Meetings, Incentive Travel, Conventions, and Exhibitions. |
References
- Kim, H. The balloon effect of the land transaction permit system on neighboring areas (토지거래허가제가 인근지역에 미치는 풍선효과). Public Finance Forum 2022, 313, 8–29. Available online: https://www.kipf.re.kr/kor/Publication/KipfReport/kiPublish/CB1/view.do?serialNo=526868 (accessed on 20 January 2026).
- Francke, M.; Hans, L.; Korevaar, M.; van Bekkum, S. Buy-to-Live vs. Buy-to-Let: Homeownership and Residential Sorting in Housing Markets. SSRN. 2025. Available online: https://ssrn.com/abstract=4480261 (accessed on 20 January 2026).
- Somerville, T.; Wang, L.; Yang, Y. Using purchase restrictions to cool housing markets: A within-market analysis. J. Urban Econ. 2020, 115, 103189. [Google Scholar] [CrossRef]
- Gong, B.; Cang, J. Housing Regulation Spillovers: Buy-Rent Substitution and Spatial Multipliers in Urban China. Res. Sq. 2025, preprint. [Google Scholar] [CrossRef]
- Wu, G.; Guo, W.; Niu, X. Spillover effect analysis of home-purchase limit policy on housing prices in large and medium-sized cities: Evidence from China. PLoS ONE 2023, 18, e0280235. [Google Scholar] [CrossRef] [PubMed]
- Government, S.M. Status of Areas Subject to Land Transaction Permission (Seoul). Available online: https://land.seoul.go.kr/land/other/appointStatusSeoul.do (accessed on 20 January 2026).
- Yingxing, L.I.; Lu, T.; Meng, Y. Does the home-purchase restriction policy lower the growth rate of house price? Syst. Eng. Theory Pract. 2019, 39, 906–921. [Google Scholar] [CrossRef]
- Jeon, S.; SungYoung, K.; PARK, J. A Study on the Impact of Designation of Areas Subject to Permission of Land Transaction on Apartment Price. J. Converg. Soc. Public Policy 2025, 19, 169–189. [Google Scholar] [CrossRef]
- Yang, J.-Y.; HO, J.J. Evaluating the Balloon Effect of Land Transaction Permit Zones: A Case Study of Jamsil, Samseong, Daechi, and Cheongdam in Seoul. J. Korea Contents Assoc. 2025, 25, 447–460. [Google Scholar] [CrossRef]
- Lee, H.W.; Lee, C.-W. The Effects of Land Transaction Permit Zone Designation on Apartment Sale and Jeonse Prices: A Case Study of Jamsil-dong. Korea Real Estate Soc. 2025, 43, 161–180. [Google Scholar] [CrossRef]
- Kim, H. Place-based policy and spillovers in the housing market. Econ. Lett. 2025, 248, 112242. [Google Scholar] [CrossRef]
- Kim, D.; Yu, J. Measuring the Effectiveness of the Housing Speculative Zoning and De-Zoning. J. Korean Urban Manag. Assoc. 2014, 27, 191–212. Available online: https://www.kci.go.kr/kciportal/ci/sereArticleSearch/ciSereArtiView.kci?sereArticleSearchBean.artiId=ART001916680 (accessed on 20 January 2026).
- Yang, W.; Kim, H. A Study on Policy Effectiveness of Designation of Speculation Management District and Speculation Monitoring Area. J. Korea Real Estate Anal. Assoc. 2020, 26, 95–107. [Google Scholar] [CrossRef]
- Huntington-Klein, N. The Effect: An Introduction to Research Design and Causality; Chapman and Hall/CRC: Boca Raton, FL, USA, 2021. [Google Scholar]
- Koschinsky, J. Spatial Heterogeneity in Spillover Effects of Assisted and Unassisted Rental Housing. J. Urban Aff. 2009, 31, 319–347. [Google Scholar] [CrossRef]
- Ko, J.; Kim, C. The impacts of public housing program on housing prices: The case of South Korea. Int. J. Sustain. Build. Technol. Urban Dev. 2022, 13, 398–413. [Google Scholar] [CrossRef]
- Blanco Fernández, H. The Economic Effects of Public Housing Programs; Massachusetts Institute of Technology: Cambridge, MA, USA, 2022. [Google Scholar]
- Tan, R.; Liu, P.; Zhou, K.; He, Q. Evaluating the effectiveness of development-limiting boundary control policy: Spatial difference-in-difference analysis. Land Use Policy 2022, 120, 106229. [Google Scholar] [CrossRef]
- Maddison, D.; Ogier, R.; Beltrán, A. The Disamenity Impact of Solar Farms: A Hedonic Analysis. Land Econ. 2023, 99, 1–16. [Google Scholar] [CrossRef]
- Yu-Seon, J.; Je-Sun, H.; Chang-Moo, L. Differential effects of public housing by type on nearby housing prices: Focused on the SHift and National rental housing in Seoul. J. Korea Plan. Assoc. 2018, 53, 135–147. [Google Scholar] [CrossRef]
- Beltrán, A.; Maddison, D.; Elliott, R.J.R. Assessing the Economic Benefits of Flood Defenses: A Repeat-Sales Approach. Risk Anal. 2018, 38, 2340–2367. [Google Scholar] [CrossRef] [PubMed]
- Bailey, M.J.; Muth, R.F.; Nourse, H.O. A Regression Method for Real Estate Price Index Construction. J. Am. Stat. Assoc. 1963, 58, 933–942. [Google Scholar] [CrossRef]


Disclaimer/Publisher’s Note: The statements, opinions and data contained in all publications are solely those of the individual author(s) and contributor(s) and not of MDPI and/or the editor(s). MDPI and/or the editor(s) disclaim responsibility for any injury to people or property resulting from any ideas, methods, instructions or products referred to in the content. |
© 2026 by the authors. Licensee MDPI, Basel, Switzerland. This article is an open access article distributed under the terms and conditions of the Creative Commons Attribution (CC BY) license.