Abstract
Assessing ecosystem health in rapidly urbanizing watersheds requires policy-relevant and empirically grounded indicator systems. Focusing on the Luxi River Basin in Chengdu’s Tianfu New Area, this study develops an ecosystem health evaluation and restoration zoning scheme based on the Pressure–State–Response framework (PSR). Utilizing remote sensing land use maps for 2004, 2014, and 2024 with overall accuracy and Kappa above 85% and 0.80, respectively, a 13-indicator PSR health index with entropy-based weighting was constructed at the township and subdistrict scales. Aiming to support objective indicator selection and interpretation, multiscale landscape dynamics were further quantified using FRAGSTATS and moving window analysis, including mean patch area, patch density, landscape shape index, largest patch index, Shannon diversity index, Shannon evenness index, contagion index, and splitting index, and sensitive landscape descriptors and major driving factors were identified. Results show a shift in landscape patterns, from relatively aggregated configurations toward highly complex and fragmented ones. Largest patch dominance, measured by the largest patch index, declined from 66.71 to 22.79, while connectivity, measured by the contagion index, decreased from 59.74 to 45.10. Subdivision, measured by the splitting index, increased from 2.24 to 12.88, and compositional heterogeneity, measured by the Shannon diversity index, increased from 0.86 to 1.26. The PSR assessment indicates that demographic pressure intensified over time, whereas improvements in water resource supply, technological progress, and industrial upgrading partially alleviated overall pressure in some subregions. Ecosystem state exhibited strong spatial heterogeneity, with sustained high health in the eastern Longquan Mountain area and substantial improvement around Xinglong Lake, while northern urbanized and southern agricultural subregions lagged behind. Environmental governance responses strengthened, with the response index increasing from 0.2297 to 0.9885. Overall ecosystem health demonstrated a modest but stable improvement from 2004 to 2024, with 65.48% of the area revealing slight improvement, 1.14% experiencing substantial improvement, 29.62% remaining stable, and 3.76% experiencing slight degradation. Finally, restoration priority zones were delineated, and targeted strategies were introduced to inform basin-scale ecological management in the Luxi River Basin.
1. Introduction
As a national-level new area approved by the State Council, Chengdu Tianfu New Area in southwest China is responsible for promoting economic growth while serving as a demonstration zone for sustainable development and ecological civilization [1,2]. Located in the core of Tianfu New Area, the Luxi River Basin functions as a crucial ecological corridor linking the Science City cluster and the central business district. Accelerated urban construction and land development have recently triggered rapid land-use conversion and intensified human disturbance within the basin [3]. With the rapid transformation of natural land into anthropogenic uses, environmental stresses—such as water-quality deterioration and biodiversity loss—have become increasingly evident, undermining ecological functions and threatening ecosystem stability [4]. Against this backdrop, a basin-scale assessment of ecosystem health is urgently needed to support cross-jurisdictional environmental governance and evidence-based sustainable development in Tianfu New Area.
Since the 1980s, “ecosystem health” has become a key objective and research frontier in environmental management [5,6,7,8]. Drawing on the metaphor of human health, ecosystem health is generally defined as the capacity of an ecosystem to sustain its structure, functions, and resilience over time while continuously delivering essential services to society [9,10]. Early discussions focused on ecological “vital signs,” self-regulation capacity, and the absence of “distress syndrome” characteristics [11,12,13]. Schaeffer et al. (1988) pioneered quantitative approaches for detecting ecosystem degradation and identifying “sub-healthy” conditions [14]. In the early 1990s, Costanza et al. proposed that a healthy ecosystem should be sustainable, maintaining sufficient vigor and organization across relevant time scales and retaining resilience under external pressures [15]. These attributes constitute the well-known Vigor–Organization–Resilience (VOR) framework, which has been widely used to characterize intrinsic ecosystem functioning through using indicators [16,17,18,19].
For watershed ecosystem health assessment, two families of frameworks are commonly adopted: function-oriented frameworks, such as the VOR model, and management-oriented frameworks, such as the Pressure–State–Response (PSR) model [20,21,22,23,24]. The VOR framework effectively characterizes intrinsic ecosystem attributes, namely, vigor, organization, and resilience; however, this framework is primarily focused on diagnosing ecosystem condition (state) and is less explicit in structuring the causal pathways linking human-driven pressures to governance and management responses [25,26]. In contrast, the PSR model links anthropogenic pressures, ecosystem state, and societal responses in a clear cause–effect structure, making it particularly suitable for policy-relevant diagnosis and cross-sectoral decision-making in rapidly urbanizing regions [27,28]. For the Luxi River Basin, where ecosystem changes are closely coupled with land development, population growth, resource use, and environmental governance, a PSR-based framework provides an intuitive and operational structure for indicator organization and result interpretation.
However, a practical challenge in applying the PSR framework to complex, urbanizing watersheds lies in indicator-system construction. Many existing studies still rely heavily on literature synthesis and expert judgment for indicator selection and weighting, which can introduce substantial subjectivity and limited data-driven support; consequently, the resulting indicator systems may not fully capture the differentiated characteristics and dominant processes of specific regions [29,30,31,32]. Land-use/land-cover change (LULCC) and the associated evolution of landscape patterns are widely recognized as primary drivers of watershed ecological processes and key pathways of ecological functional degradation [33]. From a theoretical perspective, landscape-pattern evolution should be treated not merely as a descriptive outcome, but as a spatially explicit and process-oriented proxy that links anthropogenic land transformation to ecosystem-function dynamics. Yet, in many assessments, landscape-pattern information remains largely descriptive or correlation-oriented, and has not been sufficiently operationalized into process-relevant evidence for indicator development, data-driven screening, and mechanism interpretation [34,35,36]. For rapidly urbanizing basins such as the Luxi River, remotely sensed landscape metrics provide objective signals of fragmentation, dominance shifts, diversity dynamics, and connectivity alteration [37,38,39]. Recent empirical studies in metropolitan regions further demonstrate that landscape structure is dynamically coupled with ecosystem services, and that landscape-pattern–ecosystem-health relationships vary with urbanization stages and spatial heterogeneity [40,41]. Therefore, using observed landscape-pattern evolution as an empirical basis to identify sensitive landscape descriptors and related driving factors can strengthen PSR indicator construction, improve regional specificity and interpretability, and reduce arbitrariness.
Aiming to address these gaps, an ecosystem health assessment framework for the Luxi River Basin is proposed. This framework uses PSR as the policy-relevant organizing backbone while enriching the state subsystem with VOR-informed indicators and ecosystem function. Using land-use maps for 2004, 2014, and 2024, landscape-pattern evolution is quantified, and the observed changes are utilized to support the selection of sensitive landscape descriptors and landscape-related socioeconomic factors. Aiming to facilitate a data-driven and subjective indicator screening process. These empirically informed signals are then translated into candidate indicators for the PSR system. Using this framework, spatiotemporal ecosystem health dynamics are revealed at the township and subdistrict scales, and differentiated restoration zoning and management strategies are derived for basin governance.
Based on the above framework, this study addresses the following research questions: (1) How can a PSR indicator system be constructed for an urbanizing watershed using landscape-pattern evolution to support a data-driven and systematic indicator-screening process? (2) What are the spatiotemporal patterns of ecosystem health change in the Luxi River Basin from 2004 to 2024, and what mechanisms are likely associated with rapid urbanization and land-use conversion? (3) At the township and subdistrict administrative-unit scale, how does ecosystem health vary and evolve across the basin, and how can these differences be translated into restoration zoning, differentiated restoration, and management strategies? Answering these questions will help deepen our understanding of ecosystem health dynamics in rapidly developing regions and provide scientific support for ecological management, spatial planning, and sustainable governance in Tianfu New Area.
2. Materials and Methods
Figure 1 presents the technical roadmap of the study.
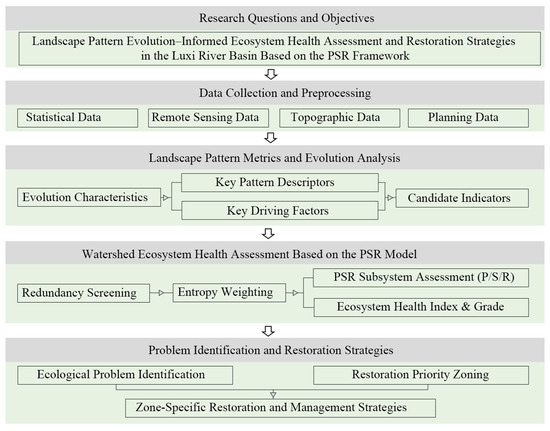
Figure 1.
Technical roadmap of the study.
2.1. Study Area
The study area is the Luxi River Basin in Sichuan Province, Southwest China, covering parts of Chengdu and Meishan and located in the core of Chengdu Tianfu New Area (Figure 2). The basin is dominated by plains and low hills, with elevations ranging from 427 m to 1021 m. Topography generally decreases from northeast to southwest, and the higher terrain on the eastern side corresponds to the Longquan Mountains (Figure 3). The basin has a subtropical humid monsoon climate, with a mean annual temperature of approximately 17.5 °C and a mean annual precipitation of approximately 1124.6 mm.
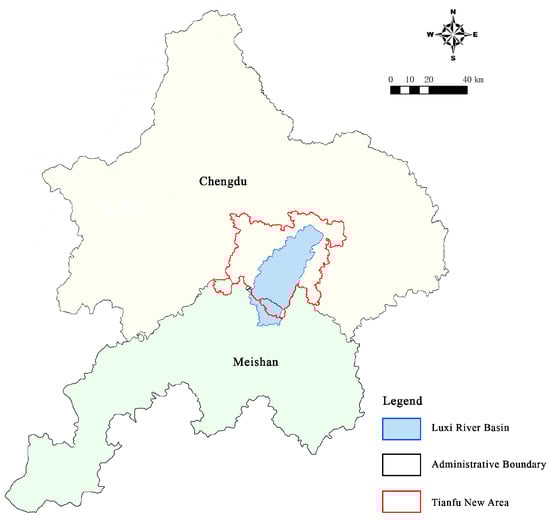
Figure 2.
Location map of the Luxi River Basin.
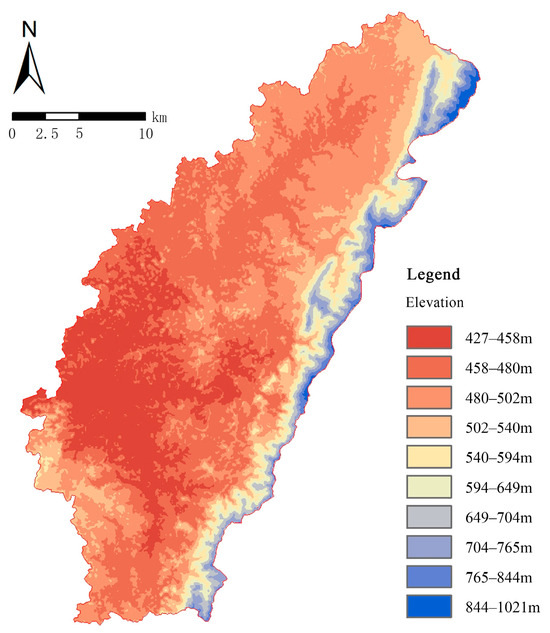
Figure 3.
Elevation of the Luxi River Basin.
As one of the major river systems in the directly administered area of Tianfu New Area, the Luxi River is a crucial water source for Xinglong Lake and a first-order tributary of the Jinjiang River, which is itself a tributary of the Minjiang River. The river is 74.6 km long, and the basin covers approximately 697 km2, covering 17 township-level administrative units (Figure 4). Runoff is primarily generated from precipitation in the Longquan Mountains, and the hydrograph is characterized by rapid rises and falls. The maximum flood discharge reaches approximately 1340 m3/s, whereas the minimum dry-season flow is approximately 0.02 m3/s, with a multi-year mean flow of approximately 5.72 m3/s. Baseflow is relatively low, and self-purification capacity is limited. Coupled with lagging rural sewage treatment and agricultural nonpoint source pollution, river water quality in the basin has long remained at Grade V under national surface-water standards.
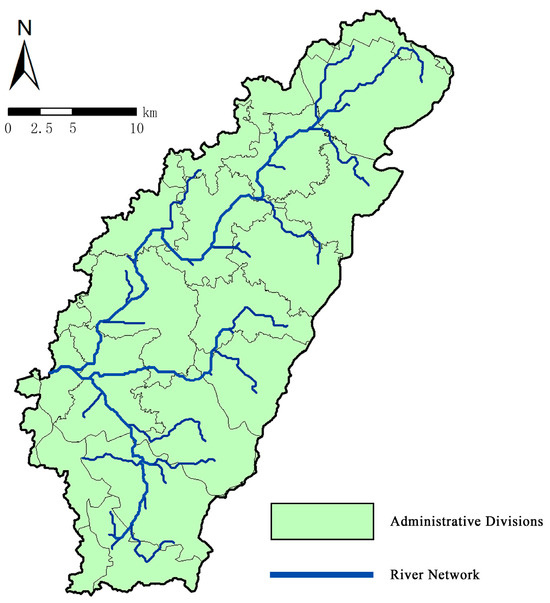
Figure 4.
Hydrographic network of the Luxi Basin.
2.2. Data Collection and Preprocessing
The various data types used in this study, along with their sources and purposes, are summarized in Table 1. Given the complex topography, strong hydrological variability, and distinct differences in economic development across the Luxi River Basin, this study uses administrative regions as the basic units for ecosystem health evaluation, to effectively capture intra-regional differences and management needs (Figure 5). Three time points—the years 2004, 2014, and 2024—were selected for ecosystem health assessment.

Table 1.
Data sources and their applications.
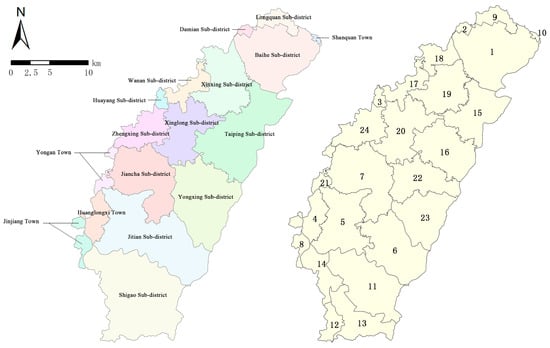
Figure 5.
Administrative divisions and evaluation units for ecosystem health assessment in the Luxi River Basin.
Land in the study area was classified into the following six categories: built-up land, cropland, grassland, forest land, water bodies, and unused land. ENVI 5.6 was used to interpret remote sensing images of the study area for the years 2004, 2014, and 2024, generating initial land use maps for each period. A post-classification refinement was then performed by eliminating small patches and correcting the classification to ensure accurate results. Accuracy assessment using confusion matrices showed an overall classification accuracy above 85% and Kappa coefficients greater than 0.80 for all three periods, thus meeting the required precision. The land-use classification results for 2004–2024 are shown in Figure 6.
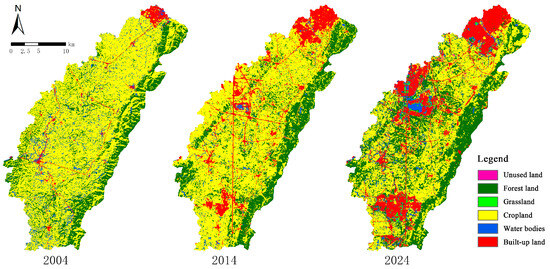
Figure 6.
Land-use classification of the Luxi River Basin (2004, 2014, and 2024).
2.3. Landscape Metrics Analysis
Aiming to characterize basin-wide landscape-pattern changes from multiple dimensions, including fragmentation, shape complexity, dominance, diversity, and aggregation, the following landscape-level metrics were selected: Mean Patch Area (AREA_MN), Patch Density (PD), Landscape Shape Index (LSI), Largest Patch Index (LPI), Shannon’s Diversity Index (SHDI), Shannon’s Evenness Index (SHEI), Contagion Index (CONTAG), and Splitting Index (SPLIT) (Table 2). Overall, these metrics quantify patch size and abundance, edge and shape complexity, largest patch dominance, compositional diversity and evenness, and the degree of spatial clumping versus subdivision, thereby providing an integrated description of landscape-pattern evolution in the basin.
Table 2.
Selected landscape-level metrics used to characterize landscape-pattern evolution in the Luxi River Basin.
Landscape metrics were computed in FRAGSTATS 4.2 using the no-sampling (exhaustive) option. To simultaneously characterize basin-scale temporal trajectories and within-basin spatial heterogeneity, spatially explicit metric surfaces were generated via moving-window analysis, with scale parameters determined through a two-step calibration prior to mapping. First, grain sensitivity was evaluated on land-use rasters for 2004, 2014, and 2024 across 30–150 m at 10 m increments. The adjacent-grain change rate reached its minimum at 40–50 m and then increased sharply at 50–60 m, indicating a transition near 50 m from a relatively stable scale domain to accelerated information loss (Figure A1). A joint assessment using the metric deviation index (MDI) and area-loss index (Si) further identified 50 m as the most suitable grain (Figure A2). Second, with grain fixed at 50 m, window sizes of 100, 150, 200, 250, and 300 m were compared. Increasing window size from 150 m to 200 m substantially improved noise suppression, whereas windows ≥ 250 m caused faster edge-detail loss. Therefore, 200 m was selected as the best denoising–detail trade-off (CV reduction = 43.52%; edge retention = 84.06%; Figure A3). Accordingly, all years were processed using a unified parameter setting of a 50 m grain (cell size) and a 200 m moving window, ensuring cross-year comparability while retaining sensitivity to localized hotspots of landscape change.
2.3.1. Key Landscape-Pattern Descriptors
After computing all metrics, a redundancy-reduction procedure was performed to ensure indicator independence and maintain a parsimonious evaluation framework. The selection rationale is as follows.
- Shape–fragmentation dimension. Patch density (PD) and mean patch area (AREA_MN) show opposite patterns between high- and low-value zones. However, their spatial organization and temporal evolution are highly consistent, indicating substantial information overlap in describing fragmentation. Aiming to avoid redundancy, AREA_MN was retained as the representative metric of patch scale and fragmentation.
- Dominance dimension. Considering frequent land-use transitions in the study area, changes in the largest patch dominance provide a sensitive signal of landscape dominance dynamics. The largest patch index (LPI) has clear ecological meaning and strong response to shifts in dominant patch control; thus, LPI was retained. Additionally, the landscape shape index (LSI) partly co-varies with fragmentation/dominance metrics in spatial configuration. Therefore, LSI was not retained as a standalone descriptor to further reduce redundancy and enhance model parsimony.
- Diversity dimension. Shannon’s diversity index (SHDI) and Shannon’s evenness index (SHEI) exhibit notably consistent spatial patterns and are highly correlated in reflecting the evenness of landscape-type distribution. SHDI captures compositional diversity and evenness-related information; thus, only SHDI was retained.
- Aggregation–division dimension. The contagion index (CONTAG) and the splitting index (SPLIT) quantify complementary aspects of landscape structure—clumping/connectivity versus division intensity. CONTAG and SPLIT emphasize different mechanisms and are not redundant; thus, both were retained.
Overall, five key landscape-pattern descriptors, namely, AREA_MN, SPLIT, SHDI, CONTAG, and LPI, were selected as the key characteristic factors.
2.3.2. Key Driving Factors
Natural geographic conditions establish the foundation for landscape formation and impose long-term constraints on landscape evolution in the Luxi River Basin. However, most natural attributes only demonstrate marginal variations over the study period, thereby contributing limited explanatory power to recent landscape changes. Accordingly, this study emphasized coupled natural–human variables that are closely linked to hydrological processes. In particular, water resource availability and water use were considered priority factors because they sensitively reflect hydrological alterations attributed to human utilization.
In contrast, socioeconomic processes can influence landscape patterns across short time scales. Population growth (represented by population density) strengthens human disturbance and directly affects ecological processes. Economic development (represented by GDP) is strongly coupled with land-use conversion, thereby indirectly driving spatial reconfiguration. Pollution emissions, especially agricultural nonpoint source pollution and water pollution, as well as resource consumption (notably water use), can further influence landscape evolution through environmental quality degradation and hydrological regime modification. Meanwhile, industrial structure adjustment (e.g., a shift toward the tertiary sector) and environmental governance (represented by environmental protection expenditure) facilitate sustained positive regulation through pollution control and green development, respectively.
Consequently, nine key influencing factors were preliminarily identified: Water Resources, Water Consumption, Human Activities, Agricultural Nonpoint Source Pollution, Water Pollution, Population Density, GDP, Industrial Structure, and Investment in Energy-saving and Environmental Protection.
2.4. PSR Indicator System Construction
Using the PSR model, a hierarchical indicator system was constructed for ecosystem health evaluation, as shown in Figure 7.
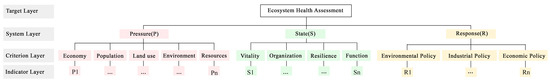
Figure 7.
Hierarchical structure of the evaluation system based on the PSR model.
The Pressure subsystem characterizes the external stresses imposed on ecosystems by human development activities. The preceding analysis indicates that the construction of the Tianfu New Area and its associated development projects are the primary drivers of landscape pattern changes in the Luxi River Basin, thereby prompting changes in ecosystem health. Accordingly, pressure indicators were selected from five dimensions—economy, population, land use, environment, and resources—and were considered as negative indicators of ecosystem health.
The State subsystem evaluates the overall level of ecosystem health based on four aspects: vitality, organization, resilience, and function. From a human–landscape interaction perspective, although the conventional VOR framework emphasizes vitality (V), organization (O), and resilience (R), ecosystem health should reflect not only system stability and resilience but also the capacity to provide ecosystem services. Therefore, ecosystem service provision was incorporated into the state assessment. Additionally, landscape pattern represents a spatial manifestation of ecological processes; therefore, landscape metrics were introduced to quantify spatial heterogeneity.
The Response subsystem represents policies and governance actions, including ecological, economic, and environmental policies, which are implemented to improve environmental conditions. These measures are intended to steer ecosystem trajectories in a positive direction and are thus defined as positive indicators of regional ecosystem health.
The indicator set was derived from two sources. First, key factors identified through analyses of landscape pattern evolution and its driving forces were spatially quantified and transformed into candidate evaluation indicators. Second, the indicator system was supplemented and refined by incorporating basin-specific characteristics and the conceptual connotation of ecosystem health. Overall, 18 candidate indicators were initially compiled (Table 3). The indicator screening logic and derivation workflow are illustrated in Appendix B, Figure A4, Figure A5 and Figure A6, and the calculation equations for all indicators are presented in Table 4, Table 5 and Table 6.
Table 3.
PSR-based indicator system for ecosystem health assessment in the Luxi River Basin (candidate indicators and definitions).
Table 4.
Quantification formulas and variable definitions for indicators in the Pressure (P) subsystem.
Table 5.
Quantification formulas and variable definitions for indicators in the State (S) subsystem.
Table 6.
Quantification formulas and variable definitions for indicators in the Response (R) subsystem.
2.5. Indicator Screening, Standardization, and Weighting
Aiming to ensure comparability among indicators with different units and magnitudes, all candidate indicators were first normalized to a unitless range of [0, 1] using min–max standardization. For a positive indicator (high values indicate improved ecosystem health), the standardized value was calculated as follows:
For a negative indicator (high values indicate poor ecosystem health), the standardized value was calculated as follows:
where is the original value of indicator in evaluation unit , is the standardized value, and and denote the maximum and minimum values of indicator , respectively, across all samples used in the assessment. After standardization, a large consistently indicates improved ecosystem health.
Based on the standardized indicator matrix , redundancy screening was conducted to minimize multicollinearity and improve indicator independence. In IBM SPSS Statistics 26.0, the Kolmogorov–Smirnov (K–S) test was applied to assess the normality of each candidate indicator. Pearson correlation coefficients were computed for indicators satisfying normality, whereas Spearman rank correlations were used otherwise. All correlation tests were conducted as two-tailed tests with a pooled sample size of n = 72 (24 evaluation units × 3 periods). Indicator pairs with at p < 0.05 were considered to convey redundant information. As shown in Figure A7, several high-correlation pairs exceeded this threshold, including NDWI vs. water conservation function index (r = 0.98), per capita GDP vs. share of tertiary industry (r = −0.96), population density vs. human disturbance index (r = 0.96), and the landscape-metric cluster SPLIT–AREA_MN–LPI (r = 0.83–0.96).
To determine which indicator should be retained within each cluster, an interpretability-first selection rule was adopted. Specifically, priority was given to indicators that (i) occupied a clearer position in the Pressure–State–Response causal chain, (ii) were more directly linked to management and policy levers, thereby facilitating ecological interpretation of changes and interventions, and (iii) had more transparent construction and a lower risk of double counting, especially where composite indices could partially re-express land-cover proportions or landscape-pattern metrics. Conversely, indicators were preferentially removed when they (i) behaved as generalized proxies that overlapped with multiple variables simultaneously, (ii) were derived from multi-source weighted syntheses that could duplicate information captured by other land-use or landscape indicators, or (iii) belonged to a tightly coupled set of landscape metrics describing the same underlying fragmentation–aggregation process.
Under this framework, five indicators were excluded. Per capita GDP was removed because it exhibited near-collinearity with the share of tertiary industry, and it functions primarily as a broad outcome-level development proxy with a longer and more confounded ecological interpretation pathway. The Human Disturbance Index was excluded because it showed very high redundancy with population density and, as a composite indicator, risks duplicating information already embedded in land-use and landscape-structure descriptors. NDWI was removed due to its strong redundancy with the water conservation function index; in the study region, both indicators respond strongly to the dominant gradient of vegetation cover, surface moisture, and imperviousness, so NDWI contributed limited incremental information beyond the functional index. In addition, LPI and AREA_MN were excluded because they formed a highly correlated landscape-metric cluster with SPLIT, indicating that they largely captured the same fragmentation and dominance pattern at the chosen mapping scale; retaining SPLIT and complementary configuration/composition indicators such as CONTAG and SHDI was considered sufficient to represent the key landscape-structure processes while reducing redundancy.
Aiming to evaluate the reliability (internal consistency) of the retained indicator set, Cronbach’s alpha was calculated as shown below:
where is the number of retained indicators, is the variance of indicator , and is the variance of the total score formed by summing the retained indicators. The resulting value was 0.801, indicating good internal consistency of the finalized indicator system.
Indicator weights were then calculated using the entropy weight method. First, the standardized values were converted to proportions:
The information entropy of indicator was calculated as follows:
where is the number of samples (evaluation units) used in the weighting procedure. The degree of divergence was computed as follows:
Finally, the entropy weight of indicator was obtained as shown below.
where is the number of retained indicators. The resulting ecosystem health evaluation index system for the Luxi River Basin is presented in Table 7.
Table 7.
Ecosystem health evaluation system of the Luxi River Basin.
Using a comprehensive index approach, the indicator values were aggregated with their corresponding weights to obtain an ecosystem health index for each evaluation unit. Specifically, for evaluation unit , the ecosystem health index was calculated as:
where denotes the ecosystem health index, is the entropy weight of indicator , and is the standardized value of indicator in unit .
For health-grade classification, the computed EHI values were linearly rescaled to [0, 1] and then classified into five fixed equal-interval classes: [0.0, 0.2), [0.2, 0.4), [0.4, 0.6), [0.6, 0.8), and [0.8, 1.0] (Table 8). This strategy was adopted for three reasons: (1) EHI is a normalized proportional index and is suitable for equal-interval classification; (2) fixed thresholds prevent year-specific breakpoint drift in multi-temporal comparisons and thus improve cross-year comparability; and (3) this grading strategy is commonly used in ecosystem health assessment, facilitating interpretation and comparison across studies [42,43].
Table 8.
Classification of the comprehensive ecosystem health index in the Luxi River Basin.
3. Results
3.1. Spatiotemporal Changes in Landscape Metrics
3.1.1. Changes in Fragmentation and Shape Complexity
Temporally (Figure 8), PD decreased from 13.17 (2004) to 9.90 (2014) and then rebounded to 13.68 (2024). LSI followed a similar decrease–increase trajectory, declining from 52.00 (2004) to 46.85 (2014) and rising to 58.05 (2024). By contrast, AREA_MN increased from 7.60 (2004) to 10.10 (2014) before declining to 7.31 (2024). Collectively, these results indicate that landscape fragmentation and edge and shape complexity were temporarily mitigated during 2004–2014, as reflected by lower PD and LSI and a larger mean patch area. From 2014 to 2024, fragmentation intensified again, accompanied by highly irregular patch shapes, small patch sizes, and reduced landscape continuity.
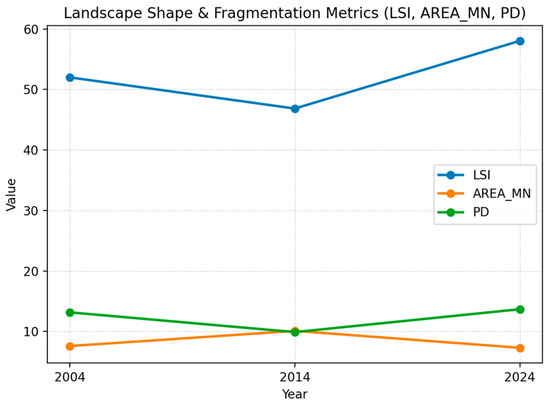
Figure 8.
Temporal changes in landscape fragmentation and shape complexity metrics (PD, LSI, and AREA_MN) in the Luxi River Basin (2004–2024).
Spatially (Figure 9), the eastern part of the basin showed minor changes and maintained a more stable landscape configuration, whereas the central and southern areas exhibited stronger dynamics. In 2004, moderately high to high values of LSI and PD were observed as scattered spots and patches, indicating localized fragmentation. By 2014, areas with moderately high to high LSI and PD contracted, while low-value areas expanded. Meanwhile, zones with high AREA_MN became highly concentrated, implying a temporary reduction in fragmentation and improved patch contiguity. By 2024, areas with high LSI and PD expanded markedly, while areas with low AREA_MN increased. This phenomenon indicates that recent land conversion and construction further dissected patches, increased shape complexity, and reinforced fragmentation, particularly in the central and southern basin.
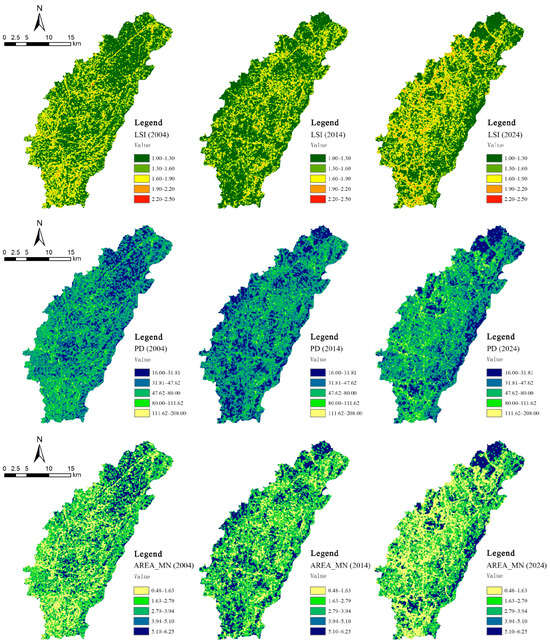
Figure 9.
Moving-window maps of fragmentation and shape metrics (LSI, PD, and AREA_MN) in the Luxi River Basin for 2004, 2014, and 2024.
3.1.2. Changes in Dominance of the Largest Patch
Temporally (Figure 10), the LPI declined from 66.71 in 2004 to 56.36 in 2014, followed by a sharp decrease to 22.79 in 2024. The marked decline after 2014 indicates that the largest land-cover patch became increasingly dissected, leading to a substantial loss of dominance and continuity across the basin.
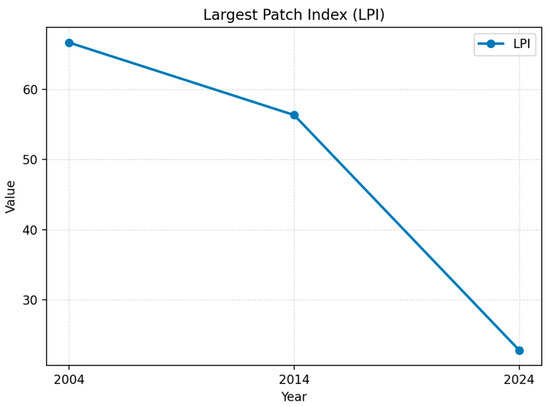
Figure 10.
Temporal change in the Largest Patch Index (LPI) in the Luxi River Basin (2004, 2014, and 2024).
Spatially (Figure 11), high-LPI areas were dominant in 2004, whereas low-LPI zones emerged as scattered points and linear features. By 2014, low-LPI patches had increased and expanded into belt- and network-shaped configurations in the central and southern basin, respectively, implying intensified dissection of the largest patch and greater local mosaic complexity. By 2024, low-LPI areas had expanded further and become more continuous, revealing deeper fragmentation of the dominant patch. In contrast, the eastern portion of the basin retained more concentrated high-LPI zones and experienced minor overall changes.
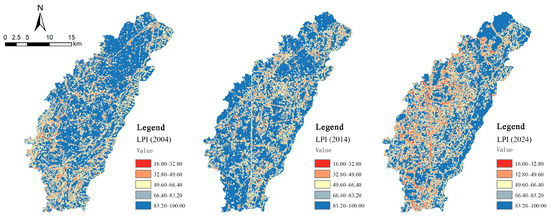
Figure 11.
Spatial distribution of moving-window LPI in the Luxi River Basin in 2004, 2014, and 2024.
3.1.3. Changes in Landscape Diversity and Evenness
Temporally (Figure 12), SHDI and SHEI steadily increased from 2004 to 2024. SHDI rose from 0.86 in 2004 to 0.97 in 2014 and further increased to 1.26 in 2024, while SHEI increased from 0.48 to 0.54 and then to 0.70. This parallel increase indicates high compositional diversity and an even distribution among land-cover types across time, reflecting reduced dominance of a single class and enhanced landscape heterogeneity.
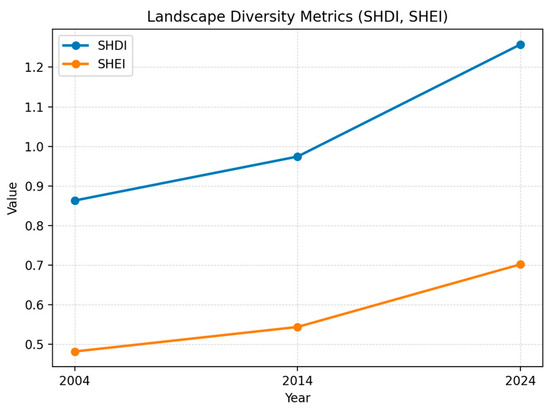
Figure 12.
Temporal changes in landscape diversity metrics (SHDI and SHEI) in the Luxi River Basin (2004, 2014, and 2024).
Spatially (Figure 13), areas with high SHDI and SHEI emerged as dispersed patches and expanded by 2024, consistent with strong interspersion among multiple land-cover types and increasing spatial heterogeneity.
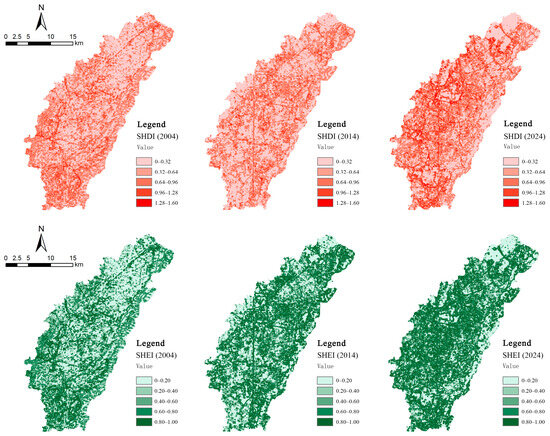
Figure 13.
Spatial distribution of moving-window SHDI and SHEI in the Luxi River Basin in 2004, 2014, and 2024.
3.1.4. Changes in Landscape Aggregation and Division
Temporally (Figure 14), from 2004 to 2014, CONTAG decreased from 59.74 to 57.44, respectively, followed by a further decline to 45.10 in 2024, whereas SPLIT increased from 2.24 to 2.97, followed by a surge to 12.88. The concurrent decline in contagion and the sharp increase in splitting, particularly after 2014, indicate a systematic transition from relatively aggregated and connected landscape patterns to a highly subdivided and fragmented landscape over the past decade.
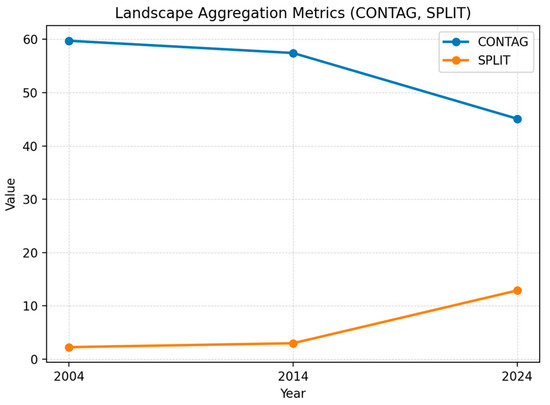
Figure 14.
Temporal changes in landscape aggregation metrics (CONTAG and SPLIT) in the Luxi River Basin (2004, 2014, and 2024).
Spatially, low-CONTAG zones expanded over time in belt- and network-shaped forms, reflecting declining connectivity. Conversely, high-SPLIT zones transformed from scattered points to more continuous belts and patches by 2024, indicating increasingly severe landscape division (Figure 15).
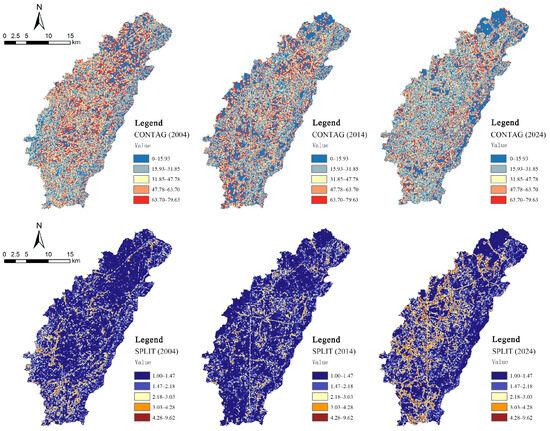
Figure 15.
Spatial distribution of moving-window CONTAG and SPLIT in the Luxi River Basin in 2004, 2014, and 2024.
3.2. Ecosystem Health Assessment Under the PSR Framework
3.2.1. Pressure Layer Integrated Evaluation
As shown in Figure 16, the pressure-layer index exhibited clear spatial heterogeneity across the Luxi River Basin. In 2004, most subregions were classified as Healthy or Sub-healthy. The northern part of the basin, particularly Subregions 2 and 9, showed high pressure levels, thus resulting in poor pressure-layer performance. By 2014, pressure conditions notably worsened in the northern portion of the basin, where several subregions shifted toward high-pressure classes, with some areas reaching the Moderately Unhealthy category. By 2024, the spatial pattern of pressure markedly changed due to the development of the Tianfu New Area. A pronounced improvement was observed in the central area around Xinglong Lake, especially in Subregion 20, which shifted to a low-pressure class. Overall, despite increasing demographic pressure over 2004 to 2024, improvements in water resource supply, technological progress, and industrial transformation partially mitigated ecosystem pressure in selected subregions, as reflected by the pressure-layer patterns.
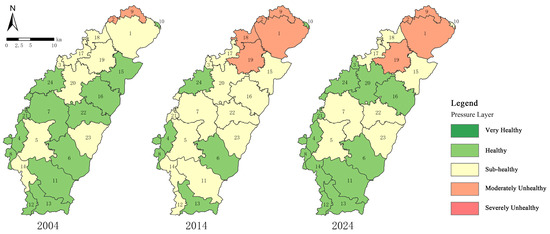
Figure 16.
Integrated evaluation of the pressure layer in the Luxi River Basin in 2004, 2014, and 2024.
3.2.2. State Layer Integrated Evaluation
Figure 17 illustrates the spatial distribution of the state index. In 2004, the eastern Longquan Mountain area, dominated by forest and grassland with high vegetation cover, exhibited higher state index values, whereas the northern urban areas showed lower state scores. By 2014, the basin-wide state index revealed a slight decline; the lowest values remained concentrated in the northern urbanized region, and several low-value patches were observed in parts of the western basin. By 2024, state index values in the eastern Longquan Mountain subregions, including Subregions 11, 6, 23, 22, and 16, as well as the central Xinglong Lake subregions, including Subregions 24, 3, 20, and 7, increased again, indicating improving ecological conditions in these areas. In contrast, the northern and southern portions exhibited limited changes or slight declines relative to 2014, a pattern broadly consistent with the built-up land distribution in those areas.
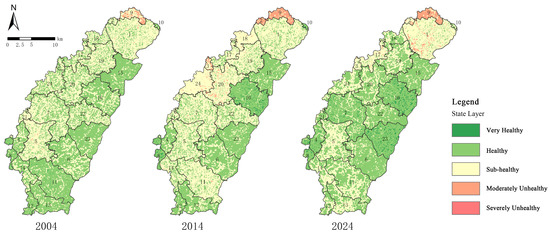
Figure 17.
Integrated evaluation of the state layer in the Luxi River Basin in 2004, 2014, and 2024.
3.2.3. Response Layer Integrated Evaluation
The response-layer index for the basin demonstrated a substantial increase over time (Table 9). In 2004, the index was 0.2297, corresponding to Level IV (Moderately Un-healthy). By 2014, it had risen to 0.7367, reaching Level II (Healthy); by 2024, this index further increased to 0.9885, corresponding to Level I (Very Healthy). Overall, the response index increased by 330.3% between 2004 and 2024. This remarkable improvement indicates a marked enhancement of environmental management capacity and the effectiveness of policy interventions during the study period.
Table 9.
Integrated evaluation of the response layer in the Luxi River Basin in 2004, 2014, and 2024.
3.2.4. Comprehensive Ecosystem Health Evaluation
Figure 18 presents the comprehensive ecosystem health assessment results for the basin. In 2004, the Luxi River Basin exhibited low ecosystem health, with most areas classified as Sub-healthy or Healthy, and several scattered patches showing Moderately Unhealthy conditions. A Severely Unhealthy zone was also observed in the northern part of the basin, particularly in Subregion 9. By 2014, ecosystem health had improved across the basin. The central and eastern parts of the basin generally showed better conditions, and Very Healthy areas began to emerge and expand. Despite most of the western portion remaining Sub-healthy, the extent of Moderately and Severely Unhealthy areas in the north still decreased. By 2024, ecosystem health further improved, with Healthy conditions becoming predominant across the basin. Except for a few northern urban subregions that continued to lag behind, most areas were classified as Healthy or Very Healthy. Overall, these results indicate a minor but steady improvement in ecosystem health across the Luxi River Basin from 2004 to 2024.
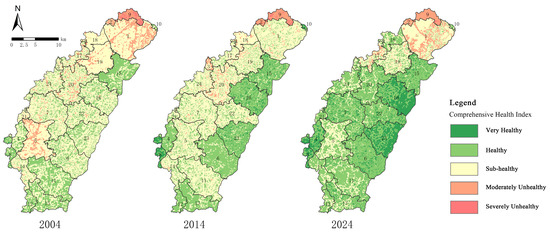
Figure 18.
Comprehensive ecosystem health evaluation of the Luxi River Basin in 2004, 2014, and 2024.
3.2.5. Ecosystem Health Change Analysis (2004–2024)
Aiming to analyze temporal changes in ecosystem health, the health level of each evaluation unit was compared between the assessment years, and the changes were classified into five categories: Significant Improvement, defined as an increase in two health levels; Slight Improvement, defined as an increase in one level; Basically Unchanged; Slight Degradation, defined as a decrease in one level; and Severe Degradation, defined as a decrease in two levels. The spatial distribution of these change categories is shown in Figure 19, and the basin area proportion in each category is summarized in Table 10. Between 2004 and 2024, most of the basin exhibited either improvements or stability in ecosystem health. Approximately 65.48% of the basin area showed Slight Improvement, while 1.14% showed Significant Improvement. Approximately 29.62% of the area was classified as Basically Unchanged, and only 3.76% experienced Slight Degradation, with no areas experiencing Severe Degradation. Overall, these results indicate a basin-wide trend toward improving or stable ecosystem health, with limited areas showing declines during the study period.
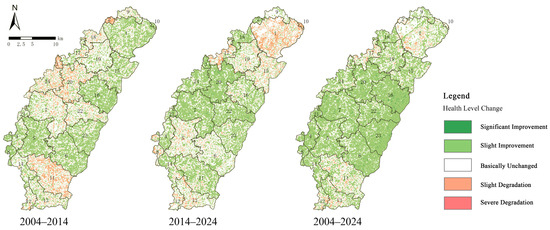
Figure 19.
Changes in ecosystem health grades in the Luxi River Basin from 2004 to 2024.
Table 10.
Proportions of area transfer among ecosystem health grades in the Luxi River Basin from 2004 to 2024.
4. Discussion
4.1. Methodological Contribution and Comparison
This study presents an integrated approach for assessing river basin ecosystem health through the combination of landscape pattern analysis and a PSR-based indicator framework. The core methodological innovation lies in the data-driven construction of the PSR indicator system, supported by two decades of observed landscape evolution. By examining land use changes and landscape metrics from 2004 to 2024, instead of relying solely on expert opinion as in traditional approaches, region-specific ecological signals were derived and then translated into evaluation indicators. In the proposed framework, intrinsic ecosystem conditions are characterized through a VOR lens within the PSR “State” component, ensuring that ecosystem functional vitality and resilience are explicitly represented alongside human pressures and management responses. Additionally, entropy weighting was applied to assign indicator weights based on data variability, minimizing subjective bias compared to expert-based weighting methods. Overall, this methodology advances previous ecosystem health assessment models by integrating landscape ecological indicators with socioeconomic metrics to produce a comprehensive, multidimensional health index that is sensitive to environmental change and policy interventions.
The findings of the current study build upon and extend recent research in ecosystem health evaluation at landscape and watershed scales. The PSR model remains widely used due to its intuitive cause–effect structure and practical applicability, and several studies have enriched it by incorporating additional frameworks or data sources to improve its diagnostic power. For example, some assessments employ the classical PSR framework with expert-weighted indexes, which can effectively represent ecosystem status but are vulnerable to subjective indicator selection [44]. In contrast, the proposed data-driven approach aligns with emerging methods that link indicator development to observed landscape dynamics, a strategy that has been shown to enhance the objectivity and accuracy of ecosystem health evaluations. Recent studies have similarly integrated landscape pattern metrics into health assessment frameworks. For example, Lei et al. (2023) incorporated multiple landscape indexes into a VOR-based model for the Dianchi Lake Basin [45]. Meanwhile, He et al. (2024) employed a VOR framework driven by landscape dynamics to assess a karst watershed, emphasizing that landscape structure and composition are critical alternatives for ecosystem condition [46]. Other researchers have integrated the PSR approach with modern techniques to effectively identify key stressors; for instance, a coastal bay study used a PSR model with correlation and obstacle analysis to highlight pollution and water quality as dominant obstacles to ecosystem health [47]. Compared to purely PSR-based assessments that may omit internal ecological vitality, and purely VOR-based assessments that lack explicit socioeconomic drivers, the proposed hybrid PSR + VOR approach provides a more holistic perspective. This approach retains the pragmatic pressure–state–response structure while infusing it with ecologically meaningful indicators, thereby capturing external stresses, management responses, and the internal health of the ecosystem. This integrated perspective is consistent with current research trends aiming to improve ecosystem health evaluation across scales [48]. Notably, the proposed approach also facilitates the recognition of spatial heterogeneity in health status within the basin, enabling the identification of less healthy sub-regions that coincide with intensive human activity and guiding area-specific management strategies. Overall, the methodological framework presented herein offers a robust and reproducible tool for ecosystem health diagnosis. This framework strengthens the empirical basis for indicator selection and improves sensitivity to spatial and temporal changes. Consequently, the proposed hybrid PSR + VOR approach provides a useful methodological reference for rapidly urbanizing watersheds pursuing sustainable land management.
4.2. Core Drivers of Landscape and Ecological Pattern Evolution
Landscape changes in the Luxi Basin between 2004 and 2024 were attributed to its physical setting. In particular, the mountainous, forested Longquan region in the east contrasts sharply with the cultivated lowlands to the west. This topography establishes the baseline ecological capacity: upland forests typically store more carbon, regulate water flow, and support higher biodiversity than intensive croplands. Qin et al. (2025) revealed that under rapid development, Chengdu’s plains experienced a decline in ecosystem health, whereas nearby mountainous areas maintained high health [49]. Conservation policies have capitalized on this natural advantage. For example, Longquan Mountain has been formally designated as Chengdu’s “Urban Green Heart” in national and provincial plans, with a large core zone protected against development. Therefore, these measures have contributed to the consistently high ecosystem health of eastern Luxi. By contrast, the central and western lowlands—with longer histories of farming and settlements—have demonstrated lower baseline resilience and were more prone to degradation with intensifying development pressures.
Human activities have been the dominant force reshaping landscapes in the Luxi Basin. Since the 2000s, Chengdu’s rapid urban expansion, particularly following the development of the Tianfu New Area, has increased built-up land and population pressure in the basin. Studies show that such sprawl directly reduces ecosystem services and that the construction of new urban zones is closely linked to ecological degradation. In northern Luxi (bordering Longquan), accelerated growth from 2014 onward fragmented large natural forests into smaller patches, eroding green-space buffers and habitat connectivity. Similarly, several southern townships experienced farm intensification and population growth, raising fertilizer runoff and water use; for instance, the Shigao area saw a decline in its ecosystem health index with the expansion of farmland and inputs. Conversely, out-migration from Jitian township and shrinking cropland mitigated land pressure, allowing a modest recovery of local ecosystems by 2024. These examples highlight that shifts in land use and demographics directly drive ecosystem-health change, and that unmanaged development—particularly without green infrastructure—can rapidly weaken ecological integrity. Overall, the most damaging drivers in Luxi have been the unmonitored expansion of impervious built-up land, high-input farming without adequate safeguards (causing pollution and runoff), and delays in environmental infrastructure relative to growth.
To offset these pressures, policies and restoration projects have generated positive changes, especially over the last decade. From the mid-2010s onward, local and central governments enforced strict environmental rules and launched major greening initiatives in Luxi. For example, the Tianfu New Area was mandated as a “Park City” (Shanshui City) zone, with heavy investment in parks, greenways, and pollution control. In practice, this eco-city vision is evident: new arrivals often praise Tianfu’s environment, with one researcher noting “the ecological environment in Tianfu New Area is exceptionally good, it’s like a big park.” The Xinglong Lake Wetland Park is a flagship project in the central basin. Through the course of seven years, a former gravel pit was converted into a large lake with surrounding marshes and urban forests, while adjacent farmland was partly returned to wetlands. These engineering efforts boosted vegetation cover and water retention, quickly improving local ecosystem vitality. Similarly, western Luxi has seen the emergence of several new parks and green corridors under the Green Heart Program. For instance, Chengdu’s Longquan Mountain Urban Forest Park added roughly 70.6 million m2 of new forest in recent years, increasing urban green space and capturing over 1.2 million tons of CO2 annually. Simultaneously, authorities have promoted clean industries and high-tech services in the west, phasing out heavy factories and limiting polluting agriculture. These areas reduced emissions and improved habitat links by shifting toward tertiary sectors and building green infrastructure. Together, industrial upgrading and the expansion of parks and water bodies have led to marked improvements in urban ecosystem health.
National-level conservation policies have further guided the ecological trajectory of the Luxi Basin. Beginning in the early 2000s, China’s Grain-for-Green (Sloping Land Conversion) and Natural Forest Protection programs paid farmers to plant trees on marginal fields, notably expanding forest cover nationwide. These programs have been documented to enhance watershed regulation and other ecosystem services. In upland Luxi, similar afforestation and erosion control efforts have strengthened slope stability. Moreover, the 2015 national Water Pollution Prevention and Control Action Plan (the “Ten-Point Plan”) enforced strict wastewater and runoff controls. Researchers report that since 2003, China’s overall inland water quality “has been improved markedly or was maintained at favorable levels,” largely due to reductions in industrial and residential discharges, although agricultural runoff remains a growing concern. These policies have had a measurable regional impact: analyses show that the green development index of the Chengdu–Chongqing area substantially increased after these interventions. Reflecting this shift, the presented Luxi Basin “Response” indicator (policy effort) more than tripled between 2004 and 2024. Essentially, Luxi’s landscape has been influenced by a push-and-pull between development and protection: rapid urbanization and intensive farming push ecosystems down, while reforestation, pollution controls, and green planning pull them back up. Obtained data support this conclusion: ecosystem health stabilized or improved with the implementation of strong environmental measures (e.g., eastern Longquan conservation, central wetlands projects). Conversely, health stagnated or declined when pressures remained unchecked (e.g., parts of northern and southern Luxi). Moving forward, Luxi’s experience emphasizes that sustained economic growth, especially in the Tianfu New Area, must be consistent with robust ecological planning. Overall, the basin’s current trajectory shows the vulnerability of urbanizing landscapes and the effectiveness of strong environmental governance in guiding them toward a healthier future.
4.3. Problem Identification and Restoration Strategies
Based on the above evaluation results and the observed trends, the main ecological problems in different parts of the Luxi River Basin were identified, and targeted restoration strategies were proposed. Aiming to guide management, the basin was delineated into zones of varying restoration priority. Consistent with the health assessment outcomes (spatial pattern of five health levels) and considering the degree of health degradation or improvement (Figure 20 and related analysis), five primary types of zones were defined (categories A–E, as shown in Figure 21 and Table 11). These zones include areas needing urgent restoration, areas for key restoration to enhance ecological functions, areas for preventive restoration, and areas for ecological protection (core and general). Each primary zone was further specified into sub-zones according to the dominant ecosystem type and development orientation (urban, forest, farmland, or river-lake) within that area. The restoration and management strategies recommended for each type of zone are outlined below.
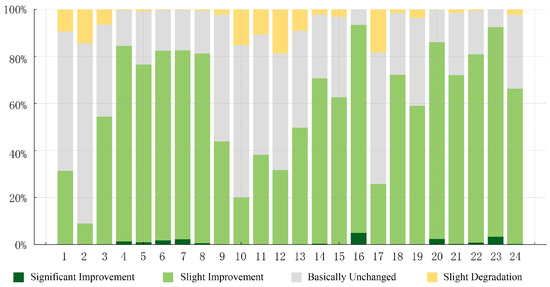
Figure 20.
Proportions of changes in ecosystem health grades across different regions from 2004 to 2024.
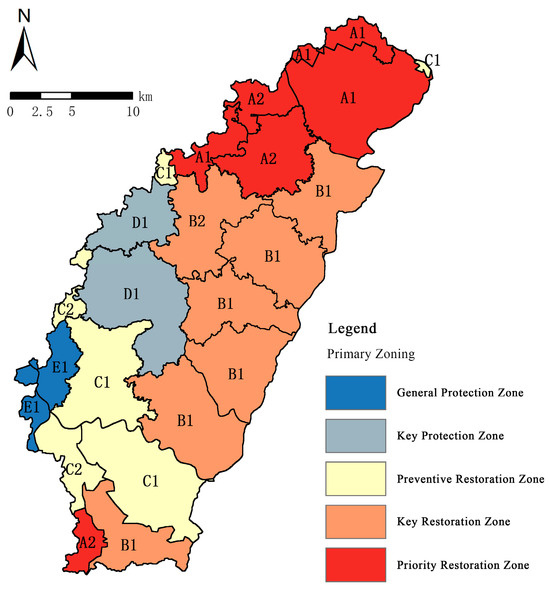
Figure 21.
Ecosystem health restoration zones in the Luxi River Basin. Codes of primary and secondary zoning units (e.g., A1–E1) are defined in Table 11.
Table 11.
Streets (towns) corresponding to ecosystem health restoration zones in the Luxi River Basin.
Priority Restoration Areas: These zones have the lowest ecosystem health (primarily rated Sub-healthy (III) or worse), with notable impairments in ecosystem structure and function. Such areas are typically characterized by severe landscape fragmentation and ecological degradation. For example, in agricultural parts of these zones, long-term intensive farming has led to highly fragmented croplands and a lack of protective shelterbelts; coupled with agricultural nonpoint source pollution, this phenomenon has caused a decline in soil fertility and a weak agro-ecosystem services. On the urban fringe within these zones, rapid expansion has resulted in limited green space and low vegetation cover, leading to poor stormwater retention, degraded water quality, and overall low ecological resilience. Therefore, restoration strategies in priority areas should focus on rebuilding ecological structure and restoring key functions. In agricultural landscapes, combined with the establishment of ecological corridors or shelterbelts to enhance connectivity, consolidation of farmland (e.g., land readjustment to merge small plots into large ones) is recommended to reduce fragmentation. Simultaneously, constructing or improving farmland drainage and irrigation systems can enhance water retention and purification capacity, supporting the ecological restoration of agricultural lands and promoting sustainable use (conceptual diagram in Figure 22). In the urban-edge portions of these zones, expanding green infrastructure, such as parks, riparian buffer strips, and rain gardens, is crucial. Increasing green cover and protecting water bodies will improve local microclimates, enhance runoff regulation, and strengthen the area’s capacity to withstand environmental risks.
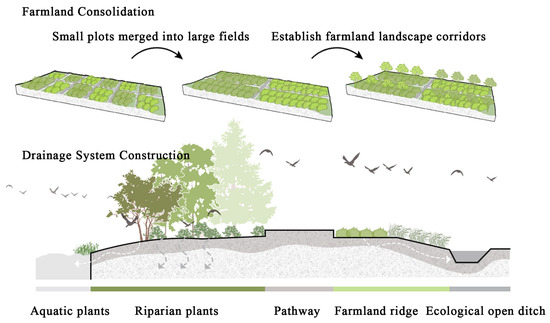
Figure 22.
Schematic of farmland consolidation and drainage system construction.
Key restoration areas generally exhibit relatively high health grades, mainly Level I (very healthy) and Level II (healthy), but their ecological functional potential is not fully realized. These areas are often designated as important ecological corridors or nodes in higher-level spatial plans. However, their effectiveness within the broader ecological network is weakened by habitat fragmentation and the lack of key ecological elements, leading to functional deficiencies. Forest ecosystems provide a representative case: fragmented forest patches frequently show weak connectivity and simplified stand structure, thereby reducing habitat heterogeneity and limiting biodiversity maintenance. Similar constraints are also observed in river–lake ecosystems. Shoreline hardening and insufficient riparian buffer zones tend to homogenize waterfront habitats, weakening functions related to water retention, purification, and habitat provision. Thus, restoration should focus on landscape pattern optimization and ecological network reinforcement. First, strengthening forest corridor construction and vegetation restoration is essential to improve network integrity and connectivity. Additionally, promoting highly diverse community compositions and enhancing habitat quality can strengthen forest stability and adaptive capacity, thereby supporting biodiversity recovery and enhancement (Figure 23). Second, aiming to improve aquatic ecosystem functions, ecological buffer zones should be established along river and lake shorelines by restoring riparian vegetation and creating or rehabilitating wetlands. Collectively, these measures will enable key restoration areas to effectively function as critical nodes and corridors within the regional ecological security framework.
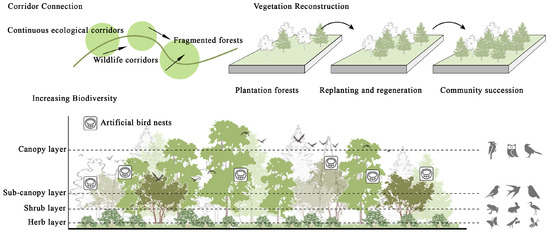
Figure 23.
Schematic of forest ecosystem restoration and biodiversity enhancement.
Preventive Restoration Areas: These zones have relatively high ecosystem health, but early signs of degradation have begun to appear. Examples include areas showing emerging problems such as local land degradation, including slight desertification or patches of soil erosion, declining farmland quality, or deteriorating water conditions, despite good overall health. Therefore, a prevention-first strategy is recommended for such areas. This strategy entails strengthening ecological monitoring and early warning systems to detect incipient degradation, and proactively implementing small-scale restoration in damaged micro-habitats before problems escalate. Actions might include rehabilitation of patches of degraded land through reforestation or erosion control measures, enhancement of agricultural practices to prevent soil exhaustion, and prompt mitigation of sources of water pollution. The key lies in containing and reversing degradation at an early stage to prevent minor issues from spreading and ensure these high-quality ecosystems do not slip into decline.
Key Protection Areas: These zones correspond to critical areas that currently exhibit excellent and continuously improving ecosystem health, often serving as core ecological hubs. These areas typically coincide with the best-performing regions in the health assessment, such as parts of the eastern Longquan Mountains or well-preserved wetlands, and thus play a pivotal role in regional ecological stability. The management emphasis in key protection areas relies on strict conservation. This strategy involves enforcing rigorous land use controls to prevent damaging activities, maintaining the integrity of existing habitats, and protecting against external disturbances. Strengthening protection could include measures such as upgrading legal protection status, increasing patrols to prevent illegal resource extraction, and continuing ecological research and monitoring. Ensuring the long-term stability of these core ecosystems will help sustain their source contributions, such as biodiversity reservoirs, water supply functions, and seed dispersal, for the broader region.
General Protection Areas: These areas have generally good ecosystem health and no clear trend of degradation, essentially forming the stable background areas of the basin’s ecology. Such zones provide fundamental ecosystem services, including water supply, soil retention, and carbon sequestration, often overlapping with landscapes with relatively eco-friendly human activity. Examples of these zones include regions practicing organic agriculture or supporting low-impact tourism. The strategy for these areas is to pursue protection and sustainable use in parallel. This approach involves continuing to safeguard baseline ecological functions while also allowing and encouraging nature-friendly economic activities that support local communities. For example, land use should be managed to preserve watershed services and soil health, and any development should be limited to eco-friendly initiatives, such as agroforestry, organic farming, or ecotourism, to avoid compromising ecological integrity. Through such an integrated approach, general protection areas can achieve a win–win outcome of ecological conservation and socioeconomic development, serving as model zones for harmonious human–nature coexistence.
4.4. Limitations and Research Outlook
Although this study presents a comprehensive assessment framework and offers practical insights for the Luxi River Basin, several limitations should be acknowledged. First, the analysis was constrained by data availability at three discrete time points (2004, 2014, and 2024). Important dynamics, such as short-term disturbances or nonlinear recovery processes, might not be fully captured by decade-scale snapshots. Future research could incorporate frequent monitoring to effectively track rapid changes and seasonal variations in ecosystem health. A related methodological issue is that conceptually different indicators may still become statistically redundant when they co-respond to a shared urbanization gradient under fixed spatial support. Thus, ecological complementarity does not always imply informational independence. This is consistent with evidence on collinearity in environmental modeling and uncertainty in composite-indicator construction [50,51], and may be further amplified by scale effects and MAUP in spatial assessments [52]. Accordingly, indicator retention/removal in this study followed three principles—statistical independence, process interpretability, and management actionability—rather than single-indicator importance. For example, NDWI was ecologically meaningful but highly redundant with the water conservation function index in the annual integrated dataset (|r| = 0.98, p < 0.05), suggesting limited marginal information under the current objective and scale setting. Future work can improve this by combining annual process-oriented indicators with seasonal availability-oriented indicators, alongside multi-scale sensitivity and robustness tests. In addition, certain biological indicators were excluded due to data limitations, and the water-quality metrics in the index were indirect rather than direct measurements of pollutants. Therefore, incorporating direct ecological-quality parameters or bioindicator species could further strengthen the evaluation. Third, as discussed, the cause–effect relationships between drivers and health outcomes are based on observed correlations and logical inference rather than explicit modeling. Attributing changes to specific drivers in a coupled human–natural system is complicated. In the future, integrating the assessment with ecological modeling or scenario analysis could provide additional predictive power and help test the robustness of the conclusions.
Despite these limitations, the study provides meaningful scientific and practical contributions. From a scientific standpoint, a novel integrative method that bridges landscape ecology and environmental management is proposed for ecosystem health assessment. The strategy of using landscape pattern evolution to guide indicator selection is an innovative contribution to ecosystem assessment literature, addressing the common critique of subjectivity in index construction. The resulting framework is not only tailored to the Luxi River Basin but is also transferable to other watersheds facing rapid land use change, thereby offering a template for data-driven, locally grounded health assessment. In terms of practical impact, the findings deliver a spatially explicit diagnosis of ecosystem conditions across the basin, highlighting areas with the most severe degradation and those where improvements are occurring. This level of detail is invaluable for policymakers and planners. In particular, the delineation of restoration and protection zones translates the assessment into actionable guidance: local authorities can prioritize “Zone A” areas for urgent intervention, allocate resources to Zones B and C for reinforcement and prevention, and enforce strong protections in Zone D. The recommended strategies for each zone provide a science-based starting point for ecological restoration projects, land use zoning, and sustainable development plans in the Tianfu New Area. Furthermore, by highlighting the positive outcomes linked to certain policies and the ongoing challenges, the study informs future governance, emphasizing the need for continued investment in environmental infrastructure, cross-sector coordination, and community engagement in conservation. Overall, this study not only advances the methodology of ecosystem health evaluation but also serves the broader goal of ecological civilization, offering concrete insights and tools for balancing development and environment in fast-growing regions. Continued research building on this foundation, such as expanding indicator sets, refining weighting methods, and linking health outcomes with socioeconomic benefits, will help further enhance our ability to foster healthy, resilient ecosystems alongside human prosperity.
5. Conclusions
(1) Ecosystem Health Evaluation System: A comprehensive evaluation system for the Luxi River Basin’s ecosystem health was established based on the PSR model, comprising 13 indicators covering pressure, state, and response aspects. Using the entropy weighting method, the weights of all indicators were determined, and a composite health index was constructed. The ecosystem health of the basin was classified into five levels (I–V) according to the composite index values. This framework integrates ecological, social, and economic factors, providing a systematic tool for ecosystem health assessment at the river-basin scale.
(2) Ecosystem Health Status and Trends: The overall ecosystem health of the Luxi River Basin slightly improved from 2004 to 2024. Spatially, the health status of the central region was generally better than the northern and southern regions, while the eastern Longquan Mountain area remained the healthiest. Over the study period, areas rated as healthy (Level I or II) expanded markedly, while sub-healthy areas (Level III) contracted substantially. However, certain localities experienced degradation and still require attention. These findings not only indicate positive progress, possibly driven by effective environmental policies, but also highlight the need for continued efforts in regions under stress.
(3) Health Restoration Zoning and Strategies: The basin was delineated into five types of restoration zones, and tailored restoration strategies were proposed for each zone. Priority restoration areas (with poor health) should focus on rebuilding ecological structure and function. Key restoration areas (currently good health but functionally suboptimal) require enhanced connectivity and network optimization. Preventive restoration areas (incipient degradation) need early intervention and monitoring. Key protection areas (critical, improving zones) demand strict conservation measures, while general protection areas (good health, stable zones) should balance protection with sustainable use. Implementing these zone-specific strategies will improve overall ecosystem health and support the long-term sustainability of the Luxi River Basin.
The results of this study provide scientific support for ecological construction and management in the Tianfu New Area, reflecting remarkable ecological implications and contemporary relevance. Additionally, certain limitations are acknowledged: the selection of indicators was constrained by data availability, and the evaluation index system could be further refined. Future research should incorporate additional factors, such as water quality and biological indicators, and leverage high-resolution remote sensing and multisource socioeconomic data to enhance assessment accuracy and timeliness.
Author Contributions
Conceptualization, Y.C. and Y.H.; methodology, Y.C. and G.L.; software, G.L.; validation, Y.C., G.L. and Y.H.; formal analysis, Y.C. and G.L.; investigation, Y.C. and G.L.; resources, Y.H.; data curation, G.L.; writing—original draft preparation, Y.C. and G.L.; writing—review and editing, Y.H. and Y.C.; visualization, G.L. and Y.C.; supervision, Y.H.; project administration, Y.H.; funding acquisition, Y.H. All authors have read and agreed to the published version of the manuscript.
Funding
This research received no external funding.
Data Availability Statement
The data that support the findings of this study are available from the corresponding author upon reasonable request.
Conflicts of Interest
The authors declare no conflicts of interest.
Appendix A
Table A1.
Scoring Criteria for Different Vegetation Types.
Table A1.
Scoring Criteria for Different Vegetation Types.
| Vegetation Type | Cropland | Forest Land | Grassland | Other |
|---|---|---|---|---|
| Score | 40 | 80 | 60 | 20 |
Table A2.
Scoring Criteria for Impervious Surface Area.
Table A2.
Scoring Criteria for Impervious Surface Area.
| Impervious-Surface Proportion (%) | 0–3 | 3–5 | 5–10 | 10–20 | 20–100 |
|---|---|---|---|---|---|
| Assigned score | 80–100 | 60–80 | 40–60 | 20–40 | 0–20 |
Table A3.
Ecological Elasticity Coefficients for Different Land-Use Types.
Table A3.
Ecological Elasticity Coefficients for Different Land-Use Types.
| Land-Use Type | Water Bodies | Cropland | Forest Land | Grassland | Built-Up Land | Unused Land |
|---|---|---|---|---|---|---|
| Elasticity coefficient (Ti) | 0.8 | 0.4 | 0.7 | 0.7 | 0.2 | 0.1 |
Table A4.
Ecosystem Service Value Coefficients for Different Land-Use Types.
Table A4.
Ecosystem Service Value Coefficients for Different Land-Use Types.
| Land-Use Type | Water Bodies | Cropland | Forest Land | Grassland | Built-Up Land | Unused Land |
|---|---|---|---|---|---|---|
| Unit-area value (10,000 CNY·km2·a−1) | 15.8 | 1.22 | 8.17 | 2.66 | 1.15 | 0.22 |
Appendix B

Figure A1.
Adjacent-grain sensitivity (2004/2014/2024 average).
Figure A1.
Adjacent-grain sensitivity (2004/2014/2024 average).


Figure A2.
Grain selection based on stability and information retention.
Figure A2.
Grain selection based on stability and information retention.


Figure A3.
Moving-window trade-off for denoising and detail preservation.
Figure A3.
Moving-window trade-off for denoising and detail preservation.


Figure A4.
Mapping of Key Influencing Factors to Pressure Indicators.
Figure A4.
Mapping of Key Influencing Factors to Pressure Indicators.


Figure A5.
Relationships between Key Characteristic Factors and State Indicators.
Figure A5.
Relationships between Key Characteristic Factors and State Indicators.


Figure A6.
Mapping of Key Influencing Factors to Response Indicators.
Figure A6.
Mapping of Key Influencing Factors to Response Indicators.


Figure A7.
Clustered correlation heatmap of 18 candidate indicators with correlation coefficients (r). “*” p < 0.05, “**” p < 0.01, “***” p < 0.001.
Figure A7.
Clustered correlation heatmap of 18 candidate indicators with correlation coefficients (r). “*” p < 0.05, “**” p < 0.01, “***” p < 0.001.

References
- Chen, S.; Qiu, J.; Yang, M.; Li, J. A Synergetic Perspective on the Planning of the “City in a Park”: A Case Study of the Sichuan Tianfu New Area, China. Buildings 2024, 14, 1542. [Google Scholar] [CrossRef]
- Xie, X.; Gong, X.; Pan, S. Research on the Construction Path of the Megacity from the Perspective of Nudge Theory: Empirical Evidence of the “Park City” Construction in Chengdu Tianfu New Area. Chin. J. Popul. Resour. Environ. 2023, 21, 163–171. [Google Scholar] [CrossRef]
- Li, J.; Qiu, J.; Amani-Beni, M.; Wang, Y.; Yang, M.; Chen, J. A Modified Equivalent Factor Method Evaluation Model Based on Land Use Changes in Tianfu New Area. Land 2023, 12, 1335. [Google Scholar] [CrossRef]
- Pan, J.; Zhou, J.; Wang, N. Application of improved multi-coupling model in water environment simulation of Luxi River Basin in Sichuan Province. Desalination Water Treat. 2022, 269, 238–248. [Google Scholar] [CrossRef]
- Cairns, J.; McCormick, P.V.; Niederlehner, B.R. A proposed framework for developing indicators of ecosystem health. Hydrobiologia 1993, 263, 1–44. [Google Scholar] [CrossRef]
- Rapport, D.J.; Böhm, G.; Buckingham, D.; Cairns, J.; Costanza, R.; Karr, J.R.; de Kruijf, H.A.M.; Levins, R.; McMichael, A.J.; Nielsen, N.O. Ecosystem health: The concept, the ISEH, and the important tasks ahead. Ecosyst. Health 1999, 5, 82–90. [Google Scholar] [CrossRef]
- Yang, H.; Shao, X.; Wu, M. A review on ecosystem health research: A visualization based on CiteSpace. Sustainability 2019, 11, 4908. [Google Scholar] [CrossRef]
- Fu, S.; Zhao, L.; Qiao, Z.; Sun, T.; Sun, M.; Hao, Y.; Hu, S.; Zhang, Y. Development of Ecosystem Health Assessment (EHA) and Application Method: A Review. Sustainability 2021, 13, 11838. [Google Scholar] [CrossRef]
- Costanza, R. Ecosystem health and ecological engineering. Ecol. Eng. 2012, 45, 24–29. [Google Scholar] [CrossRef]
- Rapport, D.J. What constitutes ecosystem health? Perspect. Biol. Med. 1989, 33, 120–132. [Google Scholar] [CrossRef]
- Rapport, D.J.; Regier, H.A.; Hutchinson, T.C. Ecosystem behavior under stress. Am. Nat. 1985, 125, 617–640. [Google Scholar] [CrossRef]
- Calow, P. Can ecosystems be healthy? Critical consideration of concepts. J. Aquat. Ecosyst. Health 1992, 1, 1–5. [Google Scholar] [CrossRef]
- Odum, E.P. Trends expected in stressed ecosystems. BioScience 1985, 35, 419–422. [Google Scholar] [CrossRef]
- Schaeffer, D.J.; Herricks, E.E.; Kerster, H.W. Ecosystem health: I. Measuring ecosystem health. Environ. Manag. 1988, 12, 445–455. [Google Scholar] [CrossRef]
- Costanza, R.; Mageau, M.T. What is a healthy ecosystem? Aquat. Ecol. 1999, 33, 105–115. [Google Scholar] [CrossRef]
- Xiao, R.; Yu, X.; Shi, R.; Zhang, Z.; Yu, W.; Li, Y.; Chen, G.; Gao, J. Ecosystem health monitoring in the Shanghai-Hangzhou Bay Metropolitan Area: A hidden Markov modeling approach. Environ. Int. 2019, 133, 105170. [Google Scholar] [CrossRef]
- Peng, J.; Liu, Y.; Wu, J.; Lv, H.; Hu, X. Linking ecosystem services and landscape patterns to assess urban ecosystem health: A case study in Shenzhen City, China. Landsc. Urban Plan. 2015, 143, 56–68. [Google Scholar] [CrossRef]
- Bao, Z.; Shifaw, E.; Deng, C.; Sha, J.; Li, X.; Hanchiso, T.; Yang, W. Remote sensing-based assessment of ecosystem health by optimizing vigor-organization-resilience model: A case study in Fuzhou City, China. Ecol. Inform. 2022, 72, 101889. [Google Scholar] [CrossRef]
- Das, M.; Das, A.; Pereira, P.; Mandal, A. Exploring the spatio-temporal dynamics of ecosystem health: A study on a rapidly urbanizing metropolitan area of Lower Gangetic Plain, India. Ecol. Indic. 2021, 125, 107584. [Google Scholar] [CrossRef]
- Zhang, C.; Wang, K.; Yue, Y.; Qi, X.; Zhang, M. Assessing Regional Ecosystem Conditions Using Geospatial Techniques—A Review. Sensors 2023, 23, 4101. [Google Scholar] [CrossRef]
- Xiao, R.; Qiao, Y.; Dong, X.; Ren, H.; Wang, X.; Zhang, P.; Ye, Q.; Xiao, X. Ecosystem Health Assessment of the Manas River Basin: Application of the CC-PSR Model Improved by Coupling Coordination Degree. Land 2024, 13, 1336. [Google Scholar] [CrossRef]
- Sun, B.; Tang, J.; Yu, D.; Song, Z.; Wang, P. Ecosystem health assessment: A PSR analysis combining AHP and FCE methods for Jiaozhou Bay, China. Ocean Coast. Manag. 2019, 168, 41–50. [Google Scholar] [CrossRef]
- Zou, Z.; Luo, S.; Duan, P. Dynamic assessment and zoning strategies for ecosystem health in Poyang Lake urban agglomeration. Sci. Rep. 2025, 15, 21956. [Google Scholar] [CrossRef]
- Sun, R.; Yao, P.; Wang, W.; Yue, B.; Liu, G. Assessment of wetland ecosystem health in the Yangtze and Amazon River Basins. ISPRS Int. J. Geo-Inf. 2017, 6, 81. [Google Scholar] [CrossRef]
- Chen, W. A Multi-Scale Assessment of Ecosystem Health Based on the Pressure–State–Response Framework: A Case in the Middle Reaches of the Yangtze River Urban Agglomerations, China. Environ. Sci. Pollut. Res. 2022, 29, 29202–29219. [Google Scholar] [CrossRef]
- Huang, Y.; Gan, X.; Feng, Y.; Li, J.; Niu, S.; Zhou, B. A New Framework for Assessing Ecosystem Health with Consideration of the Sustainable Supply of Ecosystem Services. Landsc. Ecol. 2024, 39, 37. [Google Scholar] [CrossRef]
- Zhang, C.; Zhou, Y.; Yin, S. Interaction Mechanisms of Urban Ecosystem Resilience Based on Pressure–State–Response Framework: A Case Study of the Yangtze River Delta. Ecol. Indic. 2024, 166, 112263. [Google Scholar] [CrossRef]
- Ashraf, A.; Haroon, M.A.; Ahmad, S.; Abowarda, A.S.; Wei, C.; Liu, X. Use of Remote Sensing-Based Pressure–State–Response Framework for the Spatial Ecosystem Health Assessment in Langfang, China. Environ. Sci. Pollut. Res. 2023, 30, 89395–89414. [Google Scholar] [CrossRef]
- Niemeijer, D.; de Groot, R.S. A conceptual framework for selecting environmental indicator sets. Ecol. Indic. 2008, 8, 14–25. [Google Scholar] [CrossRef]
- Wen, J.; Hou, K. Research on the progress of regional ecological security evaluation and optimization of its common limitations. Ecol. Indic. 2021, 127, 107797. [Google Scholar] [CrossRef]
- Tan, L.; Ma, L.; Chen, C.; Lu, G.; Lu, H. Fusing Multi-Modal Data for Comprehensive Quality Evaluation of Urban Ecological Space at Grid Scale: A Case Study in Taizhou, China. Sustain. Cities Soc. 2025, 130, 106527. [Google Scholar] [CrossRef]
- Huo, Q.; Cheng, X.; Du, W.; Zhang, H.; Han, R. Remote Sensing Evaluation and Monitoring of Spatial and Temporal Changes in Ecological Environmental Quality in Coal Mining-Intensive Cities. Appl. Sci. 2024, 14, 8814. [Google Scholar] [CrossRef]
- Zeng, X.; Huang, Y.; Xie, H.; Ma, Q.; Li, J. Impacts of Land Use and Land Cover Change on the Landscape Pattern and Ecosystem Services in the Poyang Lake Basin, China. Landsc. Ecol. 2024, 39, 183. [Google Scholar] [CrossRef]
- Lin, M.; Chen, Y.; Zhang, J.; Lin, T.; Liu, Y.; Geng, H.; Jia, Z. Scale and Zoning Effects on Landscape Metrics for Assessing Ecological Stress from Urban Expansion. Landsc. Ecol. 2024, 39, 211. [Google Scholar] [CrossRef]
- Fu, G.; Wang, W.; Li, J.; Xiao, N.; Qi, Y. Prediction and Selection of Appropriate Landscape Metrics and Optimal Scale Ranges Based on Multi-Scale Interaction Analysis. Land 2021, 10, 1192. [Google Scholar] [CrossRef]
- Liu, J.; Li, J.; Wang, Y. Interrelationships and Zoning-Based Management of Landscape Ecological Risk and Ecological Resilience in the Hefei Metropolitan Circle from a Multi-Scale Perspective. Front. Environ. Sci. 2025, 13, 1654175. [Google Scholar] [CrossRef]
- Wang, N.; Zha, Y.; Lin, Z. A Multiscale Approach to Identifying Vernacular Landscape Pattern Characteristics in River Basins: A Case Study of the Liuxi River, Guangzhou. Land 2025, 14, 964. [Google Scholar] [CrossRef]
- Guo, M.; Shu, S.; Ma, S.; Wang, L.-J. Using High-Resolution Remote Sensing Images to Explore the Spatial Relationship between Landscape Patterns and Ecosystem Service Values in Regions of Urbanization. Environ. Sci. Pollut. Res. 2021, 28, 56139–56151. [Google Scholar] [CrossRef]
- Nazombe, K.; Nambazo, O. Monitoring and Assessment of Urban Green Space Loss and Fragmentation Using Remote Sensing Data in the Four Cities of Malawi from 1986 to 2021. Sci. Afr. 2023, 20, e01639. [Google Scholar] [CrossRef]
- Ran, P.; Hu, S.; Frazier, A.E.; Yang, S.; Song, X.; Qu, S. The dynamic relationships between landscape structure and ecosystem services: An empirical analysis from the Wuhan metropolitan area, China. J. Environ. Manag. 2023, 325, 116575. [Google Scholar] [CrossRef]
- Gu, T.; Luo, T.; Ying, Z.; Wu, X.; Wang, Z.; Zhang, G.; Yao, Z. Coupled relationships between landscape pattern and ecosystem health in response to urbanization. J. Environ. Manag. 2024, 367, 122076. [Google Scholar] [CrossRef]
- Shi, Z.; Zhou, S. A study on the dynamic evaluation of ecosystem health in the Yangtze River Basin of China. Ecol. Indic. 2023, 153, 110445. [Google Scholar] [CrossRef]
- Peng, C.; Wu, J.; Gao, Y.; Cui, Y.; Sun, H.; Jia, Y.; Xiong, X.; Li, Z.; Yin, W. Exploring the assessment scale for small watersheds in the Han River Basin using an integrated ecosystem health index. Ecol. Indic. 2025, 173, 113372. [Google Scholar] [CrossRef]
- Li, Y.; Huang, Y.; Zhang, X.; Jiang, Y.; Jing, X.; Deng, Y.; Li, R.; Jiang, D.; Mu, J. Ecosystem Health Assessment: A PSR Analysis Combining AHP and EW Methods for Sansha Bay, China. Front. Mar. Sci. 2024, 11, 1396026. [Google Scholar] [CrossRef]
- Lei, D.; Zhang, Y.; Ran, Y.; Gao, L.; Li, J.; Li, Z.; Mo, J.; Liu, X. Assessment of Ecosystem Health Based on Landscape Pattern in Ecologically Fragile Regions at Different Spatial Scales: A Case Study of Dianchi Lake Basin, China. Front. Environ. Sci. 2023, 11, 1076344. [Google Scholar] [CrossRef]
- He, L.; Zhang, J.; Yu, B.; Hu, M.; Zhang, Z. Assessment of Ecosystem Health and Driving Forces in Response to Landscape Pattern Dynamics: The Shibing Karst World Natural Heritage Site Case Study. Herit. Sci. 2024, 12, 182. [Google Scholar] [CrossRef]
- Li, S.; Liu, C.; Ge, C.; Yang, J.; Liang, Z.; Li, X.; Cao, X. Ecosystem Health Assessment Using PSR Model and Obstacle Factor Diagnosis for Haizhou Bay, China. Ocean Coast. Manag. 2024, 250, 107024. [Google Scholar] [CrossRef]
- Wei, H.; Han, Q.; Ma, Y.; Ji, W.; Fan, W.; Liu, M.; Huang, J.; Li, L. Multi-Scenario Simulating the Effects of Land Use Change on Ecosystem Health for Rural Ecological Management in the Zheng–Bian–Luo Rural Area, Central China. Land 2024, 13, 1788. [Google Scholar] [CrossRef]
- Qin, Y.; Zhao, S.; Chen, Y.; Wang, C.; Zhang, Y.; Shi, X. Contrasting land use conflicts and ecosystem health across plain and mountainous urban–rural transitional areas. Ecol. Front. 2025; in press. [Google Scholar] [CrossRef]
- Dormann, C.F.; Elith, J.; Bacher, S.; Buchmann, C.; Carl, G.; Carré, G.; García Márquez, J.R.; Gruber, B.; Lafourcade, B.; Leitão, P.J.; et al. Collinearity: A review of methods to deal with it and a simulation study evaluating their performance. Ecography 2013, 36, 27–46. [Google Scholar] [CrossRef]
- Burgass, M.J.; Halpern, B.S.; Nicholson, E.; Milner-Gulland, E.J. Navigating uncertainty in environmental composite indicators. Ecol. Indic. 2017, 75, 268–278. [Google Scholar] [CrossRef]
- Comber, A.; Harris, P. The importance of scale and the MAUP for robust ecosystem service evaluations and landscape decisions. Land 2022, 11, 399. [Google Scholar] [CrossRef]


Disclaimer/Publisher’s Note: The statements, opinions and data contained in all publications are solely those of the individual author(s) and contributor(s) and not of MDPI and/or the editor(s). MDPI and/or the editor(s) disclaim responsibility for any injury to people or property resulting from any ideas, methods, instructions or products referred to in the content. |
© 2026 by the authors. Licensee MDPI, Basel, Switzerland. This article is an open access article distributed under the terms and conditions of the Creative Commons Attribution (CC BY) license.