Abstract
Rapid urbanization and industrialization have significantly reshaped rural landscapes in metropolitan fringe areas, resulting in “hybridized” characteristics. This study establishes an analytical framework to systematically characterize hybrid rural landscapes, diagnose specific local issues, reveal their spatial differentiation patterns and driving mechanisms, and propose targeted governance strategies. Taking 124 rural units in Baoshan District, Shanghai as a case, multi-source data from the latest available years (2020–2023) were compiled as a cross-sectional snapshot, and a comprehensive indicator system integrating landscape pattern (P), social function (F), and spatial vitality (V) was developed. Utilizing multi-source geospatial data—including land-use maps, points of interest, and mobile signaling data—Gaussian Mixture Models were applied to classify typical hybrid landscape types. Spatial evolution processes and underlying driving forces were further interpreted through remote sensing imagery analysis, field investigations, and policy document reviews. Eleven distinctive hybrid rural landscape types (HTs) were characterized, forming a spatial gradient from urban to rural, encompassing “high-density urbanized” → “ecologically embedded” → “production–living integrated” → “traditional rural landscapes”. Additionally, five representative evolutionary patterns—“urban restructuring”, “ecological orientation”, “industrial-driven transition”, “transitional hybridization”, and “traditional preservation”—were identified, shaped by spatial configuration, planning policies, industrial investments, and demographic dynamics. The framework enhances understanding of the complexity and evolutionary dynamics of rural landscapes, providing theoretical insights and practical guidance for effective typological governance and targeted policy interventions.
1. Introduction
Amid rapid urbanization and industrialization, rural areas on the fringes of metropolitan regions have undergone continuous spatial restructuring and functional transformation. Driven by both urban spillover effects and endogenous rural dynamics [1], traditional rural landscape elements such as farmland, water networks, forests, and settlements have experienced significant changes. These areas are increasingly characterized by the interweaving of urban and rural elements, functional hybridity, and plural development trajectories, leading to “atypical” landscape forms distinct to metropolitan fringe zones [2,3]. Existing theoretical frameworks, such as rural multifunctionality and socio-ecological system resilience [4,5,6], emphasize that these transitional zones are no longer single-function agricultural hinterlands, but rather complex places where production, living, and ecological functions interact dynamically. Rural landscapes now face increasingly complex and multifaceted challenges: urban expansion and infrastructure construction are rapidly encroaching on rural territories, continuously reshaping traditional spatial fabrics and ecological patterns. This has resulted in fragmentation of agricultural and ecological spaces, loss of biodiversity, blurred boundaries between industrial and residential uses, and a decline in the cultural value of landscape heritage [2,7], thereby constraining the pursuit of high-quality and sustainable rural development. If such hybridity is overlooked, it may exacerbate land-use conflicts and drive the degradation of ecosystem services in metropolitan fringe areas [8,9].
In response, the Chinese government has launched major policies such as the Rural Revitalization Strategy and urban–rural integration initiatives, accompanied by the formulation of territorial spatial plans to guide rural transformation in an orderly manner. Among them, the principle of “place-based and category-specific intervention” has become a core tenet, emphasizing the importance of tailoring development paths to local natural and socioeconomic conditions, as opposed to adopting one-size-fits-all planning models [10,11]. Nevertheless, due to the lack of landscape characterization frameworks, and diversity-oriented policy responses mechanisms in practice, many rural areas with complex functions and hybrid characteristics remain overlooked in generalized governance schemes, making it difficult to achieve targeted and differentiated management [12].
The lack of systematic frameworks for rural landscape characterization and typological classification is clearly reflected in recent research on the hybridization and diversity of rural landscapes in metropolitan fringe areas. On one hand, existing studies tend to focus on the regional identity and cultural value of traditional rural landscapes or adopt single-dimensional perspectives based on natural ecology or socioeconomic characteristics [13,14,15], making it difficult to reveal the complexity and overlap of landscape elements and functions in these transitional areas. On the other hand, dominant methodological approaches still rely on macro-level statistics or case-based investigations, which suffer from limited data accessibility, poor timeliness, and insufficient spatial coverage, thereby constraining large-scale, multi-unit landscape classification and holistic understanding of spatial systems [12,16]. Consequently, the current rural landscape governance framework lacks sufficient guidance for the implementation of place-based, characteristic-specific interventions.
In light of these research gaps and practical challenges, this study proposes a generalizable framework for hybrid rural landscape characterization and formulating typological governance strategies in metropolitan fringe areas. Taking 124 rural units (RUs) in Baoshan District, Shanghai as a case study, we constructed a hybrid landscape characterization framework based on a three-dimensional indicator system integrating landscape pattern (P), social function (F), and spatial vitality (V). By combining multi-source data and machine learning clustering techniques, we identified representative hybrid rural landscape types (HTs), analyzed their spatial distribution patterns, and infer their evolutionary trajectories. Furthermore, we examined the multiple driving mechanisms of landscape transformation—including locational structure, planning policy, industrial capital investment, and demographic change—and proposed a “characterization–problem diagnosis–strategy implementation” governance pathway.
Through methodological innovation and empirical application, this research aims to enhance the typological understanding and characterization of rural landscapes in metropolitan fringe areas, promote more scientific and refined landscape governance, and provide theoretical and practical guidance for the systemic protection and development of these complex rural spaces.
2. Literature Review and Research Framework
2.1. Perspectives and Methods for Rural Landscape Characterization
With the intensification of urban–rural interactions, rural landscape research has gradually expanded from a nature-centered ecological perspective to a more comprehensive, multi-dimensional approach that incorporates socioeconomic attributes and cultural perceptions [1,17,18]. This shift has drawn attention from disciplines such as geography, ecology, urban planning, landscape architecture, and the arts. Most existing studies have focused on rural areas with distinct natural and cultural features—such as mountainous and hilly regions [16,19], watersheds [20], and water network zones [21]—emphasizing the extraction of local characteristics and the interpretation of cultural landscape values. However, relatively limited attention has been paid to the “atypical” rural landscapes of metropolitan fringe areas, which feature a more complex interplay between natural ecology and socioeconomic elements.
Indicators used to characterize rural landscapes can generally be grouped into three categories: natural–ecological, socioeconomic, and esthetic–perceptual dimensions [17]. Among these, natural–ecological characteristics are the most well-developed, often analyzed using geospatial data such as land use, topography, and NDVI, forming a relatively mature methodological system [13]. In contrast, analyzing socioeconomic features remains challenging due to difficulties in accessing government statistical data, long update cycles, and inconsistencies between statistical and analytical units [22,23]. While field-based studies offer deeper and more intuitive insights, they are often resource-intensive, time-consuming, and susceptible to subjective bias, which limits their applicability for large-scale classification of rural units [24]. In recent years, the widespread use of multi-source big data in urban socioeconomic studies has shown increasing promise in identifying hybrid characteristics of rural landscapes [25,26], particularly in metropolitan fringe areas where urban–rural interactions are frequent and functional integration is high.
Existing approaches to landscape classification can be categorized into two main types. The first is rule-based classification, which involves predefined thresholds of socioeconomic or demographic indicators to delineate urban–rural boundaries and continuum zones [18,27]. This method is suitable for contexts with clearly defined targets and classification criteria but becomes less effective when dealing with high-dimensional indicators, where classification logic becomes difficult to manage. The second is data-driven machine learning approaches, particularly unsupervised clustering methods, which have been widely used in fields such as ecosystem service bundling [28], urban mixed-use zone identification [29,30], and built environment typologies [31]. These methods group spatial units based on multidimensional similarities, making them well-suited for scenarios where typologies are unknown in advance and variable dimensions are high [32].
2.2. Research Framework
Building on a critical review of existing literature, this study proposes a research framework for the characterization and analysis of hybrid rural landscape types (HTs) in metropolitan fringe areas (Figure 1). The framework comprises four interrelated components: (i) mechanisms of HTs formation and typology identification; (ii) characterization of HTs features, inference of their evolutionary processes, analysis of spatial distribution patterns and adjacency relationships; (iii) analysis of multi-dimensional driving mechanisms; and (iv) development of type-based governance strategies for rural landscapes, grounded in the preceding analyses.
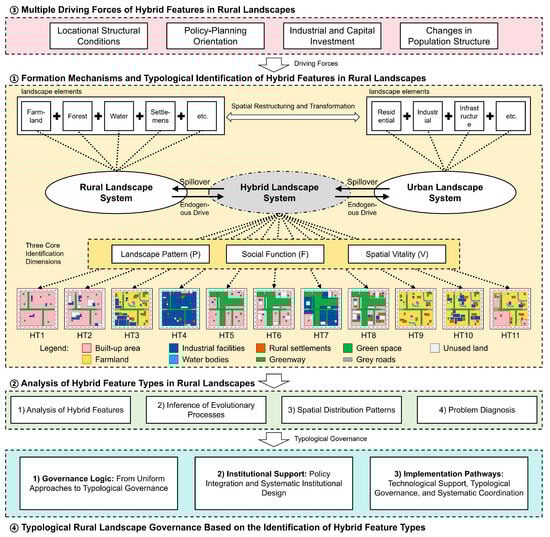
Figure 1.
Schematic diagram of the research framework.
3. Research Methodology
This study integrates multi-source big data and machine learning techniques to systematically characterize the hybrid rural landscapes in metropolitan fringe areas. A methodological pathway is established, consisting of three main steps: constructing an indicator system, characterizing hybrid landscape types, and analyzing spatial patterns and evolutionary mechanisms (Figure 2).
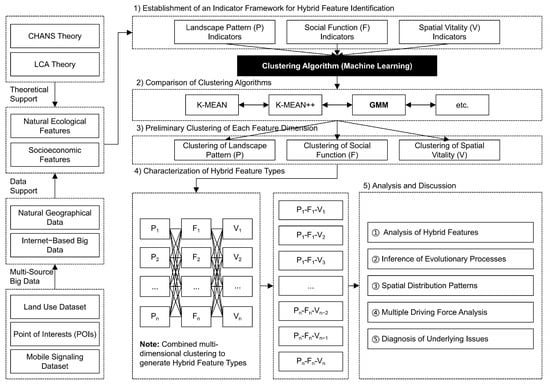
Figure 2.
Technical Methodological Workflow.
3.1. Study Area and Data Sources
This study focuses on Baoshan District, located in the northeastern part of Shanghai, China (Figure 3). Situated at the confluence of the Yangtze River and Huangpu River, Baoshan borders Chongming District to the north and adjoins four core urban districts—Yangpu, Hongkou, Jing’an, and Putuo—to the south, enjoying a strategic geographical location. Baoshan administers a total area of 365.3 km2, with nine townships under its jurisdiction [33]. It has a permanent population of 2.27 million and an urbanization rate as high as 97.08% [34], making it a typical high-density metropolitan fringe area. In terms of physical geography, Baoshan lies on an alluvial plain with flat terrain and belongs to the subtropical humid monsoon climate zone, characterized by distinct seasons, abundant rainfall, and ample sunlight and heat—conditions favorable for agricultural production. Historically, Baoshan has also been one of China’s major industrial hubs. The construction of the Shanghai Baosteel Plant began in 1978 during the reform and opening-up period, and industrial parks were further developed from 2003 onwards. However, decades of rapid urbanization and industrialization have led to the continuous expansion of construction land, especially in rural fringe areas. These rural landscapes are increasingly challenged by the erosion of spatial texture, fragmentation of ecological spaces, weakening of ecosystem services, and a growing mix of land uses. Therefore, it is urgent to understand the hybrid characteristics of these areas—marked by the interweaving of urban and rural elements and overlapping spatial functions—through a characterization-led approach. This will provide a scientific foundation for the protection and sustainable development of rural landscapes in metropolitan fringe areas.
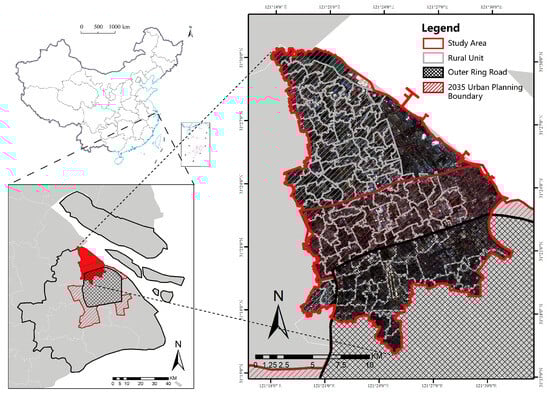
Figure 3.
Study Area (Note: Map based on official Chinese administrative boundaries. Map approval number: GS (2023) No. 2767. No modifications were made.).
In this study, a total of 124 rural units (RUs) within Baoshan District are identified and analyzed using an integrated dataset that includes land use, POI, and mobile signaling data (Table 1). These datasets form a quasi-synchronous cross-sectional snapshot of rural characteristics.

Table 1.
Data Sources.
3.2. Construction of a Three-Dimensional Indicator Framework for Hybrid Rural Landscape Characteristics
The hybrid characteristics of rural landscapes in metropolitan fringe areas emerge from the complex interactions between human activities and the natural environment. Drawing on previous research and grounded in the theories of human–environment coupling and landscape character assessment [17,26,35], this study develops a three-dimensional indicator framework to characterize hybrid rural landscapes, encompassing Landscape Pattern (P), Social Function (F), and Spatial Vitality (V). These dimensions were selected because hybridization is expressed simultaneously in landscape patterns, functional composition, and human activity dynamics, which together provide complementary evidence for typology identification and differentiated governance.
- (1)
- Landscape Pattern (P): Landscape pattern reflects the spatial interactions between human society and natural ecological processes [28,36]. To capture rural landscape patterns in a comprehensive and interpretable manner, we quantified pattern characteristics at both the landscape level and the class level. Following commonly used metrics in landscape ecology, the selected indices represent key aspects of landscape structure, including area, edge, shape complexity, aggregation, connectivity, fragmentation, and diversity. At the class level, considering the dominant land-use composition and landscape matrix of rural Shanghai, we focused on four major land-cover classes (cultivated land, forest, water bodies, and built-up land) to characterize class-specific pattern differences across rural units (Table 2).
Table 2.
Indicator Framework for Landscape Pattern (P) Characteristics.
Table 2.
Indicator Framework for Landscape Pattern (P) Characteristics.
| Landscape Level | Indicator (Abbr.) | Class Level | Indicator (Abbr.) |
|---|---|---|---|
| Area | Total Area (TA) | Area | Total Class Area (CA) |
| Edge | Edge Density (ED) | Largest Patch Index (LPI) | |
| Shape | Shape Index (SHAPE_AM) | Percentage of Landscape (PLAND) | |
| Perimeter-Area Fractal Dimension (PAFRAC) | Edge | Edge Density (ED) | |
| Aggregation | Aggregation Index (AI) | Shape | Shape Index (SHAPE_AM) |
| Splitting Index (SPLIT) | Perimeter-Area Fractal Dimension (PAFRAC) | ||
| Connectivity (CONNECT) | Aggregation | Aggregation Index (AI) | |
| Interspersion and Juxtaposition Index (IJI) | Connectivity (CONNECT) | ||
| Diversity | Patch Density (PD) | Interspersion and Juxtaposition Index (IJI) | |
| Shannon Diversity Index (SHDI) | Cohesion (COHESION) | ||
| — | Splitting Index (SPLIT) |
Table Notes: For class-level indicators, each landscape type—Forest (FO), Agriculture (AG), Water (WA), and Built-up (BU)—is marked with a corresponding suffix (e.g., CA_FO, PLAND_AG, etc.). In total, 54 landscape pattern indicators are included.
- (2)
- Social Function (F): Social functions in rural areas are shaped by both urban spillover effects and endogenous development dynamics, resulting in the coexistence of multiple services such as residential, industrial, commercial, and tourism functions [1]. POI data have been widely used to represent the spatial distribution and intensity of socio-economic functions. In this study, we extracted eight POI functional categories that represent the major living- and production-oriented services in metropolitan fringe areas, and quantified social function for each unit using density and functional mixture (Table 3). The calculations are performed using the following formulas:where is the density of POI type i, is the number of POIs of type i, A is the area of the research unit, and is the total POI density.where represents the proportion of POI type i in the total POI density, and PMD denotes the POI entropy value, which reflects the degree of functional mixture.
Table 3.
Indicator Framework for Social Function (F) Characteristics.
Table 3.
Indicator Framework for Social Function (F) Characteristics.
| Type | Indicator | Abbr. |
|---|---|---|
| Category Level | Shopping Services Density | P_GW |
| Daily Life Services Density | P_SH | |
| Catering Services Density | P_CY | |
| Sports and Recreation Services Density | P_TY | |
| Accommodation Services Density | P_ZS | |
| Science, Education and Culture Density | P_KJ | |
| Corporate and Enterprise Density | P_GS | |
| Commercial Residential Density | P_SY | |
| Overall Level | POI Density | POID |
| POI Functional Mix Index | PMD |
- (3)
- Spatial Vitality (V): Spatial vitality dimension reflects the frequency and diversity of human activities within a spatial unit [37]. Compared to traditional social surveys, which often suffer from mismatches in statistical units and poor temporal resolution, mobile signaling data offer significant advantages for capturing real-time human mobility and behavior patterns [30]. In this study, mobile signaling data for six days in 2021 were obtained from the SmartSteps platform (http://daas.smartsteps.com (accessed on 25 January 2026)), including public holidays (1–3 October) and working days (11–13 October). The platform provides anonymized and aggregated mobility statistics and pre-classifies users into three groups based on its standard profiling rules, namely visitors, residents, and employment users. Based on these groups, spatial vitality was quantified using (i) the average user density for each group on working days, holidays, and overall, which reflects activity intensity, and (ii) the user mix degree (entropy) on working days and holidays, which reflects the diversity and balance of activity structure across groups (Table 4). The calculations are performed using the following formulas:where D is the density of user type i, M is the number of users of type i, and A is the area of the spatial unit.where UMD represents user entropy, indicating the degree of diversity among different user types within the unit. A higher value of UMD implies a more balanced presence of visitors, residents, and commuters, reflecting greater spatial vitality.
Table 4.
Indicator Framework for Spatial Vitality (V) Characteristics.
Table 4.
Indicator Framework for Spatial Vitality (V) Characteristics.
| Type | Indicator | Abbr. |
|---|---|---|
| User Density | Avg. Visitor Density (Weekday) | D_WOV |
| Avg. Visitor Density (Holiday) | D_HOV | |
| Avg. Visitor Density (Overall) | D_TOV | |
| Avg. Resident Density (Weekday) | D_WOD | |
| Avg. Resident Density (Holiday) | D_HOD | |
| Avg. Resident Density (Overall) | D_TOD | |
| Avg. Employment User Density (Weekday) | D_WOE | |
| Avg. Employment User Density (Holiday) | D_HOE | |
| Avg. Employment User Density (Overall) | D_TOE | |
| User Mix | Overall User Mix Degree | UMD |
| User Mix Degree (Weekday) | UMD_WO | |
| User Mix Degree (Holiday) | UMD_HO |
3.3. Characterization of Hybrid Rural Landscape Based on Machine Learning Clustering
Machine learning clustering algorithms have been widely used for landscape characterizations [38], ecosystem service bundles [39], and urban mixed-use zones [29]. To reduce the risk that any single dimension dominates the structure of high-dimensional data, this study adopted a “stepwise clustering and integration” strategy (Figure 2). Specifically, clustering was first performed separately for the three dimensions—landscape pattern (P), social function (F), and spatial vitality (V)—to identify dimension-specific subtypes; these subtypes were then integrated to derive the final hybrid rural landscape types. The specific steps are as follows:
- (1)
- Clustering Algorithm Selection: The Gaussian Mixture Model (GMM) was selected due to its suitability for handling nonlinear and high-dimensional data structures [40,41]. The model was applied independently to the P, F, and V datasets to generate clustering results for each dimension.
- (2)
- Cluster Number Determination: The elbow method was used to determine the optimal number of clusters for each dimension.
- (3)
- Clustering Performance Evaluation: A combination of quantitative and qualitative approaches was employed. The silhouette coefficient (SC), Calinski-Harabasz index (CHI), and Davies-Bouldin index (DBI) were used to assess clustering performance. Additionally, scatter plots and remote sensing imagery were used to visually validate clustering results.
- (4)
- Result Interpretation and Case Identification: Boxplots and radar charts were used to describe the characteristics of each cluster. Representative samples corresponding to the “cluster centers” were identified, and spatial distribution maps were generated.
- (5)
- Hybrid Type Coding and Classification: Each rural unit (RU) was assigned a composite code (e.g., P0F1V2) based on the P-F-V clustering results. Similar types were then merged based on spatial similarity and adjacency principles, resulting in the final characterization of hybrid rural landscape types.
3.4. Spatial Differentiation and Driving Mechanisms of Hybrid Rural Landscape Types
To further reveal the spatial differentiation patterns, evolutionary trajectories, and driving mechanisms of hybrid rural landscape types in metropolitan fringe areas, this study proceeded as follows: First, ArcMAP was used to map the spatial distribution of the identified hybrid landscape types. Second, the “Adjacency Length” metric was calculated using the “Polygon Neighbors” tool to quantify the degree of spatial adjacency between types (with larger values indicating stronger spatial proximity). Network graphs and chord diagrams were used for visualization. Finally, by integrating relevant policy documents—such as territorial spatial planning, development zone master plans, ecological redline delineations, and permanent basic farmland protection policies—with literature review and field investigations, the study inferred the formation logic, identified typical evolutionary modes, and summarized the multi-faceted driving mechanisms underlying the spatial patterns of each type.
In addition, the correspondence between the methodological workflow and the reported results is summarized as follows: (1) The dimension-specific clustering results based on the P-F-V framework (Section 3.2) and the independent clustering steps (Section 3.3, Steps 1–4) are presented in Section 4.1. (2) The characteristics of the final hybrid landscape types derived from the integration step (Section 3.3, Step 5) are analyzed in Section 4.2. (3) The spatial gradient patterns revealed by the spatial analysis (Section 3.4) are reported in Section 4.3. (4) The spatial distribution patterns and the resulting evolutionary modes inferred from the spatial configuration and adjacency structure (Section 3.4) are presented in Section 4.4.
4. Results
4.1. Characterization Results of Rural Landscape P, F, and V Feature Types
According to the elbow method (Figure A1), the rural units (RUs) in Baoshan District were clustered into four types for landscape pattern (P) (SC = 0.145, CHI = 23.875, DBI = 1.608), five types for social function (F) (SC = 0.258, CHI = 61.413, DBI = 1.134), and four types for spatial vitality (V) (SC = 0.308, CHI = 85.149, DBI = 0.982). The spatial distributions of the cluster results for each dimension are shown in Figure 4. The characteristic indicators of each dimension are further analyzed using boxplots (Figure 5, Figure 6 and Figure 7) and radar charts (Figure A2). Detailed interpretations are as follows:
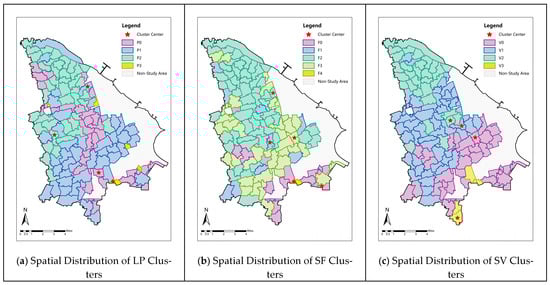
Figure 4.
Clustering results and spatial distribution of RUs in the P, F, and V dimensions.
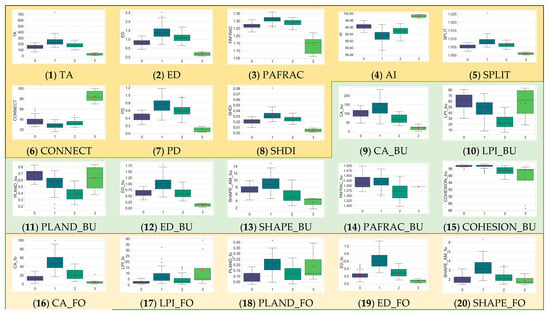
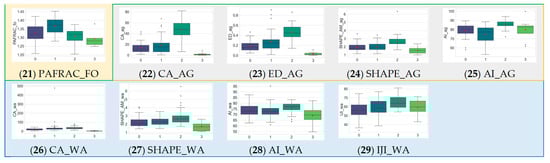
Figure 5.
Boxplot Analysis of Indicators for Four Landscape Pattern (P) Types. Colors distinguish clusters. In each boxplot, the central line indicates the median, and the box spans the interquartile range (25th–75th percentiles). Whiskers extend to 1.5 times the interquartile range, and points beyond the whiskers are plotted as outliers. Red circles indicate the mean value for each cluster.
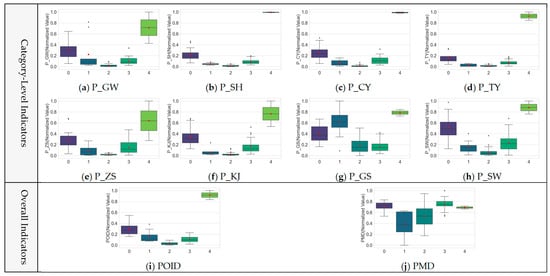
Figure 6.
Boxplot Analysis of Indicators for Five Social Function (F) Types. Colors distinguish clusters. In each boxplot, the central line indicates the median, and the box spans the interquartile range (25th–75th percentiles). Whiskers extend to 1.5 times the interquartile range, and points beyond the whiskers are plotted as outliers. Red circles indicate the mean value for each cluster.
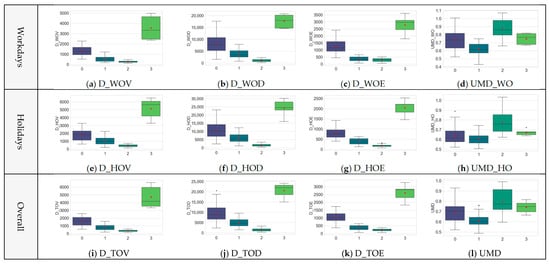
Figure 7.
Boxplot Analysis of Indicators for Four Spatial Vitality (V) Types. Colors distinguish clusters. In each boxplot, the central line indicates the median, and the box spans the interquartile range (25th–75th percentiles). Whiskers extend to 1.5 times the interquartile range, and points beyond the whiskers are plotted as outliers. Red circles indicate the mean value for each cluster.
- (1)
- Cluster Analysis of Landscape Pattern (P) Characteristics
Four distinct landscape pattern (P) cluster types were identified. ① High-Density Built-Up Type (P0): Characterized by high values in built-up land indicators such as CA, PLAND, and LPI (Figure 5(9)–(11)), while forest land indicators (CA, PLAND, LPI, SHAPE) are low (Figure 5(16)–(18),(20)), and farmland and water body indicators fall in the medium range. This suggests that RUs of this type are dominated by construction land with relatively scarce forest resources, retaining only small patches of farmland and water. ② Small High-Density Built-Up Type (P3): Marked by significantly smaller TA compared to the other three types (Figure 5(1)), with high PLAND for construction land (Figure 5(11)), and low CA values for forest, farmland, and water (Figure 5(16),(22),(26)). This indicates that these RUs are the smallest in jurisdictional area, with dense development and limited ecological land resources. ③ Forest-Built-Up Mosaic Type (P1): Exhibits the highest values for built-up land CA, PLAND, ED, SHAPE, and COHESION (Figure 5(9),(11)–(13),(15)), and the highest values for forest land CA, ED, SHAPE, and PAFRAC (Figure 5(16),(19)–(21)), while farmland and water CA are relatively low (Figure 5(22),(26)). AI and CONNECT values are significantly lower than those of other types (Figure 5(4),(6)), while PD, ED, SHDI, and SPLIT are notably higher (Figure 5(2),(5),(7),(8)). This indicates a complex and fragmented spatial structure, with a mosaic of forest and built-up land. ④ Water-Farmland Mosaic Type (P2): Features the highest values for farmland indicators such as CA, SHAPE, AI, and ED (Figure 5(22)–(25)), and for water body indicators including CA, SHAPE, AI, and IJI (Figure 5(26)–(29)). Forest CA ranks second only to P1 (Figure 5(16)), while built-up land PLAND and PAFRAC are the lowest (Figure 5(11),(14)). This implies that the area is mainly composed of farmland and water bodies, forming a structurally diverse mosaic landscape with low construction density.
- (2)
- Cluster Analysis of Social Function (F) Characteristics
The Social Function (F) dimension was clustered into five categories (Figure 6). ① Ultra-high Density Type (F4): This category includes only two RUs near the central urban area, where all types of social function facility densities are significantly higher than the other four categories (Figure 6a–h), and it shows the highest POID (Figure 6i), reflecting a strong comprehensive service capacity. ② Commercial-Dominant Type (F0): This group ranks second in POID (Figure 6i). Densities of shopping, daily life, and dining services are only slightly lower than F4 (Figure 6a–c), indicating a strong consumer orientation and commercial atmosphere. ③ Residential-Dominant Type (F3): This type has the highest PMD, with accommodation and business housing densities second only to F4 (Figure 6e,h). Densities of educational and recreational facilities are at an upper-middle level (Figure 6d,f), highlighting its pronounced residential function and balanced service mix. ④ Enterprise-Dominant Type (F1): Most facility densities are the lowest, with only the density of enterprise POIs at a medium-high level (Figure 6g). PMD is the lowest among all types (Figure 6j), suggesting a single-function structure mainly for business and office purposes. ⑤ Low-Density Type (F2): Facility densities in all categories are relatively low, reflecting weak social service provision.
- (3)
- Cluster Analysis of Spatial Vitality (V) Characteristics
Four cluster types of spatial vitality (V) were identified, with consistent clustering trends across workdays, holidays, and overall contexts (Figure 7a–l). Based on the intensity of spatial vitality, the clusters were labeled as: High Vitality (V3), Medium-High Vitality (V0), Medium Vitality (V1), Low Vitality (V2). Among them, V1 shows the lowest user mix index, indicating a dominant residential user base; whereas V2 demonstrates the highest user mix index, suggesting a relatively balanced proportion of residential, visitor, and employment users.
4.2. Characterization and Interpretation of Rural Landscape P–F–V Hybrid Types
By integrating the clustering results of landscape pattern (P), social function (F), and spatial vitality (V), a total of 30 P-F-V composite types were identified among the 124 rural units (RUs) in Baoshan District. To enhance the interpretability of type classification and its applicability for governance, these 30 combinations were further consolidated into 11 typical HTs based on their similarity in feature composition and spatial proximity (Table 5). For example, combinations such as P0F0V0, P3F3V0, P0F0V3, P3F0V0, P3F4V3, P0F3V0, and P1F0V3 are all characterized by high construction density, dense public facilities, and strong spatial vitality, and are mainly concentrated in or around the central urban area. Thus, they are grouped under the “Urban Core with High Vitality (HT1)”. The 11 HTs were then interpreted based on the P-F-V dimensions, and their spatial distribution was analyzed (Table 5).
Table 5.
Characteristics, Spatial Distribution, Problem Diagnosis, and Governance Strategies of the 11 Hybrid Rural Landscape Types in Baoshan District.
(1) Urban Core with High Vitality (HT1): This type is mainly concentrated within the boundary of the central urban area (Table 5) and is characterized by the combination of “P0/P3 + F0/F3/F4 + V0/V3.” It features extremely high density of built-up land (PLAND_BU mostly ranging from 0.60 to 0.75) and a low proportion of forest land (PLAND_FO ranging from 0.05 to 0.12); the density of social service facilities is high (POIDnorm mainly distributed within 0.20–0.35 and above 0.80), particularly dominated by shopping, catering, and daily services; and spatial vitality is extremely strong (D_TOD exceeding 6000 persons/km2). Remote sensing images indicate that these RUs are predominantly composed of residential communities with a small proportion of industrial and unused land. Field investigations of representative cases (Jiangyang Village and Xin’er Village) further confirm that the original rural settlement texture has been completely replaced by urbanized landscapes. The sites feature dense high-rise housing estates and wide urban arterial roads, with continuous street-front commercial storefronts and very limited remaining industrial buildings. These units are mainly located in towns such as Gaojing and Songnan and have experienced intensive urbanization since the 1990s; as a result, most village-level administrative structures have been dissolved, farmland remnants are absent, and traditional rural settlement morphology has largely disappeared.
(2) Secondary Urban Expansion Type (HT2): Mainly distributed in areas outside the Outer Ring Road of Shanghai, around township centers, this type is characterized by “P0/P3 + F0/F3 + V1.” Compared with HT1, it shows similar landscape pattern features, but slightly lower social function density and spatial vitality (POIDnorm mainly ranging from 0.10 to 0.35). Remote sensing imagery shows a mixture of residential communities, industrial land, and unused land within these RUs, with the unused areas often resulting from industrial downsizing and rural demolition. Field observations from representative cases (Yangmuqiao Village and Yangbei Village) indicate a mosaic of newly built resettlement communities and large fenced vacant lots formed by industrial reduction and village clearance. Although most village-level administrative structures remain formally intact, the physical environment is rapidly urbanizing. The widespread presence of fenced construction sites and undeveloped land further suggests that these areas constitute a key frontier of urban expansion, where rural characteristics have largely disappeared.
(3) Urban–Rural Industrial–Agricultural Hybrid Type (HT3): Distributed in the transitional zones extending from township and industrial centers outside the main urban area (Table 5 line c), this type is characterized by “P0 + F1/F2 + V1/V0.” It features a high proportion of built-up land (mainly industrial buildings and rural settlements, PLAND_BU mostly ranging from 0.60 to 0.75), with scattered farmland and water systems, low density of social services (POIDnorm mostly <0.20), and moderate spatial vitality. Field observations from representative cases (Shuiliqiao Village and Beizong Village) indicate that small township enterprise workshops are located directly adjacent to vegetable greenhouses or fragmented cropland, often separated only by simple fences or narrow rural roads, with little effective planning buffer. This disorderly interface reflects the unit’s position at the administrative margins of townships: on the one hand, peripheral location is associated with weak public service provision (an administrative-boundary effect); on the other hand, the area receives pronounced industrial spillover (an industrial-radiation effect). Together, these forces produce a patchwork landscape where industrial production and agricultural land uses are interwoven.
(4) Industrial Cluster with Low Vitality Type (HT4): This type is concentrated in the industrial zones of Yuepu Town and Luojing Town and is characterized by “P0 + F1/F2 + V2.” It shows a high proportion of built-up land but low levels of social service facilities (POIDnorm mostly <0.20) and spatial vitality (D_TOD < 2000 persons/km2). Remote sensing imagery reveals that these RUs are dominated by industrial land with a few remnants of rural settlements, leading to high development density but low population density, thus forming a space with single functionality and limited vitality. Field observations from representative cases (Guijiamu Village and Sujia Village) indicate that traditional rural settlements have been almost entirely demolished and replaced by standardized large-span factory buildings and logistics warehouses. Roads are wide but primarily used by heavy trucks, with few pedestrians and little street-front commerce; the areas are often enclosed by solid perimeter walls, producing a monotonous landscape with limited everyday life. This pattern can be traced to the development of Yuepu Industrial Park initiated in 1999 and Baoshan Industrial Park initiated in 2003: large-scale relocation and redevelopment led to the complete disappearance of traditional rural landscapes, creating a typical industrial space characterized by high development intensity but low social vitality.
(5) High-Quality Eco-Residential Type (HT5): This type is clustered within the Outer Suburban Ring, near designated greenbelt construction zones. It is characterized by the combination “P1 + F0/F3 + V0,” indicating a high and concentrated proportion of forest and built-up land (PLAND_FO mostly ranging from 0.15 to 0.25; PLAND_BU mostly ranging from 0.50 to 0.60), relatively high and balanced density of social service facilities (POIDnorm mainly ranging from 0.10 to 0.35), a prominent residential function, and strong spatial vitality. Remote sensing images show that built-up land in these RUs is primarily composed of residential communities, forming a hybrid urban–ecological landscape influenced by the surrounding greenbelt. Field investigations in representative cases (Qianwan Village and Dahuang Village) reveal a typical “urban–green integration” landscape: the area is largely composed of low-density garden apartments or gated villa compounds, embedded within public green spaces and urban ecological corridors that constitute part of the Outer Ring greenbelt. Streets are lined with mature roadside trees (e.g., camphor trees), creating a pleasant living environment. Although traditional rural landscape elements (e.g., cropland and natural villages) have largely disappeared (Table 5 line e), this type reflects a new peri-urban residential interface jointly driven by real-estate development and ecological construction, oriented toward high-quality living.
(6) Eco-Residential Expansion Type (HT6): This type is scattered across two types of areas: (1) Transitional zones between HT5 units and more rural surroundings within the Outer Suburban Ring, and (2) township centers located beyond the ring. It is characterized by the combination “P1 + F3 + V1,” suggesting similarities in structure and function to HT5 (PLAND_FO mostly ranging from 0.15 to 0.25; PLAND_BU mostly ranging from 0.50 to 0.60; POIDnorm mostly ranging from 0.10 to 0.35), but with slightly lower spatial vitality (D_TOD < 6000 persons/km2). Remote sensing imagery (Table 5 line f) indicates that HT6 retains more undeveloped and vacant land compared to HT5. Field observations in representative cases (Fengshou Village and Feng Village) show that the landscape is dominated by newly built mid- to high-rise resettlement housing, while traditional rural dwellings have been almost entirely removed. Although planned ecological green corridors have taken shape, they are frequently interrupted by fenced parcels awaiting development, where unmanaged vegetation is common. This mosaic of urban communities, ecological greenspace, and vacant patches clearly indicates an area in transition toward an eco-oriented urban residential landscape.
(7) Eco-Industrial High-Vitality Type (HT7): This type is concentrated in the Wusong Sub-Center of Baoshan and the southwestern industrial belt. It exhibits the combination “P1/P3 + F1/F2 + V0,” which reflects a high proportion of both built-up land and forested areas, extremely low and functionally narrow density of social services (mainly enterprise and production uses, POIDnorm mostly <0.20), but a high level of spatial vitality (D_TOD ranging from 6000 to 12,000 persons/km2). Under the dual influence of industrial park development and greenbelt policies, this type has formed a landscape interweaving industrial elements with ecological space. Though some unused land remains, traditional rural characteristics have largely vanished (Table 5 line g). Field investigations in representative cases (Xibin Village and Sanxing Village) indicate a successful transition from traditional industrial districts toward a “innovation–ecology” composite function. On site, conventional rural features are absent; instead, modern R&D office buildings and garden-style factories are embedded within extensive landscaped green space and waterfront ecological corridors, creating an “industry-in-forest” landscape. These areas have been planned as the “Wusong Sci-Tech Innovation Industrial Park” and “Urban Industrial Reserved Areas,” reflecting a broader trend of rural space shifting toward a hybrid industrial community that combines ecological functions with productive output.
(8) Eco-Agricultural–Industrial Hybrid Type (HT8): This type is scattered along the western boundary of Baoshan District, adjacent to Jiading District. It is defined by the combination “P1 + F2 + V1,” indicating a high proportion of built-up land and forest (PLAND_FO mostly ranging from 0.15 to 0.25), while social facility density and spatial vitality remain low (POIDnorm mostly <0.10; D_TOD ranging from 3000 to 6000 persons/km2). Remote sensing images show that built-up areas mainly consist of rural settlements and industrial buildings, alongside extensive vacant land. This creates a mixed spatial landscape composed of industry, green space, and rural elements (Table 5 line h). Field investigations in representative cases (Shenyang Village and Lao’an Village) reveal that older rural settlements are still present but often in a state of gradual decline. Industrial land is largely made up of scattered, low-end warehouses or small processing workshops, many of which are idle or operating at reduced capacity. Built-up parcels are interwoven with substantial forest patches and abandoned vacant land. Limited real-estate development and weak industrial spillover, together with stringent ecological conservation policies, have shaped a transitional landscape that is “ecology-prioritized but industry-lagging.” This suggests that the area is at an early stage of transformation toward a multifunctional eco-industrial space, where spatial structure has not yet been effectively integrated.
(9) Traditional Low-Vitality Rural Type (HT9): This type covers the largest spatial extent and is primarily located in the rural hinterlands of the city’s outermost fringe. It is characterized by the combination “P2/P1 + F2/F3 + V2,” indicating a high proportion of farmland, water bodies, and forests (CA_AG mostly ranging from 40 to 60 ha), with limited and fragmented built-up land, including a small amount of industrial land. The density of social service facilities and the level of spatial vitality are the lowest among all types (POIDnorm mostly <0.10; D_TOD < 2000 persons/km2). Remote sensing imagery reveals that the built-up land is dominated by traditional rural settlements, with a landscape pattern interwoven with farmland, woodland, water bodies, and settlements, making this the most representative of traditional rural landscapes (Table 5 line i). Field investigations in representative cases (Tangwan Village and Yangqiao Village) further indicate that two- to three-story self-built brick-and-concrete houses are typically arranged in ribbon-like patterns along waterways, surrounded by contiguous paddy fields, vegetable greenhouses, and fishponds. Because these areas are minimally affected by urban sprawl or industrial spillover, commercial housing estates and large factories are rarely observed; only scattered low-density household workshops are present. Local development therefore relies primarily on endogenous rural dynamics. This pattern maintains a traditional landscape matrix while incorporating only limited industrial functions, thereby reflecting a gradual pathway of rural transformation.
(10) Rural Agro-Industrial Hybrid Type (HT10): This type is found in transitional zones beyond the Outer Suburban Ring, between industrial clusters and rural hinterlands. It is defined by the combination “P2 + F2/F1 + V1,” suggesting a greater proportion of industrial land and slightly higher social service density and spatial vitality compared to HT9 (D_TODapproximately 3000–6000 persons/km2). Spatially, HT10 is closer to urban and industrial zones (HT4) and is influenced by both “industrial spillover” and localized “low-density development.” It displays a hybrid spatial pattern combining rural settlements, farmland, industrial plants, and a small number of urban residences (Table 5j). Field observations in representative cases (Changchun Village and Juyuanqiao Village) show a close intermixing of rural settlements, cropland, and small- to medium-sized industrial workshops. Unlike the large industrial parks typical of HT4, factories here are mainly village-level enterprises or household workshops, often simple structures with color-steel sheet roofs. They are scattered among self-built houses and farmland without clear physical buffers. This reflects a gradual transformation of peri-urban rural spaces into multifunctional zones, shaped by the interaction of endogenous rural dynamics, external industrial expansion, and low-intensity development.
(11) Town-Centered Residential Type (HT11): This type is situated in the transitional zones beyond the Outer Suburban Ring, between township centers and rural hinterlands. It is characterized by the combination “P2 + F3/F0 + V1/V0,” indicating that although farmland remains the dominant landscape characteristics (CA_AG mostly ranging from 40 to 60 ha), social service facility density and spatial vitality are higher than in HT9 and HT10 (POIDnorm mainly ranging from 0.10 to 0.35; D_TOD approximately 3000–12,000 persons/km2)—at an overall moderate level, with a clear emphasis on residential function. Remote sensing imagery shows that built-up land in these RUs mainly consists of rural settlements and township housing, resulting in a spatial pattern where “village textures” and “urban forms” coexist (Table 5 line k). Field investigations in representative cases (Yuanjing Village and Zhangshi Village) reveal a typical “semi-urban, semi-rural” landscape, where traditional natural-village fabric and modern multi-story township housing are juxtaposed with clear spatial boundaries. On one side, the traditional village fabric retains small vegetable plots and self-built houses; on the other, a more urbanized streetscape contains shops, supermarkets, and community service centers. However, there is little effective spatial transition between the two. This patchwork reflects a particular stage in which township functions extend into rural areas, creating a pattern that is functionally complementary but spatially bifurcated, and has not yet achieved organic integration.
4.3. Spatial Adjacency Analysis of Hybrid Rural Landscape Types
Based on the results of the “neighborhood analysis” (Table A1), the spatial adjacency and combination relationships among the 11 hybrid landscape types were examined (Figure 8 and Figure 9), leading to the following findings:
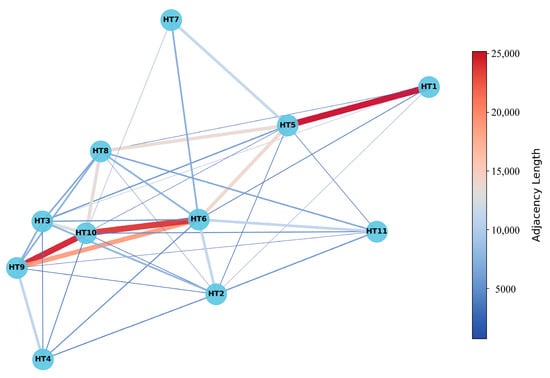
Figure 8.
Adjacency Network of the 11 HTs.
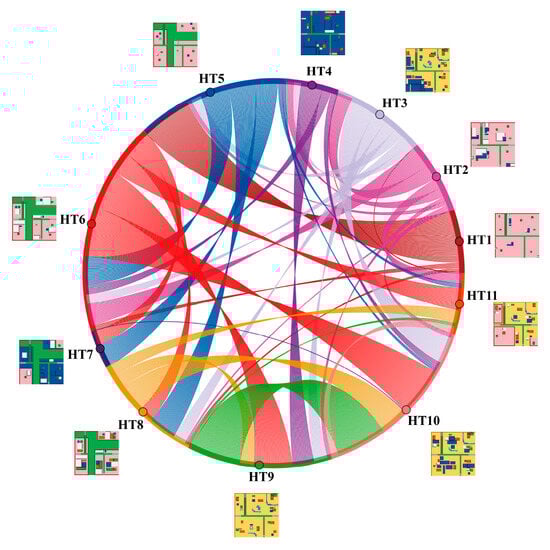
Figure 9.
Adjacency Chord Diagram of the 11 HTs.
- (1)
- The HT1 (Urban Core with High Vitality) and the HT5 (High-Quality Eco-Residential type) have the longest adjacency length (25,194.091 m), indicating a close spatial linkage and sequential progression between the two. Theoretically, a more obvious transition would be expected between HT1 and HT2 (Urban Core with High Vitality ↔ Secondary Urban Expansion Type), since HT2 more closely resembles a developmental stage of HT1 in terms of function and form. However, in practice, HT1 and HT2 are hardly adjacent. Instead, the strong spatial connection between HT1 and HT5 reflects Shanghai’s planning intervention in the rural urbanization process through ecological construction—for instance, the launch of the “Urban Ecological Park Belt” in 1995. The urbanization of HT5 did not merely follow the high-density development path of HT1, but rather evolved into a coupled pattern of urban and ecological elements. Moreover, this also reflects the functional complementarity between HT5 and HT1: the dense built-up areas of HT1 inherently rely on the ecosystem services provided by the large green spaces within HT5.
- (2)
- HT5 also exhibits strong adjacency with HT6 (14,142.720 m), HT8 (13,815.629 m), and HT7 (11,125.557 m). The close spatial link between HT5 and HT6 (High-Quality Eco-Residential ↔ Eco-Residential Expansion Type) is underpinned by their shared characteristics—both represent the integration of ecological and residential functions. HT6 units are often located on the urban fringe and tend to transition into HT5. The adjacency pattern of HT5 ↔ HT6 ↔ HT8 (High-Quality Eco-Residential ↔ Eco-Residential Expansion Type ↔ Eco-Agricultural–Industrial Hybrid Type) reflects the gradual urbanization process under the combined influence of industrialization and ecological corridor planning. However, due to the limited industrial spillover into HT8, these areas retain elements of rural settlements and exhibit a hybrid spatial texture of villages, industrial facilities, and green spaces. The adjacency between HT5 and HT7 (High-Quality Eco-Residential ↔ Eco-Industrial High-Vitality Type) suggests a complementary relationship among industrial, ecological, and residential functions in urban–rural integration. HT7 offers strong industrial activity and ecological elements, creating potential employment opportunities for nearby residents, while HT5 provides high-quality living environments and access to green spaces. The linkage between HT5 and HT7 exemplifies a sustainable urbanization model that balances economic vitality, ecological protection, and quality of life.
- (3)
- The HT9 (Traditional Low-Vitality Rural Type) and the HT10 (Rural Agro-Industrial Hybrid Type) exhibit the second-longest adjacency length (24,658.733 m), revealing a transitional relationship between traditional rural areas and those with increasing industrial activity in the urban periphery. Both HT9 and HT10 are situated at the outer edge of the city. HT10 represents a transformation of HT9 through the gradual introduction of industrial elements, reflecting a shift from an agriculture-dominated economy toward small-scale industrial development. HT10 offers moderate economic growth and employment opportunities, fostering economic diversification in rural areas. The adjacency of HT9 ↔ HT10 illustrates the local governments’ and developers’ strategic responses to enhance regional vitality, expand the tax base, and improve infrastructure through economic restructuring.
In addition, HT10 shows relatively high adjacency with HT6 (24,159.931 m), HT8 (13,352.099 m), and HT3 (12,659.901 m). The adjacency between HT10 ↔ HT6 and HT10 ↔ HT8 (Rural Agro-Industrial Hybrid Type and Eco-Residential Expansion Type/Eco-Agricultural–Industrial Hybrid Type) reflects the emergence of a complex transitional interface in peri-urban areas, shaped by the overlapping of ecological corridor construction and rural industrialization processes. On both sides of this interface, industrial, ecological, and rural landscape elements are interwoven. This spatial pattern arises in part because the city’s ecological greenbelt did not extend into HT10 areas, resulting in significant differences in landscape characteristics between HT10 and its adjacent types HT6 and HT8 despite their proximity. While HT10 and HT3 (Rural Agro-Industrial Hybrid Type ↔ Urban–Rural Industrial–Agricultural Hybrid Type) both exhibit hybrid features of industry and rural settlements, their evolution is driven by different mechanisms. HT3 is located inside the urban greenbelt and lies closer to industrial clusters (HT4), thus being more strongly influenced by industrial spillover effects. In contrast, HT10 is adjacent to traditional rural areas (HT9) and more deeply shaped by endogenous rural development dynamics.
In summary, under the joint influence of urban expansion, ecological planning, industrial extension, and endogenous rural development, the peri-urban areas of Baoshan District have evolved into a spatial structure characterized by nested, multi-dimensional, and continuous transitions between rural HTs (Figure 10). The spatial adjacency relationships reveal a typical gradient structure of rural transformation: from “high-density urbanized” → “ecologically embedded” → “production–living integrated” → “traditional rural landscapes”.
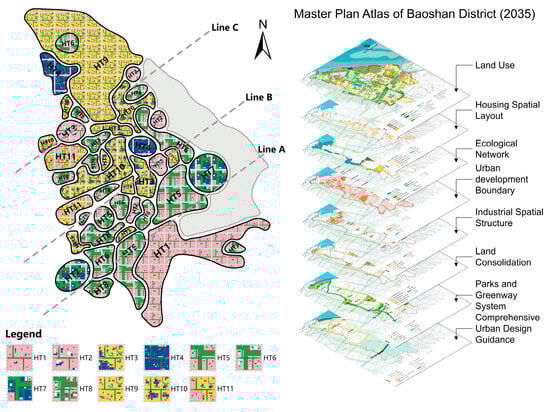
Figure 10.
Spatial Distribution of the 11 HTs in Baoshan District. The planning atlas shown on the right is sourced from Ref. [33].
4.4. Spatial Distribution Patterns and Evolutionary Modes
Based on the characterization of the 11 hybrid landscape types (HTs) and the analysis of their spatial adjacency relationships (Figure 8 and Figure 9), the study area exhibits a clear urban–rural gradient differentiation pattern (Figure 10). The spatial organization of Baoshan’s metropolitan fringe can be summarized as a multi-belt differentiated structure referenced to the Outer Ring Road (Line A), the Suburban Ring Expressway (Line B), and the Lianqi River (Line C) (Figure 10). Specifically, areas south of Line A are dominated by HT1 and HT2, reflecting the high-intensity urbanization of the central urban area and its outward expansion corridors. Areas north of Line C are mainly characterized by traditional rural hinterland types, maintaining relatively high integrity of the agricultural landscape matrix. In contrast, the zone between Lines A and C shows the greatest typological heterogeneity, where multiple types are spatially interwoven in a mosaic and patchwork pattern; industry-related types (e.g., HT4), eco-residential types (e.g., HT5 and HT6), and agro-industrial hybrid types (e.g., HT3 and HT10) are densely and intricately distributed within this belt.
Building on the above spatial gradient and type adjacency structure, rural landscape evolution in Baoshan’s fringe can be further summarized into five typical modes: (1) urban restructuring, characterized by high-density development and functional replacement; (2) ecological orientation, forming residential landscape interfaces embedded with ecological space; (3) industrial-driven transformation, featuring spatial restructuring guided by industrial agglomeration; (4) transitional hybridization, marked by the coexistence of small-scale industry and agricultural settlements; and (5) traditional preservation, maintaining an agriculture-dominated status.
5. Discussion
5.1. Multiple Driving Mechanisms of Hybridization and Typological Differentiation of Rural Landscapes in Metropolitan Fringe Areas
The hybridization and typological differentiation of rural landscapes in metropolitan fringe areas are not driven by a single factor, but rather result from the combined effects of multiple structural forces during urbanization and industrialization. Drawing on the 11 identified hybrid types (Table 5) as well as their spatial gradient (Figure 10) and evolutionary modes, and synthesizing planning policies, industrial spatial configuration, and field observations, the underlying driving logic can be understood from four dimensions: locational structure, policy and planning, industry and capital, and population and social structure.
- (i)
- Locational structure serves as the fundamental basis for landscape evolution. The relative distance of rural units from urban centers and township nodes, as well as their proximity to industrial parks and ecologically constrained spaces, determines both the direction and intensity of landscape transformation. In general, units closer to the urban core and major expansion corridors are more likely to experience increased development intensity and functional replacement, facing stronger urbanization pressure and faster landscape restructuring. By contrast, peripheral units that are less affected by urban spillover tend to maintain an agro-ecological landscape matrix and exhibit slower, more gradual transformation trajectories.
- (ii)
- Policy and planning play a key guiding and constraining role. Various regulatory planning tools—such as greenbelt control, permanent farmland protection, and industrial park strategies—set hard spatial boundaries, restrict functional access, and guide development directions. These policies determine whether, when, and how rural landscape transformation occurs. For example, areas under stronger ecological constraints are more likely to form residential or industrial interfaces embedded with ecological space, whereas areas influenced by industry-oriented planning are more likely to follow pathways characterized by industrial park expansion, land consolidation, and spatial restructuring. The overlay of differentiated policies further generates pronounced path dependence and stage-specific features in fringe landscape evolution.
- (iii)
- Industrial and capital investment serve as powerful forces in reshaping rural landscapes. Industrial park development, enterprise settlement, and industrial spillover can rapidly alter land-use structure and reorganize spatial form through the construction of roads, factories, and supporting facilities—effects that are particularly evident in industrial-dominated or agro-industrial hybrid types. Meanwhile, industrial upgrading and transformation may also give rise to new interface forms that integrate industrial functions with ecological space, manifested in the concurrent emergence of R&D and office uses, park renewal, and enhanced landscape greening.
- (iv)
- Demographic changes affect functional demand and vitality differentiation. Local population aging and the outflow of agricultural labor weaken traditional agricultural and settlement functions, leading to declines in public services and everyday activity intensity, thereby reducing spatial vitality. Conversely, areas near industrial parks and transport corridors are more likely to attract migrants and employment-related populations, generating increased housing demand and lifestyle changes that drive the renewal of residential forms and the agglomeration of service facilities. This may further trigger governance issues such as public service provision and community integration.
5.2. Comparison with Existing Studies
Existing studies on rural typologies in metropolitan fringe areas (or urban–rural transition zones) often classify rural areas based on a single dominant dimension, which to some extent limits a holistic understanding of the complex socio-ecological coupling mechanisms underpinning hybridized rural landscapes. Socioeconomic-oriented research typically constructs typologies using indicators such as employment structure, education level, labor market stability, and population structure and change, thereby revealing socioeconomic disparities and spatial heterogeneity in rural areas [14]. Sector-oriented studies, often focusing on peri-urban agriculture, characterize differences through agricultural land-use types and their changes, household and organizational attributes, as well as policy and planning conditions, and subsequently derive typologies of agricultural intensity. In contrast, landscape–ecological studies commonly use landscape pattern indices to capture differences in land-cover composition and spatial configuration along the urban–rural gradient, and apply clustering to identify gradient-based types for management and conservation purposes [35]. Compared with these approaches, this study integrates landscape pattern (P), social function (F), and spatial vitality (V) within a unified framework to systematically characterize “hybrid rural landscapes” from a socio-ecological coupling perspective. This enables typology identification to move beyond a single socioeconomic dimension, a single production-sector focus, or a single ecological-morphological dimension, and provides a more comprehensive explanation of the coupling and interactions among multiple factors in metropolitan fringe rural areas [36].
At the methodological level, data-driven and unsupervised typology identification has been increasingly used to support the extraction of regional types and representative samples along the urban–rural gradient. For example, Fiaschetti [32] applied Affinity Propagation (AP) clustering to identify regional types across the European urban–rural gradient and extract representative cases; Heumann [26] used AP as a mixed-data tool to integrate multiple indicators at a finer scale and redefine rural landscape types. Meanwhile, multi-source data fusion has also been employed for refined urban–rural boundary delineation. Zhang [27] integrated nighttime light (NTL) and POI data using wavelet transform and combined them with multi-resolution segmentation to extract urban–rural boundaries. In addition, studies on urban–rural interfaces have further examined driving factors on the basis of typology identification. Cao [18] adopted a two-step classification using random forest and k-medoids to identify interface types and employed multinomial logit models to explain influencing factors. By comparison, in response to the “hybridized and highly heterogeneous” characteristics of metropolitan fringe rural landscapes, this study integrates three complementary information domains—landscape pattern (P), social function (F), and spatial vitality (V)—within the same framework and applies the Gaussian Mixture Model (GMM) for model-based clustering. GMM allows different types to exhibit distinct degrees of dispersion and correlation structures in the indicator space, and determines the number of clusters relatively objectively through BIC, making it well suited for typology identification under multi-source, high-dimensional data conditions.
At the results level, the 11 hybrid rural landscape types identified in this study and their spatial gradient transitioning from highly urbanized forms toward traditional rural morphologies are consistent with the general pattern in urban–rural gradient research that emphasizes the coexistence of gradient differentiation and typological heterogeneity [35]. However, compared with studies that rely primarily on landscape pattern indices to characterize gradients and types, this study further incorporates social functions and human activity processes into typology identification. This enables more fine-grained and more interpretable distinctions among rural units with similar land-cover configurations by leveraging differences in functional structure and vitality intensity. Moreover, rather than focusing solely on the types themselves, we further analyze inter-type spatial adjacency and gradient sequences, revealing potential nesting and transformation relationships among types from the perspective of spatial organization. Building on this, we summarize interpretable evolution pathways and elevate the analysis from “type differentiation” to the level of “type associations and evolution corridors.” This structure facilitates a more direct linkage between mechanism discussion and typology-based governance strategies, providing clearer evidence for differentiated interventions.
5.3. Rural Landscape Governance Strategies Based on “Characterization—Problem Diagnosis”
As heterogeneity and hybridization intensify in metropolitan fringe rural landscapes, uniform “one-size-fits-all” governance measures often fail to respond effectively. Following the logic of “typology characterization–problem diagnosis–strategy implementation,” this study proposes using typology-based landscape characterization as the entry point for governance interventions, and formulating differentiated strategies for rural units of different hybrid types according to their dominant shortcomings, evolution pathways, and development stages (Table 5). To ensure effective implementation, territorial spatial planning should serve as the overarching framework, with the ecological conservation redline, permanent basic farmland, and the urban development boundary acting as baseline constraints, while coordinating broader policy objectives such as rural revitalization, industrial development, and ecological civilization. At the operational level, routine identification and updating of typologies can be supported through remote sensing, GIS, and multi-source data monitoring. Meanwhile, a collaborative governance mechanism led by the government and involving multiple stakeholders should be established, embedding type-specific measures into concrete administrative units, functional zoning schemes, and policy toolkits, so as to avoid fragmented governance and inconsistent interventions.
5.4. Limitations
First, while this study characterized hybrid rural landscapes based on the P-F-V framework, other relevant dimensions (e.g., ecosystem services, geomorphology) remain underexplored. Second, the proposed typology is built on a quasi-synchronous cross-sectional dataset assembled by integrating data from multiple years (Table 1). Because landscape patterns, socio-economic functions, and human activity dynamics can all change over time, the type membership of some rural units, particularly those near type boundaries, may fluctuate across different observation windows. In addition, as an unsupervised approach, the Gaussian Mixture Model (GMM) delineates type boundaries based on relative similarity among samples rather than predefined absolute thresholds, making it difficult to derive direct “hard-threshold” rules that can be readily used for planning regulation. Nevertheless, the primary aim of this study is to differentiate hybrid rural landscape characteristics and their spatial differentiation patterns, thereby providing an evidence base for subsequent typology-based diagnosis and strategy formulation, rather than to establish an operational threshold-based classification standard. Third, the evolutionary patterns were inferred from spatial gradients and qualitative evidence (e.g., remote sensing interpretation, field observations, and policy documents) rather than directly observed through longitudinal tracking. Future work could incorporate time-series remote sensing data and spatial process models to more objectively and continuously reveal rural landscape evolution trajectories and mechanisms. Fourth, the case study is focused on Baoshan District, Shanghai. Although some of the identified patterns may be representative, their generalizability to other metropolitan fringe regions requires further empirical validation. The analytical framework also holds potential for broader regional application and testing.
6. Conclusions
Rapid urbanization and industrialization have increasingly hybridized rural landscapes in metropolitan fringe areas. Using Baoshan District, Shanghai as a case, this study integrates multi-source geospatial big data to build a three-dimensional P-F-V indicator framework (landscape pattern, social function, and spatial vitality) and applies machine-learning clustering to identify 11 hybrid rural landscape types (HTs). Based on these HTs, we further examine spatial differentiation, adjacency relationships, and plausible evolution pathways, and derive typology-based governance implications. The main conclusions are as follows:
- (1)
- The identified HTs exhibit clear diversity and spatial differentiation, forming an urban–rural gradient from high-density urbanized to ecologically embedded, production-living integrated, and traditional rural landscapes, together with nontrivial adjacency structures across space.
- (2)
- Five representative evolution modes—urban restructuring, ecological orientation, industrial-driven, transitional hybridization, and traditional preservation—are summarized, shaped by the combined effects of locational structure, planning policy orientation, industrial and capital investment, and demographic changes.
- (3)
- Different HTs are associated with distinct dominant issues and governance needs. Accordingly, we propose differentiated interventions anchored in characterization-led diagnosis and supported by coordinated planning constraints and multi-stakeholder collaboration.
In summary, the proposed P–F–V framework provides an operational perspective for understanding and governing “non-typical” rural landscapes in metropolitan fringe contexts. Future research could expand the indicator dimensions and incorporate multi-temporal analyses to support comparative studies and empirical validations across different regional contexts.
Author Contributions
D.L.: conceptualization, methodology, writing—original draft preparation, writing—review and editing; S.L.: conceptualization, resources, funding acquisition, supervision, writing—original draft preparation; Z.B.: software, formal analysis, visualization; P.S.: data curation, formal analysis; Y.D.: methodology, writing—original draft preparation, writing—review and editing. All authors have read and agreed to the published version of the manuscript.
Funding
This research was funded by the National Natural Science Foundation of China: Digital Diagnosis, Simulation Regulation and Holistic Governance of Rural Landscape Conflict Risks in the Metropolitan Fringe: A Case Study of Rural Areas in Shanghai (grant number 52578095).
Data Availability Statement
The raw data supporting the conclusions of this article will be made available by the authors on request.
Conflicts of Interest
The authors declare no conflicts of interest.
Appendix A

Figure A1.
Determination of Cluster Numbers and Visualization of Clustering Results for the P, F, and V Dimensions.
Figure A1.
Determination of Cluster Numbers and Visualization of Clustering Results for the P, F, and V Dimensions.


Figure A2.
Radar Chart Visualization of Cluster Results Across P, F, and V Dimensions. (a): Landscape-level indicators in the P dimension; (b–e): Indicators related to built-up land, woodland, arable land, and water bodies in the P dimension; (f): Indicators in the F dimension; (g): Indicators in the V dimension.

Table A1.
Adjacency Lengths Between the 11 HTs.
Table A1.
Adjacency Lengths Between the 11 HTs.
| Type-A | Type-B | Adjacency Length (Meter) | Type-A | Type-B | Adjacency Length (Meter) |
|---|---|---|---|---|---|
| HT1 | HT5 | 25,194.09117 | HT2 | HT11 | 5243.495103 |
| HT9 | HT10 | 24,658.73363 | HT3 | HT6 | 4650.489392 |
| HT6 | HT10 | 24,159.93092 | HT2 | HT4 | 4446.655577 |
| HT6 | HT9 | 19,055.049 | HT4 | HT6 | 4280.711361 |
| HT5 | HT6 | 14,142.72021 | HT10 | HT11 | 3825.158623 |
| HT5 | HT8 | 13,815.62912 | HT4 | HT10 | 3545.401455 |
| HT8 | HT10 | 13,352.09933 | HT3 | HT4 | 3205.392192 |
| HT3 | HT10 | 12,659.9006 | HT1 | HT6 | 3087.489701 |
| HT5 | HT7 | 11,125.55716 | HT2 | HT9 | 2614.901672 |
| HT2 | HT6 | 10,871.32532 | HT2 | HT5 | 2544.058951 |
| HT6 | HT11 | 10,568.09754 | HT2 | HT10 | 2512.723575 |
| HT4 | HT9 | 10,534.57465 | HT5 | HT11 | 2297.647504 |
| HT2 | HT3 | 7569.283617 | HT1 | HT8 | 1850.078347 |
| HT6 | HT8 | 7390.465669 | HT5 | HT10 | 1842.841733 |
| HT8 | HT9 | 7053.869439 | HT9 | HT11 | 1670.750727 |
| HT6 | HT7 | 6734.935612 | HT2 | HT8 | 1141.216159 |
| HT3 | HT9 | 6571.795677 | HT7 | HT10 | 913.9580874 |
| HT8 | HT11 | 6178.646108 | HT1 | HT2 | 898.0397065 |
| HT3 | HT8 | 6017.508178 | HT1 | HT3 | 721.2523917 |
| HT3 | HT5 | 5304.077898 |
References
- Wang, X.; Liu, Y.; Shao, Y.; Li, S. Evolution pattern and mechanism of rural areal functions in Xi’an metropolitan area, China. Habitat Int. 2024, 148, 103088. [Google Scholar] [CrossRef]
- Li, T.; Chen, P.; Kong, X.; Sánchez-Aguilera, D. Multiple marginalizations: Understanding rural restructuring around metropolitan development zone—A case study from Pengdu Village, Shanghai. J. Rural Stud. 2025, 117, 103645. [Google Scholar] [CrossRef]
- Xu, N.; Zeng, P.; Guo, Y.; Siddique, M.A.; Li, J.; Ren, X.; Tang, F.; Zhang, R. The spatiotemporal evolution of rural landscape patterns in Chinese metropolises under rapid urbanization. PLoS ONE 2024, 19, e0301754. [Google Scholar] [CrossRef]
- Sun, Y.; Chen, C.; Yang, H. Exploring the spatial patterns of rural multifunctionality in China’s metropolitan hinterland and its driving forces: The case of Shanghai-Suzhou-Jiaxing-Huzhou region. Habitat Int. 2025, 165, 103562. [Google Scholar] [CrossRef]
- Dong, W.; Chunlai, C. A review of rural transformation studies: Definition, measurement, and indicators. J. Integr. Agric. 2023, 22, 3568–3581. [Google Scholar] [CrossRef]
- Yin, Q.; Wang, Q.; Su, B.; Zhang, Q.; Shen, X.; Zhou, S. The evolution, interaction, and management of rural resilience in Jiangsu province, China: Insights from a social-ecological system. J. Rural Stud. 2026, 121, 103914. [Google Scholar] [CrossRef]
- Han, P.; Xiong, H.; Hu, H.; Zhou, J.; Wang, M. Integrating Risk-Conflict assessment for constructing and optimizing ecological security patterns of Polder landscape in the Urban-Rural fringe. Ecol. Indic. 2024, 166, 112256. [Google Scholar] [CrossRef]
- Kangas, K.; Brown, G.; Kivinen, M.; Tolvanen, A.; Tuulentie, S.; Karhu, J.; Markovaara-Koivisto, M.; Eilu, P.; Tarvainen, O.; Similä, J. Land use synergies and conflicts identification in the framework of compatibility analyses and spatial assessment of ecological, socio-cultural and economic values. J. Environ. Manag. 2022, 316, 115174. [Google Scholar] [CrossRef]
- Wang, Q.; Wang, H. Dynamic simulation and conflict identification analysis of production–living–ecological space in Wuhan, Central China. Integr. Environ. Assess. Manag. 2022, 18, 1578–1596. [Google Scholar] [CrossRef]
- Liu, Y.; Zhou, Y.; Li, Y. Rural regional system and rural revitalization strategy in China. Acta Geogr. Sin. 2019, 74, 2511–2528. [Google Scholar]
- Liu, Y.; Zang, Y.; Yang, Y. China’s rural revitalization and development: Theory, technology and management. J. Geogr. Sci. 2020, 30, 1923–1942. [Google Scholar] [CrossRef]
- Geng, H.; Li, K. The strategies of overall spatial regulation for rural area: Based on Shanghai’s experience. Front. Urban Rural Plan. 2023, 1, 9. [Google Scholar] [CrossRef]
- Zelený, J.; Mercado-Bettín, D.; Müller, F. Towards the evaluation of regional ecosystem integrity using NDVI, brightness temperature and surface heterogeneity. Sci. Total Environ. 2021, 796, 148994. [Google Scholar] [CrossRef]
- Hedlund, M. Mapping the socioeconomic landscape of rural Sweden: Towards a typology of rural areas. Reg. Stud. 2016, 50, 460–474. [Google Scholar] [CrossRef]
- Mulya, S.P.; Hudalah, D.; Prilandita, N. Developing a new methodology for determining typologies of peri-urban agriculture: A case study of the Jakarta Bandung Mega Urban Region Indonesia. Land Use Policy 2024, 146, 107310. [Google Scholar] [CrossRef]
- Li, G.; Cao, Y.; He, Z.; He, J.; Cao, Y.; Wang, J.; Fang, X. Understanding the diversity of urban–rural fringe development in a fast urbanizing region of China. Remote Sens. 2021, 13, 2373. [Google Scholar] [CrossRef]
- Shen, J.; Li, Y.; Wang, Y. Nesting landscape character and personality assessment to intensify rural landscape regionality and uniqueness. Environ. Impact Assess. Rev. 2025, 110, 107705. [Google Scholar] [CrossRef]
- Cao, H.; Chen, C.; Chen, J.; Song, W.; He, J.; Liu, C. Differentiation of urban-rural interface and its driving mechanism: A case study of Nanjing, China. Land Use Policy 2024, 140, 107090. [Google Scholar] [CrossRef]
- Yang, T.; Du, C. Plant landscape characteristics of mountain traditional villages under cultural ecology: A case study of Pilin village. Sci. Rep. 2025, 15, 9695. [Google Scholar] [CrossRef]
- Lou, Y.; Huang, L.; Li, A.; Feng, T.; Wang, K. Evolution of the spatial pattern and influencing factors of rural settlements in the Taihu Basin over the past century—A case study of Huzhou City, Zhejiang Province. Res. Soil Water Conserv. 2025, 32, 320–331. [Google Scholar]
- Zuo, Y.; Zhang, L. Research on Local Ecosystem Cultural Services in the Jiangnan Water Network Rural Areas: A Case Study of the Ecological Green Integration Demonstration Zone in the Yangtze River Delta, China. Land 2023, 12, 1373. [Google Scholar] [CrossRef]
- Cattaneo, A.; Adukia, A.; Brown, D.L.; Christiaensen, L.; Evans, D.K.; Haakenstad, A.; McMenomy, T.; Partridge, M.; Vaz, S.; Weiss, D.J. Economic and social development along the urban–rural continuum: New opportunities to inform policy. World Dev. 2022, 157, 105941. [Google Scholar] [CrossRef]
- Cattivelli, V. Delimiting rural areas: Evidence from the application of different methods elaborated by Italian scholars. Land 2022, 11, 1674. [Google Scholar] [CrossRef]
- Žlender, V. Characterisation of peri-urban landscape based on the views and attitudes of different actors. Land Use Policy 2021, 101, 105181. [Google Scholar] [CrossRef]
- Dong, Q.; Cai, J.; Wu, L.; Li, D.; Chen, Q. Quantitative Identification of Rural Functions Based on Big Data: A Case Study of Dujiangyan Irrigation District in Chengdu. Land 2022, 11, 386. [Google Scholar] [CrossRef]
- Heumann, B.W.; Graziano, M.; Fiaschetti, M. A Data-Driven Algorithm to Redefine the US Rural Landscape: Affinity Propagation as a Mixed-Data/Mixed-Method Tool. Econ. Dev. Q. 2022, 36, 294–316. [Google Scholar] [CrossRef]
- Zhang, J.; Yuan, X.; Tan, X.; Zhang, X. Delineation of the urban-rural boundary through data fusion: Applications to improve urban and rural environments and promote intensive and healthy urban development. Int. J. Environ. Res. Public Health 2021, 18, 7180. [Google Scholar] [CrossRef] [PubMed]
- Dong, Y.; Liu, S.; Pei, X.; Wang, Y. Identifying critical landscape patterns for simultaneous provision of multiple ecosystem services–A case study in the central district of Wuhu City, China. Ecol. Indic. 2024, 158, 111380. [Google Scholar] [CrossRef]
- Zheng, M.; Wang, H.; Shang, Y.; Zheng, X. Identification and prediction of mixed-use functional areas supported by POI data in Jinan City of China. Sci. Rep. 2023, 13, 2913. [Google Scholar] [CrossRef]
- Zhang, B.; Zhong, C.; Gao, Q.; Shabrina, Z.; Tu, W. Delineating urban functional zones using mobile phone data: A case study of cross-boundary integration in Shenzhen-Dongguan-Huizhou area. Comput. Environ. Urban Syst. 2022, 98, 101872. [Google Scholar] [CrossRef]
- Lee, S.; Lee, S.; Putri, D.W. Multifaceted associations between built environments and POI visit patterns by trip purposes. Cities 2025, 161, 105903. [Google Scholar] [CrossRef]
- Fiaschetti, M.; Graziano, M.; Heumann, B.W. A data-based approach to identifying regional typologies and exemplars across the urban–rural gradient in Europe using affinity propagation. Reg. Stud. 2021, 55, 1939–1954. [Google Scholar] [CrossRef]
- Shanghai Baoshan District People’s Government; Shanghai Municipal Bureau of Planning and Natural Resources. Master Plan and General Land-Use Plan of Baoshan District, Shanghai (Public Reader) (2017–2035). 2019. Available online: https://xxgk.shbsq.gov.cn/article.html?infoid=421c19a3-54e1-4965-9548-93dd5fa3e3eb (accessed on 25 January 2026). (In Chinese)
- Baoshan District Statistics Bureau. Major Data Communiqué of the Seventh National Census of Baoshan District. Available online: https://sghexport.shobserver.com/html/baijiahao/2021/05/31/447923.html (accessed on 25 January 2026). (In Chinese)
- Kaminski, A.; Bauer, D.M.; Bell, K.P.; Loftin, C.S.; Nelson, E.J. Using landscape metrics to characterize towns along an urban-rural gradient. Landsc. Ecol. 2021, 36, 2937–2956. [Google Scholar] [CrossRef]
- Fu, B.; Liu, Y.; Zhao, W.; Wu, J. The emerging “pattern-process-service-sustainability” paradigm in landscape ecology. Landsc. Ecol. 2025, 40, 54. [Google Scholar] [CrossRef]
- Liu, S.; Lai, S.-Q.; Liu, C.; Jiang, L. What influenced the vitality of the waterfront open space? A case study of Huangpu River in Shanghai, China. Cities 2021, 114, 103197. [Google Scholar] [CrossRef]
- Li, N.; Quan, S.J. Discovering urban block typologies in Seoul: Combining planning knowledge and unsupervised machine learning. Cities 2024, 150, 104988. [Google Scholar] [CrossRef]
- Inácio, M.; Das, M.; Burkhard, B.; Barceló, D.; Pereira, P. Mapping and assessment of lake ecosystem services in Lithuania. Ecosyst. Serv. 2024, 65, 101589. [Google Scholar] [CrossRef]
- Scowen, M.; Athanasiadis, I.N.; Bullock, J.M.; Eigenbrod, F.; Willcock, S. The current and future uses of machine learning in ecosystem service research. Sci. Total Environ. 2021, 799, 149263. [Google Scholar] [CrossRef]
- Yutian, L.; Sun, X.; Songxue, L.; Jiayu, W. An approach to urban landscape character assessment: Linking urban big data and machine learning. Sustain. Cities Soc. 2022, 83, 103983. [Google Scholar] [CrossRef]


Disclaimer/Publisher’s Note: The statements, opinions and data contained in all publications are solely those of the individual author(s) and contributor(s) and not of MDPI and/or the editor(s). MDPI and/or the editor(s) disclaim responsibility for any injury to people or property resulting from any ideas, methods, instructions or products referred to in the content. |
© 2026 by the authors. Licensee MDPI, Basel, Switzerland. This article is an open access article distributed under the terms and conditions of the Creative Commons Attribution (CC BY) license.