Abstract
Green space equity is increasingly recognized as a critical environmental condition for healthy aging, yet existing research often overlooks how different green space attributes—accessibility and diversity—are associated with distinct dimensions of older adults’ health. Limited attention has been paid to their nonlinear threshold effects or to the social pathways through which green spaces influence health outcomes. Using the United States county-level panel data from 2020 to 2023, this study integrates fixed-effects models, Extreme Gradient Boosting (XGBoost), and mediation analysis to examine the associations between green accessibility measured by the Two-Step Floating Catchment Area (2SFCA) method, and green diversity measured by the Shannon Index, on the general, physical, and mental health of older adults. Findings indicate that (1) higher green accessibility is associated with better general health, whereas green diversity shows a stronger association with physical health, reflecting its link to more heterogeneous ecosystem service environments. (2) Green accessibility demonstrates the threshold effect, in which the strength of association with health becomes steeper once accessibility approaches higher levels. (3) Green space equity is linked to health partly through social structures. Education clustering and marital stability mediate the associations with general health, while mental health appears to depend more on the social interaction opportunities embedded within green environments than on their physical attributes alone. The study proposes an integrated “physical environment–social structure–health outcome” framework and a threshold-oriented spatial intervention strategy, highlighting the need to prioritize improvements in green accessibility in underserved areas and prioritizing green diversity and age-friendly social functions where accessibility is already high. These findings offer evidence for designing inclusive, health-oriented urban environments for aging populations.
1. Introduction
The rapid acceleration of global population aging has intensified structural risks to the physical and mental health of older adults, making aging-related health decline one of the most pressing challenges for public health systems worldwide [1,2]. The World Health Organization (WHO) warns that psychological disorders and chronic diseases are rising most rapidly among older populations across regions [3,4]. By 2050, the number of people aged 60 and above will exceed 2.1 billion, with more than one quarter projected to experience significant deterioration in mental or physical functioning [5,6]. These trends stem not only from biological aging, multimorbidity, and weakening social support, but also from external pressures embedded in the urban environment, including unequal access to green spaces, spatial concentration of environmental burdens, and cumulative exposure to stressful settings [7,8]. In dense and fast-urbanizing regions, disparities in green accessibility further amplify health inequalities by heightening psychological stress, limiting mobility, and accelerating chronic disease progression among older adults [9].
Although extensive evidence shows that urban green spaces reduce psychological distress, support physical activity, strengthen social ties, and mitigate chronic disease risks, key gaps remain. Existing research has paid limited attention to how green space equity—rather than mere quantity—influences mental and physical health in older adulthood, how these effects vary spatially, and whether they are governed by threshold dynamics or socio-structural pathways [8,10]. Without this knowledge, supply-driven greening strategies fall short of addressing the complexity of aging-related health risks and offer limited guidance for age-friendly urban planning [11].
The determinants of older adults’ health extend far beyond individual physiology. Environmental quality, spatial accessibility, and urban design exert a profound influence on physical and mental well-being [4,12]. As a core component of urban health infrastructure, green spaces are widely recognized as vital for promoting healthy aging [13,14]. International policy frameworks—including the UN Sustainable Development Goals (SDG 3: Good Health and Well-being; SDG 11: Sustainable Cities) and the WHO Decade of Healthy Ageing—identify equitable access to green environments as a critical strategy for maintaining physical function and psychological resilience among older adults [15,16]. Accordingly, the use of green spaces to support healthy aging has become a central concern in urban planning, landscape design, and public health research [17,18]. While numerous studies show that high-quality green spaces can delay mental and physical health decline through stress reduction, social interaction, and physical activity [19,20], a comprehensive understanding of the spatial heterogeneity of green space health effects, the structural differences in their mechanisms, and the distinct pathways influencing mental versus physical health remains limited [21,22]. This gap constrains the development of evidence-based strategies for age-friendly green space planning.
Urban health geography and environmental behavior research has increasingly shifted away from a narrow focus on green space quantity toward a more comprehensive framework that prioritizes equity, quality, and practical utility [23,24]. Within this transition, green space equity has emerged as a critical concept for assessing how different population groups access the health benefits of natural environments. Rather than referring solely to the amount or intrinsic quality of green space, equity emphasizes the fairness of effective access to green space benefits, particularly for older adults with declining mobility [25,26]. Disparities in effective green space exposure are shaped by spatial distribution, infrastructure provision, and population characteristics, reinforcing the need to distinguish equity from aggregate quantity or general quality [27,28]. Within this equity framework, green diversity captures the compositional richness and balance of different types of urban green spaces, reflecting whether older adults can practically and continuously access green environments with varied functions rather than whether green space simply exists within administrative boundaries. Despite growing interest in equity-oriented approaches, existing research continues to prioritize overall well-being, with limited systematic differentiation between mental and physical health outcomes [29].
Methodologically, although green space assessment has evolved from simplistic distance-based measures towards multi-source data-driven accessibility assessments, its integration with high-resolution urban health data remains limited [30]. Moreover, the multiple mediation pathways between green space equity, mental and physical health have yet to be systematically tested. Emerging evidence further suggests that the effects of built and green environments on older adults are highly heterogeneous and nonlinear across spatial contexts and population segments, rather than following uniform average patterns.
Accordingly, this study explores how green space equity impacts the mental and physical health of elderly populations in the United States cities through two complementary dimensions: green space accessibility and green space diversity. Accessibility reflects the ease with which older adults can reach nearby green spaces under spatial and mobility constraints, while diversity captures the compositional richness and balance of different urban green space types, indicating the distribution of green space functions. Together, these dimensions move beyond conventional supply-based measures and align with broader discussions on spatial justice and environmental equity [31], which emphasize differentiated access to environmental benefits rather than uniform provision.
Using county-level panel data from the United States, this study integrates fixed-effects models, Extreme Gradient Boosting (XGBoost) machine learning, and mediation analysis to examine the spatial heterogeneity, nonlinear relationships, and underlying pathways linking green space equity to elderly mental and physical health. Specifically, the study addresses three research questions:
(1) How does green space equity affect the spatial distribution, threshold effects, and prediction of elderly mental and physical health?
(2) What mediation effects exist between green space equity and health outcomes?
(3) How can cities implement age-health-friendly green space strategies at the urban scale?
By jointly examining the nonlinear, threshold, and mediated effects of green space equity on multiple dimensions of older adults’ health, this study advances existing research beyond linear, supply-oriented perspectives. Differentiating accessibility and diversity as two equity-related attributes and combining econometric and machine-learning approaches, the study provides new insights into how green space benefits are unevenly realized across space and health dimensions. More broadly, it offers policymakers a more precise evidence base for designing inclusive, healthy, and resilient cities in aging societies.
2. Literature Review
2.1. Mechanisms and Existing Evidence on the Impact of Green Space Equity on Elderly Mental and Physical Health
Currently, a growing number of studies confirm that equitable access to green spaces plays a critical role in promoting physical health, psychological well-being, and social connectivity among older adults [32]. Green spaces function as an important environmental intervention for healthy aging by mitigating age-related declines in both mental and physical health. From a physiological perspective, high-quality green spaces, through exposure to sunlight, fresh air, diverse vegetation, and soundscapes, can regulate circadian rhythms, strengthen immune stability, and reduce cortisol levels, thereby alleviating stress, anxiety, and depressive symptoms [33,34]. These effects contribute to improving sleep quality, metabolic regulation, and cardiovascular health, reducing the risk of chronic diseases like cognitive decline, diabetes, obesity, and heart disease [35].
In addition, green spaces promote moderate physical activity among older adults, including walking, stretching, and low-intensity exercise, which helps slow physical decline and maintain mobility and cardiovascular function [36]. Beyond individual health behaviors, green spaces also serve as vital social infrastructures within communities. As accessible and inclusive public settings, they facilitate social interaction, strengthen neighborhood ties, expand social support networks, and reduce loneliness and emotional isolation among older adults [27,37]. These social benefits are consistently associated with higher levels of subjective life satisfaction and psychological well-being [38,39]. The coupling of physical activity, psychological recovery, and social engagement makes green space a key resource for promoting healthy aging, with these mechanisms widely documented in the literature [40].
Theoretical frameworks, such as Attention Restoration Theory (ART) and Stress Reduction Theory (SRT), provide a conceptual basis for understanding the health-promoting effects [41,42]. ART posits that natural environments foster cognitive and mental recovery by offering experiences of fascination, escape, and compatibility, while SRT suggests that exposure to nature reduces sympathetic nervous activation, regulates emotions, and restores physiological balance [43]. At the sensory and functional level, green spaces—through variations in lighting, color, vegetation structure, and pathway design—can alleviate visual fatigue, improve spatial awareness, and slow vision deterioration [44]. Natural soundscapes further buffer traffic noise and improve auditory comfort, reinforcing environmental immersion and confidence in outdoor activity participation [45,46].
Importantly, research also indicates that the health benefits of green spaces exhibit cumulative and time-dependent effects [47]. Ecological maturation processes, including vegetation growth and the stabilization of soundscapes, often require 5–10 years to generate sustained health benefits [48,49]. While short-term park exposure can improve mood within 20 min, longer-term, frequent contact is necessary to reduce chronic disease risk and enhance immune and metabolic functions [50]. Similarly, improvements in mental health, such as reduced depression symptoms, tend to emerge after 12–18 months of exposure [26,51]. These findings indicate that green space equity shapes not only immediate health outcomes but also long-term psychological resilience, physical recovery capacity, and social connectivity among older adults.
2.2. Nonlinear Characteristics and Threshold Effects of Green Accessibility and Diversity on Health
Recent research increasingly demonstrates that the relationship between green space characteristics departs from traditional linear assumptions, instead exhibiting nonlinear, threshold, and interactive patterns. Empirical studies show that environmental factors like accessibility, density, and connectivity often exhibit a “sweet spot” or diminishing marginal effects, whereby health benefits increase only up to a certain point and may plateau or decline beyond specific thresholds [52,53]. Among older adults, the threshold effects are particularly pronounced, where moderate access to parks stimulates walking and sensory engagement, but excessive distance, high density, or excessive traffic exposure may reverse these benefits by increasing physical and psychological burdens [54].
Within this nonlinear framework, green space accessibility and green space diversity operate through distinct health mechanisms. Accessibility primarily captures whether green spaces can be reached under spatial and mobility constraints, thereby shaping opportunities for physical activity, routine exposure, and social interaction. In contrast, green space diversity emphasizes the heterogeneity of functions and landscape experiences provided by different types of green spaces, reflecting the structural richness and balance of urban green space composition within a given area. Higher levels of green diversity indicate a more varied ecological composition, which is associated with enhanced ecosystem services and culturally embedded landscape experiences [55]. Empirical evidence further suggests that greater vegetation and species diversity can enrich sensory stimulation and emotional responses, thereby supporting mental restoration processes [56]. Although empirical evidence on diversity-related mechanisms remains less extensive than that on accessibility, recent reviews point to a growing recognition of diversity- and design-related attributes as important pathways linking green environments to health outcomes [57].
Methodologically, mediation models, panel models, and machine learning (ML) have become essential for identifying the complex relationships between the built environment and health outcomes [58,59]. Threshold-oriented methods, such as Hansen’s threshold regression, quantile threshold models and Piecewise-GAM, are widely used to identify the critical points at which environmental factors, such as walkability or green space exposure, produce disproportionate changes in health outcomes, including physical activity levels and depressive symptoms [26,60]. These studies consistently demonstrate that environmental effects often intensify or diminish once specific thresholds are crossed.
Machine learning methods, such as XGBoost, Random Forest, and CatBoost, further advance the analysis of these nonlinear relationships by capturing high-order interactions without imposing predefined functional forms [58].
Explainability tools like SHAP and ALE enhance the interpretability of machine-learning models by revealing marginal effect curves, interaction pathways, and key inflection points, transforming them from “black boxes” into analytical tools [58,61]. Due to their ability to handle multidimensional environmental indicators, long time-series health data, and heterogeneous individual characteristics, machine learning is increasingly applied in urban health research [62].
Existing studies have gradually converged on several core metrics for assessing green space–health relationships. Accessibility indicators, often operationalized through walkability or proximity measures, are widely recognized as critical determinants of physical activity, social engagement, and routine exposure among older adults [52,63]. Other studies focus on the park’s natural characteristics, using indicators like size, shape and environmental comfort [64]. While these measures provide a foundation for understanding how green spaces support elderly well-being, research remains limited in systematically addressing spatial heterogeneity and mediation mechanisms that differentiate the health effects of accessibility versus diversity.
2.3. Research Framework
Despite growing evidence that green space benefits older adults’ health, existing studies still overlook two essentials: the distinct pathways linking green space equity to mental and physical health, and the nonlinear, cumulative nature of these effects over time. Most analyses rely on cross-sectional data or single-dimension indicators, offering only a partial view of how fairness in green space access shapes long-term aging outcomes. Policy practice reflects similar limitations. Urban greening initiatives often prioritize expanding green supply or improving design quality, while paying insufficient attention to spatial inequities or to identifying where interventions yield the greatest health gains. As a result, an integrated framework linking equity, mechanisms, and prediction remains lacking.
To fill these gaps, this study builds an integrated analytical framework (Figure 1) that combines spatial heterogeneity analysis, mechanism testing, and machine-learning-based prediction. The framework operationalizes green space equity through accessibility and diversity as relational attributes rather than purely physical measures, thereby extending existing discussions on spatial justice. This research integrates multi-year health data from the Behavioral Risk Factor Surveillance System (BRFSS, 2020–2023) with multi-source environmental indicators, including POI-based green space and community facility datasets. At the county level, the framework incorporates socio-demographic variables (e.g., education, marital status, doctor access), green space indicators (accessibility, diversity), and health outcomes (general, mental, physical health).
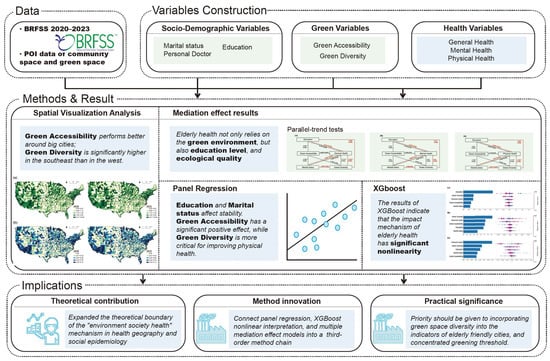
Figure 1.
Research framework.
Four complementary analytical methods are employed. Spatial visualization is used to examine evolving patterns of green accessibility and diversity in relation to regional health disparities. Mediation models are employed to identify how psychological and social pathways link green space equity to health outcomes. Panel regression tests the temporal stability of green space effects and differentiates the contributions of accessibility versus diversity over time. Finally, XGBoost models capture nonlinear relationships and identify threshold points at which green space equity produces significantly stronger health benefits. These methods provide a holistic understanding of how green space equity affects older adults’ health across spatial, temporal, and health dimensions.
3. Data and Methods
3.1. Study Area
This study selects the Southern United States as the research area, encompassing all county-level units within the region (Figure 2). The South provides an appropriate setting for examining the association between green space equity and older adults’ health due to its pronounced health burden, substantial socio-spatial heterogeneity, and robust data availability. The rationale for selecting this region is primarily based on the following considerations. First, the Southern United States has a rapidly aging population and a pronounced public health burden. According to data from the Behavioral Risk Factor Surveillance System (BRFSS) (2020–2023), older adults (≥65 years) in this region exhibit elevated health risks across general health, mental health, and physical health indicators. These risks are compounded by a high prevalence of chronic diseases and unequal access to healthcare resources, making the region a critical observational window for examining the health implications of green environments.
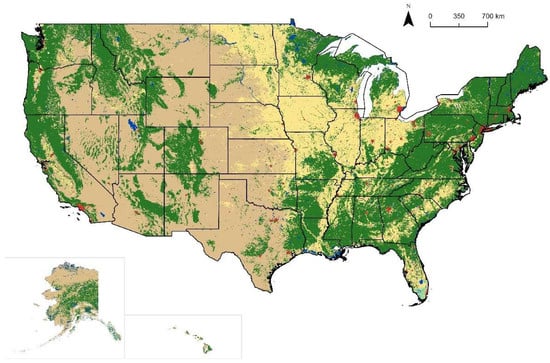
Figure 2.
Research area. Notes: Green areas represent vegetated land cover, while light yellow and brown areas indicate sparsely vegetated or non-vegetated land. Red areas denote built-up regions, and blue areas represent water bodies such as lakes and rivers.
Second, the region displays high heterogeneity in urban structure, socioeconomic status, and green space resource distribution. It encompasses major metropolitan areas such as Atlanta, Houston, and Dallas, small- and medium-sized cities and suburban belts, as well as rural counties that often feature high green coverage but limited healthcare resources. This spatial diversity generates marked variations in green accessibility and green diversity, enabling an assessment of green space equity across different settlement contexts.
Third, the region provides high-quality data with strong availability and continuity. The BRFSS data released by the CDC offers dense sampling and consistent measurement across years, providing complete and reliable information on marital status, education, personal doctor, and multiple health outcomes.
3.2. Research Methods
3.2.1. Panel Regression
To systematically evaluate the impact of green space equity on older adults’ health, this study employs a panel regression framework using county-year observations for the Southern United States from 2020 to 2023. Panel data allows for the simultaneous capture of between-region variation and within-region temporal trends, while controlling for unobserved time-invariant regional effects through fixed effects. This design enhances the robustness of parameter estimates compared with purely cross-sectional or time-series approaches. The basic panel regression model formulated in this study is specified as follows:
where represents the health outcome indicators for region in year , comprising three dependent variables: general health, mental health, and physical health; denotes the green accessibility index; refers to the green diversity index; , , represent the control variables for the elderly population regarding marital status, educational attainment, and access to medical services, respectively; denotes the region-specific fixed effects; represents the year-specific fixed effects; and is the random error term.
3.2.2. XGboost
Recent spatial-environmental studies have increasingly adopted machine-learning approaches such as XGBoost to capture complex nonlinear relationships between environmental attributes and human responses, demonstrating their suitability for exploratory and explanatory analysis in spatial health research [65]. To further elucidate nonlinear relationships and potential threshold effects between green space equity and older adults’ health, this study introduces the XGBoost machine learning model. Compared with linear regression, XGBoost is capable of capturing complex interactions between variables, nonlinear trends, and highly heterogeneous impact pathways. It is particularly suitable for multi-source data characterized by spatial variations and socioeconomic factors.
XGBoost constructs multiple decision trees based on the Gradient Boosting framework and continuously optimizes model performance through the minimization of an objective function. Its core advantages include the capacity to handle high-dimensional predictors, built-in regularization to reduce overfitting, and robustness to missing values and outliers. Consequently, it is highly suitable for analyzing the complex mechanisms linking older adults’ health, green environments, and sociodemographic variables. Its general formulation is given by:
Specifically: is the predicted value for the sample; is the prediction of the -th regression tree for sample is the function space containing all tree structures and their leaf node weights; is the number of trees (the number of weak learners). The optimization objective of XGBoost comprises two components: the Loss Function and the Regularization Term. The overall objective function is as follows:
Specifically; is the loss function used to measure the prediction error (Mean Squared Error, MSE, is commonly employed for regression problems); is the Regularization Term, which controls model complexity and prevents overfitting. The Regularization Term is defined as follows:
Specifically: is the number of leaf nodes in the tree; is the weight of the leaf node in the tree; is the regularization parameter that adjusts complexity. XGBoost employs the first-order gradient and the second-order gradient (Hessian) of the loss function for optimization. The objective function at the t-th iteration can be formulated as follows:
where is the first-order gradient, and is the second-order gradient. By minimizing this approximation, the optimal splitting method and leaf node weights of the new tree can be obtained, thereby improving the model performance.
3.2.3. Mediation Effect Model
To identify the intrinsic mechanisms through which green space equity affects the health of older adults, this study introduces a mediation model to test whether green accessibility and green diversity indirectly influence the health outcomes (general health, mental health, and physical health) through socio-demographic variables (such as Marital status and Education). Unlike traditional panel regression, mediation analysis distinguishes direct from indirect effects, providing a clearer account of potential pathways linking the green environment to health. The mediation model comprises three basic regression equations:
This indicates whether green space equity has a significant impact on mediating variables (such as Education). Path b, +c′ represents the combined effect of the independent and mediating variables on the dependent variable. Here, b is the effect of the mediating variable on health, and c′ is the direct effect of the independent variable on health (after controlling for mediation). The total effect path c requires estimating the model of the independent variable X acting alone on Y to compare the overall impact.
3.2.4. Urban Green Space Analysis
(1) Green Accessibility (2SFCA)
Green accessibility is measured using the Two-Step Floating Catchment Area (2SFCA) method, which accounts for green space supply, population demand, and spatial distance constraints. The index is defined as:
where denotes the green accessibility of county I; represents the service capacity of green space j (e.g., area or weighted POI size); is the elderly population within the service catchment of green space ; is the distance between county and green space ; and is the threshold service distance. By incorporating both supply–demand competition and distance decay, this measure captures the effective accessibility of green spaces under mobility constraints faced by older adults.
(2) Green Diversity
Green diversity is quantified using the Shannon Diversity, which reflects the compositional richness and balance of different types of green spaces within a county. The index is calculated as:
where denotes the green diversity of the county ; is the proportion of green space type within county ; and represents the total number of green space categories. Higher values of indicate a more diverse and evenly distributed green space structure, reflecting greater heterogeneity in functions and recreational opportunities.
3.3. Variable Construction
This study constructed independent, dependent, and control variables using BRFSS 2020–2023 data and green space data to characterize the relationship between green space equity, socio-demographic characteristics, and older adults’ health (Table 1). All health-related indicators were screened based on respondents aged ≥65 years to ensure the relevance and comparability across outcomes. Three health measures from BRFSS are used to capture multidimensional health status. General health: Self-reported general health status (1–5 points). Higher scores indicate poorer health. Mental health: Number of days with poor mental health in the past 30 days, graded from 1 to 5 (0 days, 1–5 days, 6–13 days, 14–20 days, 21–30 days). Physical health: Number of days with poor physical health in the past 30 days, also graded from 1 to 5. These indicators enable a consistent comparison of how green space equity relates to different health dimensions.

Table 1.
Indicators of green space and the older adults’ health evaluation.
This study uses two core independent variables: green accessibility and green diversity. Green accessibility uses the 2FSCA (Two-step Floating Catchment Area) method, which accounts for green space size, service distance, and spatial resistance. Higher values indicate better accessibility for the elderly. Green diversity uses the Shannon Index to assess the structural richness and balance of different green spaces within the region. Higher indices represent a greater variety of green space types and a more even distribution. Accessibility and diversity capture complementary aspects of green space equity—reachability under mobility constraints and compositional heterogeneity of green environments.
To reveal potential mechanisms by which green space equity affects health, this study introduces socio-demographic variables as mediators or controls: Marital status (1, Married; 2, Unmarried couple; 3, Divorced; 4, Widowed; 5, Never married/Separated). Marital stability is an important source of social support affecting mental and physical health. Education (1–5, from low to high). Education reflects an individual’s access to resources, health literacy, and socioeconomic status. Whether a person has a fixed personal doctor (1. No; 2. One; 3. Multiple) represents the accessibility of healthcare services and the level of health management for older adults.
According to Table 2, the health and sociodemographic variables used in this study have sufficient sample sizes, with low missing rates (0.34–3.21%), indicating good data quality suitable for subsequent regression analysis, machine learning models, and mediation effect testing. The mean value of Marital status is 1.992, with quartiles concentrated between 1 and 3, indicating that the elderly population is predominantly married or widowed. The mean value of Education is 4.094, indicating relatively high educational attainment in the sample. Regarding health-related indicators, all three health variables exhibited a degree of dispersion. General health has a mean of 2.662, indicating the general health level was above average. Physical health had a mean of 1.794, with the 25th and 50th percentiles at 1, suggesting that most respondents experienced fewer days of poor physical health, though a higher tail remains. Mental health has a mean of 1.495, similarly suggesting few days of poor mental health for most respondents. Personal Doctor had a mean of 1.850, with an interquartile range (1–2), indicating that most respondents report at least one regular doctor and that healthcare access is relatively adequate across the region.
Table 2.
Descriptive statistics of health data.
3.4. Data Acquisition
Data for this study come from two main sources: public health survey data and spatial environment data (see Table 3), covering the period from 2020 to 2023, reflecting the health status and green space characteristics of the elderly population in the southern United States. The health survey data came from the CDC’s Behavioral Risk Factor Surveillance System (BRFSS), the largest continuous surveillance system for chronic disease and health behavior in the United States. This study restricted the sample to respondents aged ≥65 years and integrated data from multiple years to improve statistical stability and the reliability of the results.
Table 3.
Data acquisition types and sources.
Spatial environment data include POI data for community spaces and green spaces, used to calculate key green space variables such as green accessibility and green diversity. These POI data came from the Foursquare platform and provide information on the spatial distribution, type, and accessibility characteristics of green spaces, providing a foundation for subsequent spatial analysis and green space equity measurement.
4. Results
4.1. Spatial Analysis
As shown in Figure 3, green accessibility and green diversity across the United States from 2020 to 2023 exhibit significant regional disparities and temporal dynamics. Both indicators demonstrate clear spatial clustering and east–west differences, with gradually higher levels observed in the southern regions. These spatial patterns provide an essential contextual basis for the subsequent health analyses, as they indicate substantial inter-county variation in potential green space exposure among older adults, and suggest the possibility of heterogeneous and nonlinear health responses.
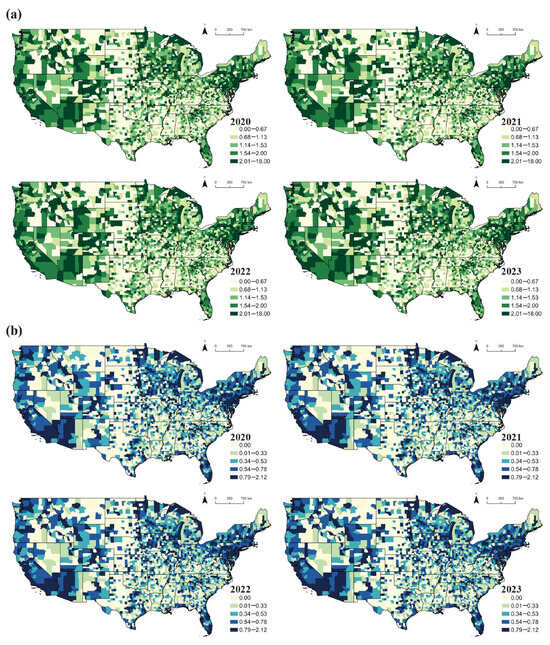
Figure 3.
Green space spatial analysis. (a) green accessibility, (b) green diversity.
Green Accessibility shows a relatively stable but modest upward trend from 2020 to 2023. Spatially, it follows a clear east–west pattern, with the southeastern and eastern urban clusters, particularly in states like Georgia, Alabama, and North Carolina. These areas, characterized by denser urban green systems, exhibit shorter travel distances and greater proximity to green spaces. In contrast, vast areas in the western United States (notably Nevada, Wyoming, and parts of Utah) exhibit consistently low accessibility, reflecting sparse settlement patterns and limited green space provision. Major cities and their surrounding areas, such as California’s coastal cities, Texas urban centers, and central Florida, form localized clusters of high accessibility, signifying mature urban green systems. Over the period, incremental improvements are observed in several southern states, notably Texas, Georgia, and South Carolina, where areas of high accessibility gradually expand.
Green diversity shows stronger spatial differentiation than accessibility, capturing regional variation in green space structure and quality in terms of the compositional richness and balance of urban green space types. High diversity is concentrated in the southeastern and northeastern United States, with deep blue shades across much of the eastern and southeastern counties, especially from Georgia to North Carolina. These regions typically contain a mix of parks, woodlands, wetlands, and open spaces, indicating a more balanced and heterogeneous green space structure. In contrast, the Midwestern and much of the western regions exhibit widespread low diversity, particularly in the Great Plains and western rural areas, where green spaces are often dominated by single-purpose land uses such as farmland or grassland. From 2020 to 2023, green diversity demonstrates a slow but steady increase. Expansion of high-diversity areas is most evident in the southern states, including Alabama, Mississippi, Georgia, and Louisiana, suggesting gradual improvements in green space composition and quality over time.
4.2. Impact Factors Analysis
Table 4 presents the results of the panel regression models for general health, mental health, and physical health conditions. According to the health condition explanation in Table 1, the higher the value, the worse the health condition. Therefore, in this model, a negative coefficient indicates a positive effect on health condition. Specifically, the model for general health shows strong explanatory power (R2 = 0.464), suggesting that the selected variables capture substantial variation in general health status in older adults. Marital status has a significant positive coefficient (0.185), indicating that older adults who are not married (divorced, widowed, or single) tend to report poorer general health. Education exhibits a significant negative coefficient (−0.545), showing that higher education correlates with better general health. Having a personal doctor is also associated with a small but significant improvement in health (−0.063), though the magnitude of this effect is comparatively modest. Green accessibility shows a significantly negative coefficient (−0.275), suggesting that better accessibility to green spaces is associated with improved general health.
Table 4.
Panel regression result.
For the mental health condition, the model’s explanatory power is relatively low (R2 = 0.054), consistent with the influence of unobserved individual and psychological factors. Marital status remains a significant predictor (0.157), indicating more days of poor mental health among non-married older adults. In contrast, Green accessibility and green diversity do not exhibit statistically significant direct effects on mental health in the panel regression framework.
The physical health condition shows moderate explanatory power (R2 = 0.131). Marital status displays a significant positive effect (0.205), while education has a significant negative association (−0.141), indicating better physical health among more educated older adults. Green diversity significantly improves physical health (−0.103), suggesting that more diverse green spaces contribute to better physical well-being.
Socio-demographic factors, particularly marital status and education, exert consistent influences across health dimensions. Green space equity indicators, however, impact health in a dimension-specific manner. Green accessibility is most strongly associated with general health, whereas green diversity plays a more prominent role in physical health. Direct effects on mental health are limited, indicating that indirect pathways may be more relevant, a hypothesis explored in the mediation analysis.
4.3. XGBoost Analysis
The XGBoost analysis provides additional insight into the nonlinear effects of green space equity and socio-demographic factors on older adults’ health (see Table 5 and Figure 4 and Figure 5). In the SHAP dependence plots, each point represents an observation, with the horizontal axis indicating the value of a given explanatory variable and the vertical axis representing its marginal contribution to the predicted health outcome (SHAP value). The color scale reflects potential interaction effects with other features in the model. Variations in slope, dispersion, and inflection points in these plots reveal nonlinear relationships and threshold-like patterns in the effects of green space equity on health outcomes.
Table 5.
XGBoost model fit.
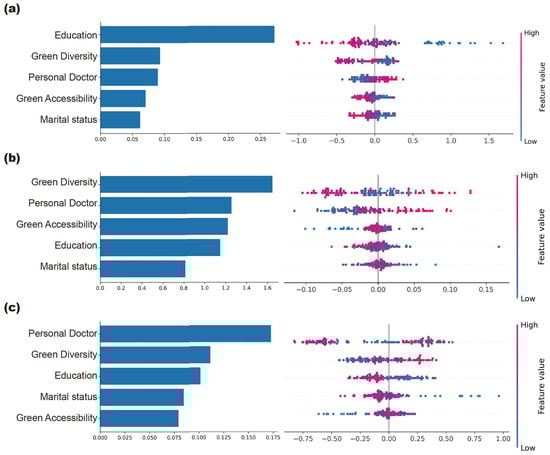
Figure 4.
Importance and SHAP value. (a) General health, (b) mental health, (c) physical health.
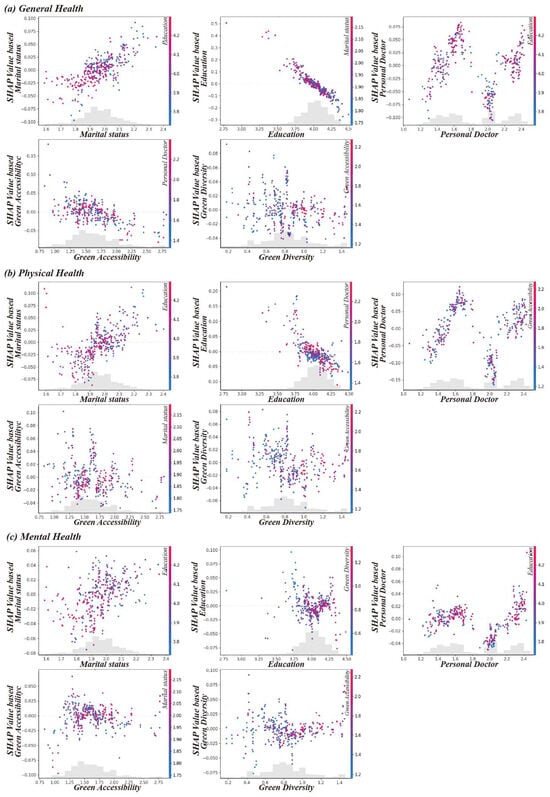
Figure 5.
XGBoost analysis dependence plots. (a) General health, (b) mental health, (c) physical health.
Model performance varies across health dimensions. The explanatory power is highest for general health (R2 = 0.421), followed by physical health (R2 = 0.293), with mental health exhibiting the lowest explanatory power (R2 = 0.042). This finding suggests that general and physical health are more strongly influenced by observable environmental and socio-demographic factors, while mental health is more affected by individual-level heterogeneity and unobserved factors.
Feature importance analysis (Figure 4) highlights significant differences in the factors affecting each health dimension. For general health, education is the most influential predictor, followed by green diversity, personal doctor, and green accessibility. This indicates that both social resources and green space characteristics contribute to general health. For mental health, green diversity emerges as the most important factor, followed by personal doctor and green accessibility, while marital status and education show relatively limited importance. For physical health, the personal doctor variable has the strongest influence, followed by green diversity and education. This underscores the central role of healthcare access and the supply of long-term health benefits.
SHAP value distributions further clarify the direction of effects. In the general health model (a), higher green accessibility shows a negative contribution, suggesting that, at the general level, increased accessibility does not linearly translate to better health outcomes in this specific model context. In the physical health model (b), green diversity shows a more positive contribution, where higher green space quality (red dots) is situated on the right side of the axis, indicating it is associated with enhanced physical well-being. Personal Doctor also demonstrates a strong positive association across models, particularly for physical health, confirming that regular medical care significantly supports older adults’ health status.
The dependency plots reveal the nonlinear relationships and threshold effects (Figure 5). For green accessibility, all three health dimensions exhibit a significant threshold between 0.9 and 1.0, beyond which the marginal association with health becomes stronger. Education shows diminishing marginal returns, with health benefits increasing at lower levels and tapering off at higher levels. Marital status displays a steadily increasing negative effect, with higher values (divorced, widowed, or unmarried) significantly worsening health outcomes. For physical health, the personal doctor variable follows a U-shaped curve, indicating that moderate levels of medical engagement are most beneficial. Green diversity shows a declining effect on general health and physical health; association with mental health remains comparatively stable.
4.4. Mediation Analysis Results
Mediation analysis further reveals the pathways through which green space equity influences older adults’ health via socio-demographic factors (see Table A1, Table A2 and Table A3/Figure 6). Both green accessibility and green diversity exert indirect effects on health through variables such as marital status and education, though the effects differ across health dimensions.
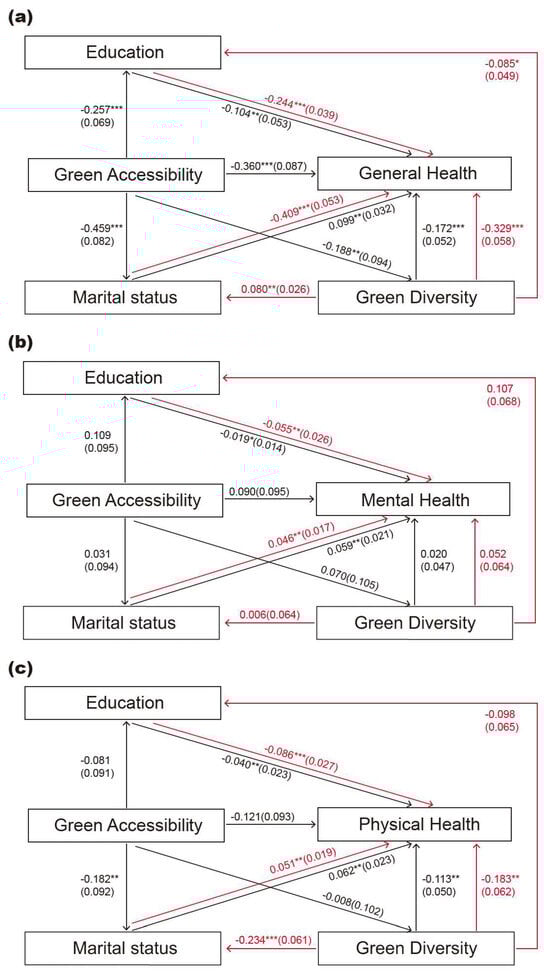
Figure 6.
Mediation relationship plots. (a) General health, (b) mental health, (c) physical health. Notes: Standard errors are reported in parentheses. *** p < 0.001, ** p < 0.05, * p < 0.1.
For general health, all five tested mediation pathways are significant, with four showing partial mediation. Notably, the path green diversity → education → general health demonstrates full mediation, indicating that the association between green diversity and general health operates largely through educational resources and health-related capacities. Additionally, the indirect effect of green accessibility through green diversity is also substantial, suggesting that accessibility enhances general health partly by improving green space quality.
For mental health, mediation effects are less stable. Only three pathways are significant, and all exhibit full mediation: green accessibility → marital status, green diversity → marital status, and green diversity → education. This finding indicates that mental health benefits are primarily realized through indirect social and socio-economic mechanisms.
For physical health, the mediation mechanisms are more stable, with four out of five paths showing significance. Two paths exhibit full mediation: green accessibility → education and green accessibility → green diversity. The latter shows the highest mediation contribution, indicating that improved accessibility further enhances physical health by improving green space quality. Green diversity also demonstrates a significant full mediation effect through education, underscoring the interconnection between green space quality, social resources, and long-term physical health.
5. Discussion
5.1. Multidimensional Impact Mechanisms of Green Space Equity on Older Adults’ Health: Integrating Linear and Nonlinear Evidence
This study advances existing research by exploring how green accessibility and green diversity are associated with older adults’ health, integrating evidence from both linear and nonlinear machine-learning analyses. While existing research widely acknowledges the health benefits of green space exposure, this study demonstrates that these benefits are dimension-specific and mechanism-dependent. The panel regression results show that green accessibility is strongly associated with improvements in general health, while green diversity shows a stronger association with physical health. This differentiation supports multi-pathway theories of green space–health relationships, which emphasize that distinct environmental attributes are understood to be linked to different behavioral and physiological mechanisms [23,24].
From a functional perspective, high accessibility can reduce travel costs and can facilitate frequent and routine exposure to green spaces, reinforcing their role as everyday activity and social spaces for older adults [32]. Meanwhile, green diversity serves as a proxy for green space richness and functional heterogeneity. Its significant association with physical health is consistent with SRT research, which posits that diverse functions are associated with better quality services, potentially reducing physiological stress and promoting recovery [27,37]. These findings underscore that green space equity provision cannot be reduced to spatial proximity alone, but must also account for the quality and functional composition.
Beyond linear associations, the nonlinear analysis reveals that green space accessibility exhibits a clear threshold effect, with the association with health becoming steeper once accessibility values approach approximately 0.9–1.0. This finding supports previous empirical conclusions that incremental improvements in accessibility below a critical level may generate limited health returns for older adults [48,49]. From a planning perspective, this challenges incremental, evenly distributed greening strategies and instead highlights the importance of prioritizing interventions that enable communities to cross key accessibility thresholds. Such nonlinear responses are consistent with broader evidence indicating that the social and health effects of spatial amenities often follow diminishing or threshold-type patterns rather than proportional gains [66].
Importantly, the identified threshold should be interpreted as context-dependent, shaped by urban form, mobility conditions, and institutional settings. The empirical value observed here reflects the spatial and governance context of United States counties and should therefore be understood as indicative rather than universally transferable.
5.2. Indirect Pathways of Green Space Health Effects: Mediating Role of Socioeconomic Factors
Building on the identification of direct and nonlinear associations, this research further shows that the relationships between green space equity and health condition are largely mediated by socioeconomic pathways. The pathway green diversity → education → general health shows full mediation, indicating that the positive association between green diversity and general health is largely driven by the social resources and health literacy provided by higher educational attainment [67,68]. This challenges the simplified view of green space as an independent “therapeutic tool” and instead supports a more integrated social perspective, in which high-quality and diverse green spaces tend to be embedded within wealthier and better educated communities that are more capable of transforming environmental benefits into tangible health outcomes [27,37].
In terms of mental health, the direct associations with green accessibility and green diversity are weak, consistent with the relatively low explanatory power of both the panel model (R2 = 0.054) and the XGBoost model (R2 = 0.042). Three pathways—green accessibility → marital status, green diversity → marital status, and green diversity → Education—show full mediation, suggesting that green space equity relates to mental health primarily through social rather than environmental pathways. This weaker direct association can be explained by several interrelated considerations. First, mental health in later life is strongly shaped by individual psychological conditions, life-course experiences, and subjective perceptions, which vary substantially within counties and are not captured by area-level indicators. As a result, green accessibility and diversity can account for only a limited share of the psychological processes underlying mental well-being. Second, mental health benefits depend more on how green spaces are experienced and socially used than on their spatial presence alone. While accessibility and diversity describe availability and compositional richness, they do not reflect perceived safety, familiarity, or opportunities for everyday social interaction—factors shown to have a stronger association with mental well-being than the mere quantity or configuration of green space. Third, the dominance of marital status and education as full mediators reinforces this interpretation by demonstrating that the mental health relevance of green space equity is realized largely through social support, relational stability, and socioeconomic resources. In this sense, green spaces function less as passive restorative settings and more as social infrastructures that facilitate interaction, routine engagement, and a sense of belonging. When these enabling social conditions are weak or unevenly distributed, the psychological benefits associated with green environments become diluted. These explain why area-level green space indicators show markedly weaker direct associations with mental health than with general or physical health, and why the mental health pathways identified in this study are predominantly socially mediated. They also respond directly to calls for strengthening the conceptualization of mental health pathways in green space research, highlighting the importance of socially conditioned therapeutic environments for aging populations.
For physical health, mediation mechanisms are more stable. Four of the five tested pathways are significant, with green space accessibility → education and green space accessibility → green space diversity exhibiting full mediation. The latter presents the strongest indirect effect, suggesting that contexts with higher green accessibility and higher green space quality tend to be associated with better physical health outcomes. Green diversity also contributes through the mediation of education, which underscores the interdependence between physical health and long-term social resource accumulation [43].
5.3. Strategy Optimization for Green Space Planning
By identifying nonlinear and mediated effects, this study contributes to a more precise understanding of the dose–response relationship between green space equity and the older adults’ health. While existing literature acknowledges the health benefits of green space, there has been little precision regarding how much green space is needed for effective health outcomes [48,49]. The study suggests that associations between green accessibility and health emerge most strongly within specific accessibility ranges, rather than increasing proportionally with additional green space provision. The XGBoost analysis identifies a clear health benefit threshold for green accessibility between 0.9 and 1.0, beyond which the association with health appears to intensify. This challenges traditional linear models and offers a fresh theoretical perspective to explain inconsistencies in previous findings [26,51].
Based on these results, this research proposes an integrated framework—linking physical environment, social structure, and health outcomes. By confirming that green diversity and accessibility are mediated largely through socioeconomic factors, our study calls for threshold-based green space planning in urban development [8,10]. In areas where green accessibility remains below this identified threshold, planning efforts should prioritize targeted, efficiency-oriented interventions. Measures such as micro-green space insertion, pedestrian network integration, and improved connectivity may help to increase everyday green exposure among older adults, and may be associated with relatively high marginal health returns.
More broadly, recent spatiotemporal studies [69] highlight that environmental effects are often context-dependent and stage-sensitive, cautioning against the uncritical transfer of empirically derived thresholds across settings [70]. For areas that have already surpassed the accessibility threshold, especially in the southeastern United States, planning priorities should shift from increasing quantity to improving quality. This includes enhancing complexity within green spaces (e.g., shifting from monocultural lawns to multi-layered vegetation) to strengthen ecosystem services and their potential relevance for physical health benefits.
On the social dimension, given the critical role of social interaction in mental health, green space design should integrate age-friendly social catalytic spaces (e.g., therapeutic gardens, chess areas, intergenerational zones). By strengthening green spaces as platforms for social capital accumulation, such strategies may help to support mental resilience among older adults through improved social support networks, thereby aligning ecological planning with broader healthy aging objectives.
6. Conclusions
This study examines the associations between green space equity, operationalized through green accessibility and green diversity, and older adults’ general, physical, and mental health using United States county-level panel data from 2020 to 2023. By integrating panel regression, XGBoost machine learning, and mediation analysis, the study provides a comprehensive assessment of both linear and nonlinear relationships and the pathways through which green space equity is related to different dimensions of health.
The findings reveal clear spatial heterogeneity and dimension-specific association patterns. Green accessibility and green diversity exhibit a clear east–west gradient across the United States, with improvements in southern regions. The results also identify nonlinear threshold effects for green accessibility, where the strength of association with health becomes more pronounced once accessibility reaches a relatively high level. This challenges conventional linear assumptions and suggests that incremental green space provision below critical levels may yield limited health returns.
Mediation analysis further indicates that green space equity does not function as an isolated environmental determinant of health; rather, its observed relationships are largely channeled through socioeconomic and social pathways, particularly education and marital status. For mental health, the direct associations with green space indicators are relatively weak, and the observed relationships appear to depend more on social capital and social interaction embedded in green environments than on their physical attributes alone.
These findings support a threshold-oriented and equity-sensitive approach to urban green space planning. In areas where green accessibility remains below the identified threshold, interventions that improve reachability—such as adding micro-green space and enhancing pedestrian connectivity—may contribute to greater marginal improvements in health. For areas that have already surpassed the accessibility threshold, strengthening green diversity and incorporating age-friendly social functions may be more relevant for supporting physical and mental well-being.
Several limitations warrant consideration. First, the county-level scale of analysis may obscure micro-level variations at the neighborhood or community level. Future research could incorporate street view imagery or high-resolution remote sensing data for more granular analysis. Second, reliance on large-scale secondary data constrains the ability to account for older adults’ subjective perceptions and everyday experiences of green spaces, which are particularly relevant for mental health. Integrating survey-based measures, street-level assessments, or longitudinal individual tracking could provide deeper insight into the translation of green space equity into health outcomes. Finally, although panel data and fixed effects models control for some unobserved confounders, issues of residential self-selection (e.g., healthier or wealthier seniors relocating to greener areas) remain unresolved. Future studies using natural experiments or individual-level longitudinal data would help strengthen causal inference.
Author Contributions
Conceptualization, J.Y., P.L., J.L., and J.C.; methodology, P.L.; software, P.L.; validation, J.Y., P.L., J.L., and J.C.; formal analysis, P.L.; investigation, J.Y., P.L., and J.L.; resources, J.Y. and P.L.; data curation, P.L.; writing—original draft preparation, J.Y., P.L., J.L., and J.C.; writing—review and editing, J.Y., P.L., J.L., and J.C.; visualization, P.L.; supervision, J.Y. and J.L.; project administration, J.Y. and J.L.; funding acquisition, J.Y.; All authors have read and agreed to the published version of the manuscript.
Funding
The General Projects of Philosophy and Social Science Research at Colleges and Universities in Jiangsu Province: 2023SJYB1485; Suzhou City University Education Reform Project (General Project): 24JG17.
Data Availability Statement
The datasets analyzed in this study are publicly available, third-party data. Health data were obtained from the Behavioral Risk Factor Surveillance System (BRFSS) (available at the CDC website), and green space environment data were derived from Foursquare Open Source Places (available at the Foursquare website). The specific data extraction and processing code is available from the corresponding author upon reasonable request.
Conflicts of Interest
The authors declare no conflicts of interest.
Appendix A
The mediation analysis further unveils the pathways through which green space equity influences older adults’ health, mediated by sociodemographic characteristics (see Table A1, Table A2 and Table A3/Figure 6). Both green accessibility and green diversity exert indirect effects on health through variables such as marital status and education, with notable differences across health dimensions.
For general health, all five mediating pathways achieve statistical significance, with four showing partial mediation. However, the path green diversity → education → general health demonstrates full mediation, suggesting that the impact of green diversity on general health primarily hinges on the enhancement of social resources and health literacy represented by education.
Additionally, the indirect effect of green accessibility stands out, with its greatest contribution occurring through green diversity. This indicates that the positive influence of accessibility on general health largely depends on the quality of the green space’s ecological structure.
Table A1.
Mediation analysis for general health.
Table A1.
Mediation analysis for general health.
| Green Accessibility => Marital Status => General Health | Green Accessibility => Education => General Health | Green Accessibility => Green Diversity => General Health | Green Diversity => Marital Status => General Health | Green Diversity => Education => General Health | |
|---|---|---|---|---|---|
| All effect(c) | −0.360 *** (0.087) | −0.360 *** (0.087) | −0.360 *** (0.087) | −0.329 *** (0.058) | −0.329 *** (0.058) |
| Mediation effect (a × b) | 0.099 ** (0.032) | −0.104 ** (0.053) | −0.172 *** (0.052) | 0.080 ** (0.026) | −0.244 *** (0.039) |
| Direct effect (c′) | −0.459 *** (0.082) | −0.257 *** (0.069) | −0.188 ** (0.094) | −0.409 *** (0.053) | −0.085 * (0.049) |
| a | 0.279 ** (0.094) | 0.164 * (0.085) | 0.622 *** (0.066) | 0.214 *** (0.063) | 0.391 *** (0.054) |
| b | 0.354 *** (0.042) | −0.635 *** (0.039) | −0.276 *** (0.063) | 0.372 *** (0.041) | −0.624 *** (0.042) |
| a × b (95%BootCI) | [0.038, 0.162] | [−0.211, −0.004] | [−0.286, −0.082] | [0.028, 0.131] | [−0.325, −0.173] |
| Mediation Effect percent | 0.099 (−27.5%) | −0.104 (28.8%) | −0.172 (47.7%) | 0.080 (−24.2%) | −0.244 (74.2%) |
| Conclusion | Partial mediation | Partial mediation | Partial mediation | Partial mediation | Complete mediation |
Notes: Standard errors are in parentheses. Statistical significance is indicated as follows: *** p < 0.001, ** p < 0.05, * p < 0.1. The mediation effect (a × b) represents the indirect effect of green space equity on health outcomes, calculated as the product of path a (the effect of the independent variable on the mediator) and path b (the effect of the mediator on the health outcome).
Table A2.
Mediation analysis for mental health.
Table A2.
Mediation analysis for mental health.
| Green Accessibility => Marital Status => Mental Health | Green Accessibility => Education => Mental Health | Green Accessibility => Green Diversity => Mental Health | Green Diversity => Marital Status => Mental Health | Green Diversity => Education => Mental Health | |
|---|---|---|---|---|---|
| All effect(c) | 0.090 (0.095) | 0.090 (0.095) | 0.090 (0.095) | 0.052 (0.064) | 0.052 (0.064) |
| Mediation effect (a × b) | 0.059 ** (0.021) | −0.019 * (0.014) | 0.020 (0.047) | 0.046 ** (0.017) | −0.055 ** (0.026) |
| Direct effect (c′) | 0.031 (0.094) | 0.109 (0.095) | 0.070 (0.105) | 0.006 (0.064) | 0.107 (0.068) |
| a | 0.279 ** (0.094) | 0.164 * (0.085) | 0.622 *** (0.066) | 0.214 *** (0.063) | 0.391 *** (0.054) |
| b | 0.213 *** (0.049) | −0.116 ** (0.054) | 0.032 (0.071) | 0.214 *** (0.049) | −0.141 ** (0.057) |
| a × b (95%BootCI) | [0.021, 0.104] | [−0.053, 0.002] | [−0.068, 0.116] | [0.015, 0.083] | [−0.109, −0.008] |
| Mediation Effect percent | 0.059 (65.9%) | −0.019 (−21.1%) | 0.020 (22.3%) | 0.046 (88.3%) | −0.055 (−106.1%) |
| Conclusion | Complete mediation | Not significant | Not significant | Complete mediation | Complete mediation |
Notes: Standard errors are in parentheses. Statistical significance is indicated as follows: *** p < 0.001, ** p < 0.05, * p < 0.1. The mediation effect (a × b) represents the indirect effect of green space equity on health outcomes, calculated as the product of path a (the effect of the independent variable on the mediator) and path b (the effect of the mediator on the health outcome).
Table A3.
Mediation analysis for physical health.
Table A3.
Mediation analysis for physical health.
| Green Accessibility => Marital Status => Physical Health | Green Accessibility => Education => Physical Health | Green Accessibility => Green Diversity => Physical Health | Green Diversity => Marital Status => Physical Health | Green Diversity => Education => Physical Health | |
|---|---|---|---|---|---|
| All effect(c) | −0.121 (0.093) | −0.121 (0.093) | −0.121 (0.093) | −0.183 ** (0.062) | −0.183 ** (0.062) |
| Mediation effect (a × b) | 0.062 ** (0.023) | −0.040 ** (0.023) | −0.113 ** (0.050) | 0.051 ** (0.019) | −0.086 *** (0.027) |
| Direct effect (c′) | −0.182 ** (0.092) | −0.081 (0.091) | −0.008 (0.102) | −0.234 *** (0.061) | −0.098 (0.065) |
| a | 0.279 ** (0.094) | 0.164 * (0.085) | 0.622 *** (0.066) | 0.214 *** (0.063) | 0.391 *** (0.054) |
| b | 0.221 *** (0.048) | −0.243 *** (0.052) | −0.181 ** (0.068) | 0.237 *** (0.047) | −0.219 *** (0.055) |
| a × b (95%BootCI) | [0.021, 0.109] | [−0.091, −0.001] | [−0.218, −0.022] | [0.016, 0.092] | [−0.143, −0.038] |
| Mediation Effect percent | 0.062 (−51.1%) | −0.040 (32.9%) | −0.113 (93.4%) | 0.051 (−27.6%) | −0.086 (46.8%) |
| Conclusion | Partial mediation | Complete mediation | Complete mediation | Partial mediation | Complete mediation |
Notes: Standard errors are in parentheses. Statistical significance is indicated as follows: *** p < 0.001, ** p < 0.05, * p < 0.1. The mediation effect (a × b) represents the indirect effect of green space equity on health outcomes, calculated as the product of path a (the effect of the independent variable on the mediator) and path b (the effect of the mediator on the health outcome).
References
- Ifeagwu, S.C.; Yang, J.C.; Parkes-Ratanshi, R.; Brayne, C. Health Financing for Universal Health Coverage in Sub-Saharan Africa: A Systematic Review. Glob. Health Res. Policy 2021, 6, 8. [Google Scholar] [CrossRef] [PubMed]
- Clarke, P.; Erreygers, G. Defining and Measuring Health Poverty. Soc. Sci. Med. 2020, 244, 112633. [Google Scholar] [CrossRef] [PubMed]
- Deng, Y.; Zhang, Y.; Pan, J. Optimization for Locating Emergency Medical Service Facilities: A Case Study for Health Planning from China. Risk Manag. Healthc. Policy 2021, 14, 1791–1802. [Google Scholar] [CrossRef]
- Zhang, Y.; Chen, N.; Du, W.; Li, Y.; Zheng, X. Multi-Source Sensor Based Urban Habitat and Resident Health Sensing: A Case Study of Wuhan, China. Build. Environ. 2021, 198, 107883. [Google Scholar] [CrossRef]
- Chen, Y.; Amani-Beni, M.; Zhang, R.; Wei, D. Evolution of Population Distribution and Its Influencing Factors in the Poverty-Stricken Mountainous Region of Southwest China from 2000 to 2020. Humanit. Soc. Sci. Commun. 2024, 11, 1659. [Google Scholar] [CrossRef]
- Such, E.; Smith, K.; Woods, H.B.; Meier, P. Governance of Intersectoral Collaborations for Population Health and to Reduce Health Inequalities in High-Income Countries: A Complexity-Informed Systematic Review. Int. J. Health Policy Manag. 2022, 11, 2780. [Google Scholar] [CrossRef]
- Yang, W.; Li, Y.; Liu, Y.; Fan, P.; Yue, W. Environmental Factors for Outdoor Jogging in Beijing: Insights from Using Explainable Spatial Machine Learning and Massive Trajectory Data. Landsc. Urban Plan. 2024, 243, 104969. [Google Scholar] [CrossRef]
- Chen, J.; Kinoshita, T.; Li, H.; Luo, S.; Su, D. Which Green Is More Equitable? A Study of Urban Green Space Equity Based on Morphological Spatial Patterns. Urban For. Urban Green. 2024, 91, 128178. [Google Scholar] [CrossRef]
- Ma, G.; Pellegrini, P.; Han, H. The Vitality of Pocket Parks in High-Density Urban Areas. An Evaluation System from the Users’ Perspective in Southwest China. Urban For. Urban Green. 2025, 104, 128596. [Google Scholar] [CrossRef]
- Cong, S.; Nock, D.; Qiu, Y.L.; Xing, B. Unveiling Hidden Energy Poverty Using the Energy Equity Gap. Nat. Commun. 2022, 13, 2456. [Google Scholar] [CrossRef]
- Zhao, X.; Yu, F.; Zhang, X.; Chen, J.; Li, P. Assessing Urban Renewal Efficiency via Multi-Source Data and DID-Based Comparison between Historical Districts. npj Herit. Sci. 2025, 13, 389. [Google Scholar] [CrossRef]
- Hui, E.C.; Chen, T.; Lang, W.; Ou, Y. Urban Community Regeneration and Community Vitality Revitalization through Participatory Planning in China. Cities 2021, 110, 103072. [Google Scholar] [CrossRef]
- Casprini, D.; Oppio, A.; Rossi, G.; Bengo, I. Managing Urban Green Areas: The Benefits of Collaborative Governance for Green Spaces. Land 2023, 12, 1872. [Google Scholar] [CrossRef]
- Wollburg, P.; Hallegatte, S.; Mahler, D.G. Ending Extreme Poverty Has a Negligible Impact on Global Greenhouse Gas Emissions. Nature 2023, 623, 982–986. [Google Scholar] [CrossRef]
- Erin, O.A.; Bamigboye, O.A.; Oyewo, B. Sustainable Development Goals (SDG) Reporting: An Analysis of Disclosure. J. Account. Emerg. Econ. 2022, 12, 761–789. [Google Scholar] [CrossRef]
- Xie, N.; Chen, A.; Wang, X.; Zhang, X. Does the BRI Contribute to Poverty Reduction in Countries along the Belt and Road? A DID-Based Empirical Test. Humanit. Soc. Sci. Commun. 2023, 10, 872. [Google Scholar] [CrossRef]
- Sun, Z.; Lu, Y.; Di, W.; Ta, N.; Wu, J. Spatial Variability in the Pathways of Green Space Quality on Life Satisfaction - Mediating Effects Based on Domain Satisfaction. J. Environ. Manage. 2024, 370, 122524. [Google Scholar] [CrossRef] [PubMed]
- Fan, P.; Xu, L.; Yue, W.; Chen, J. Accessibility of Public Urban Green Space in an Urban Periphery: The Case of Shanghai. Landsc. Urban Plan. 2017, 165, 177–192. [Google Scholar] [CrossRef]
- Browning, M.H.E.M.; Rigolon, A.; McAnirlin, O. Where Greenspace Matters Most: A Systematic Review of Urbanicity, Greenspace, and Physical Health. Landsc. Urban Plan. 2022, 217, 104233. [Google Scholar] [CrossRef]
- Chen, Y.; Yue, W.; La Rosa, D. Which Communities Have Better Accessibility to Green Space? An Investigation into Environmental Inequality Using Big Data. Landsc. Urban Plan. 2020, 204, 103919. [Google Scholar] [CrossRef]
- Lin, Y.-X.; Liu, Y. Let the City Heal You: Environment and Activity’s Distinct Roles in Leisure Restoration and Satisfaction. Cities 2024, 154, 105336. [Google Scholar] [CrossRef]
- Scopelliti, M.; Carrus, G.; Bonaiuto, M. Is It Really Nature That Restores People? A Comparison with Historical Sites with High Restorative Potential. Front. Psychol. 2019, 9, 2742. [Google Scholar] [CrossRef]
- Ye, Y.; Richards, D.; Lu, Y.; Song, X.; Zhuang, Y.; Zeng, W.; Zhong, T. Measuring Daily Accessed Street Greenery: A Human-Scale Approach for Informing Better Urban Planning Practices. Landsc. Urban Plan. 2019, 191, 103434. [Google Scholar] [CrossRef]
- Wu, C.; Du, Y.; Li, S.; Liu, P.; Ye, X. Does Visual Contact with Green Space Impact Housing Pricesʔ An Integrated Approach of Machine Learning and Hedonic Modeling Based on the Perception of Green Space. Land Use Policy 2022, 115, 106048. [Google Scholar] [CrossRef]
- Zhang, X.; Lin, E.S.; Tan, P.Y.; Qi, J.; Ho, R.; Sia, A.; Waykool, R.; Song, X.P.; Olszewska-Guizzo, A.; Meng, L. Beyond Just Green: Explaining and Predicting Restorative Potential of Urban Landscapes Using Panorama-Based Metrics. Landsc. Urban Plan. 2024, 247, 105044. [Google Scholar] [CrossRef]
- Dong, Q.; Cai, J.; Chen, S.; He, P.; Chen, X. Spatiotemporal Analysis of Urban Green Spatial Vitality and the Corresponding Influencing Factors: A Case Study of Chengdu, China. Land 2022, 11, 1820. [Google Scholar] [CrossRef]
- Zhang, X.; Chen, J.; Wang, H.; Yang, D. From Policy Synergy to Equitable Greenspace: Unveiling the Multifaceted Effects of Regional Cooperation upon Urban Greenspace Exposure Inequality in China’s Megacity-Regions. Appl. Geogr. 2025, 174, 103472. [Google Scholar] [CrossRef]
- Chen, J.; Li, H.; Luo, S.; Su, D.; Zang, T.; Kinoshita, T.; Yang, L. How Do Economic Levels, Urbanization, and Infrastructure Investments Influence Inequality in Urban Green Space Exposure? Insights from Japanese Municipalities. Urban For. Urban Green. 2025, 104, 128649. [Google Scholar] [CrossRef]
- Santika, T.; Wilson, K.A.; Law, E.A.; St John, F.A.V.; Carlson, K.M.; Gibbs, H.; Morgans, C.L.; Ancrenaz, M.; Meijaard, E.; Struebig, M.J. Impact of Palm Oil Sustainability Certification on Village Well-Being and Poverty in Indonesia. Nat. Sustain. 2021, 4, 109–119. [Google Scholar] [CrossRef]
- Middel, A.; Lukasczyk, J.; Zakrzewski, S.; Arnold, M.; Maciejewski, R. Urban Form and Composition of Street Canyons: A Human-Centric Big Data and Deep Learning Approach. Landsc. Urban Plan. 2019, 183, 122–132. [Google Scholar] [CrossRef]
- Liu, D.; Lu, Y.; Jiang, Y. Exploring the Environmental Justice of Street Tree Provision: Adding Biodiversity to Automatic Assessment of Street-Level Greenery. Urban For. Urban Green. 2026, 115, 129184. [Google Scholar] [CrossRef]
- Liu, G.; Chen, H.; Yuan, Y.; Song, C. Indoor Thermal Environment and Human Health: A Systematic Review. Renew. Sustain. Energy Rev. 2024, 191, 114164. [Google Scholar] [CrossRef]
- Dong, L.; Bouey, J. Public Mental Health Crisis during COVID-19 Pandemic, China. Emerg. Infect. Dis. 2020, 26, 1616. [Google Scholar] [CrossRef]
- Seligman, H.K.; Levi, R.; Adebiyi, V.O.; Coleman-Jensen, A.; Guthrie, J.F.; Frongillo, E.A. Assessing and Monitoring Nutrition Security to Promote Healthy Dietary Intake and Outcomes in the United States. Annu. Rev. Nutr. 2023, 43, 409–429. [Google Scholar] [CrossRef] [PubMed]
- Siraji, M.A.; Spitschan, M.; Kalavally, V.; Haque, S. Light Exposure Behaviors Predict Mood, Memory and Sleep Quality. Sci. Rep. 2023, 13, 12425. [Google Scholar] [CrossRef]
- Liu, D.; Kwan, M.-P.; Kan, Z. Analysis of Urban Green Space Accessibility and Distribution Inequity in the City of Chicago. Urban For. Urban Green. 2021, 59, 127029. [Google Scholar] [CrossRef]
- Wu, J.; Peng, Y.; Liu, P.; Weng, Y.; Lin, J. Is the Green Inequality Overestimated? Quality Reevaluation of Green Space Accessibility. Cities 2022, 130, 103871. [Google Scholar] [CrossRef]
- Gao, H.; Wang, T.; Gu, S. A Study of Resident Satisfaction and Factors That Influence Old Community Renewal Based on Community Governance in Hangzhou: An Empirical Analysis. Land 2022, 11, 1421. [Google Scholar] [CrossRef]
- Chen, J.; Li, P.; Wang, H. Assessment of Influential Factors on Commute and Life Satisfaction in a Historic Campus-Adjacent Environment: Evidence from a Comparison Study of Twin Cities. J. Urban Plan. Dev. 2025, 151, 4024065. [Google Scholar] [CrossRef]
- Fan, L.; Cao, J.; Hu, M.; Yin, C. Exploring the Importance of Neighborhood Characteristics to and Their Nonlinear Effects on Life Satisfaction of Displaced Senior Farmers. Cities 2022, 124, 103605. [Google Scholar] [CrossRef]
- Basu, A.; Duvall, J.; Kaplan, R. Attention Restoration Theory: Exploring the Role of Soft Fascination and Mental Bandwidth. Environ. Behav. 2019, 51, 1055–1081. [Google Scholar] [CrossRef]
- Xu, Y.; Zhang, H.; Li, Z.; Wang, H.; Zhou, L.; Bao, Z.; Tang, G. Integration of Migration and Attention Flow Data to Reveal Association of Virtual–Real Dual Intercity Network Structure. Cities 2023, 143, 104614. [Google Scholar] [CrossRef]
- Li, J.; Xue, E.; Wei, Y.; He, Y. How Popularising Higher Education Affects Economic Growth and Poverty Alleviation: Empirical Evidence from 38 Countries. Humanit. Soc. Sci. Commun. 2024, 11, 520. [Google Scholar] [CrossRef]
- Zhang, J.; Liu, S.; Liu, K.; Bian, F. How Does Campus-Scape Influence University Students’ Restorative Experiences: Evidences from Simultaneously Collected Physiological and Psychological Data. Urban For. Urban Green. 2025, 107, 128779. [Google Scholar] [CrossRef]
- Subiza-Pérez, M.; Korpela, K.; Pasanen, T. Still Not That Bad for the Grey City: A Field Study on the Restorative Effects of Built Open Urban Places. Cities 2021, 111, 103081. [Google Scholar] [CrossRef]
- Gu, H.; Lin, Y.; Shen, T. Do You Feel Accepted? Perceived Acceptance and Its Spatially Varying Determinants of Migrant Workers among Chinese Cities. Cities 2022, 125, 103626. [Google Scholar] [CrossRef]
- de Vries, M.; Kim, J.Y.; Han, H. The Unequal Landscape of Civic Opportunity in America. Nat. Hum. Behav. 2024, 8, 256–263. [Google Scholar] [CrossRef] [PubMed]
- Li, Y.; Zhang, X.; Xia, C. Towards a Greening City: How Does Regional Cooperation Promote Urban Green Space in the Guangdong-Hong Kong-Macau Greater Bay Area? Urban For. Urban Green. 2023, 86, 128033. [Google Scholar] [CrossRef]
- Megyesi, B.; Gholipour, A.; Cuomo, F.; Canga, E.; Tsatsou, A.; Zihlmann, V.; Junge, R.; Milosevic, D.; Pineda-Martos, R. Perceptions of Stakeholders on Nature-Based Solutions in Urban Planning: A Thematic Analysis in Six European Cities. Urban For. Urban Green. 2024, 96, 128344. [Google Scholar] [CrossRef]
- Coombes, M.A.; Viles, H.A. Integrating Nature-Based Solutions and the Conservation of Urban Built Heritage: Challenges, Opportunities, and Prospects. Urban For. Urban Green. 2021, 63, 127192. [Google Scholar] [CrossRef]
- Ma, Y.; Yang, Y.; Jiao, H. Exploring the Impact of Urban Built Environment on Public Emotions Based on Social Media Data: A Case Study of Wuhan. Land 2021, 10, 986. [Google Scholar] [CrossRef]
- Yang, Y.; He, R.; Tian, G.; Shi, Z.; Wang, X.; Fekete, A. Equity Study on Urban Park Accessibility Based on Improved 2SFCA Method in Zhengzhou, China. Land 2022, 11, 2045. [Google Scholar] [CrossRef]
- Tian, D.; Wang, J.; Xia, C.; Zhang, J.; Zhou, J.; Tian, Z.; Zhao, J.; Li, B.; Zhou, C. The Relationship between Green Space Accessibility by Multiple Travel Modes and Housing Prices: A Case Study of Beijing. Cities 2024, 145, 104694. [Google Scholar] [CrossRef]
- Qiao, S.; Yeh, A.G.-O. Understanding the Effects of Environmental Perceptions on Walking Behavior by Integrating Big Data with Small Data. Landsc. Urban Plan. 2023, 240, 104879. [Google Scholar] [CrossRef]
- Resler, M.L.; Mazac, R.; Candy, S.; Kemppainen, T. Transitioning beyond Urban Green Space Accessibility Indicators: Case Illustration of a Novel Diversity Planning Tool Applied to Vantaa, Finland. Environ. Sustain. Indic. 2023, 18, 100232. [Google Scholar] [CrossRef]
- Wei, H.; Zhang, J.; Xu, Z.; Hui, T.; Guo, P.; Sun, Y. The Association between Plant Diversity and Perceived Emotions for Visitors in Urban Forests: A Pilot Study across 49 Parks in China. Urban For. Urban Green. 2022, 73, 127613. [Google Scholar] [CrossRef]
- Chen, Y.; Xu, L.; Cui, X.; Yang, H.; Liu, Y.; Gao, X.; Huang, J. A Systematic Review on the Associations between Built Environment and Mental Health among Older People. Front. Public Health 2025, 13, 1584466. [Google Scholar] [CrossRef]
- Sun, D.; Lu, Y.; Qin, Y.; Lu, M.; Song, Z.; Ding, Z. Method for Evaluating Urban Building Renewal Potential Based on Multimachine Learning Integration: A Case Study of Longgang and Longhua Districts in Shenzhen. Land 2024, 14, 15. [Google Scholar] [CrossRef]
- Li, Y.; Zhuang, T.; Qian, Q.K.; Mlecnik, E.; Visscher, H.J. From Acceptance to Continuance: Understanding the Influence of Initial Participation Experience on Residents’ Intentions to Continue Participation in Neighborhood Rehabilitation. Cities 2024, 147, 104788. [Google Scholar] [CrossRef]
- Li, X.; Li, Y.; Jia, T.; Zhou, L.; Hijazi, I.H. The Six Dimensions of Built Environment on Urban Vitality: Fusion Evidence from Multi-Source Data. Cities 2022, 121, 103482. [Google Scholar] [CrossRef]
- McCarty, D.; Lee, D.; Park, Y.; Kim, H.W. Exploring Road Safety through Urban Fabric Characteristics and Theory-Driven Prediction Modeling with SEM-XGBoost. Environ. Plan. B Urban Anal. City Sci. 2025, 52, 303–321. [Google Scholar] [CrossRef]
- Zhou, S.; Jia, W.; Wang, M.; Liu, Z.; Wang, Y.; Wu, Z. Synergistic Assessment of Multi-Scenario Urban Waterlogging through Data-Driven Decoupling Analysis in High-Density Urban Areas: A Case Study in Shenzhen, China. J. Environ. Manage. 2024, 369, 122330. [Google Scholar] [CrossRef]
- Cao, C.; Su, Y. Transportation Infrastructure and Regional Resource Allocation. Cities 2024, 155, 105433. [Google Scholar] [CrossRef]
- Hao, T.; Chang, H.; Liang, S.; Jones, P.; Chan, P.W.; Li, L.; Huang, J. Heat and Park Attendance: Evidence from “Small Data” and “Big Data” in Hong Kong. Build. Environ. 2023, 234, 110123. [Google Scholar] [CrossRef]
- Chen, J.; Li, P.; Lei, Y.; Li, H.; Zhang, D.; Chen, B.; Liu, J.; Schnabel, M.A. Unraveling the Nexus between Spatial Quality and Buzz Behavior: Analyzing Geo-Tagged Social Media and Multisource Spatial Data Using Text Mining and XGBoost. Appl. Geogr. 2026, 186, 103858. [Google Scholar] [CrossRef]
- Gu, H.; Wang, J.; Ling, Y. Economic Geography of Talent Migration and Agglomeration in China: A Dual-Driver Framework. China Econ. Rev. 2024, 86, 102180. [Google Scholar] [CrossRef]
- Liu, D.; Kwan, M.-P.; Yang, Z.; Kan, Z. Comparing Subjective and Objective Greenspace Accessibility: Implications for Real Greenspace Usage among Adults. Urban For. Urban Green. 2024, 96, 128335. [Google Scholar] [CrossRef]
- Jang, K.M.; Kim, J.; Lee, H.-Y.; Cho, H.; Kim, Y. Urban Green Accessibility Index: A Measure of Pedestrian-Centered Accessibility to Every Green Point in an Urban Area. ISPRS Int. J. Geo-Information 2020, 9, 586. [Google Scholar] [CrossRef]
- Jiang, Y.; Sun, Z.; Wei, D.; Zhao, P.; Yang, L.; Lu, Y. Revealing the Spatiotemporal Pattern of Urban Vibrancy at the Urban Agglomeration Scale: Evidence from the Pearl River Delta, China. Appl. Geogr. 2025, 181, 103694. [Google Scholar] [CrossRef]
- Gu, H.; Lin, Y.; Hu, H.; Yu, H. COVID-19 Pandemic and Road Infrastructure Exerted Stage-Dependent Spatiotemporal Influences on Inter-City Road Travel in China. Humanit. Soc. Sci. Commun. 2025, 12, 705. [Google Scholar] [CrossRef]
Disclaimer/Publisher’s Note: The statements, opinions and data contained in all publications are solely those of the individual author(s) and contributor(s) and not of MDPI and/or the editor(s). MDPI and/or the editor(s) disclaim responsibility for any injury to people or property resulting from any ideas, methods, instructions or products referred to in the content. |
© 2026 by the authors. Licensee MDPI, Basel, Switzerland. This article is an open access article distributed under the terms and conditions of the Creative Commons Attribution (CC BY) license.