Article

Morphology-Adaptive Spatial Analysis of Urban Green Spaces: A Homogeneous Unit of Building Morphology (HUBM)-Based Framework for Ecosystem Service and Resilience Assessment in High-Density Cities

1
Institute of Urban and Sustainable Development, City University of Macau, Macau SAR, China
2
Grand Thought Think Tank, Macau SAR, China
3
College of Civil Engineering and Architecture, Zhejiang University, Hangzhou 310027, China
4
Department of Landscape Architecture, Texas Tech University, Lubbock, TX 79409, USA
*
Author to whom correspondence should be addressed.
Submission received: 17 October 2025 / Revised: 24 November 2025 / Accepted: 5 December 2025 / Published: 19 December 2025

Abstract

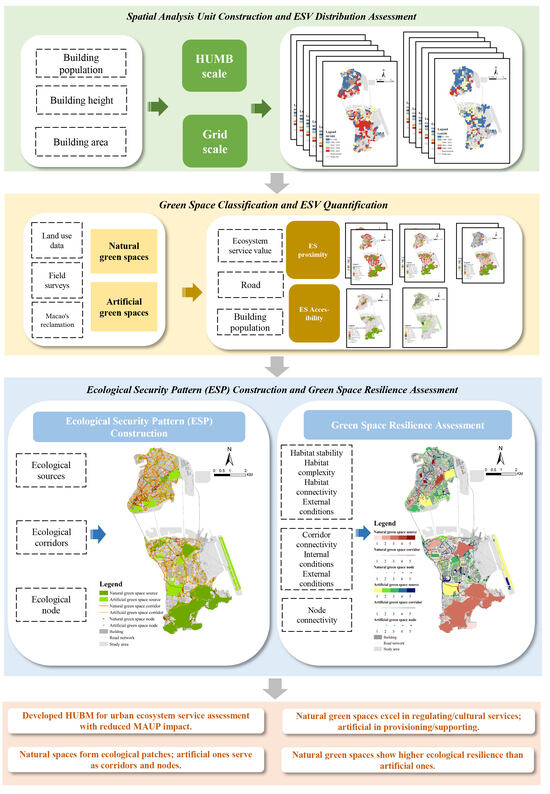
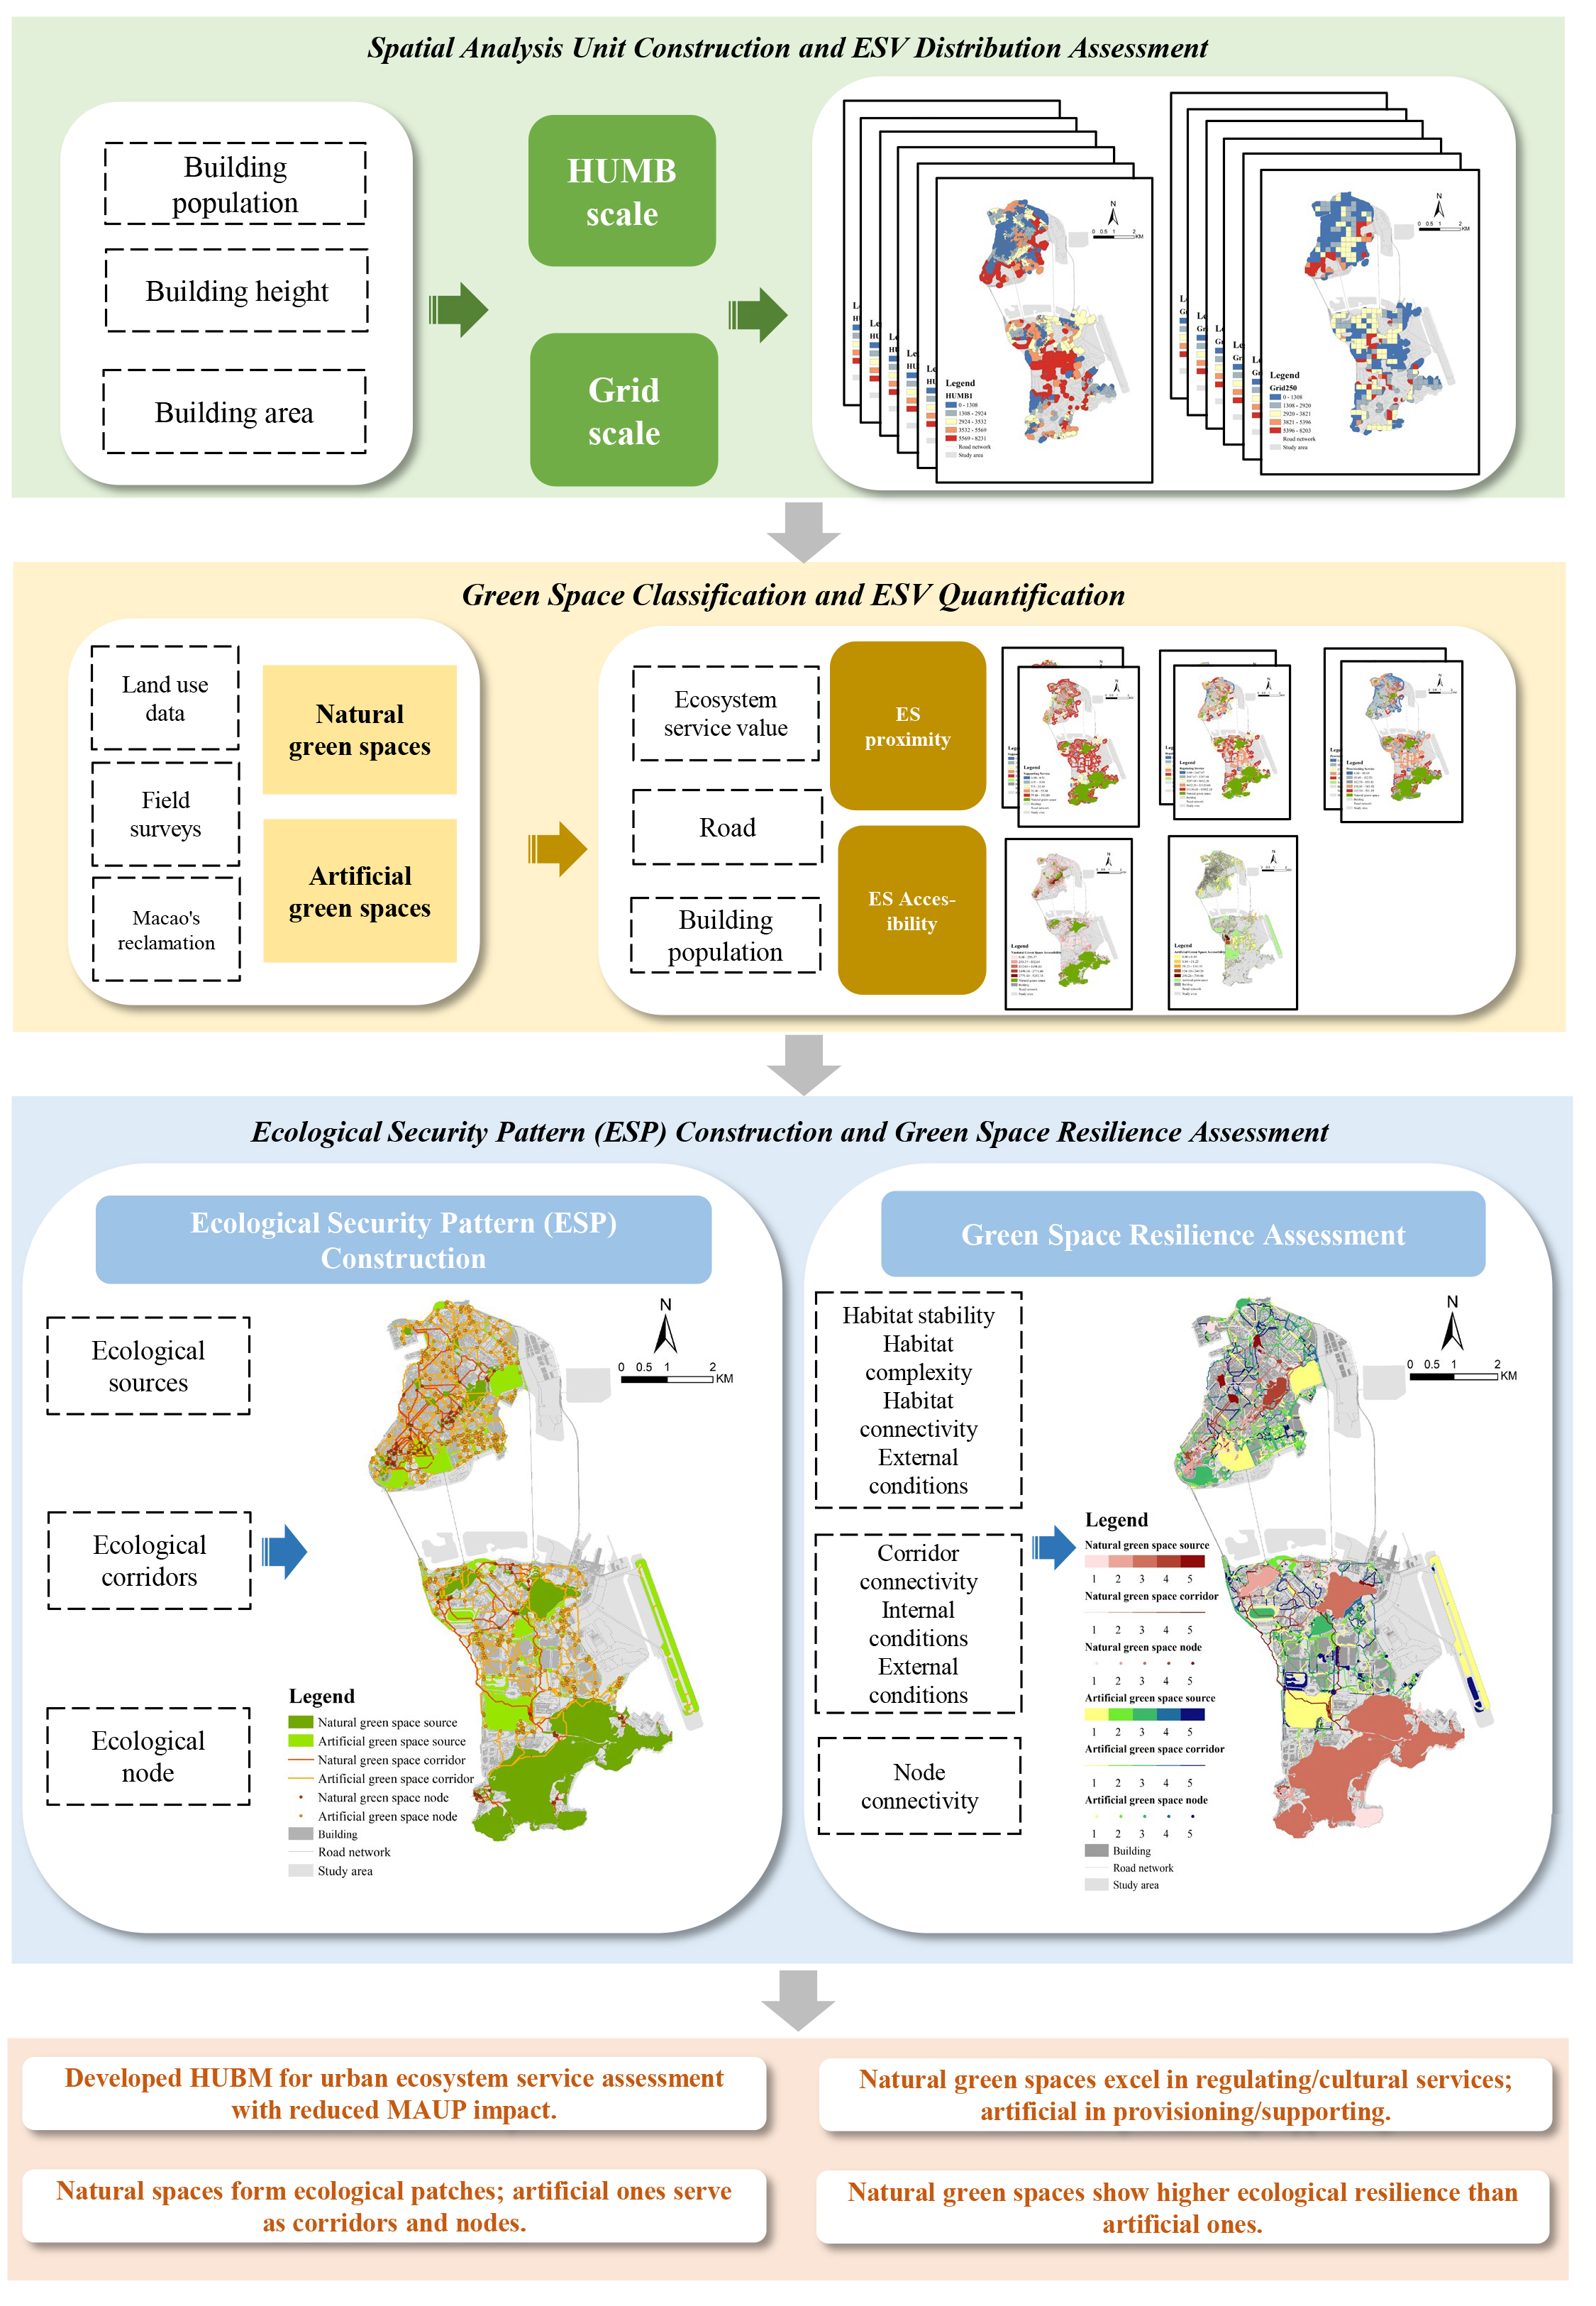
Environmental assessment in high-density urban areas faces significant challenges due to complex building morphology and the Modifiable Areal Unit Problem (MAUP). This study proposes a morphology-adaptive computational framework that integrates the Homogeneous Unit of Building Morphology (HUBM) with geospatial modeling to enhance environmental assessment processes. Using Macao as a case study, the framework quantifies local and accessibility-based ecosystem service flows and evaluates ecological resilience via ecological security patterns and spatial elasticity indices. The results demonstrate that HUBM substantially reduces MAUP-induced biases compared to traditional grid-based approaches, maintaining statistical significance in spatial clustering analyses across all scales. Functionally, ecosystem service value (ESV) analysis reveals that natural green spaces provide more than three times the total ESV, predominantly offering regulating services, while artificial green spaces primarily deliver localized services. Accessibility analysis highlights considerable spatial inequities, with natural green spaces exhibiting a significantly higher recreational accessibility index. In terms of ecological security patterns (ESPs), natural green spaces function as core ecological patches, while artificial green spaces dominate connectivity, accounting for 75% of corridor length and 86% of node density. Natural green spaces exhibit significantly greater ecological resilience. These findings highlight the complementary roles of natural and artificial green spaces in dense urban environments and underscore the need for adaptive spatial analysis in urban planning.

Graphical Abstract

1. Introduction

Urban green spaces—including parks, gardens, urban forests, wetlands, and green roofs—are essential components of the built environment, providing a broad spectrum of ecosystem services (ESs) that sustain biodiversity, regulate microclimates, improve air quality, and enhance public health and well-being [1,2,3,4,5,6,7]. These multiple of ES have been widely acknowledged in global initiatives [8,9], which have informed sustainable urban planning and environmental governance. Advances in geospatial modeling and valuation techniques have become central to urban ecological research, enabling precise quantification and mapping of ES [10,11,12,13,14]. Beyond their direct functional roles, urban green spaces form the backbone of urban ecological resilience—the capacity of urban systems to absorb disturbances while maintaining essential structures and functions [15,16]. Resilience depends on the continuous flow of ecosystem services, while ES in turn reinforces resilience through regulating, supporting, and cultural functions [17]. Consequently, ES and resilience are mutually reinforcing dimensions of sustainable urban systems. To accurately model the interdependence between ecosystem services and urban resilience, it is essential to distinguish between two core concepts in ecosystem service assessment: ES Value (ESV) and ES Flow. ES Value (ESV) quantifies the total stock or potential capacity of services, often using monetary coefficients to reflect the economic value of these services (e.g., flood mitigation, air quality improvement) [18]. In contrast, ES Flow measures the spatial delivery and accessibility of these services to human beneficiaries, capturing the actual availability and distribution of services across different areas of the city. However, in high-density urban contexts, where spatial constraints and morphological heterogeneity are pronounced, accurately quantifying ES Flow and resilience remains particularly challenging. Traditional models, which often rely on fixed spatial units such as grids, fail to capture the fine-grained complexity of urban landscapes. The Modifiable Areal Unit Problem (MAUP) is a significant obstacle in these cases, as it can lead to scale-dependent distortions that obscure the true relationships between spatial units and ecosystem service distribution. Therefore, to overcome these challenges, a more dynamic and adaptive spatial framework—such as HUBM (Homogeneous Unit of Building Morphology)—is required to better represent the intricate geometry of urban areas and capture the real-time flow of ecosystem services to urban populations.
Within this framework, Ecological Security Patterns (ESPs) offer a powerful spatial approach to identify key landscape configurations—including ecological corridors, nodes, and connections—that sustain ecological processes and conserve ecosystem services [19,20,21]. Integrating green spaces into ESPs enhances ecological connectivity, stabilizes fragmented systems, and improves adaptive capacity against both natural and anthropogenic pressures [22]. Nevertheless, conventional ESP and ES assessments frequently employ regular grids or administrative units that oversimplify the fine-grained heterogeneity of dense urban environments [23]. Such grid-based analyses are highly susceptible to the Modifiable Areal Unit Problem (MAUP), producing scale-dependent distortions that obscure true spatial relationships [24,25]. Consequently, critical morphological influences—such as building density, height variability, and continuity of urban form—remain underrepresented in ES evaluations [26].
Moreover, few studies have explicitly differentiated between local ecosystem services (ES_local)—such as air purification and flood regulation that primarily benefit adjacent areas—and accessibility-based ecosystem services (ES_accessibility)—such as recreation, whose benefits decline with distance [27,28]. Neglecting these spatial flow dynamics can result in biased assessments and inequitable access to urban ecosystem benefits [29,30]. Similarly, the functional distinction between natural and artificial green spaces remains underexplored in dense cities, where land scarcity demands hybrid ecological strategies integrating both types [31,32,33]. Developing a comparative understanding of how natural and artificial green spaces jointly contribute to ES provision and resilience is thus essential for equitable, adaptive, and sustainable urban development.
To address these gaps, this study establishes a morphology-adaptive computational framework for urban ES assessment that: (1) introduces the Homogeneous Unit of Building Morphology (HUBM) to enhance spatial accuracy and mitigate MAUP-induced biases; (2) quantifies ES flows by integrating ES_local and ES_accessibility, while distinguishing between natural and artificial green spaces; and (3) evaluates resilience using ESP modeling and spatial elasticity indices to capture the structural contributions of different green-space types to ecological stability. Using Macao—one of the world’s most densely populated and morphologically complex urban regions [34]—as a case study, this research advances spatially explicit urban ecological analysis through adaptive spatial units. The proposed framework effectively overcomes key limitations of grid-based approaches by capturing urban morphological complexity and reducing MAUP effects. By integrating ES_local and ES_accessibility flows, it provides a nuanced understanding of ecosystem dynamics in compact urban settings. Furthermore, the comparative analysis of natural and artificial green spaces—an area seldom examined in prior studies—reveals their distinct yet complementary contributions to ecological security and resilience. Together, these innovations offer actionable insights for urban landscape planning, emphasizing integrated strategies that leverage multiple green-space typologies to enhance sustainability, resilience, and equitable access to ecosystem services in rapidly urbanizing environments.

2. Materials and Methods

2.1. Description of the Study Area and Data Acquisition

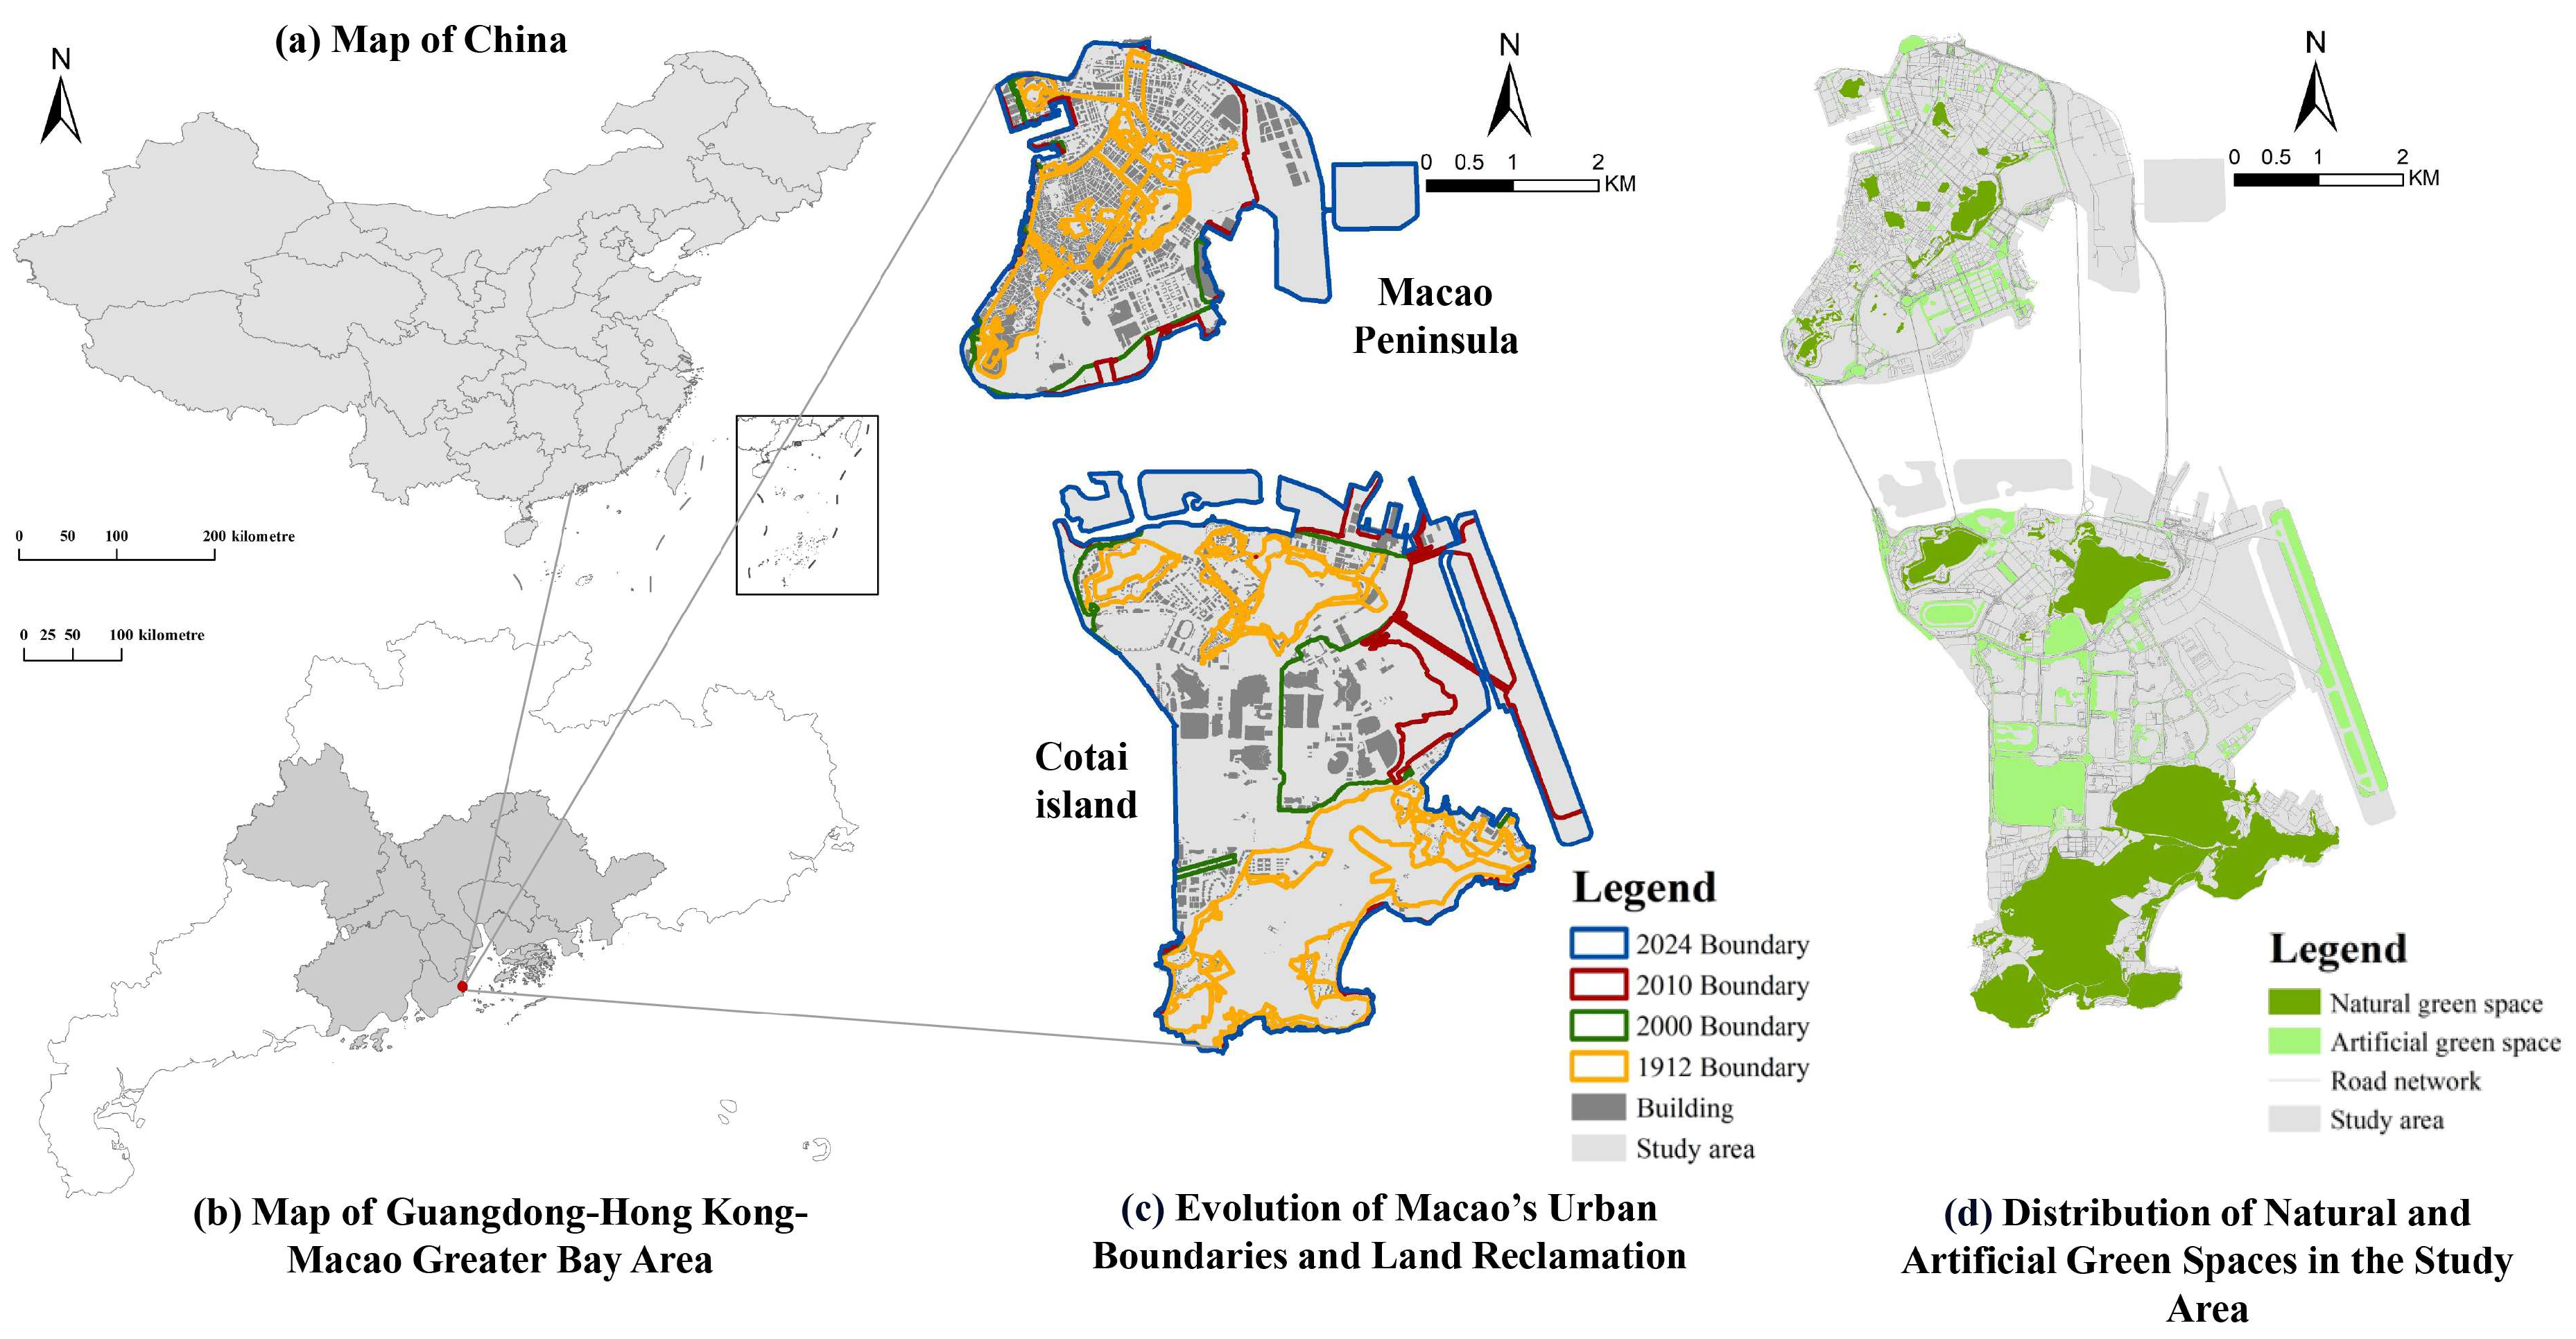
This study focuses on the Macao Special Administrative Region (SAR), located on the western bank of the Pearl River Estuary and comprising the Macao Peninsula and Cotai Island. Macao is characterized by an extremely compact urban form shaped by its unique geography and historical development [35]. Severe land scarcity, driven by rapid economic and demographic growth, has necessitated extensive land reclamation, expanding the territory from 11.6 km2 in 1912 to 32.9 km2 in 2020 [36]. As of 2024, Macao accommodates 10,486 building units within this limited area, resulting in one of the world’s highest population densities (20,600 persons/km2) [37]. These constraints have produced a highly heterogeneous urban morphology characterized by irregular building clusters, complex street networks, and fragmented green spaces (Figure 1).
To better understand the ecological implications of this complex morphology, green spaces were classified based on land reclamation history, a key factor driving urban expansion. Natural green spaces are defined as areas on pre-reclamation land, including forests, woodlands, and wetlands that developed through natural ecological succession. In contrast, artificial green spaces are those established on reclaimed land through human design and landscaping, including urban parks, roadside green belts, and waterfront recreational zones [38]. These spaces reflect substantial anthropogenic influence through their vegetation structure, species composition, and ecological function [39]. Overall, Macao is home to 126 natural green spaces, covering an area of 6.69 km2, and 1793 artificial green spaces, totaling 4.09 km2 (Figure 1).
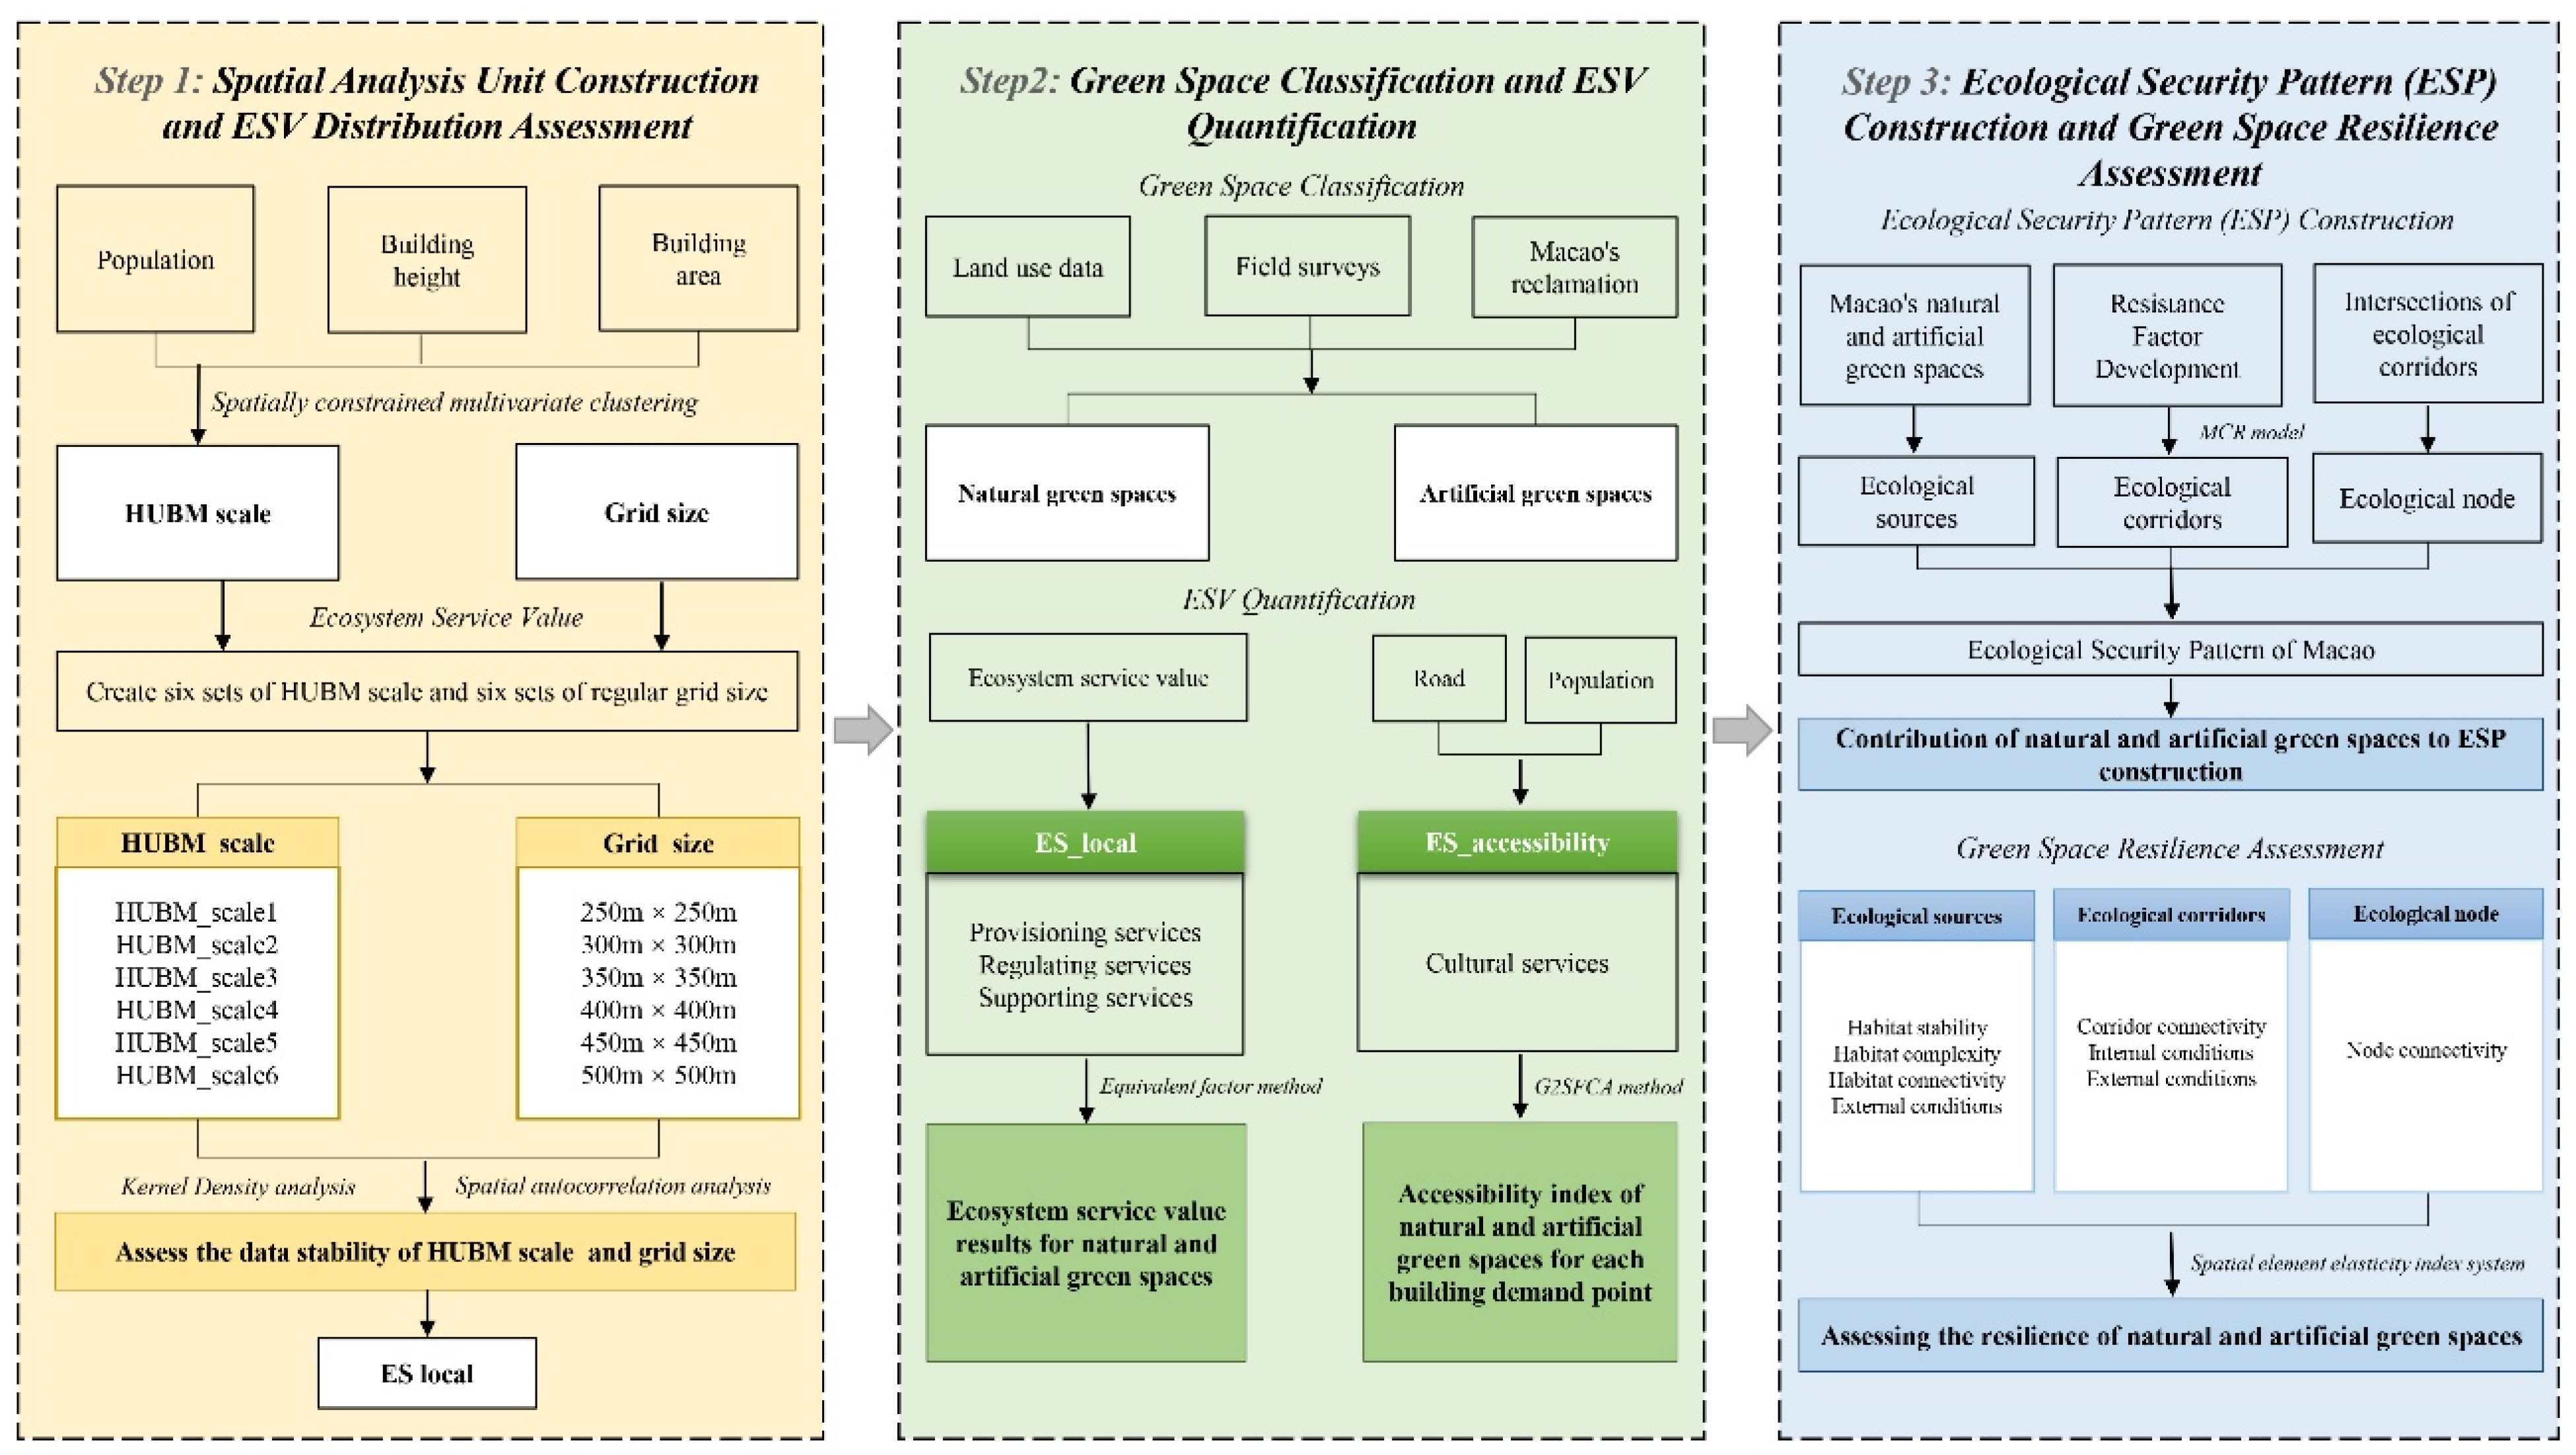
To systematically evaluate the resilience of green space systems within this high-density context, we developed a computational framework using ArcGIS 10.8 that integrates multi-source geospatial datasets and field survey data (Figure 2). The core datasets include green space polygons from the Macao Municipal Affairs Bureau, building footprints and heights from the Macao Cartography and Cadastre Bureau, road networks from OpenStreetMap, population distribution from the Macao Census, and land use and reclamation history derived from remote sensing and cadastral data. The methodological workflow comprises five steps:
(1)
the generation of morphology-adaptive spatial units using the Homogeneous Unit of Building Morphology (HUBM) method;
(2)
the assessment of local ecosystem services using the equivalent factor method coupled with Coefficient Sensitivity (CS) analysis to verify result robustnes;
(3)
the assessment of accessibility-based ecosystem services via the Gaussian Two-Step Floating Catchment Area (G2SFCA) model;
(4)
the construction of ecological security patterns (ESPs) using the Minimum Cumulative Resistance (MCR) model; and
(5)
the evaluation of natural and artificial green space resilience through spatial element elasticity indices.
Kernel density estimation and spatial autocorrelation analyses were applied to compare the spatial patterns of ecosystem services derived from HUBM with those obtained using conventional spatial units, while also evaluating their consistency under the influence of the Modifiable Areal Unit Problem (MAUP). Table 1 summarizes the datasets, and Figure 2 illustrates the integrated computational framework.

2.2. Morphology-Adaptative Spatial Units and Ecosystem Services Mapping

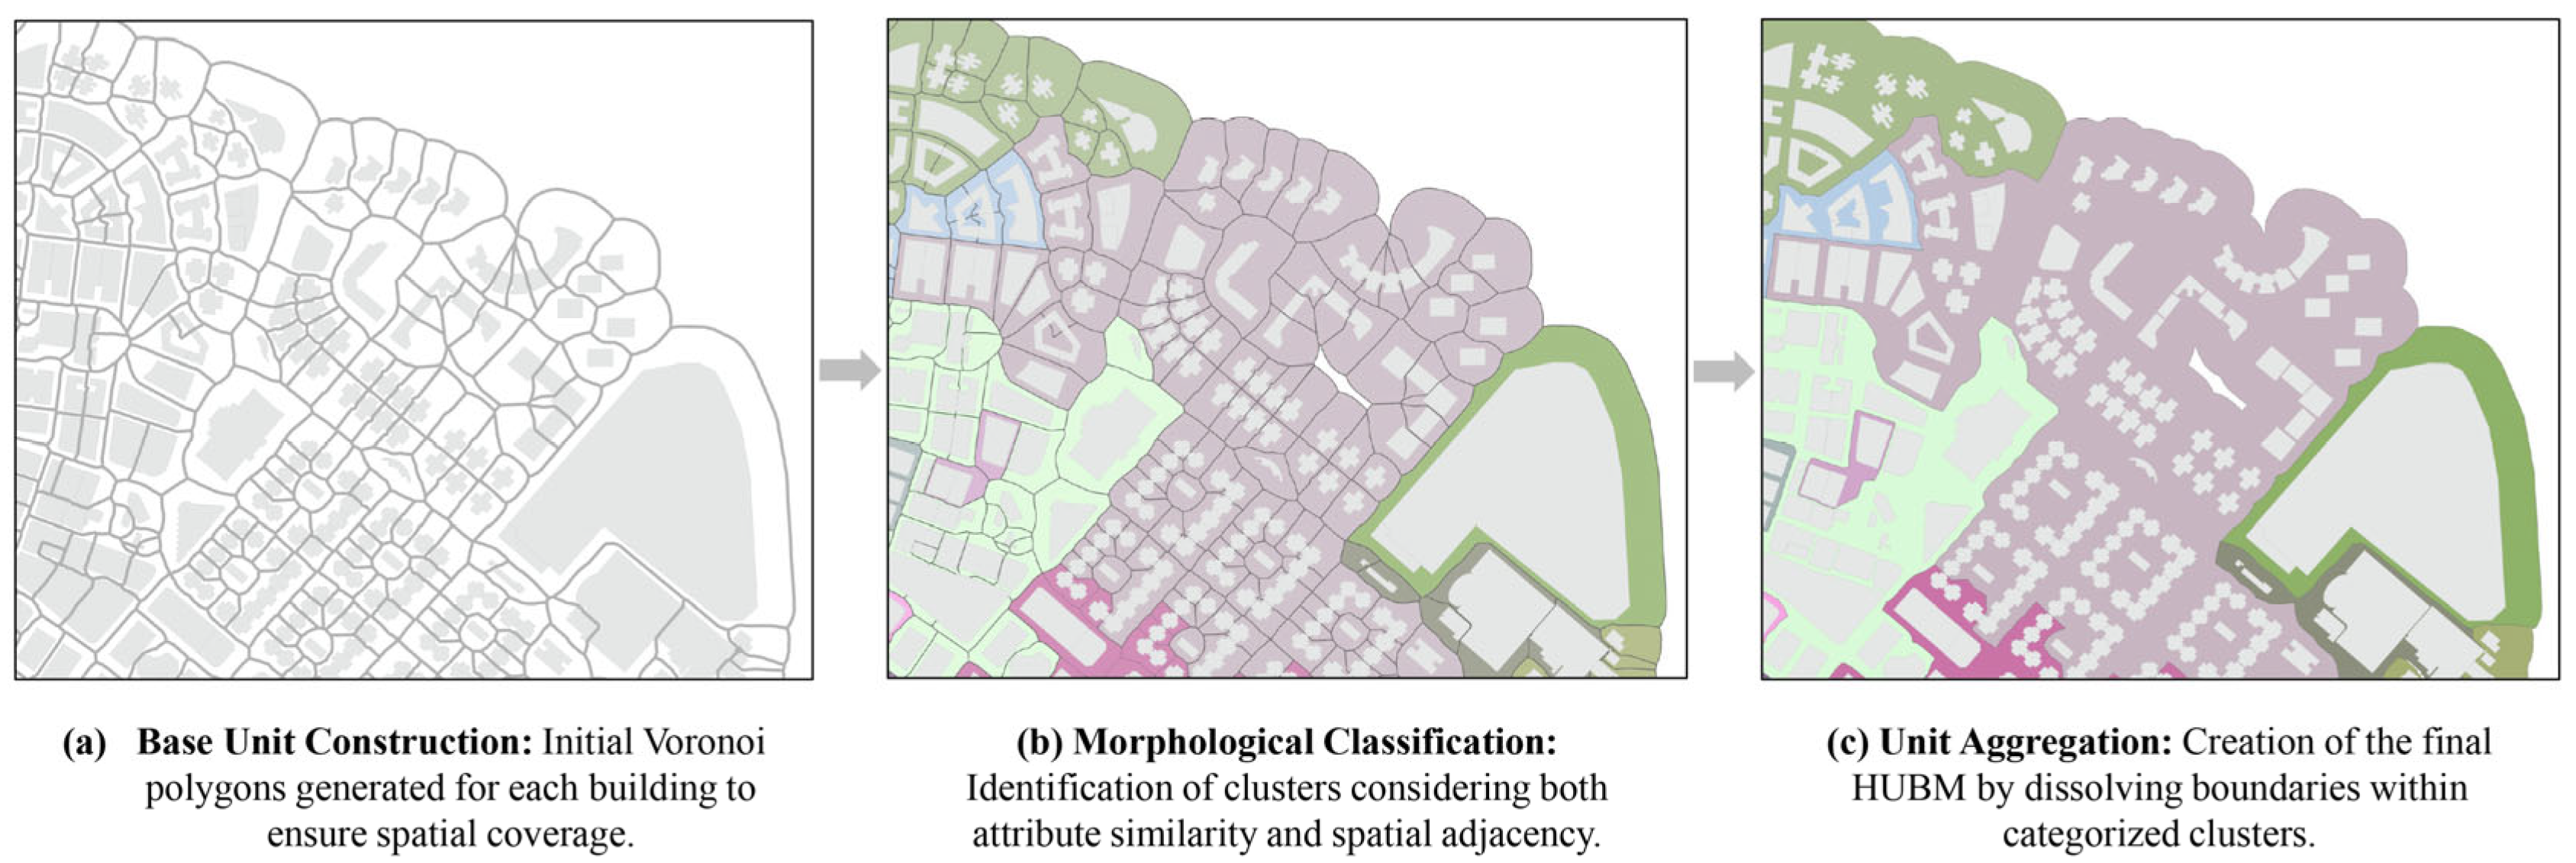
In this study, we adopted and extended the Homogeneous Unit of Building Morphology (HUBM) method [40]. Unlike rigid grid systems, HUBM aggregates building units based on morphological similarity to create continuous spatial units that preserve the integrity of the urban fabric. The generation workflow consists of three primary stages, as illustrated in Figure 3: (1) Voronoi Generation, where base units are created from building footprints to cover the continuous space; (2) Spatially Constrained Clustering, which groups units based on attributes and adjacency; and (3) Boundary Dissolving, which merges clustered polygons into final zones.
To define the morphological characteristics of each unit, three key variables were extracted from high-resolution datasets [41]: population count, building height, and footprint area. These variables were processed using the Spatially Constrained Multivariate Clustering algorithm in ArcGIS Pro 3.0. To ensure the need for a balanced representation of urban form, equal weights were assigned to all three variables during the clustering process, preventing any single attribute from disproportionately influencing the unit definition.
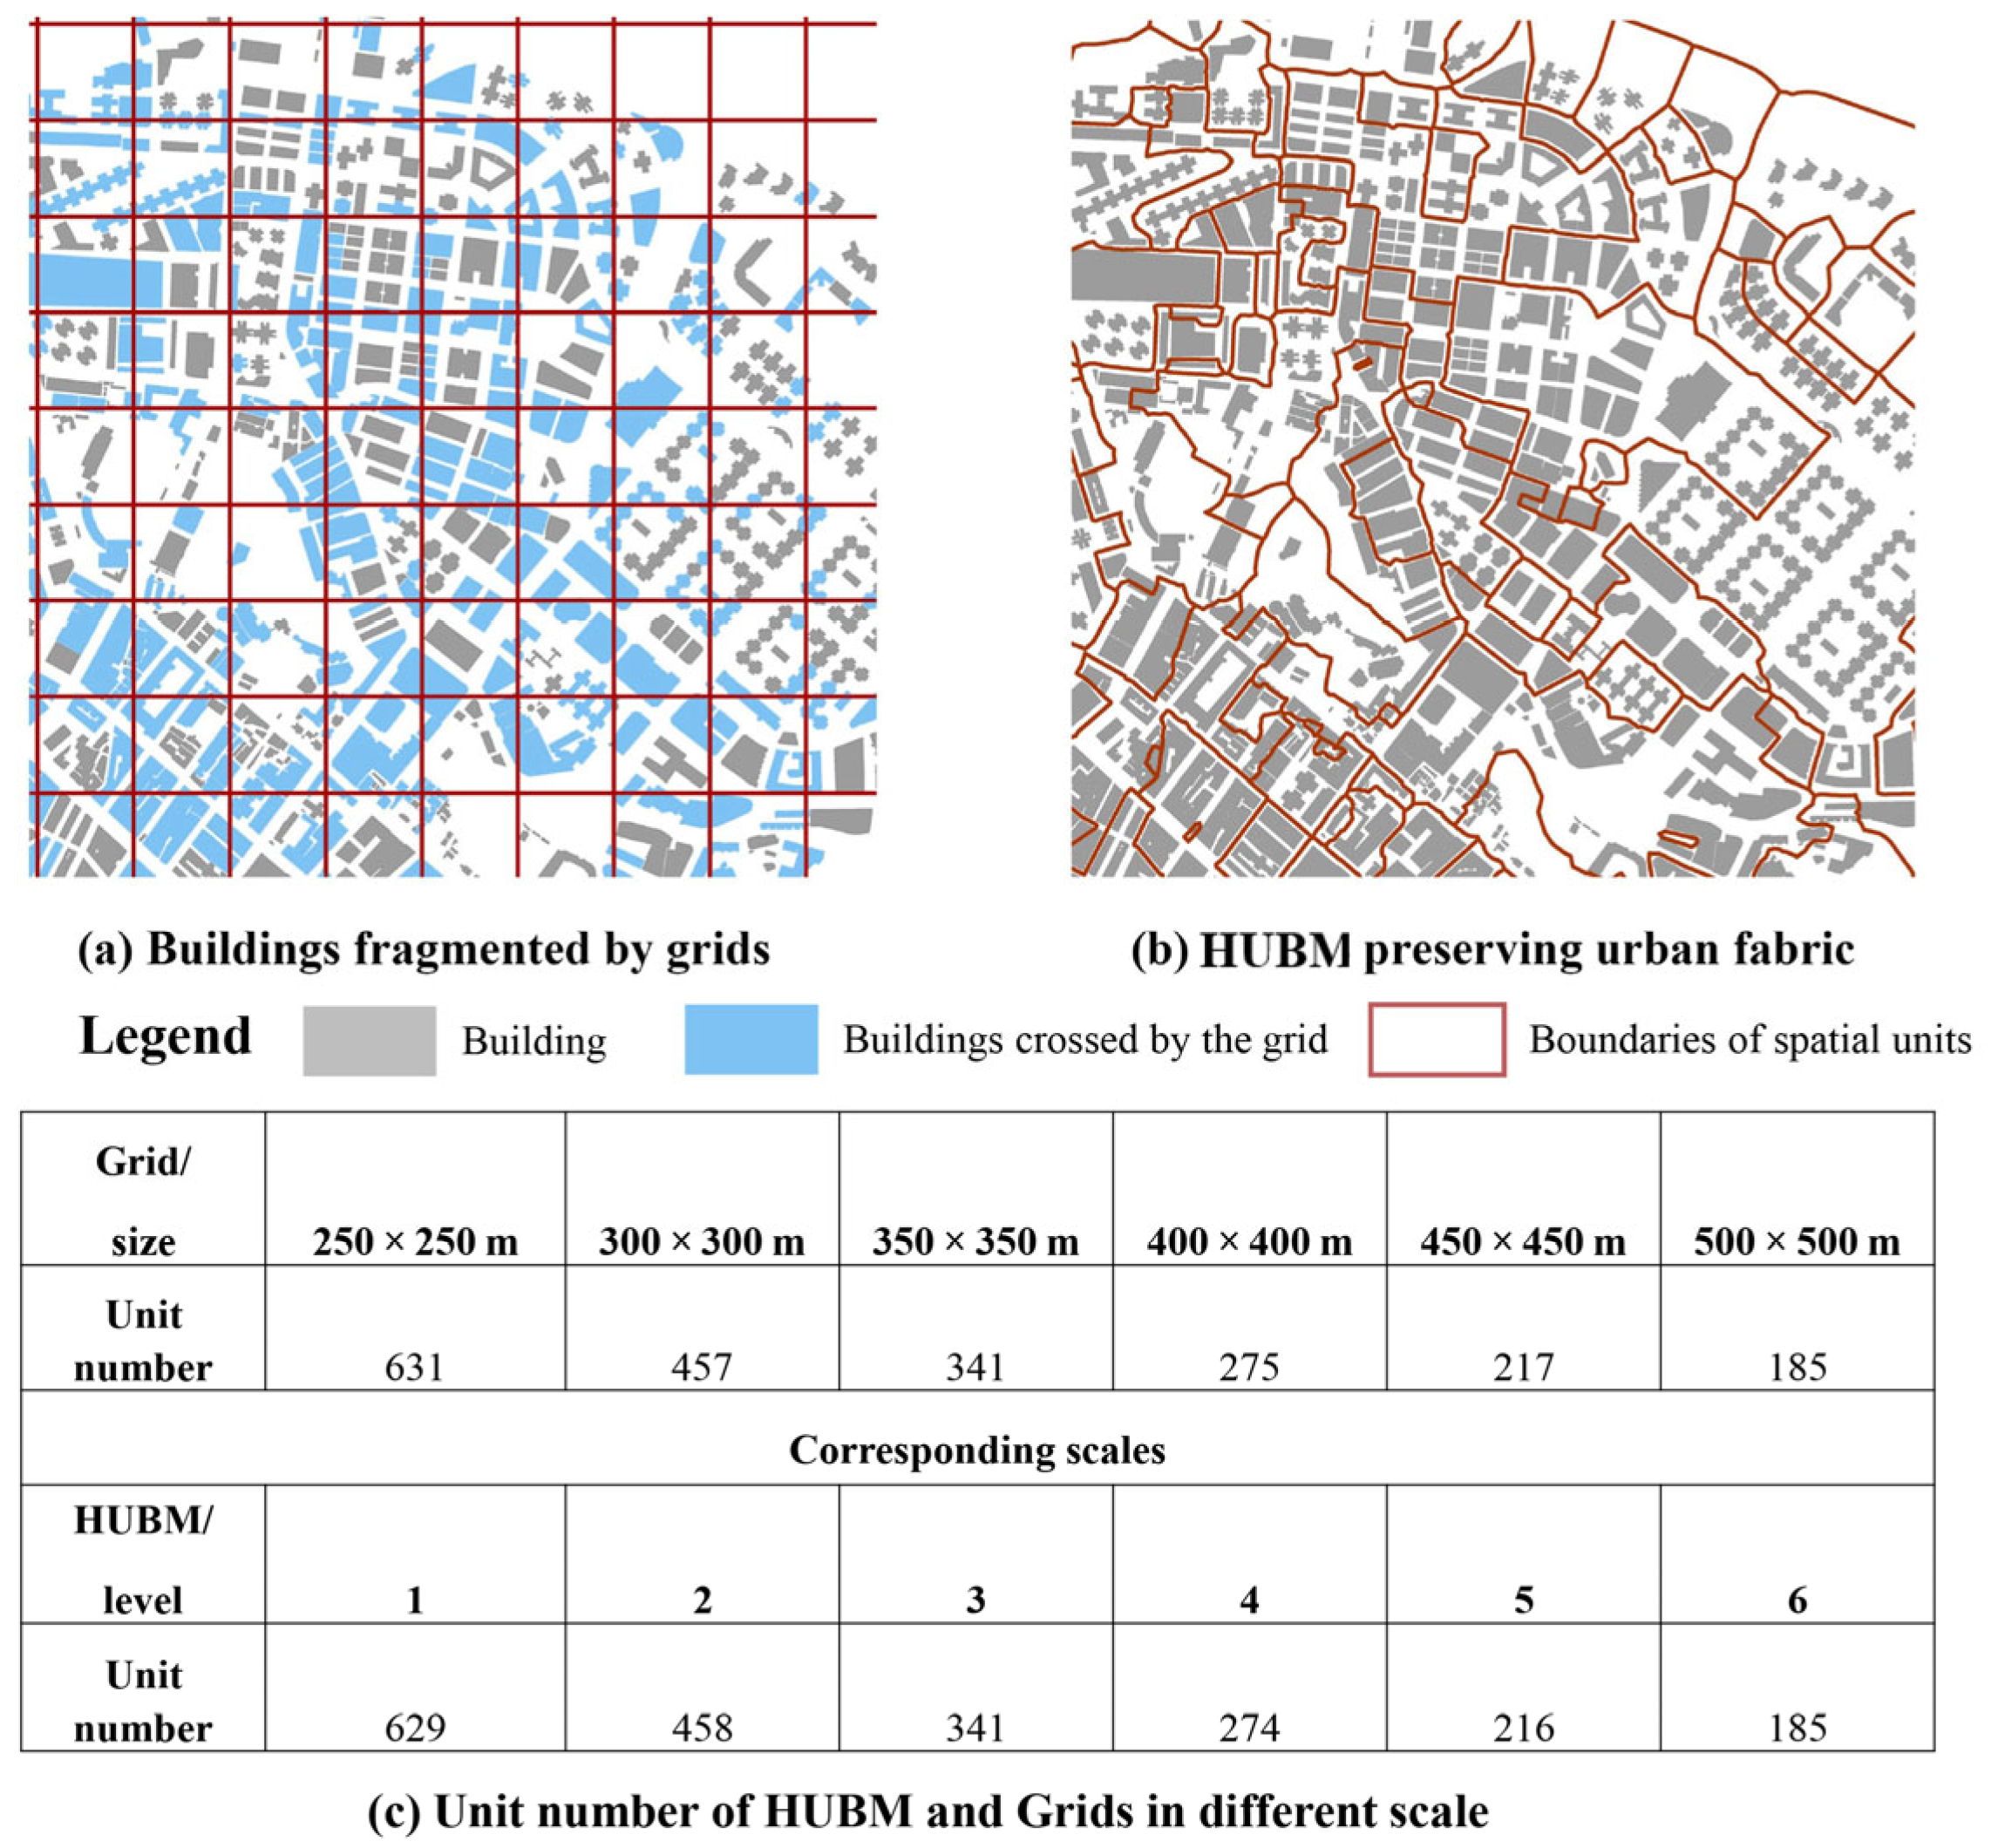
A critical aspect of this study is the comparative analysis across scales. To validate the HUBM method, we established a rigorous benchmarking framework based on the consistency of spatial unit counts. First, we generated six sets of regular grids ranging from 250 × 250 m to 500 × 500 m. We then calculated the total number of units produced by each grid scale (e.g., the 250 m grid produced 631 units).
Subsequently, we generated six corresponding hierarchical levels of HUBM (Levels 1–6) by adjusting the clustering constraints to match these unit counts as closely as possible. As detailed in the table within Figure 4c, HUBM Level 1 (629 units) corresponds to the 250 m grid (631 units), and this correspondence is maintained up to Level 6 and the 500 m grid. This approach ensures that the comparison between the morphological-adaptive units (HUBM) and grid units is statistically robust, as the degrees of freedom (number of spatial units) remain virtually identical at each level. The visual impact of this method is demonstrated in Figure 4. The conventional fixed-size grid cuts through building footprints, causing fragmentation for 434 out of 683 buildings in the sample area (Figure 4a). In contrast, the HUBM method preserves the integrity of each individual building by dynamically aligning boundaries with the urban morphology (Figure 4b). After unit generation, ecosystem service values were mapped, and spatial autocorrelation (Moran’s I) was applied to evaluate performance, demonstrating how HUBM mitigates the Modifiable Areal Unit Problem (MAUP) distortions common in dense urban environments.

2.3. Green Space Classification and Ecosystem Service Value Quantification

2.3.1. Green Space Classification

This study conducted a fine-scale classification of green spaces in Macao and quantified the ecosystem services provided by various green space types. Green spaces in Macao were classified into two categories—natural and artificial—based on land use data, field surveys, and the city’s land reclamation history [42]. The theoretical basis for this classification addresses the limitations of relying solely on land use history, particularly for mature parks on artificial surfaces. The distinction is based on an integrated set of criteria, including: (1) land use origin (reclaimed vs. native ground), (2) management intensity, and (3) vegetation community composition. Natural Green Spaces refer to areas situated on native ground, characterized by low maintenance and self-sustaining vegetation (e.g., hillside forests). Artificial Green Spaces refer to areas created on engineered substrates or reclaimed land, dominated by planted, high-maintenance vegetation (e.g., urban parks, roadside greenery) [43].
To reinforce the ecological relevance of this classification and validate the functional distinction between the two groups, the Normalized Difference Vegetation Index (NDVI) was used as a quantitative ecological indicator. NDVI is a reliable proxy for vegetation vitality and quality [44]. The mean NDVI values were extracted for the Natural and Artificial Green Space units, as defined by the integrated criteria. The results of this classification were cross-checked with historical remediation data to ensure consistency with the developmental history of the green spaces, confirming the ecological validity of the classification framework for subsequent ESV analysis.

2.3.2. Local Ecosystem Service Value (ESV) Quantification

Local ecosystem services refer to benefits provided to buildings immediately adjacent to green spaces, where service provision and beneficiary areas spatially coincide within the same spatial unit. A 300 m threshold, commonly adopted in previous studies [45] and consistent with local planning standards [46], was applied to define areas for these services, corresponding to a 5 min walking distance. Consequently, a 300 m grid was designated as the service area for local ecosystem services, aligning with HUBM Scale 2 and encompassing 458 spatial units. This threshold is particularly applicable to services of gas regulation, climate regulation, environmental purification, and hydrological regulation in Macao. These ecosystem services are crucial for mitigating the negative impacts of intensive urbanization while directly enhancing the quality of life for residents in high-density urban environments. To quantify these services, the study employed the equivalent factor method developed by Xie et al. [47], which facilitates the valuation and assessment of various green space types by capturing the multifaceted functional contributions of urban ecosystems. The calculation formula is as follows:
ESV = S k × V C k
where E S V represents the ecosystem service value. S k is the area of land use type k , and V C k is the ecosystem service value coefficient for land use type k . The equivalent factor coefficients V C k   used for this study were sourced from local and regional research tailored for urban environments [48,49]. The complete table of ecosystem service value equivalent factor coefficients is presented in Table S1 (Ecosystem Service Value Equivalent Coefficients) and Table S2 (Ecosystem Service Value Coefficients per Unit Area for Monetary Valuation) in Supplementary Materials.
A Coefficient Sensitivity (CS) analysis was utilized to examine the sensitivity of the estimated ESV to changes in the Value Coefficients (VC) for each land use type. The CSreflects the elasticity of the ESV estimates relative to changes in VC [50]. The calculation method involves adjusting the VC for each land use type by ±50% to determine the corresponding change in ESV using the following formula:
C S = ( E S V j E S V i ) / E S V i ( V C j k V C i k ) / V C i k
where E S V represents the denotes the estimated ecosystem service value (yuan), and VC denotes the value coefficient (yuan∙hm−2∙a−1). Subscripts i and j represent the initial value and the adjusted value, respectively (with coefficients adjusted to −50% and +50%). Subscript k denotes the land use type. The interpretation of the Coefficient Sensitivity CS value is as follows: If CS > 1, the ESV is considered elastic with respect to the VC changes, indicating that a change in VC results in a proportionally larger change in ESV. Conversely, if CS ≤ 1, the estimated ESV is considered inelastic, confirming the reliability and robustness of the study results against variations in VC.

2.3.3. Accessibility-Based Ecosystem Services (G2SFCA)

Accessibility-based ecosystem services refer to benefits that require some level of travel and are positively associated with the amount of service available at origin points while negatively associated with travel distance. This is particularly relevant to recreational services. These services were evaluated across multiple spatial units using a location-allocation-based Gaussian Two-Step Floating Catchment Area (G2SFCA) method at the building level, enabling a detailed assessment of spatial disparities in access to recreational green spaces across the city.
To ensure the transparency and rigor of the G2SFCA application, the following key parameters and data sources were utilized. The demand points ( i ) were represented by building centroids. The population ( P i ), which defines the magnitude of the service demand, was derived from the 2021 Macao Population Census, which is based on the building unit level. Conversely, the supply points j were defined as the green space units. The service capacity ( S j ) for each green space j was quantified by its esthetic landscape ecosystem service value, specifically calculated based on its area. This method ensures that the quantity of service supplied reflects the ecological contribution of the green space. Crucially, the maximum search radius ( d 0 ) was set to 300 m. This choice is based on the previously defined threshold for local ecosystem services [45,46], corresponding to a standard 5 min walking distance and aligning with Macao’s planning regulations for neighborhood accessibility. The 300 m threshold was consistently maintained, precluding the testing of alternative radii, as the study focused on adhering to the predefined local service area. At the building scale, the demand for ecosystem services is defined by the population of each building. The population data, sourced from the 2021 Macao Population Census, is based on building units. Service supply is represented by green space units, and the service capacity of each unit is determined by its esthetic landscape ecosystem service value (i.e., ecological quality). Once the service demand and supply capacity are established, the accessibility score for each building is calculated, reflecting the weighted proximity between the building and nearby green space units. A Gaussian decay function is applied to account for spatial impedance.
Step 1: Calculating the Supply-to-Demand Ratio ( R j ):
The calculation formula for the ratio of green space provision is as follows:
R j = S j i d i j d o   P i × f d i j
where R j is the ratio of green space provision inside the catchment area of green space j . S j is the service capacity of green space j , represented by the esthetic landscape ecosystem service value. P i is the population of each building unit i . d i j   is the road network distance between location i (demand) and j (supply), d o is the search radius (set to 300 m). f d i j is a Gaussian decay function that considers spatial impedance, and its specific formula is given in Equation (4):
f d i j   = e ( 1 / 2 ) × d i j / d 0 2 e ( 1 / 2 )         1 e ( 1 / 2 ) ,   d i j d 0 0 ,   d i j > d 0
Step 2: Calculating Spatial Accessibility Index ( A i )
For each building demand point i , its spatial accessibility index A i was calculated to reflect its weighted accessibility to all service points. The formula is as follows:
A i = j d i d 0 f d i j R j
where A i is the green space accessibility index for each building i . A larger A i in indicates better accessibility [51]. The final accessibility scores A i calculated at the building demand points were subsequently aggregated to the HUBM scale for spatial analysis and comparison.
The total accessibility index for buildings was calculated to compare the overall accessibility provided by natural and artificial green spaces This calculation was achieved by summing the individual accessibility indices A i of each building across the entire study area, thereby capturing the cumulative accessibility performance of each green space type at the urban scale. The total accessibility index for natural green spaces, A g r e e n   s p a c e s was calculated as:
A g r e e n   s p a c e s = i = 1 N A i , g r e e n   s p a c e s ,
where A g r e e n   s p a c e s is the green space accessibility index for building i and N is the total building count in Macao.

2.4. Ecological Security Pattern Construction and Green Space Resilience Assessment

This study evaluated the contributions of natural and artificial green spaces to ecological security patterns (ESPs) and assessed their resilience under various disturbance scenarios. The construction of ESPs followed the classic “source–corridor–node” framework grounded in landscape ecology theory [52]. Both natural and artificial green spaces were identified as ecological sources, serving as critical habitats and energy nodes supporting ecological processes within the urban system.

2.4.1. Ecological Security Pattern (ESP) Construction

A landscape resistance surface was constructed using multiple spatial indicators—elevation, slope, transportation networks, night-time light intensity, normalized difference vegetation index (NDVI), and land use type—as resistance factors influencing ecological flow. The Minimum Cumulative Resistance (MCR) model was subsequently applied to simulate optimal ecological flow paths, thereby delineating key ecological corridors [53]. The intersections of these corridors were identified as ecological nodes, representing spatial convergence zones that enhance system connectivity and stability [54]. The resistance factors and their corresponding weights used for the ecological security pattern construction are summarized in Table S3 in Supplementary Materials.

2.4.2. Green Space Resilience Assessment

Following ESP construction, the resilience levels (1–5) of natural and artificial green spaces were evaluated using a quantitative classification framework adapted from previous studies [55,56]. The classification of resilience levels adopted the Natural Breaks (Jenks) method, which minimizes intra-class variance and maximizes inter-class differentiation to ensure objective threshold determination. This framework measures the capacity of green spaces to maintain ecosystem service functions under conditions of urbanization, environmental stress, and potential external disturbances.
Method 1: Structural Contribution Resilience
A weighted-sum method was employed to calculate composite resilience scores: the proportion of each ecological component (sources, corridors, nodes) at a given resilience level was multiplied by its corresponding weight, and the results were aggregated to derive the overall resilience index for each green-space type. This approach enabled a comparative assessment of the structural and functional robustness of natural versus artificial green spaces within Macao’s ecological network.
R g r e e n   s p a c e s = k = 1 5 ( P s o u r c e , k × S k + P c o r r i d o r , k × S k + P n o d e , k × S k )
where S k is the value of the k -th resilience level (1–5). P s o u r c e , k , P c o r r i d o r , k , and P n o d e , k represent the proportion of ecological sources, ecological corridors, and ecological nodes within green spaces, respectively, falling within the k -th resilience level relative to the total number of corresponding components across all five resilience levels.
Method 2: External Disturbance Resilience
To fully evaluate the resilience of green spaces, this study assessed their spatial sensitivity to external anthropogenic disturbance sources. The stability of urban ecosystems is highly vulnerable to intense human pressures [57]. Resilience was evaluated based on the spatial relationship between ecological units and key sources of disturbance, recognizing that proximity to high-intensity urban development corresponds to heightened ecosystem vulnerability [56]. The assessment utilized three key proximity indicators: Distance to Land Reclamation Sites, Distance to Densely Urbanized Areas, and Distance to Urban Streets. Distances were calculated using the Euclidean distance tool in GIS based on the centroids of relevant disturbance objects.
The overall resilience ( F ) was quantified using a comprehensive weighted-sum model where a higher index value indicates stronger resistance and recovery capacity against external pressures [55]. The model is defined as follows:
F = i = 1 n W i × F i
where F is the overall ecological resilience index, and F i represents the standardized and inverted value of the disturbance factor i . Inversion is critical, as distance and resilience are negatively correlated (i.e., a greater distance yields a larger F i value). W i denotes the weight of factor i . The weights ( W i ) were determined using the Analytic Hierarchy Process (AHP), a robust method that utilizes expert judgment and established literature to systematically assign relative importance to each factor [58,59,60]. The final factor weights are detailed in Table S4 in Supplementary Materials.

3. Results

3.1. Subsection Ecosystem Service Quantification and Mapping on HUBM Adaptive Spatial Units and Regular Grids

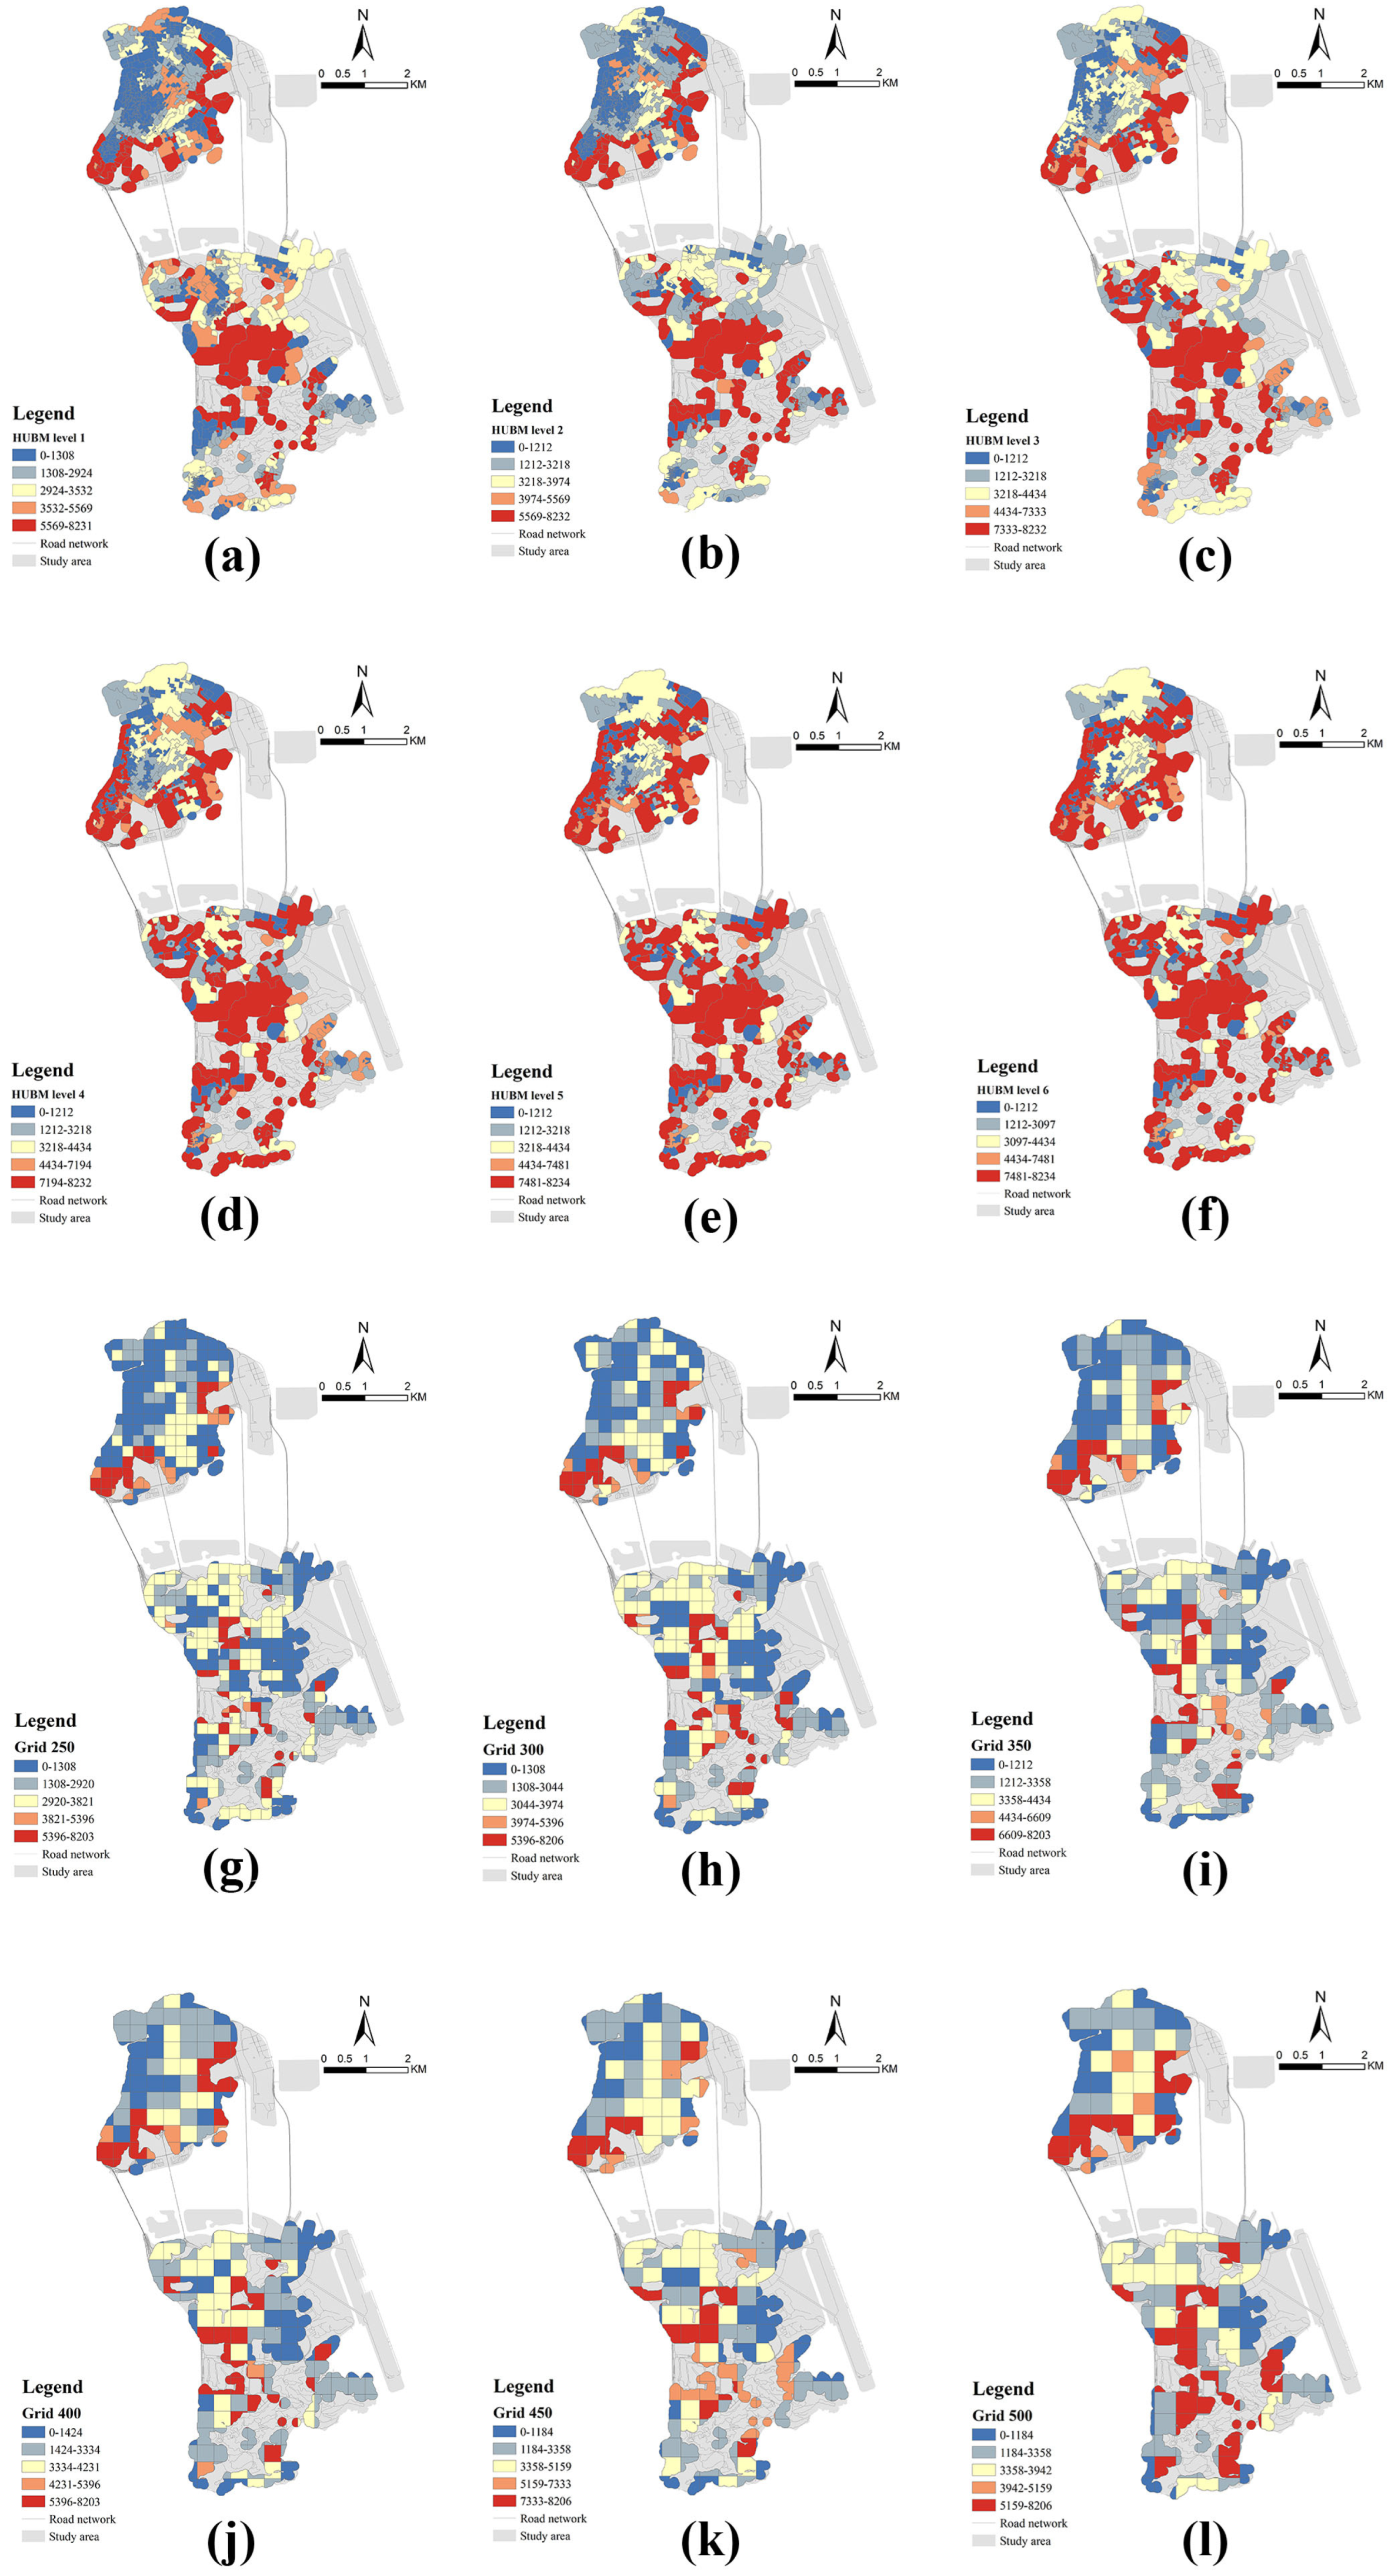
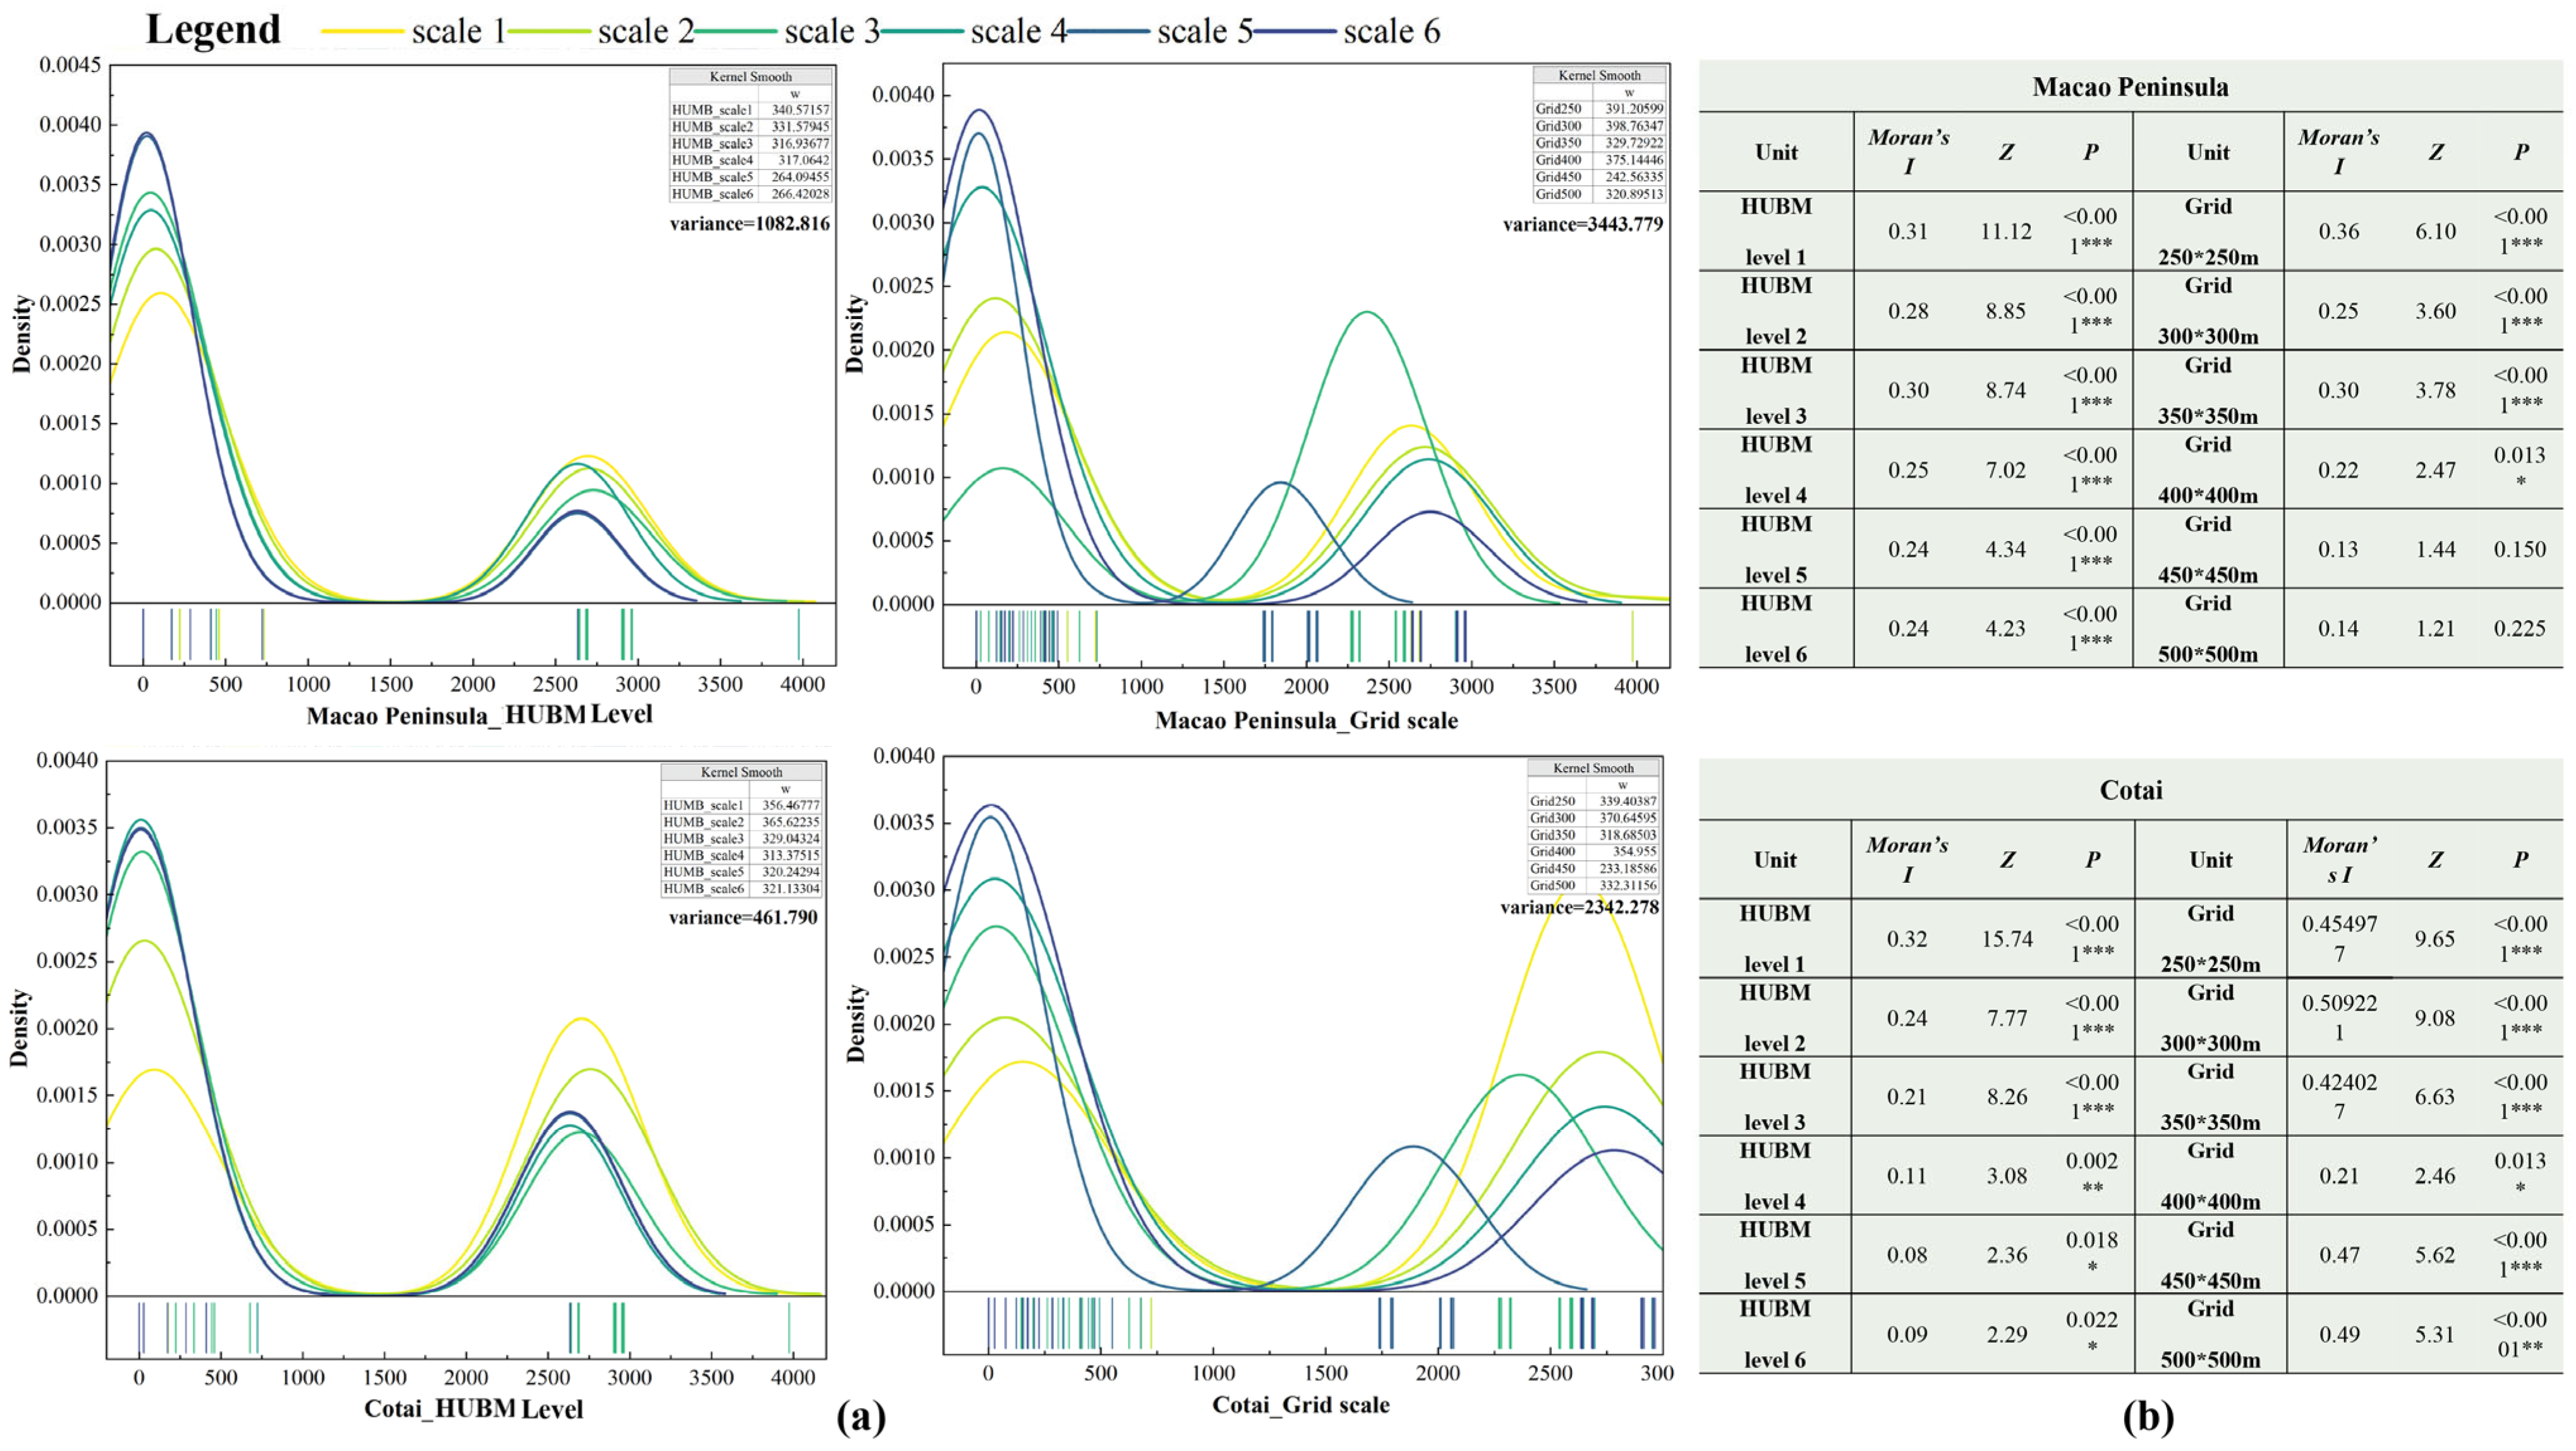
Figure 5 compares the quantification and distribution of ecosystem services derived from two approaches: HUBM adaptive spatial units (Figure 5a–f) and regular grids (Figure 5g–l) across six hierarchical levels and scales. Figure 6a illustrates the kernel density patterns of ecosystem service values, highlighting areas of high concentration. Both methods show sensitivity to scale; however, HUBM consistently generated more stable and coherent spatial patterns across scales. The variability in ecosystem service estimates and spatial distribution was significantly lower under HUBM than under grid-based units. To further substantiate these findings, spatial autocorrelation analysis (Figure 6b) was conducted. In Cotai, Moran’s I remained significant for both methods across all scales. In contrast, on the Macao Peninsula, grid-based Moran’s I values became insignificant when grid size exceeded 450 m (Moran’s I = 0.65, Z = 2.15, p < 0.05), while HUBM maintained statistical significance across all levels (Moran’s I = 0.85, Z = 4.35, p < 0.01). These results confirm that HUBM mitigates distortions induced by the MAUP and preserves spatial clustering patterns in morphologically complex urban environments.

3.2. Spatial Distribution of Ecosystem Services

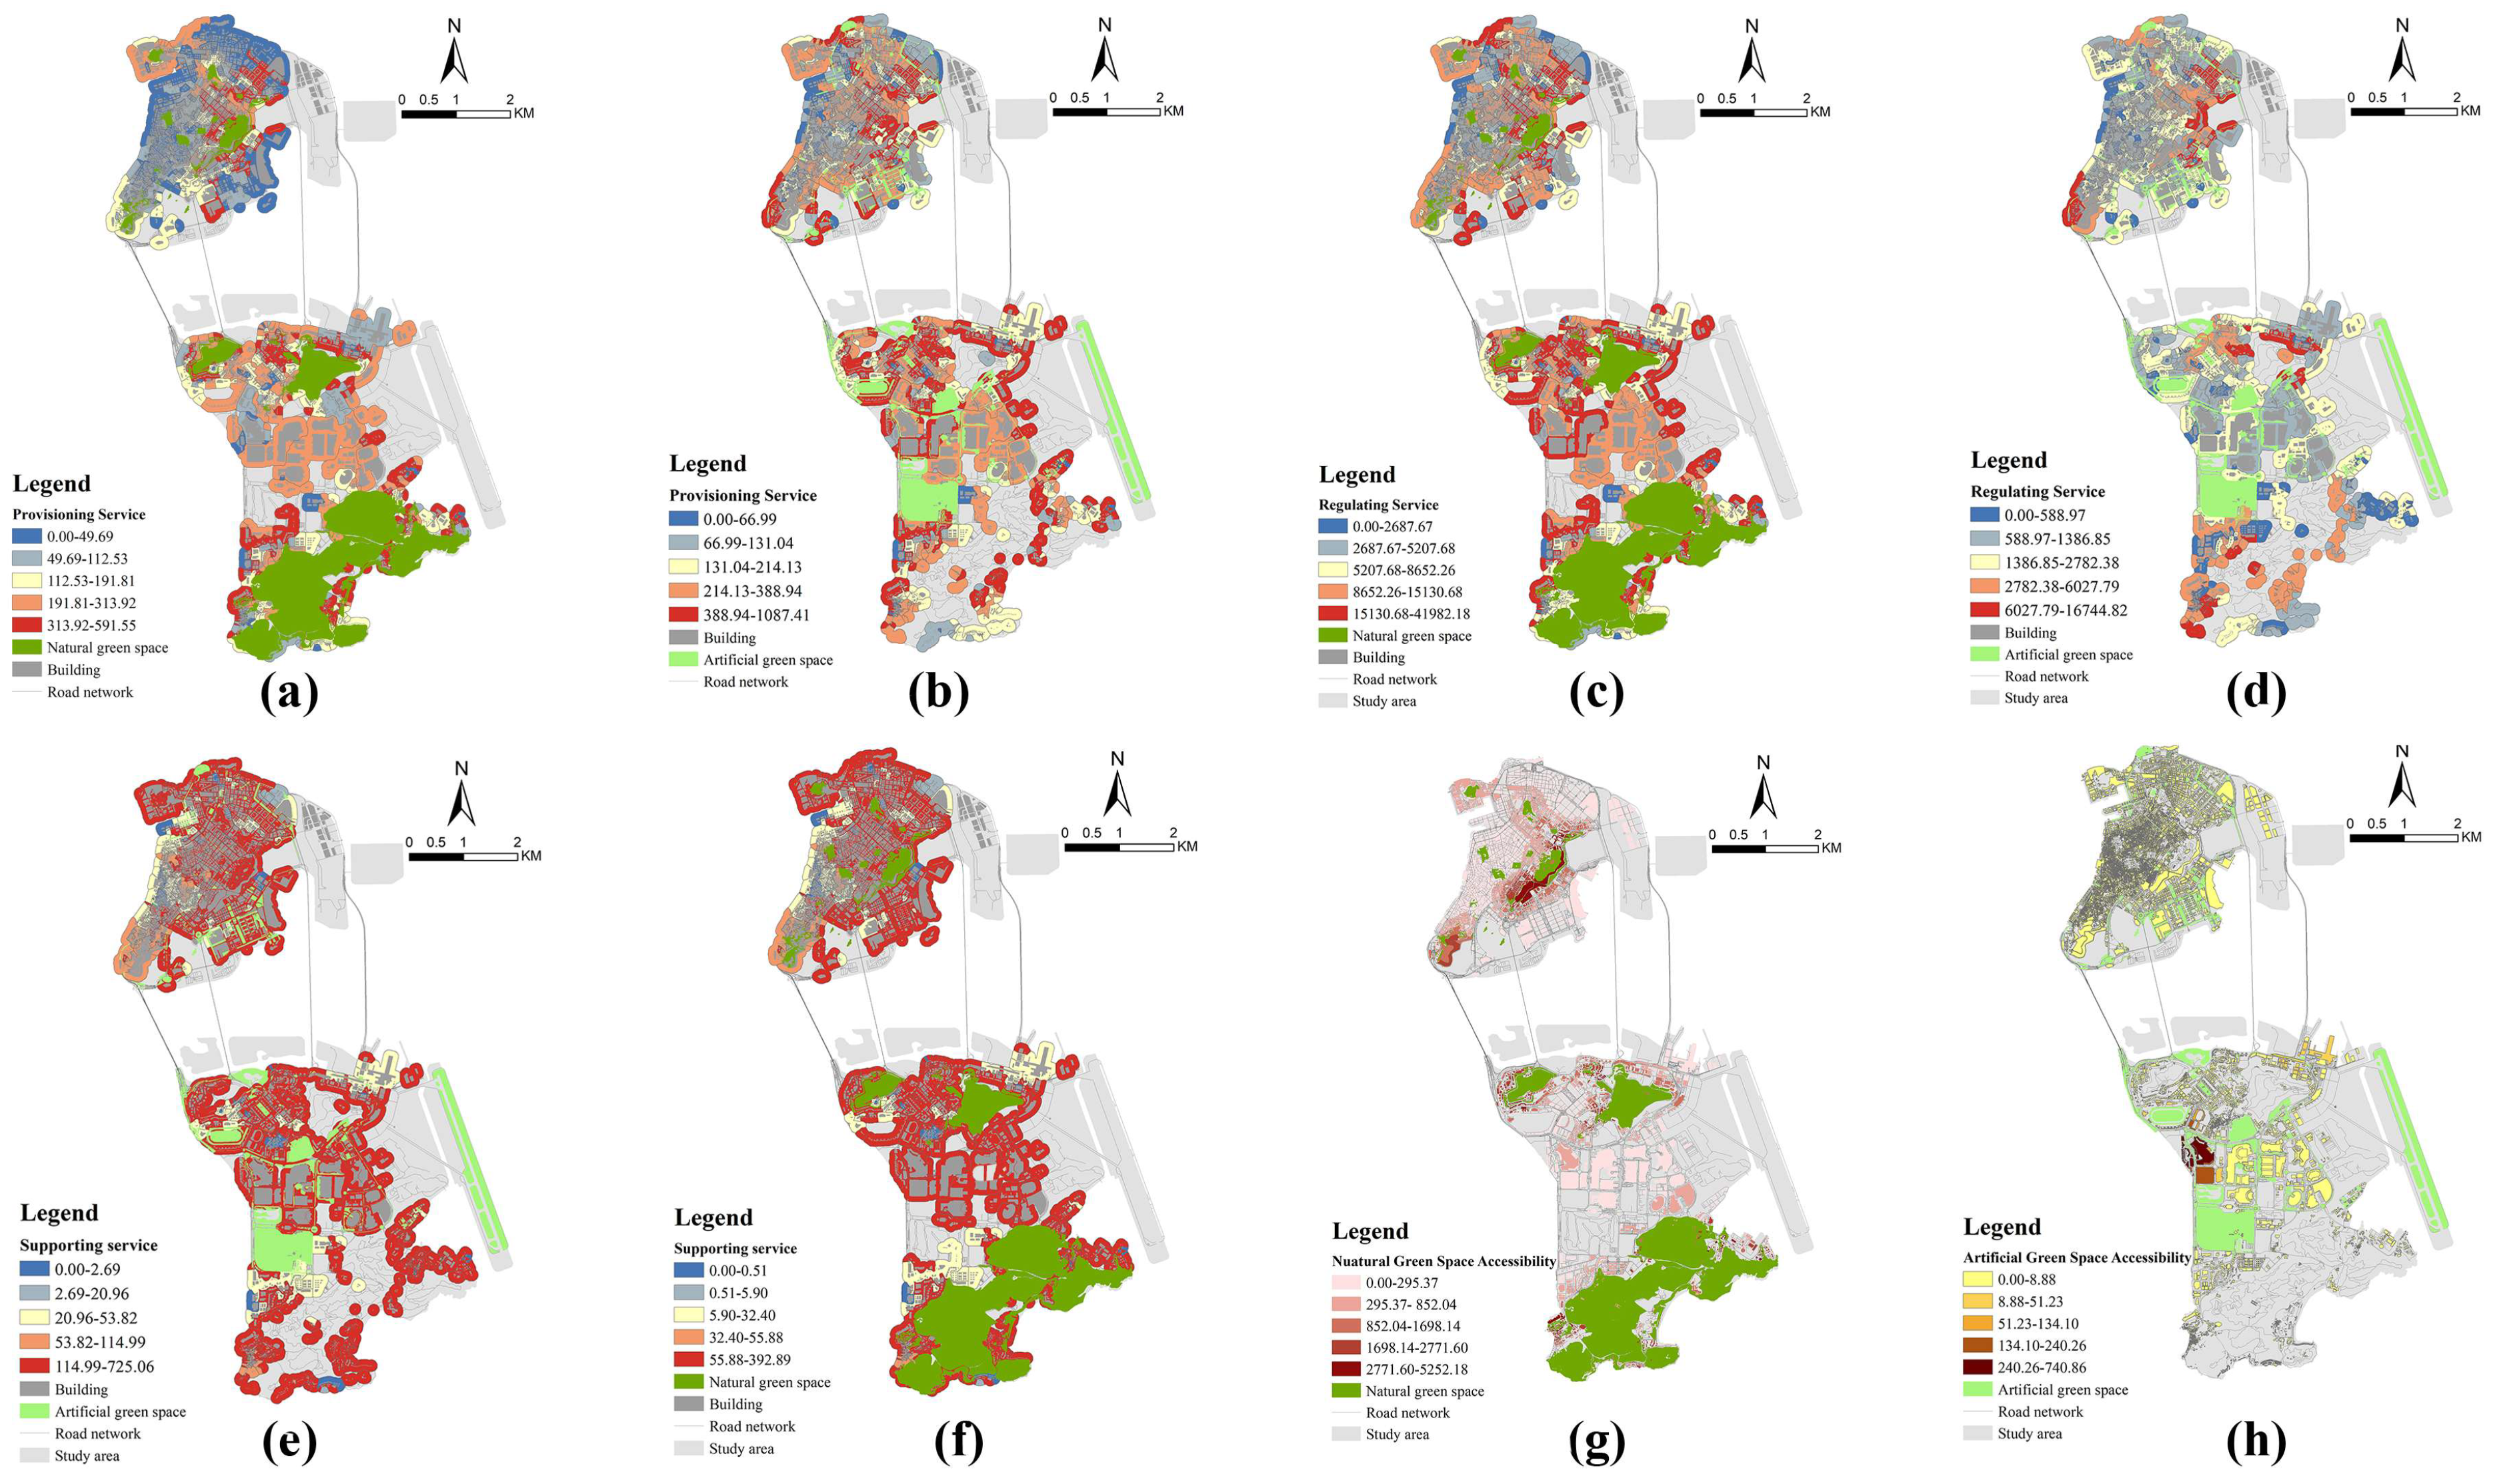
Figure 7 illustrates the spatial distribution of local and accessibility-based ecosystem services across four categories—provisioning, regulating, supporting, and cultural—delivered by natural and artificial green spaces within Macao’s spatial units. Specifically, Figure 7a,b depict provisioning services, Figure 7c,d show regulating services, and Figure 7e,f present supporting and cultural services, Figure 7c,d show regulating services, and Figure 7e,f present supporting services. Figure 7g,h illustrate the accessibility-based cultural services. Table 2 provides a detailed comparative summary. For local services, artificial green spaces contributed the majority of provisioning services, with an estimated value of 737.75 × 10⁸ Yuan (62.17%), compared to 448.89 × 10⁸ Yuan (37.83%) from natural green spaces. In contrast, natural green spaces dominated regulating services, accounting for 28,234.42 × 108 Yuan (82.27%) versus 6082.99 × 108 Yuan (17.73%) from artificial spaces. Supporting services showed the opposite trend: artificial green spaces provided 2039.90 × 108 Yuan (64.87%), while natural green spaces contributed 1104.79 × 108 Yuan (35.13%). Overall, the total local ecosystem service value from natural green spaces amounted to 29,788.10 × 108 Yuan—more than three times higher than the 8860.64 × 108 Yuan provided by artificial green spaces. Accessibility-based cultural services, assessed using the Gaussian Two-Step Floating Catchment Area (G2SFCA) method, revealed a stark contrast in recreational accessibility. Natural green spaces achieved a significantly higher accessibility index (6,279,526.69) compared to artificial green spaces (25,906.48), as shown in Figure 7g,h. These findings underscore the complementary roles of natural and artificial green spaces in high-density urban environments. Natural green spaces provide essential regulating and cultural services at a citywide scale, while artificial green spaces enhance provisioning and supporting services at the neighborhood level.

3.3. Green Spaces in Constructing ESPs and Enhancing Ecological Resilience

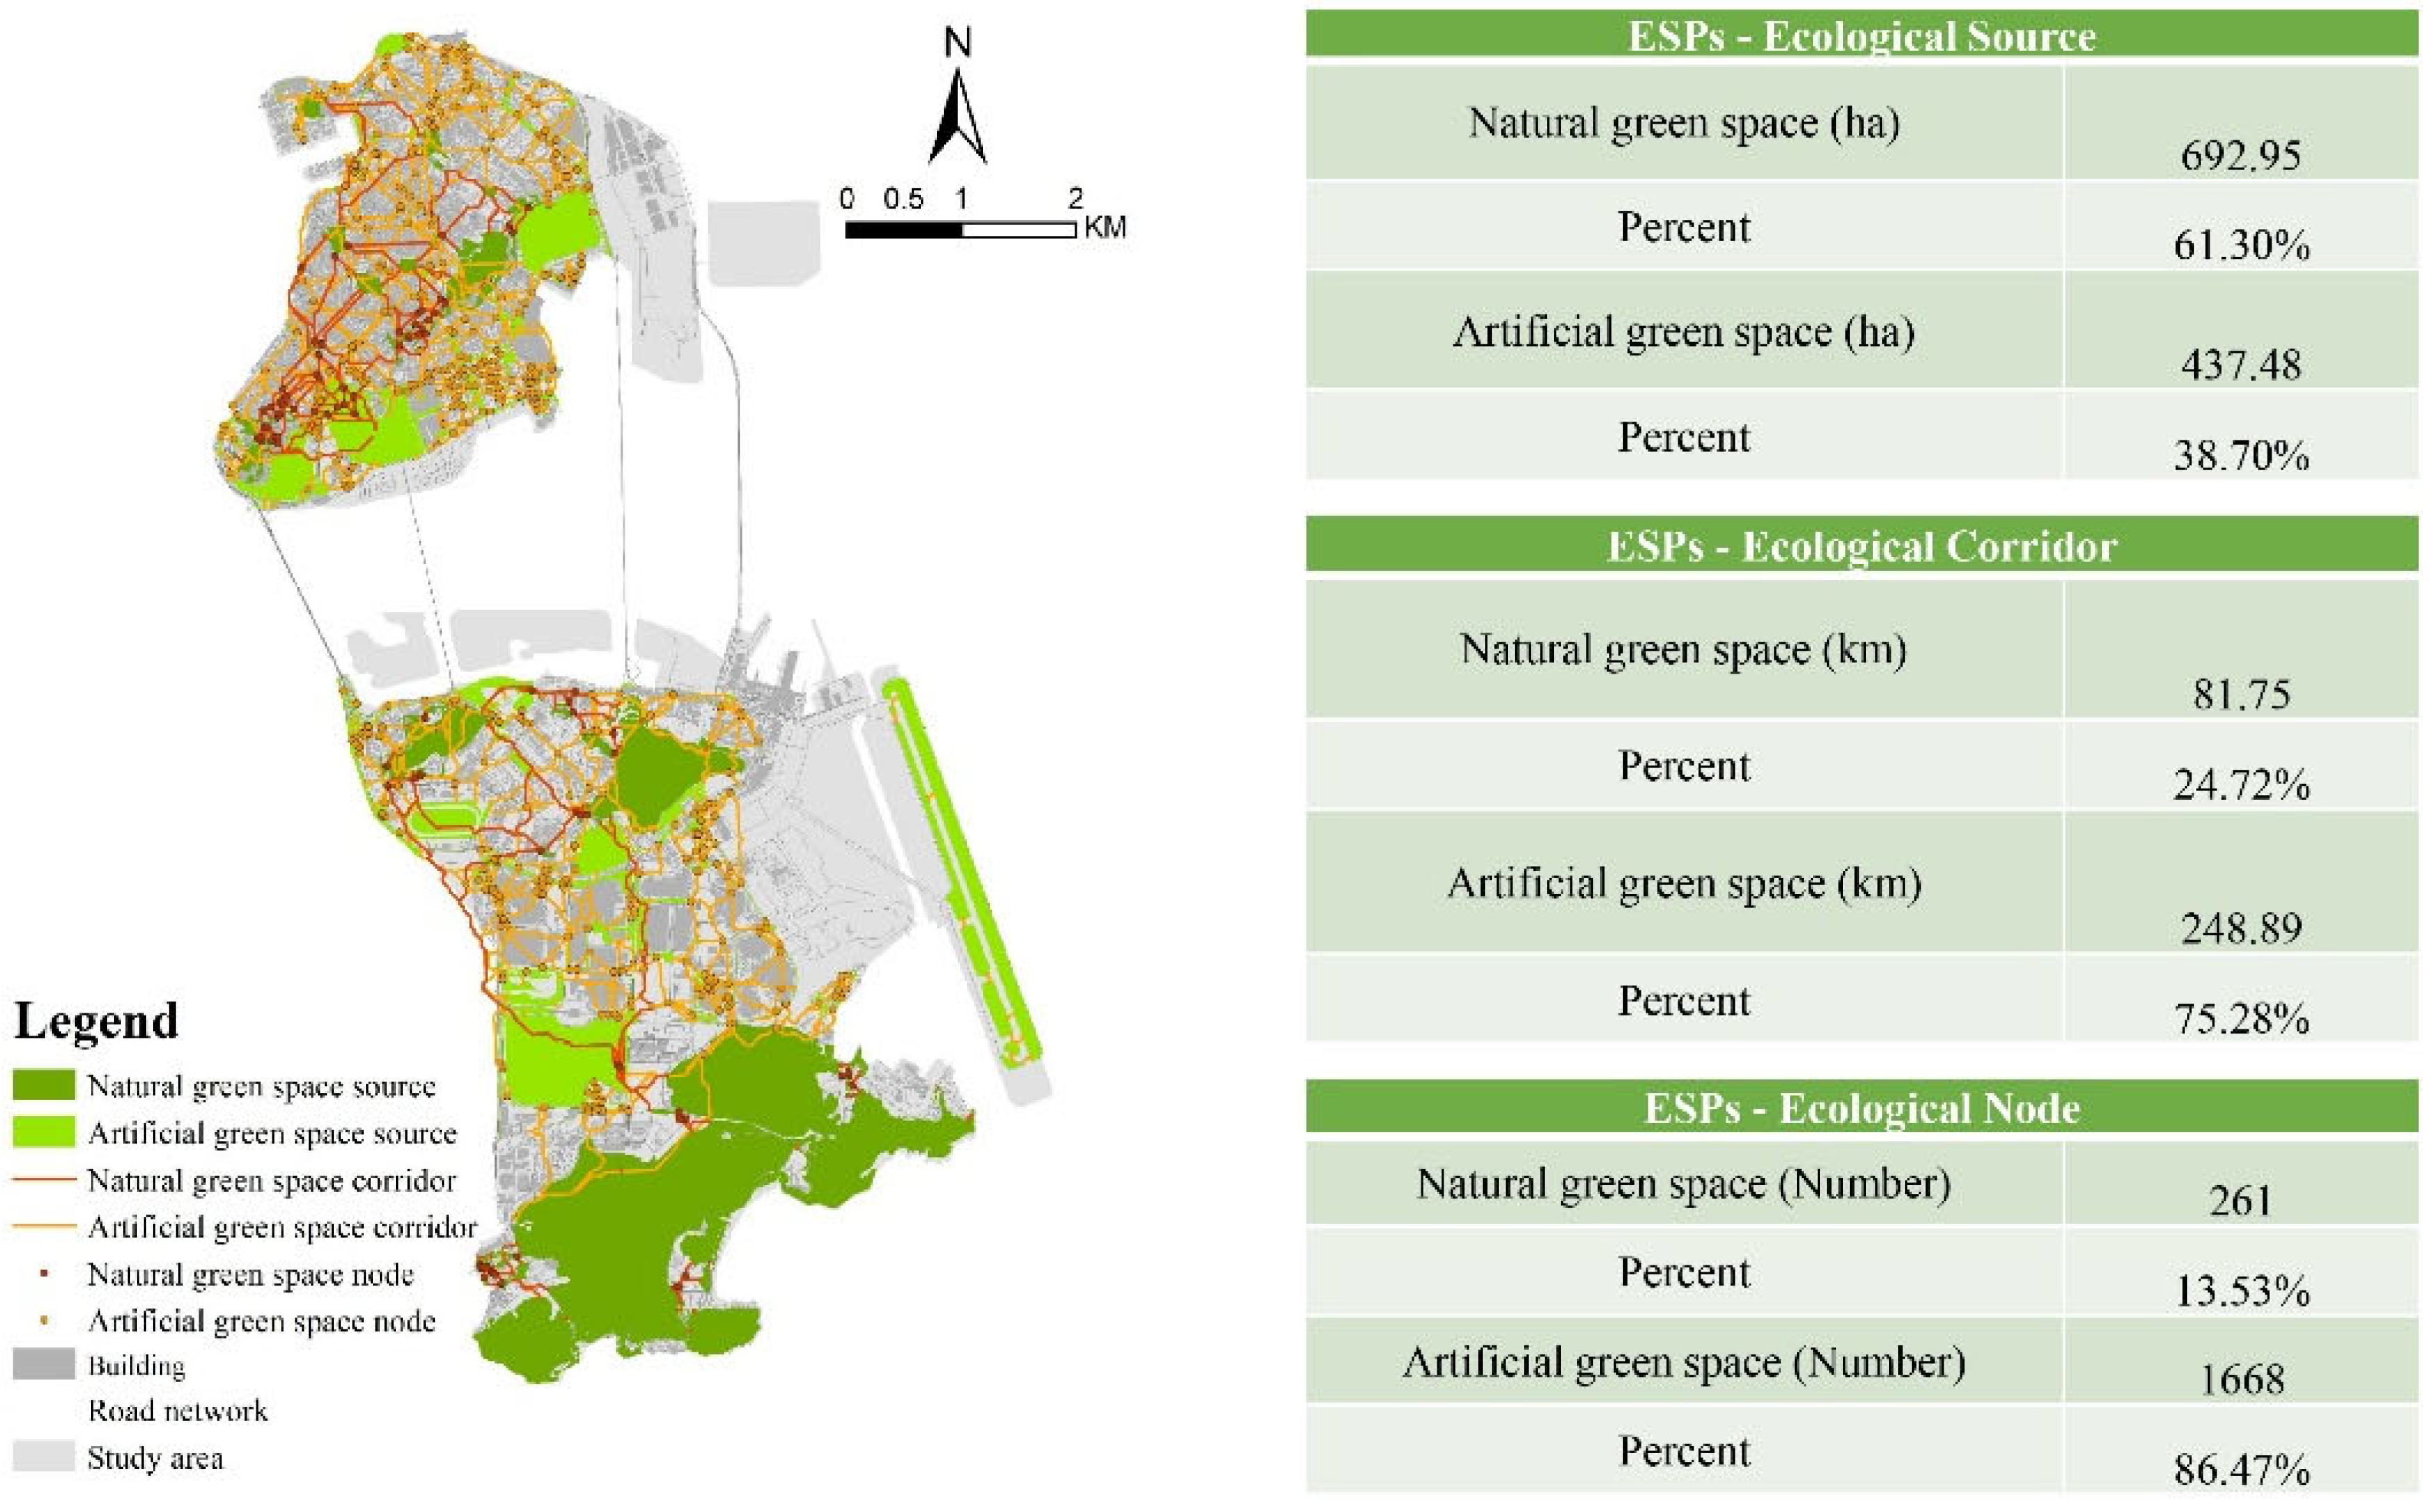
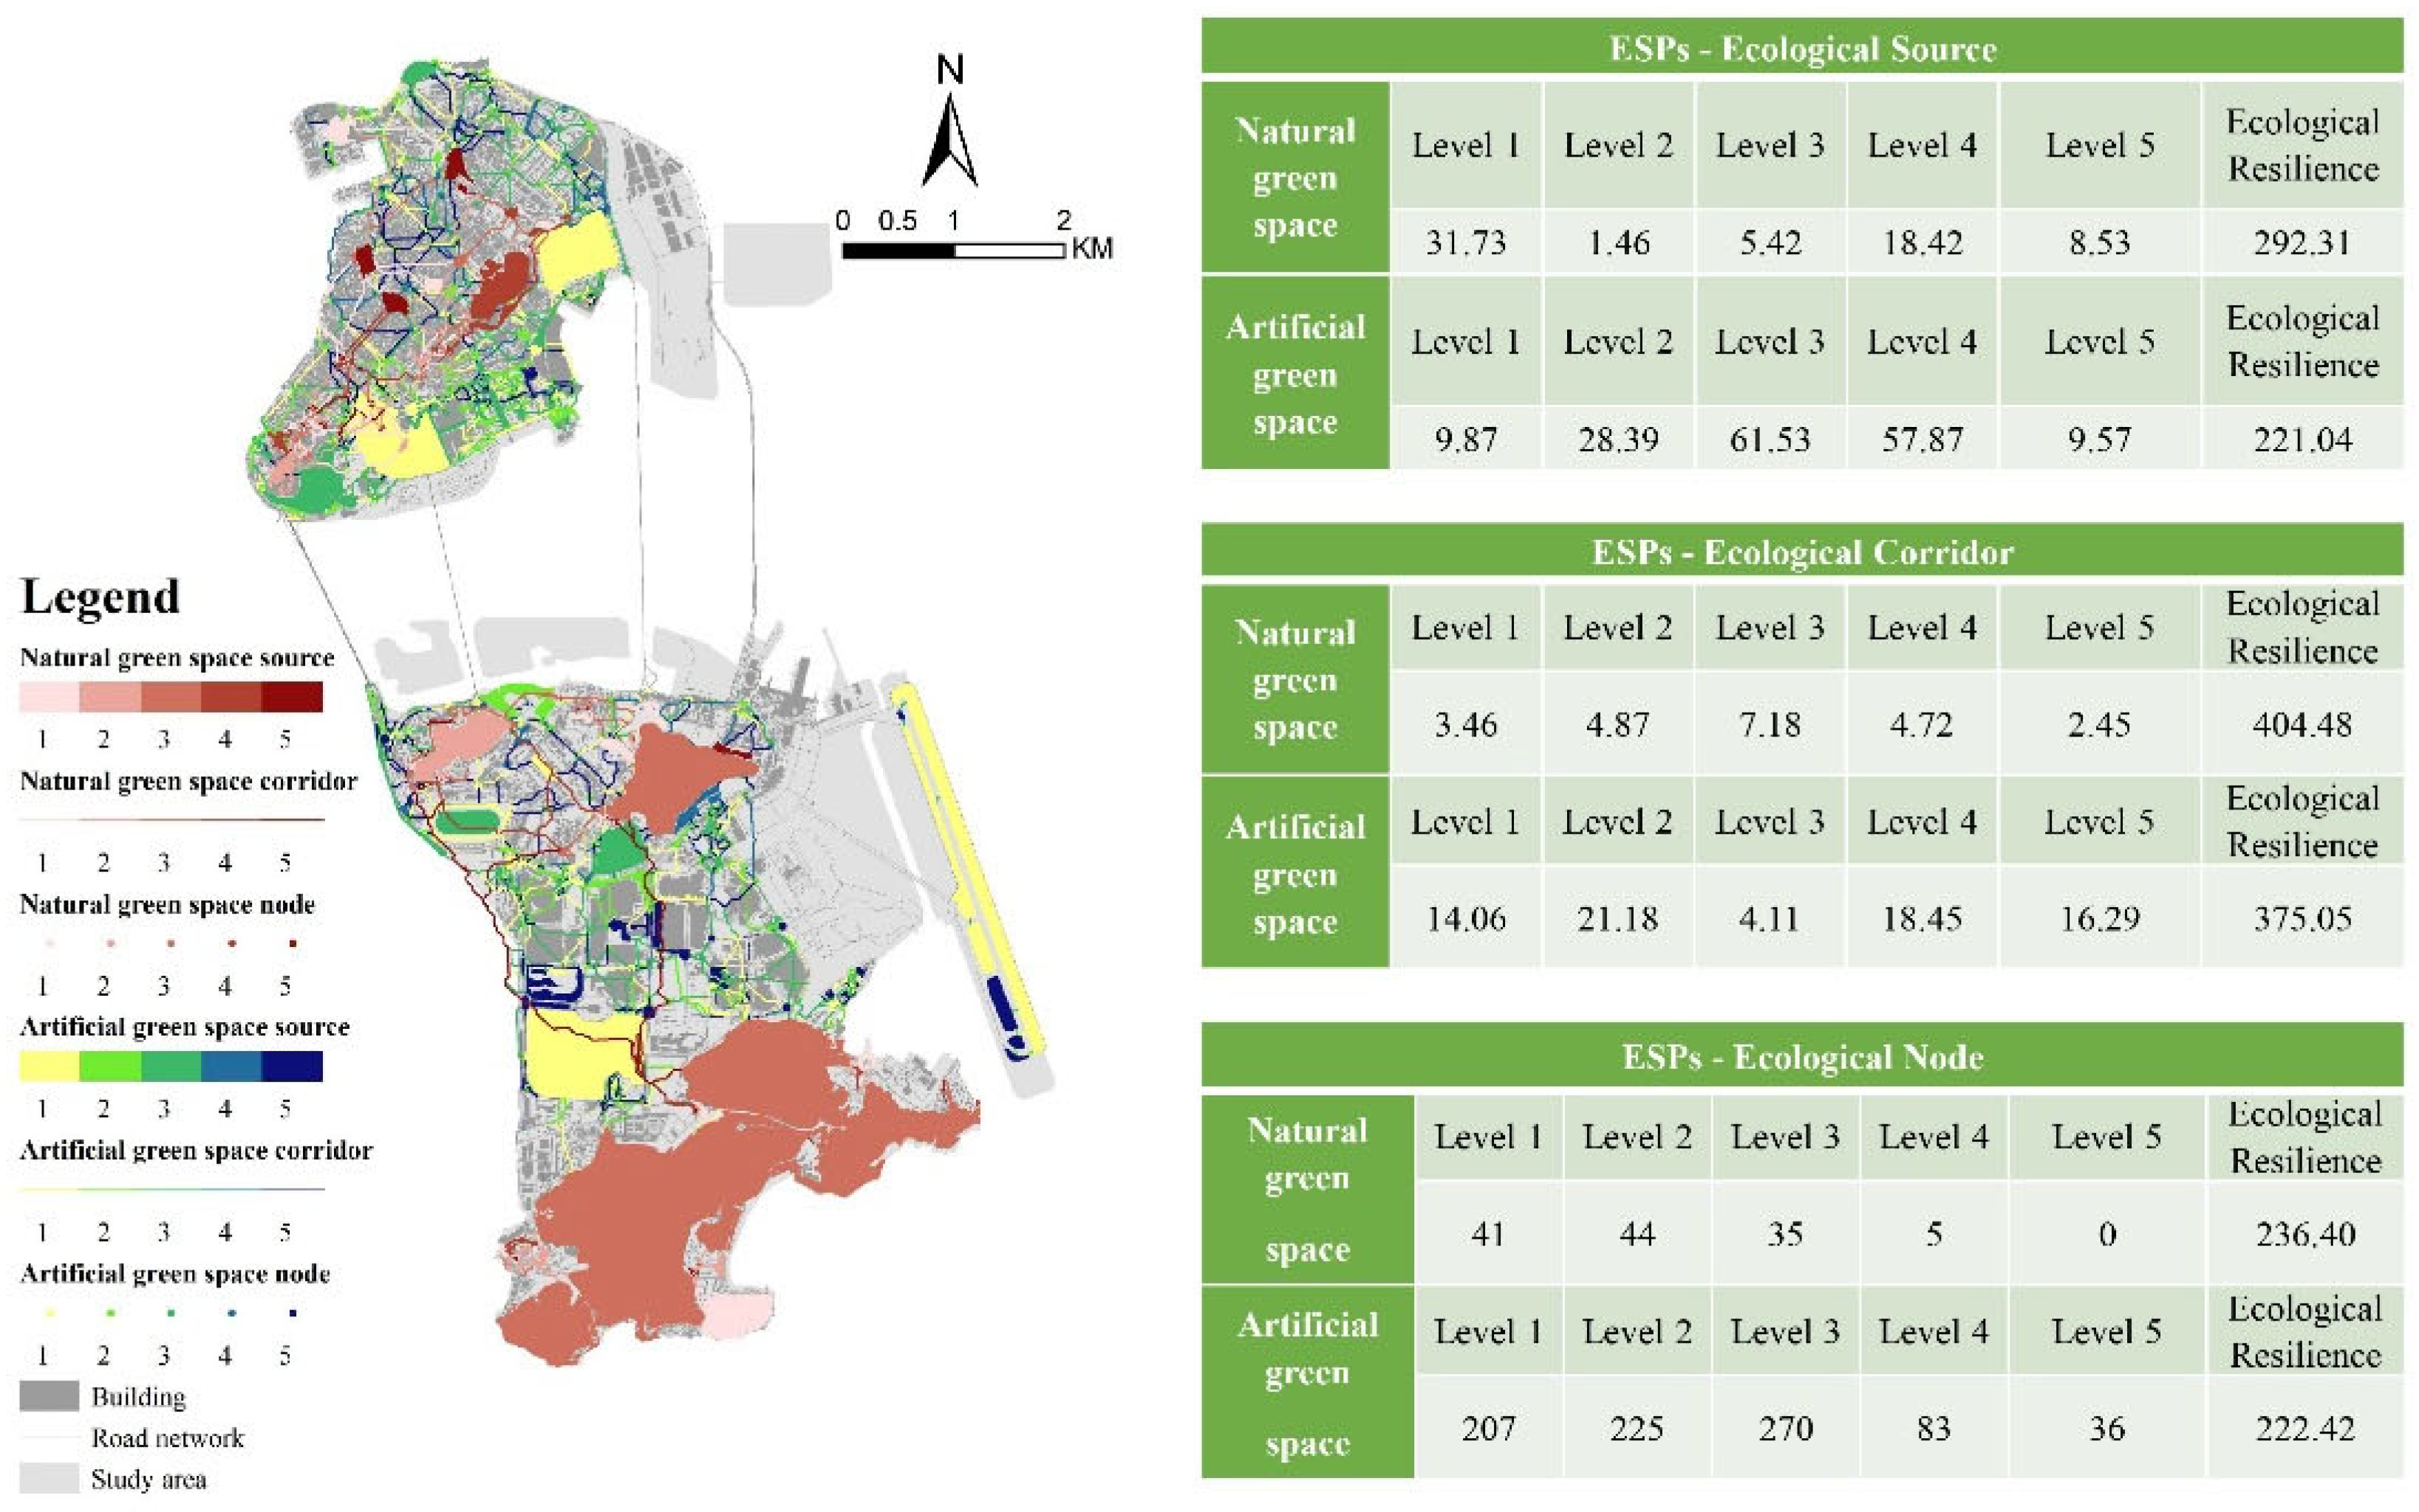
Figure 8 illustrates the distinct roles of natural and artificial green spaces in shaping ecological security patterns (ESPs) in Macao. Natural green spaces cover 692.95 ha, representing 61.30% of the total patch area, while artificial green spaces span 437.48 ha (38.70%). In terms of ecological corridors, artificial green spaces dominate, contributing 248.89 km (75.28%) of the total corridor length, compared to 81.75 km (24.72%) from natural green spaces. Similarly, artificial green spaces provide the majority of ecological nodes (1668 nodes, 86.47%), whereas natural green spaces account for 261 nodes (13.53%). The resilience evaluation, presented in Figure 9, reveals that natural green spaces consistently exhibit higher resilience scores across all components. For ecological sources, natural green spaces achieved an overall resilience score of 292.31, compared to 221.04 for artificial green spaces. For ecological corridors, the scores were 404.48 and 375.05, respectively. Overall resilience followed the same pattern, with natural green spaces scoring 236.40, compared to 222.42 for artificial green spaces.

4. Discussion

4.1. Comparing HUBM Adaptive Spatial Units with Regular Grids for Ecosystem Service Assessment and Mapping

The findings demonstrate that using HUBM as the spatial analysis unit yields more stable and consistent results for ecosystem service quantification and spatial distribution than conventional grid-based methods, particularly in densely populated and morphologically complex urban environments. This outcome aligns with previous research emphasizing the spatial heterogeneity of ecosystem services [60] while advancing the discussion by showing that HUBM effectively addresses the limitations of fixed-size grids in capturing the intricate geometry of urban morphology. Kernel density and spatial autocorrelation analyses confirm that HUBM mitigates inconsistencies inherent in regular and fixed-size grids, which often fragment urban features into arbitrary units. In densely built-up areas such as the Macao Peninsula—characterized by irregular block shapes and clustered buildings—HUBM preserves spatial continuity and connectivity, allowing for a more accurate representation of ecosystem service patterns. The results in Figure 6 provide statistical evidence supporting these claims. Figure 6a shows that HUBM maintains a more continuous and consistent spatial distribution of ecosystem services compared to regular grids, which often lead to fragmentation of urban features into arbitrary units. Additionally, Figure 6b presents the Moran’s I values, demonstrating stronger spatial clustering and higher consistency in HUBM-generated maps. These results confirm that HUBM more effectively captures the true spatial relationships of ecosystem services, overcoming the fragmentation and distortion issues inherent in regular grid-based methods.
The superiority of HUBM in high-density urban contexts arises from its ability to partition urban landscapes into hierarchically meaningful morphological units, rather than relying on uniformly sized cells. By respecting the inherent spatial organization of cities—such as blocks and parcels that reflect ownership and management structures [61]—HUBM mitigates the discontinuities and zoning effects introduced by conventional grid-based approaches. In the case of Macao, where green spaces are interspersed within dense built-up areas [62], HUBM preserved critical connectivity metrics that were obscured under grid-based methods. These findings underscore the importance of aligning ecosystem service modeling with the structural and morphological complexity of urban systems. Analyses conducted using the dynamically adjusted spatial units of HUBM contribute to the growing body of research calling for spatially explicit models of coupled human–environment systems that better capture urban socio-ecological interactions [63]. Previous studies relying on regular grids in ecosystem service assessments have frequently reported spatial instability and modifiable areal unit problem (MAUP) biases, resulting from the oversimplification of urban geometry [64].
The results of this study demonstrate that HUBM effectively mitigates MAUP in ecosystem service research by hierarchically partitioning urban landscapes into meaningful units based on actual building configurations and population distributions. This computational framework preserves the functional continuity of ecosystem service provision while minimizing artificial fragmentation. From a practical perspective, HUBM-derived ecosystem service maps enable planners to identify service hotspots and deficits with high precision, supporting targeted interventions such as green-space investment [65], ecological compensation [66], and land use optimization [67]. By integrating HUBM into urban decision-support systems, planners and policymakers can improve the accuracy, equity, and spatial sensitivity of ecosystem service assessments, ultimately informing more sustainable and resilient urban development strategies. By integrating HUBM into urban decision-support systems, planners and policymakers can improve the accuracy, equity, and spatial sensitivity of ecosystem service assessments, ultimately contributing to more sustainable and resilient urban development strategies.

4.2. Ecosystem Service Flow in Consideration of Spatial Relationships

The results reveal distinct yet complementary contributions of natural and artificial green spaces to urban ecosystem services, demonstrating that their performance is highly context- and type-dependent. This relational perspective challenges the traditional monolithic view of ecosystem services, showing that ecosystem service flows—from provision to demand—are shaped by spatial configuration and functional characteristics in high-density urban environments. Despite their limited spatial coverage, natural green spaces provide substantial total ecosystem service values, particularly in regulating functions such as air-quality improvement, flood mitigation, and urban heat-island reduction. These services correspond to the intrinsic ecological processes of natural systems and are indispensable for maintaining environmental stability and human well-being [68]. This dominance underscores the irreplaceable role of natural systems in sustaining ecological resilience within compact cities. In contrast, artificial green spaces, although smaller and more fragmented, compensate for land scarcity by delivering critical provisioning and supporting services at localized scales. This pattern reflects global urban trends, where natural systems primarily supply regulating services while artificial green spaces address frequent, human-centric needs—a phenomenon observed in compact metropolises such as Singapore and Hong Kong [69,70]. The building-level analysis presented in this study introduces a novel granularity, revealing intra-urban inequities in green-space benefits that are often obscured in aggregated analyses. Notably, accessibility to recreational services—measured using the G2SFCA method—was significantly higher for natural green spaces, reflecting their larger capacity to accommodate users. This disparity highlights the trade-offs between ecological value and urban accessibility [71].
This study challenges conventional planning paradigms and underscores the necessity of integrated frameworks that optimize synergies across multiple ecosystem services. For example, strategically pairing artificial green spaces with natural systems could simultaneously enhance ecological resilience and social well-being. Accessibility metrics further expose spatial inequities: residential blocks adjacent to natural green spaces disproportionately benefit from regulating services, whereas densely populated central areas rely on fragmented artificial spaces. This pattern resonates with critiques of urban green-space distribution, which often emphasize ecological efficiency over social equity, leading to uneven accessibility and benefits [72]. These findings suggest that a balanced integration of natural and artificial green spaces—guided by location–allocation optimization models—is essential for addressing spatial constraints in high-density cities. Strategically planning small, multifunctional green spaces near residential clusters can meet increasing recreational demands while reinforcing ecological connectivity and urban resilience.

4.3. Natural and Artificial Green Spaces in Constructing Ecological Security Patterns and Enhancing Ecological Resilience

The analysis of ecological security patterns (ESPs) and resilience further underscores the complementary roles of natural and artificial green spaces in high-density urban environments. Natural green spaces provide the foundational ecological framework (61.30% of patch area) while artificial green spaces serve as supplementary connectors, dominating the corridor length (75.28%) and node density (86.47%). The resilience evaluation confirms that natural green spaces consistently achieve higher resilience scores across the network components (e.g., Sources: 292.31 vs. 221.04), confirming their superior capacity to buffer against environmental stressors such as climate change, flooding, and urban heat islands. Therefore, effective planning must adopt a balanced, integrated strategy: prioritize the preservation and expansion of natural green spaces to safeguard biodiversity and enhance long-term ecological stability, while strategically designing artificial green spaces near residential clusters to enhance recreational equity and reinforce continuous ecological corridors. The robust methodological framework proposed in this study—combining the HUBM adaptive unit with rigorous statistical and sensitivity analyses—provides a computational tool for optimizing such multi-functional green infrastructure planning in dense urban environments.

4.4. Social Inequalities in Ecosystem Service Accessibility

While previous sections have discussed spatial disparities in the distribution and flow of ecosystem services, it is crucial to also consider the social inequalities inherent in these distributions, particularly in high-density urban contexts. Inequalities in access to both natural and artificial green spaces are often exacerbated by socio-economic factors such as income, housing type, and social marginalization. Lower-income and marginalized groups often face barriers to accessing high-quality green spaces, limiting their ability to benefit from regulating and cultural services such as air-quality improvement and recreational opportunities [73,74]. In urban environments like Macao, natural green spaces, which provide critical services such as flood mitigation and climate regulation, tend to be concentrated in wealthier neighborhoods, leaving less affluent areas with fragmented or lower-quality artificial green spaces [75,76]. These artificial spaces, while prevalent in densely populated areas, often fail to provide the same level of ecological and recreational services, exacerbating inequalities, especially in economically disadvantaged regions [77].
These spatial and social inequities highlight the need for more equitable urban planning, ensuring that all residents, regardless of socio-economic status, can benefit from the full range of ecosystem services provided by both natural and artificial green spaces. Policymakers should prioritize improving accessibility to green spaces in underserved areas, utilizing tools like the Gaussian Two-Step Floating Catchment Area (G2SFCA) method to identify and address accessibility gaps. By doing so, urban planners can help ensure that all residents have equitable access to the benefits provided by green spaces, thereby fostering greater social and environmental equity.

5. Conclusions and Limitations

This study found that HUBM generates more accurate ecosystem service distributions, preserves spatial clustering patterns, and provides more reliable ecosystem service values, which is critical in morphologically complex urban environments. Using Macao as a case study, the framework employs the Homogeneous Unit of Building Morphology (HUBM) as an adaptive spatial unit, effectively mitigating the Modifiable Areal Unit Problem (MAUP) and outperforming conventional grid-based methods in stability and precision. A key innovation lies in integrating ES_local and ES_accessbility flows to capture the spatial dynamics of ecosystem service delivery, while a comparative analysis of natural and artificial green spaces reveals their distinct yet complementary roles: natural green spaces provide essential regulating and cultural services as core ecological patches, whereas artificial green spaces deliver provisioning and supporting services, functioning as connectors and nodes that enhance ecological networks. Spatially, artificial green spaces offer localized benefits to adjacent neighborhoods, while natural green spaces ensure citywide recreational access and exhibit greater resilience under environmental stressors.
These findings offer actionable insights for urban planning strategies that integrate diverse green space types. Policymakers should prioritize the preservation and expansion of natural green spaces, especially in underprivileged neighborhoods, to enhance ecosystem services such as climate regulation and flood mitigation. Additionally, artificial green spaces should be designed to complement natural spaces by improving accessibility and providing essential provisioning and supporting services, particularly in densely built areas. Social equity considerations should be central to urban planning to ensure that green space investments benefit all urban residents, including marginalized and low-income communities. Integrating computational tools such as HUBM, location-allocation models, and connectivity simulations can help optimize both ecological performance and social equity, ensuring that green space investments benefit all urban residents, regardless of socio-economic status.
Despite these contributions, the study has several limitations. The single-city scope restricts the generalizability of the findings and highlights the need for replication in other high-density urban contexts. The static analysis calls for future research that incorporates longitudinal data, time-series remote sensing, and scenario-based simulations to capture dynamic changes in green space functions. Additionally, while the focus on spatial and biophysical metrics provides valuable insights, future research should incorporate social surveys and participatory methods to capture residents’ perceptions and cultural values, especially from marginalized communities. Addressing these limitations will advance computational frameworks for ecosystem service modeling and strengthen their application in adaptive, resilience-oriented urban planning that prioritizes social equity.

Supplementary Materials

The following supporting information can be downloaded at: https://www.mdpi.com/article/10.3390/land15010006/s1.

Author Contributions

Conceptualization, L.Z.; methodology, H.Z., J.C. and L.Z.; formal analysis, L.Z.; investigation, J.C. and L.Z.; data curation, L.Z.; writing—original draft preparation, H.Z., J.C. and L.Z.; writing—review and editing, L.Z., G.S. and L.L.; visualization, J.C.; supervision, L.Z. All authors have read and agreed to the published version of the manuscript.

Funding

This research was funded by the Macao Science and Technology Development Fund, grant number 0067/2022/A.

Data Availability Statement

The original datasets analyzed during the current study are subject to institutional data use agreements and are therefore not publicly available. Processed data and analytical code used in this study are available from the corresponding author on reasonable request.

Acknowledgments

The authors would like to thank the anonymous reviewers and editors for their insightful comments and valuable suggestions, which have greatly improved the quality of this manuscript.

Conflicts of Interest

The authors declare no conflicts of interest.

Abbreviations

The following abbreviations are used in this manuscript:
HUBMHomogeneous Unit of Building Morphology
MAUPModifiable Areal Unit Problem
ESPsEcological Security Patterns

References

  1. Taylor, L.; Hochuli, D.F. Creating better cities: How biodiversity and ecosystem functioning enhance urban residents’ wellbeing. Urban Ecosyst. 2015, 18, 747–762. [Google Scholar] [CrossRef]
  2. Ogwu, M.C.; Kosoe, E.A.; Alaka, A.C.; Xu, J. Green Infrastructure and Environmental Health Security: The Role of Nature-Based Solutions in Improving Urban Health. In Innovative Approaches in Environmental Health Management: Processes, Technologies, and Strategies for a Sustainable Future; Springer Nature: Cham, Switzerland, 2025; pp. 225–255. [Google Scholar]
  3. Matthies, S.A.; Rüter, S.; Schaarschmidt, F.; Prasse, R. Determinants of species richness within and across taxonomic groups in urban green spaces. Urban Ecosyst. 2017, 20, 897–909. [Google Scholar] [CrossRef]
  4. Havu, M.; Kulmala, L.; Lee, H.S.; Saranko, O.; Soininen, J.; Ahongshangbam, J.; Järvi, L. CO2 uptake of urban vegetation in a warming Nordic city. Urban For. Urban Green. 2024, 94, 128261. [Google Scholar] [CrossRef]
  5. Kruja, S.; Braçe, O.; Kokthi, E.; Cumbrera, M.G. The role of urban green spaces on life satisfaction and migration willingness in Tirana, Albania. Hum. Ecol. 2024, 52, 667–679. [Google Scholar] [CrossRef]
  6. Zahoor, A.; Xu, T.; Wang, M.; Dawood, M.; Afrane, S.; Li, Y.; Mao, G. Natural and artificial green infrastructure (GI) for sustainable resilient cities: A scientometric analysis. Environ. Impact Assess. Rev. 2023, 101, 107139. [Google Scholar] [CrossRef]
  7. Zhang, Y.; Hu, Z.; Han, J.; Liu, X.; Feng, Z.; Zhang, X. Spatiotemporal patterns and driving factors of ecological restoration regions: Insights from multi-scale analysis. Environ. Impact Assess. Rev. 2025, 115, 108020. [Google Scholar] [CrossRef]
  8. Millennium Ecosystem Assessment. Ecosystems and Human Well-Being: Biodiversity Synthesis; World Resources Institute: Washington, DC, USA, 2005. [Google Scholar]
  9. TEEB (The Economics of Ecosystems and Biodiversity). The Economics of Ecosystems and Biodiversity: An Interim Report; European Communities: Brussels, Belgium, 2008. [Google Scholar]
  10. Sherrouse, B.C.; Clement, J.M.; Semmens, D.J. A GIS application for assessing, mapping, and quantifying the social values of ecosystem services. Appl. Geogr. 2011, 31, 748–760. [Google Scholar] [CrossRef]
  11. Bagstad, K.J.; Semmens, D.J.; Waage, S.; Winthrop, R. A comparative evaluation of ecosystem services valuation tools. Ecosyst. Serv. 2016, 22, 88–97. [Google Scholar]
  12. Scholte, S.S.K.; van Teeffelen, A.J.A.; Verburg, P.H. Integrating socio-cultural perspectives into ecosystem service valuation: A review of concepts and methods. Ecol. Econ. 2015, 114, 67–78. [Google Scholar] [CrossRef]
  13. Nedkov, S.; Burkhard, B.; Kibria, S. Mapping and assessing urban ecosystem services using integrated indicators. Ecol. Indic. 2018, 85, 27–40. [Google Scholar]
  14. Yu, P.; Zhang, S.; Yung, E.H.; Chan, E.H.; Luan, B.; Chen, Y. On the urban compactness to ecosystem services in a rapidly urbanising metropolitan area: Highlighting scale effects and spatial non-stationarity. Environ. Impact Assess. Rev. 2023, 98, 106975. [Google Scholar] [CrossRef]
  15. Folke, C. Resilience: The emergence of a perspective for social–ecological systems analyses. Glob. Environ. Change 2006, 16, 253–267. [Google Scholar] [CrossRef]
  16. Ahern, J. From fail-safe to safe-to-fail: Sustainability and resilience in the new urban world. Landsc. Urban Plan. 2011, 100, 341–343. [Google Scholar] [CrossRef]
  17. Elmqvist, T.; Andersson, E.; Frantzeskaki, N.; McPhearson, T.; Olsson, P.; Gaffney, O.; Takeuchi, K.; Folke, C. Sustainability and resilience for transformation in the urban century. Nat. Sustain. 2019, 2, 267–273. [Google Scholar] [CrossRef]
  18. Meerow, S.; Newell, J.P. Urban resilience for whom? Urban Geogr. 2019, 40, 309–329. [Google Scholar] [CrossRef]
  19. Xiao, S.; Wu, W.; Guo, J.; Ou, M.; Pueppke, S.G.; Ou, W.; Tao, Y. An evaluation framework for designing ecological security patterns and prioritizing ecological corridors: Application in Jiangsu Province, China. Landsc. Ecol. 2020, 35, 2517–2534. [Google Scholar] [CrossRef]
  20. Tang, L.; Liang, G.; Gu, G.; Xu, J.; Duan, L.; Zhang, X.; Lu, R. Study on the spatial–temporal evolution characteristics, patterns, and driving mechanisms of ecological environment of the Ecological Security Barriers on China’s land borders. Environ. Impact Assess. Rev. 2023, 103, 107267. [Google Scholar] [CrossRef]
  21. Li, T.; Li, R.; Liu, Y.; Wei, G.; Li, S.; He, B.J. Does enhanced land use efficiency promote ecological resilience in China’s urban agglomerations? Environ. Impact Assess. Rev. 2025, 115, 108047. [Google Scholar] [CrossRef]
  22. Yang, J.; Deng, W.; Zhang, G.; Cui, X. Linking endangered species protection to construct and optimize ecological security patterns in the National Ecological Civilization Construction Demonstration Zone: A case study of Yichang, China. Ecol. Indic. 2024, 158, 111579. [Google Scholar] [CrossRef]
  23. Veerkamp, C.J.; Loreti, M.; Benavidez, R.; Jackson, B.; Schipper, A.M. Comparing three spatial modeling tools for assessing urban ecosystem services. Ecosyst. Serv. 2023, 59, 101500. [Google Scholar] [CrossRef]
  24. Viegas, J.M.; Martinez, L.M.; Silva, E.A. Effects of the modifiable areal unit problem on the delineation of traffic analysis zones. Environ. Plan. B Plan. Des. 2009, 36, 625–643. [Google Scholar] [CrossRef]
  25. Ye, X.; Rogerson, P. The impacts of the modifiable areal unit problem (MAUP) on omission error. Geogr. Anal. 2022, 54, 32–57. [Google Scholar] [CrossRef]
  26. Sun, R.; Jin, X.; Han, B.; Liang, X.; Zhang, X.; Zhou, Y. Does scale matter? Analysis and measurement of ecosystem service supply and demand status based on ecological unit. Environ. Impact Assess. Rev. 2022, 95, 106785. [Google Scholar] [CrossRef]
  27. Pan, H.; Zhang, L.; Cong, C.; Deal, B.; Wang, Y. A dynamic and spatially explicit modeling approach to identify the ecosystem service implications of complex urban systems interactions. Ecol. Indic. 2019, 102, 426–436. [Google Scholar] [CrossRef]
  28. Wang, L.; Wu, X.; He, Y. Exploring the urban structure of recreational spaces through residents’ mobility behavior using mobile phone signaling data. J. Urban Plan. Dev. 2025, 151, 05025011. [Google Scholar] [CrossRef]
  29. Li, J.; Guo, Z. Leveraging greenspace to manage urban flooding: An investigation of nature-based solutions implementation in US public parks. Land 2024, 13, 1531. [Google Scholar] [CrossRef]
  30. Chen, Y.; La Rosa, D.; Yue, W.; Xu, Z.; Zhuo, Y. Do larger cities enjoy better green space accessibility? Evidence from China. Environ. Impact Assess. Rev. 2024, 107, 107544. [Google Scholar] [CrossRef]
  31. Graça, M.; Alves, P.; Gonçalves, J.; Nowak, D.J.; Hoehn, R.; Farinha-Marques, P.; Cunha, M. Assessing how green space types affect ecosystem services delivery in Porto, Portugal. Landsc. Urban Plan. 2018, 170, 195–208. [Google Scholar] [CrossRef]
  32. Zhou, L.; Shen, G.; Woodfin, T.; Chen, T.; Song, K. Ecological and economic impacts of green roofs and permeable pavements at the city level: The case of Corvallis, Oregon. J. Environ. Plan. Manag. 2018, 61, 430–450. [Google Scholar] [CrossRef]
  33. Barbosa, V.R.F.; Damasceno, R.M.; Dias, M.A.; Castelhano, F.J.; Roig, H.L.; Requia, W.J. Ecosystem services provided by green areas and their implications for human health in Brazil. Ecol. Indic. 2024, 161, 111975. [Google Scholar] [CrossRef]
  34. Zhou, L.; Kong, X.; Shen, G.; Li, Y.; Zhu, H.; Chen, T.; Liu, Y. Spatial-temporal impacts of landscape metrics and uses of land reclamation on coastal water conditions: The case of Macao. Ecol. Indic. 2023, 154, 110518. [Google Scholar] [CrossRef]
  35. Ye, C.; Hu, L.; Li, M. Urban green space accessibility changes in a high-density city: A case study of Macau from 2010 to 2015. J. Transp. Geogr. 2018, 66, 106–115. [Google Scholar] [CrossRef]
  36. Xie, T.; Lu, F.; Wang, M.; Zhang, Y.; Liu, C.; Chen, W. Application of Urban Anthropogenic Background to Pollution Evaluation and Source Identification of Soil Contaminants in Macau, China. Sci. Total Environ. 2021, 778, 146263. [Google Scholar] [CrossRef] [PubMed]
  37. Government of Macao Special Administrative Region Statistics and Census Service. Demographic Statistics; DSEC: Macao, China, 2024. Available online: https://www.dsec.gov.mo/zh-MO/Statistic?id=101 (accessed on 15 October 2025).
  38. Wang, M.; Yan, Y.; Li, M.; Zhou, L. Differences in emotional preferences toward urban green spaces among various cultural groups in Macao and their influencing factors. Land 2024, 13, 414. [Google Scholar] [CrossRef]
  39. Tian, Y.; Jim, C.Y.; Wang, H. Assessing the landscape and ecological quality of urban green spaces in a compact city. Landsc. Urban Plan. 2014, 121, 97–108. [Google Scholar] [CrossRef]
  40. Yang, L.; Chen, Y.; Li, Y.; Zhu, H.; Yang, X.; Li, S.; Tang, G. Is 3D building morphology really related to land surface temperature? Insights from a new homogeneous unit. Build. Environ. 2024, 266, 112101. [Google Scholar] [CrossRef]
  41. Macao Cartography and Cadastre Bureau. 2021 Population Census Data; DSEC: Macao, China, 2022. Available online: https://www.dsec.gov.mo/gis/unidade/unidade.html?lang=cn (accessed on 15 October 2025).
  42. Gaw, L.Y.F.; Richards, D.R. Development of spontaneous vegetation on reclaimed land in Singapore measured by NDVI. PLoS ONE 2021, 16, e0245220. [Google Scholar] [CrossRef]
  43. Aryal, J.; Sitaula, C.; Aryal, S. NDVI threshold-based urban green space mapping from Sentinel-2A at the local governmental area (LGA) level of Victoria, Australia. Land 2022, 11, 351. [Google Scholar] [CrossRef]
  44. Lee, G.; Kim, G.; Min, G.; Kim, M.; Jung, S.; Hwang, J.; Cho, S. Vegetation classification in urban areas by combining UAV-based NDVI and thermal infrared image. Appl. Sci. 2022, 13, 515. [Google Scholar] [CrossRef]
  45. Syrbe, R.U.; Grunewald, K. Ecosystem service supply and demand—The challenge to balance spatial mismatches. Int. J. Biodivers. Sci. Ecosyst. Serv. Manag. 2017, 13, 148–161. [Google Scholar] [CrossRef]
  46. Ministry of Housing and Urban–Rural Development of the People’s Republic of China. Standard for Urban Residential Area Planning and Design (GB 50180-2018); China Architecture & Building Press: Beijing, China, 2018.
  47. Xie, G.D.; Zhang, C.X.; Zhang, L.M.; Chen, W.H.; Li, S.M. Improvement of the evaluation method for ecosystem service value based on per unit area. J. Nat. Resour. 2015, 30, 1243–1254. [Google Scholar]
  48. Xu, C.; Meng, N.; Yang, Y.; Lu, F.; Liu, X. Impact of land use change on the value of terrestrial ecosystem services in Macao. J. Chin. Urban For. 2020, 18, 47–53. (In Chinese) [Google Scholar]
  49. Wang, J.; Chen, T. Identification method for key areas of ecological restoration of land space in high-density coastal cities: A case study of Macao Special Administrative Region. Landsc. Archit. 2021, 28, 16–22. (In Chinese) [Google Scholar]
  50. Mamat, A.; Wang, J.; Aimaiti, M.; Saydi, M. Evolution and Driving Forces of Ecological Service Value in Response to Land Use Change in Tarim Basin, Northwest China. Remote Sens. 2024, 16, 2311. [Google Scholar] [CrossRef]
  51. Dai, D. Racial/ethnic and socioeconomic disparities in urban green space accessibility: Where to intervene? Landsc. Urban Plan. 2011, 102, 234–244. [Google Scholar] [CrossRef]
  52. Ouyang, Q.; Zheng, B.; Luo, X.; Wu, S. Construction of ecological security pattern of urban agglomeration based on multi-scale ecological corridor networks. Ecosyst. Health Sustain. 2024, 10, 0253. [Google Scholar] [CrossRef]
  53. Zhang, B.; Cao, J.; Chen, D.; Li, X.; Liu, Y.; Wang, J.; Liu, T. Construction of watershed ecological security patterns with integrated spatial variability: A case study of the Yellow River Basin, China. Ecol. Indic. 2024, 159, 111663. [Google Scholar] [CrossRef]
  54. Peng, J.; Zhao, H.; Liu, Y. Urban ecological corridors construction: A review. Acta Ecol. Sin. 2017, 37, 23–30. [Google Scholar] [CrossRef]
  55. Yuan, Y.; Bai, Z.; Zhang, J.; Xu, C. Increasing urban ecological resilience based on ecological security pattern: A case study in a resource-based city. Ecol. Eng. 2022, 175, 106486. [Google Scholar] [CrossRef]
  56. Zhou, L.; Qin, Y.; Cheng, J.; Zhu, H.; Li, M.; Zhang, J.; Liu, Y. Urban ecosystem services, ecological security patterns and ecological resilience in coastal cities: The impact of land reclamation in Macao SAR. J. Environ. Manag. 2025, 373, 123750. [Google Scholar] [CrossRef]
  57. Mori, E.; Di Lorenzo, T.; Viviano, A.; Jakovljević, T.; Marra, E.; Moura, B.B.; Garosi, C.; Manzini, J.; Ancillotto, L.; Hoshika, Y.; et al. Under Pressure: Environmental Stressors in Urban Ecosystems and Their Ecological and Social Consequences on Biodiversity and Human Well-Being. Stresses 2025, 5, 66. [Google Scholar] [CrossRef]
  58. Wu, C.; Liu, G.; Huang, C.; Liu, Q.; Guan, X. Ecological Vulnerability Assessment Based on Fuzzy Analytical Method and Analytic Hierarchy Process in Yellow River Delta. Int. J. Environ. Res. Public Health 2018, 15, 855. [Google Scholar] [CrossRef]
  59. Li, Y.; Wu, L.; Han, Q.; Wang, X.; Zou, T.; Fan, C. Estimation of Remote Sensing Based Ecological Index along the Grand Canal Based on PCA-AHP-TOPSIS Methodology. Ecol. Indic. 2021, 122, 107214. [Google Scholar] [CrossRef]
  60. Qiu, J.; Carpenter, S.R.; Booth, E.G.; Motew, M.; Kucharik, C.J. Spatial and temporal variability of future ecosystem services in an agricultural landscape. Landsc. Ecol. 2020, 35, 2569–2586. [Google Scholar] [CrossRef]
  61. Zhou, L.; Shen, G.; Li, C.; Chen, T.; Li, S.; Brown, R. Impacts of land covers on stormwater runoff and urban development: A land-use and parcel-based regression approach. Land Use Policy 2021, 103, 105280. [Google Scholar] [CrossRef]
  62. Liu, J.; Wu, X.; Pan, L.; Hsieh, C.M. Multi-scale analysis of the mitigation effect of green space morphology on urban heat islands. Atmosphere 2025, 16, 857. [Google Scholar] [CrossRef]
  63. Marcus, L.; Colding, J. Toward an integrated theory of spatial morphology and resilient urban systems. Ecol. Soc. 2014, 19, 55. [Google Scholar] [CrossRef]
  64. Zhu, W.; Jin, X.; Zhang, X.; Liu, J.; Zhou, Y. Ecosystem services to support sustainable development: The modifiable areal unit problem in the transition between evaluation and management units. Sustain. Dev. 2024, 32, 6253–6273. [Google Scholar] [CrossRef]
  65. Hsu, K.W.; Chao, J.C. Economic valuation of green infrastructure investments in urban renewal: The case of the station district in Taichung, Taiwan. Environments 2020, 7, 56. [Google Scholar] [CrossRef]
  66. Gastineau, P.; Mossay, P.; Taugourdeau, E. Ecological compensation: How much and where? Ecol. Econ. 2021, 190, 107191. [Google Scholar] [CrossRef]
  67. Jin, G.; Deng, X.; Chu, X.; Li, Z.; Wang, Y. Optimization of land-use management for ecosystem service improvement: A review. Phys. Chem. Earth 2017, 101, 70–77. [Google Scholar] [CrossRef]
  68. Yusuf, D.A.; Zhu, J.; Khaing, C.T.; Adamu, S.U.; Bala, H.S. Regulating urban metabolism in semi-arid regions: Classification and valuation of urban open spaces ecosystem services in metropolitan Kano. Environ. Dev. 2025, 54, 101165. [Google Scholar] [CrossRef]
  69. Friess, D.A. Ecosystem services and disservices of urban mangrove forests: Insights for management and planning from Singapore. Landsc. Urban Plan. 2017, 157, 262–268. [Google Scholar]
  70. Paul, B.N.; Mahajan, A.; Sarath, S. Climate Change and Forest Ecosystems: Restoration and Rehabilitation Approaches. In Forests and Climate Change: Biological Perspectives on Impact, Adaptation, and Mitigation Strategies; Springer Nature: Singapore, 2024; pp. 553–571. [Google Scholar]
  71. Lyu, H.; Zhang, H.; Luo, X.; Chen, Q. Quantifying trade-offs between ecological benefits and accessibility of urban parks: A case study in Shenzhen, China. Urban For. Urban Green. 2022, 74, 127661. [Google Scholar]
  72. Russo, A. Renaturing for urban wellbeing: A socioecological perspective on green space quality, accessibility, and inclusivity. Sustainability 2024, 16, 5751. [Google Scholar] [CrossRef]
  73. Wolch, J.R.; Byrne, J.; Newell, J.P. Urban Green Space, Public Health, and Environmental Justice: The Challenge of Making Cities ‘Just Green Enough’. Landsc. Urban Plann. 2014, 125, 234–244. [Google Scholar] [CrossRef]
  74. Robinson, D.A.; Hockley, N.; Cooper, D.M.; Emmett, B.A.; Keith, A.M.; Lebron, I.; Robinson, J.S. Natural capital and ecosystem services: Developing an appropriate soils framework as a basis for valuation. Soil Biol. Biochem. 2013, 57, 1023–1033. [Google Scholar] [CrossRef]
  75. Hessen, D.O.; Vandvik, V. Climate change impacts on mountain biodiversity and ecosystems: From species to community resilience. Glob. Ecol. Conserv. 2022, 36, e02113. [Google Scholar]
  76. Semeraro, T.; Scarano, A.; Buccolieri, R.; Santino, A.; Aarrevaara, E. Planning of urban green spaces: An ecological perspective on human benefits. Land 2021, 10, 105. [Google Scholar] [CrossRef]
  77. Serret, H.; Raymond, R.; Foltête, J.C.; Clergeau, P.; Simon, L.; Machon, N. Potential contributions of green spaces at business sites to the ecological network in an urban agglomeration: The case of the Île-de-France region, France. Landsc. Urban Plan. 2014, 131, 27–35. [Google Scholar] [CrossRef]
Figure 1. Land reclamation and spatial distribution of natural green spaces and artificial green spaces in Macao. (a) Map of China; (b) Map of the Guangdong-Hong Kong-Macao Greater Bay Area with the study area indicated; (c) Evolution of Macao’s urban boundaries and land reclamation over time (1912, 2010, 2020, and 2024); (d) Distribution of natural and artificial green spaces in Macao.
Land 15 00006 g001
Figure 2. HUBM-Based Computational Framework for Ecosystem Service and Resilience Assessment.
Land 15 00006 g002
Figure 3. Schematic overview of the spatial aggregation process used to generate HUBM units.
Land 15 00006 g003
Figure 4. Comparison of Spatial Unit Definitions. (a) Buildings fragmented by grids; (b) HUBM preserving urban fabric; (c) Unit number of HUBM and Grids in different scale.
Land 15 00006 g004
Figure 5. Ecosystem service quantification and mapping on regular grids and HUBM with 6 spatial levels and scales of different cluster sizes. (a) Ecosystem service on HUBM level 1; (b) Ecosystem service on HUBM level 2; (c) Ecosystem service on HUBM level 3; (d) Ecosystem service on HUBM level 4; (e) Ecosystem service on HUBM level 5; (f) Ecosystem service on HUBM level 6; (g) Ecosystem service on 250 m × 250 m grid; (h) Ecosystem service on 300 m × 300 m grid; (i) Ecosystem service on 350 m × 350 m grid; (j) Ecosystem service on 400 m × 400 m grid; (k) Ecosystem service on 450 m × 450 m; grid (l) Ecosystem service on 500 m × 500 m grid.
Land 15 00006 g005
Figure 6. Spatial Analysis of ecosystem service values: kernel density estimation and spatial autocorrelation at HUBM levels and Grid scales. (a) Kernel density estimation of ecosystem service values across HUBM levels and grid scales analyses; (b) Spatial autocorrelation test results at HUBM levels and grid scales. Note: * p < 0.05, ** p < 0.01, *** p < 0.001.
Land 15 00006 g006
Figure 7. Visualization of local and accessibility-based ecosystem service from natural green spaces and artificial green spaces. (a) Provisioning services from natural green spaces; (b) Provisioning service from artificial green spaces; (c) Regulating services from natural green spaces; (d) Regulating services from artificial green spaces; (e) Supporting services from natural green spaces; (f) Supporting services from artificial green spaces; (g) Cultural services from natural green spaces; (h) Cultural services from artificial green spaces.
Land 15 00006 g007
Figure 8. Contributions of natural and artificial green spaces in ESPs.
Land 15 00006 g008
Figure 9. Ecological resilience of natural green spaces and artificial green spaces.
Land 15 00006 g009
Table 1. Primary data information.
Data NameData TypeYearData Sources
Macao green space datasetVector2024https://www.iam.gov.mo/c/default
(accessed on 12 April 2024)
Road networkVector2024Open Street Map, https://www.openstreetmap.org/#map=13/22.16499/113.61588
(accessed on 12 April 2024)
Popular numberVector2021Macao Cartography and Cadastre Bureau, https://www.dsec.gov.mo/gis/unidade/unidade.html?lang=cn
(accessed on 12 April 2024)
Macao reclamation dataVector2022Macao Cartography and Cadastre Bureau, https://www.dscc.gov.mo/zh-hans/home.html (accessed on 1 April 2024)
Land useTiff2024Resource Satellite-1, http://www.sasclouds.com/chinese/normal/
(accessed on 1 April 2024)
Building heightVector2021Macao Cartography and Cadastre Bureau, https://www.dscc.gov.mo/zh-hans/home.html
(accessed on 12 April 2024)
Building areaVector2021Macao Cartography and Cadastre Bureau, https://www.dscc.gov.mo/zh-hans/home.html
(accessed on 12 April 2024)
NDVITiff2023United States Geological Survey (USGS), LANDSAT 8 OLI
https://earthexplorer.usgs.gov/ (accessed on 1 April 2024)
Table 2. Ecosystem service delivered by natural and artificial green spaces.
Green Space TypeService TypeES Value
(108 Yuan)
Percentage
(%)
Natural green spaceProvisioning
service
448.8937.83
Regulating
service
28,234.4282.27
Supporting
service
1104.7935.13
Sub-total29,788.10-
Total Accessibility Index 6,279,526.69-
Artificial green spaceProvisioning
service
737.7562.17
Regulating
service
6082.9917.73
Supporting
service
2039.9064.87
Sub-total8860.64-
Total Accessibility Index25,906.48-
Disclaimer/Publisher’s Note: The statements, opinions and data contained in all publications are solely those of the individual author(s) and contributor(s) and not of MDPI and/or the editor(s). MDPI and/or the editor(s) disclaim responsibility for any injury to people or property resulting from any ideas, methods, instructions or products referred to in the content.