


Abstract
Lake eutrophication exhibits pronounced spatial heterogeneity at the watershed scale, yet a systematic and quantitative understanding of how landscape characteristics drive these variations remains limited. In this study, a long-term and internally consistent trophic state dataset for the Liangzi Lake Basin was constructed by integrating Landsat imagery from 1990 to 2022 with a semi-analytical water color inversion method. A multi-scale landscape feature system incorporating both land use composition and landscape pattern metrics was developed at the sub-basin level to elucidate the mechanisms by which landscape characteristics influence eutrophication dynamics. The XGBoost model was employed to characterize the nonlinear relationships between landscape attributes and trophic conditions, while the SHAP interpretability approach was applied to quantify the relative contribution of individual landscape components and their interaction pathways. The analytical framework demonstrates that landscape pattern attributes—such as fragmentation, diversity, and connectivity—play essential roles in shaping the spatial variability of eutrophication by modulating hydrological processes, nutrient transport, and ecological buffering capacity. By integrating remote sensing observations with interpretable machine learning, the study reveals the complexity and scale dependence of landscape–water interactions, providing a methodological foundation for advancing the understanding of eutrophication drivers. The findings offer theoretical guidance and practical references for optimizing watershed landscape planning, controlling non-point source pollution, and supporting ecological restoration efforts in lake basins.
1. Introduction
Lakes are vital ecological resources and integral components of aquatic ecosystems [1]. However, urban spatial expansion and agricultural intensification have resulted in increased nutrient levels in lakes, posing a significant threat to their health [2,3]. The ongoing intensification of lake eutrophication exacerbates the degradation of aquatic environments and disrupts biological community structures, evolving into a complex scientific challenge for global aquatic ecosystem management [4]. The ongoing intensification of lake eutrophication exacerbates the degradation of aquatic environments and disrupts biological community structures, evolving into a complex scientific challenge for global aquatic ecosystem management [5]. Despite substantial investments by various levels of government to promote lake restoration, the nutritional status of most lakes has not fundamentally improved, particularly in the context of escalating human disturbances within watersheds and intensifying climate change [6,7,8].
Based on the spatial characteristics of pollution input pathways, water pollution can be classified into two categories: point source and non-point source. Point source pollution refers to identifiable and concentrated discharge patterns with clearly defined locations [9]. Its pollution load can be effectively managed through regulations at the source of emissions. In contrast, non-point source pollution is characterized by more complex causes, influenced by a combination of environmental and human factors. Notably, in agricultural activities, the widespread use of pesticides and fertilizers has significantly exacerbated pollution dispersion [10,11].
Existing studies have demonstrated that landscape characteristics play a crucial role in the generation and migration processes of pollutants. Research conducted by Chen et al. [12] indicates that these characteristics significantly impact the sources and migration pathways of pollutants. Liu et al. [13] highlight that the spatial scale of landscape characteristics directly influences the intensity of non-point source pollution. Given that landscape characteristics can substantially affect water quality conditions, investigating the mechanisms through which they influence water quality has emerged as a vital research direction for the protection of watershed water environments.
Currently, correlation analysis, redundancy analysis (RDA), and other analytical methods are commonly employed to elucidate the impact mechanisms of landscape characteristics on water quality. For instance, Zhang et al. [14] focused on the Three Gorges Reservoir area and utilized multivariate statistics alongside redundancy analysis to investigate the relationship between land use structure and water quality. The findings indicated that, across different spatial scales, the sub-watershed scale exhibited greater explanatory power for water quality variables compared to the buffer zone scale. Xu et al. [15] highlighted the significant effects of riparian areas on water quality enhancement, noting that forest vegetation, agricultural zones, and residential land use types exert the most direct influence on water quality indicators. Li et al. [16] examined the response mechanisms of landscape characteristics to water quality during urbanization in the Han River basin, asserting that riparian zones have the most pronounced impact on water quality across all spatial ranges. Xu et al. [17] further corroborated that the distance of 100 to 1000 m from the riverbank has the most significant effect on water quality. Research conducted by Wang et al. [18] and Yang et al. [19] on the Dan River basin and Qingge River basin revealed that the expansion of farmland and construction land is the primary factor contributing to water quality deterioration. Nevertheless, due to the limitations of traditional statistical methods in analyzing complex nonlinear relationships, along with the relatively constrained multi-scale coupling analysis frameworks and quantitative characterization methods for landscape spatial heterogeneity, further research on the relationship between watershed landscape characteristics and water eutrophication remains necessary.
Machine learning algorithms exhibit substantial advantages in managing extensive datasets and analyzing the spatial scale relationships of landscape features. Their efficient feature learning and nonlinear modeling capabilities facilitate the integration of multi-source data, allowing for an analysis of the intricate scale-response patterns between landscape feature indicators and ecological processes. These algorithms are adept at capturing the complex nonlinear relationships between multi-scale landscape features and water nutrient status, effectively addressing the limitations inherent in traditional statistical models [20]. Furthermore, the combination of machine learning algorithms with interpretable methods enables the quantification of marginal contributions and interactions of landscape features across different spatial scales, thereby significantly enhancing the accuracy and efficiency of cross-scale ecological process simulations [21].
Liangzi Lake is a significant body of water located in the middle and lower reaches of the Yangtze River, characterized by its typical wetland landscapes and rich biodiversity. It serves as a crucial water source and ecological barrier for the Wuhan metropolitan area [22]. In recent years, the rapid development of the Wuhan metropolitan area, coupled with continuous population growth and accelerated urbanization, has increasingly impacted water resources and the ecological environment. These changes have resulted in the shrinkage of the lake area, a reduction in wetlands and aquatic organisms, and an increase in lake nutrients [23]. This study focuses on Liangzi Lake as the research area, utilizing machine learning algorithms in conjunction with the SHAP interpretation method to investigate, at the sub-watershed scale, the response mechanisms of landscape characteristics to water eutrophication and to identify key driving factors. The objective is to provide a scientific basis and decision-making support for the management of eutrophication in Liangzi Lake and similar lakes across China.
2. Materials and Methods
2.1. Study Area
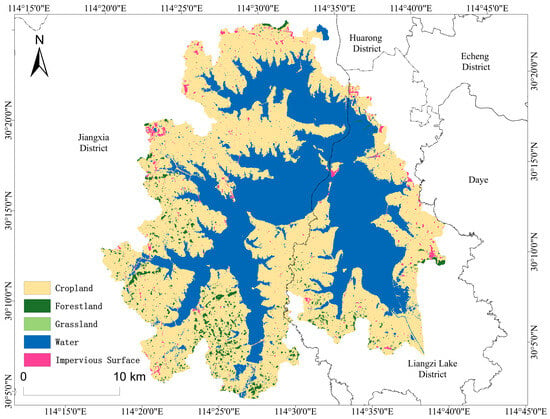
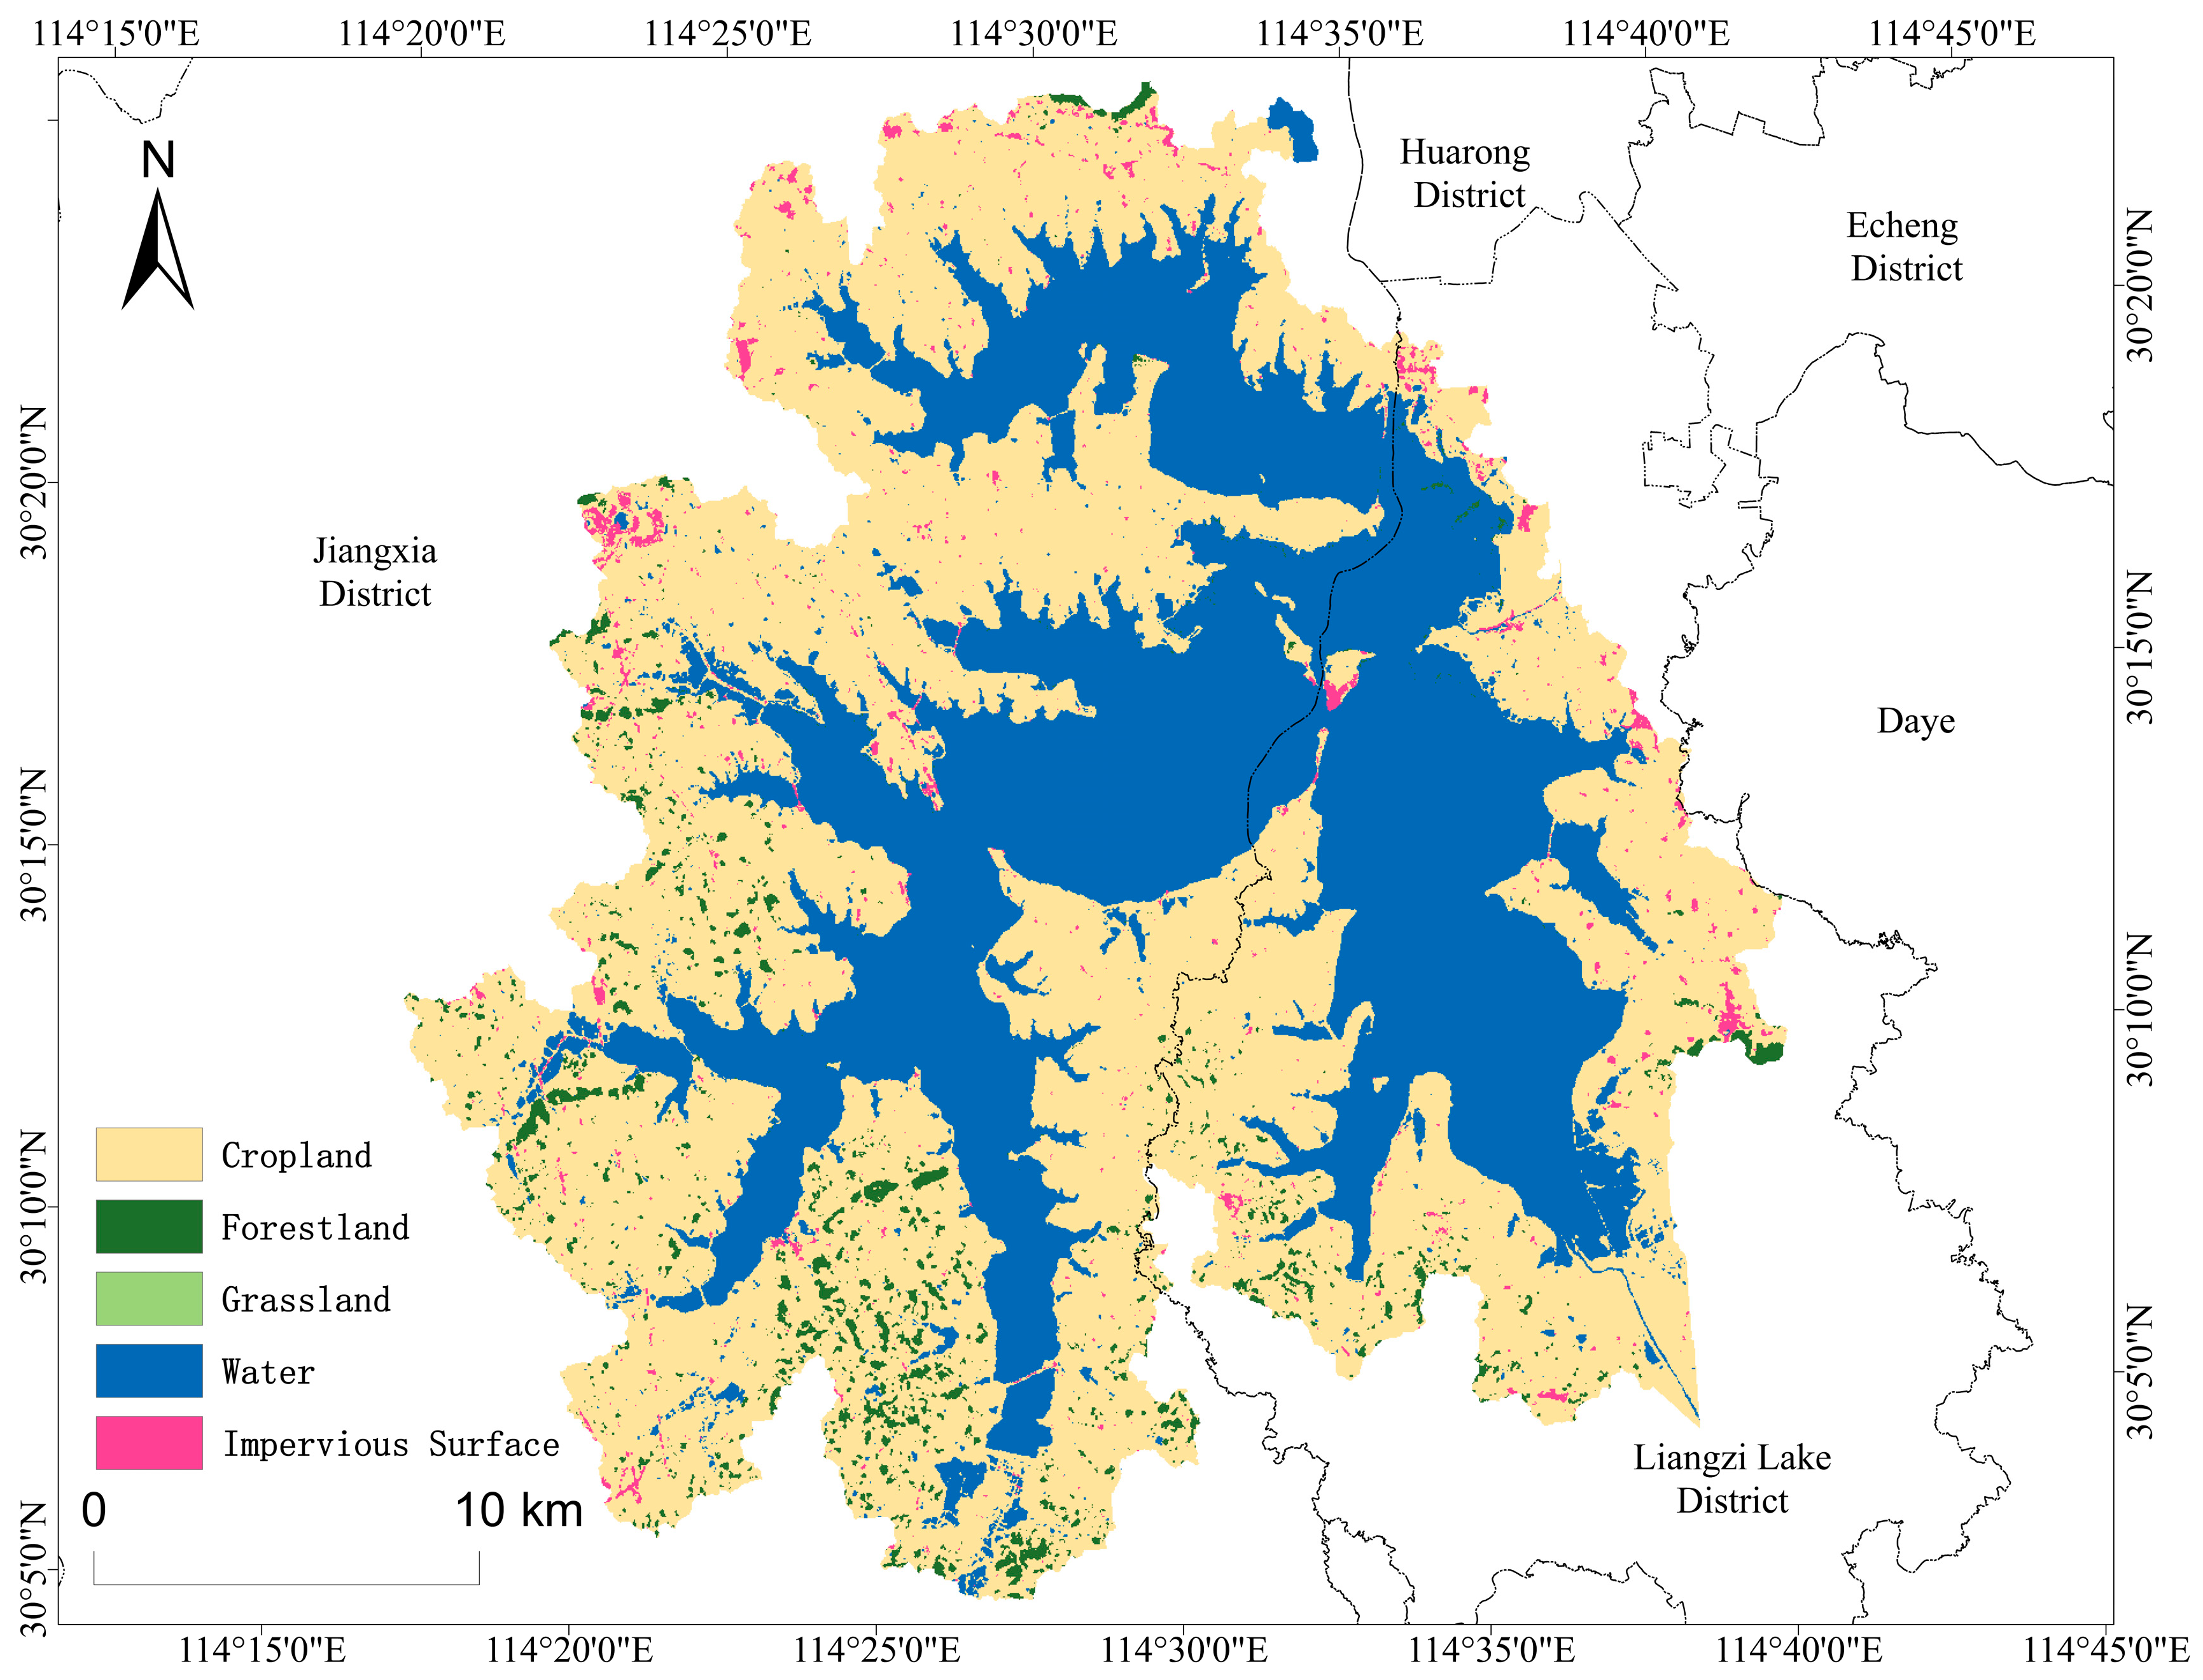
Liangzi Lake, located in southeastern Hubei Province on the southern bank of the middle reaches of the Yangtze River, is the second largest freshwater lake in the province (Figure 1). It spans latitudes 30.08° to 30.38° N and longitudes 114.37° to 114.66° E. The watershed encompasses Jiangxia District of Wuhan City and Ezhou City, covering a total area of 3265 km2. The average annual water depth is 2.53 m, with a water retention time of approximately 0.53 years. The predominant land use in the area is agricultural cultivation and aquaculture. The lake is divided by Liangzi Mountain: East Liangzi Lake, situated in Ezhou City, primarily focuses on natural fisheries and tourism, while West Liangzi Lake, located in Jiangxia District of Wuhan City, is mainly dedicated to aquaculture. This area is adversely affected by surrounding domestic sewage and agricultural non-point source pollution.
Figure 1.
Geographic location of Liangzi Lake.
2.2. Data Sources
Remote sensing data were sourced from the United States Geological Survey (USGS, https://glovis.usgs.gov), acquiring a total of 120 Level-1 processed Landsat series images covering the Liangzi Lake area from 1990 to 2022. These images have a spatial resolution of 30 m and a revisit cycle of 16 days. The acquired images underwent atmospheric correction and preliminary processing using ACOLITE software (v20231023.0). Digital elevation data were obtained from the ASTER GDEM v3.0 digital elevation model (https://lpdaac.usgs.gov), which also has a spatial resolution of 30 m. The ArcSWAT hydrological analysis module was employed to extract sub-watershed boundaries within the reservoir area. Land use type data were derived from the 30 m CLCD dataset produced by Wuhan University (https://irsip.whu.edu.cn). Combined with field survey results, three land types were selected for classification analysis: cropland, forestland, and impervious surfaces.
2.3. Research Method
2.3.1. Water Quality Inversion Based on the QAA_V6 Algorithm
The trophic state of Liangzi Lake was retrieved using the absorption characteristics of optically active constituents derived from the Quasi-Analytical Algorithm Version 6 (QAA_V6). QAA_V6 provides a semi-analytical scheme for decomposing above-water reflectance into inherent optical properties (IOPs) [24]. As the first step, the above-water remote-sensing reflectance is converted into the subsurface reflectance , representing the radiance reflectance just beneath the water surface:
This transformation reduces air–water interface effects and provides a physically consistent basis for subsequent optical inversion.
QAA then derives the spectral parameter from subsurface reflectance, following the optical model of Lee et al. [25]:
where , . The monotonic relationship between and the bulk optical attenuation allows QAA_V6 to estimate the total spectral absorption coefficient at each wavelength without explicitly separating individual absorbing components. This total absorption signal provides the quantitative basis required for subsequent trophic state estimation.
As the study involves multisensor Landsat of Landsat-5 TM, Landsat-7 ETM+ and Landsat-8 OLI, cross-sensor harmonization was required to ensure the temporal consistency of QAA_V6 retrievals. These sensors differ in spectral response functions, center wavelengths, bandwidths, radiometric sensitivity, and signal-to-noise ratios. To mitigate these discrepancies, subsurface reflectance was normalized based on sensor-specific spectral response functions, and the initial backscattering parameter and reflectance ratios used within QAA_V6 were recalibrated. This procedure ensured radiometrically and spectrally comparable absorption retrievals across sensors from 1990 to 2022.
Following the retrieval of total absorption, the absorption attributable to optically active components excluding pure water was computed as:
where denotes the pure water absorption coefficient. The parameter characterizes the combined absorption of chlorophyll-a, colored dissolved organic matter (CDOM), and non-algal particles. According to the semi-empirical model proposed by Shi et al. [26], the trophic state index (TSI) was estimated as:
In this study, the 443 nm blue band of the Landsat sensors was selected as the wavelength for linking the absorption coefficient to the trophic state index (TSI). 443 nm exhibits high sensitivity to the absorption of chlorophyll-a and colored dissolved organic matter (CDOM), making it well suited for eutrophication-related optical retrievals. In contrast, wavelengths such as 550 nm are strongly influenced by suspended sediment scattering, and 665 nm often suffers from reflectance saturation in turbid or eutrophic waters. These limitations reinforce the superior optical stability and applicability of the 443 nm band. Therefore, 443 nm was chosen as the optimal wavelength for estimating absorption coefficients and deriving TSI in this study [27].
According to the “Evaluate method and classification standard on lake eutrophication” [28], the water body nutrient levels and water quality levels are classified as shown in Table 1:
Table 1.
Eutrophication and Water Quality Classification Methods.
2.3.2. Landscape Feature Index
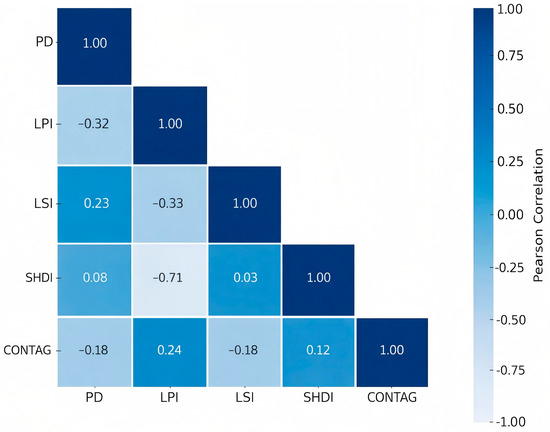
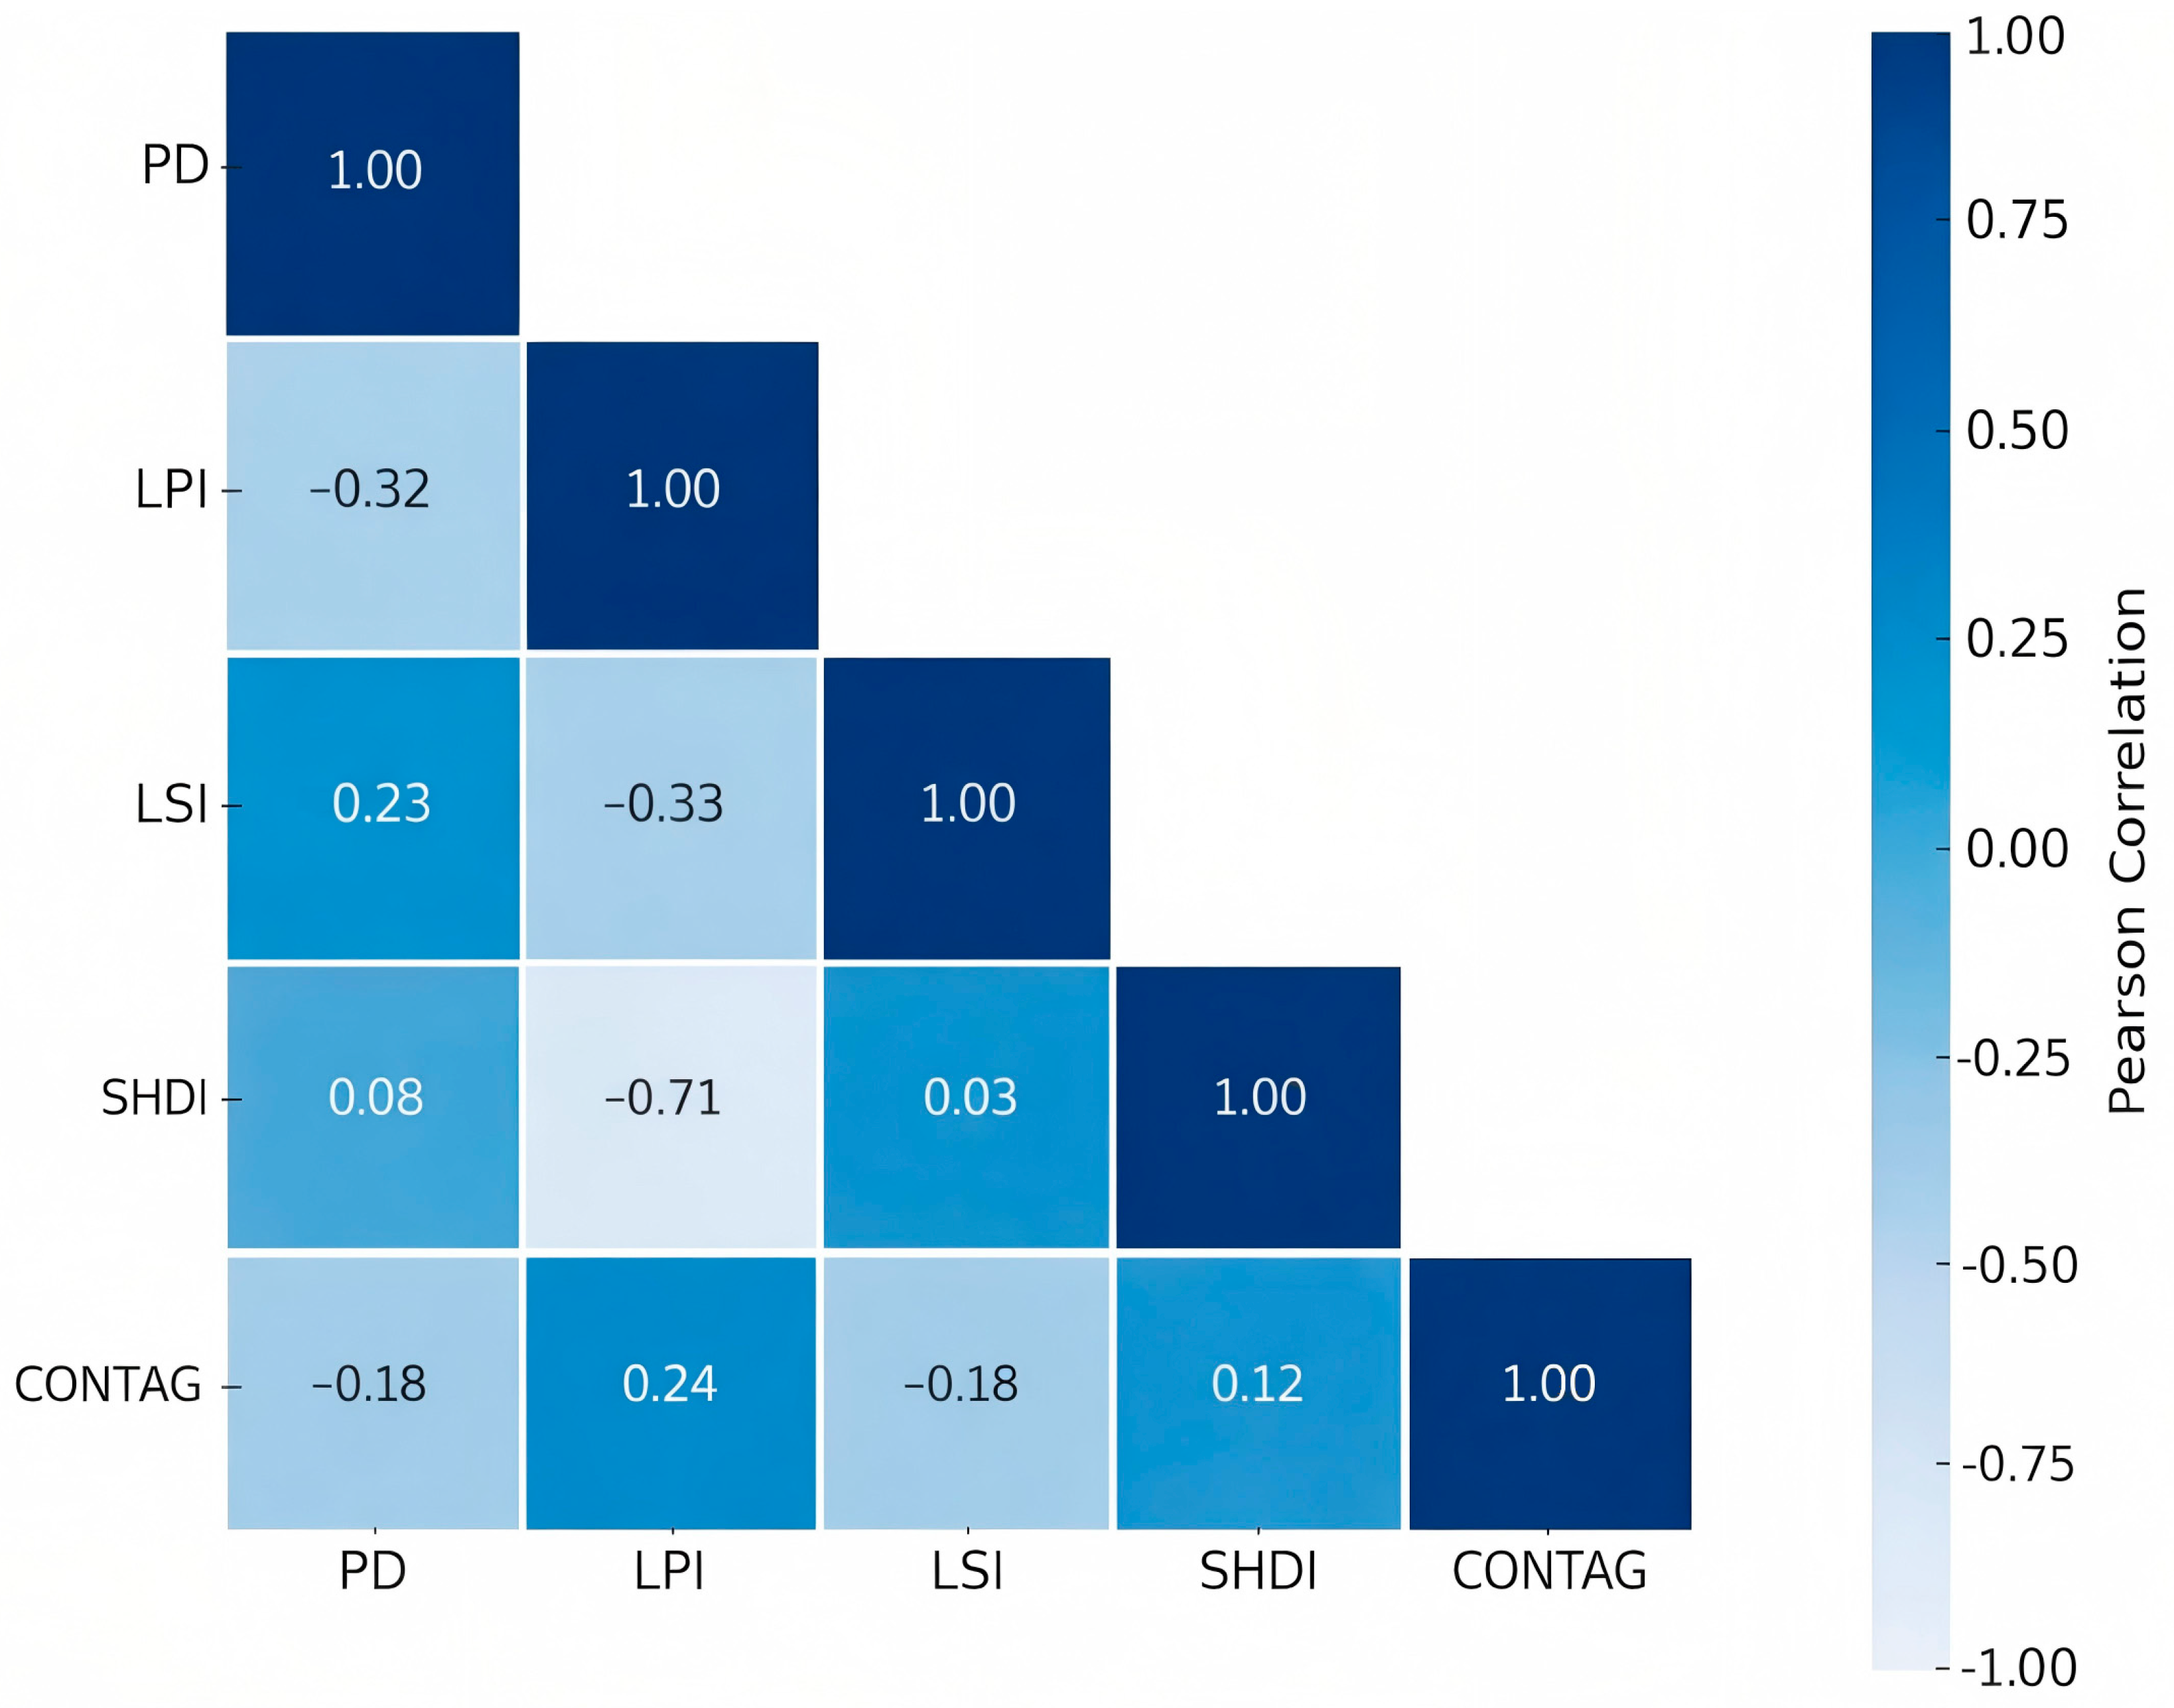
Landscape feature analysis is conducted within the theoretical framework of landscape ecology to assess regional landscape characteristics through a quantitative description of landscape unit types, proportions, and spatial distribution patterns. The analysis of landscape features is primarily carried out from two dimensions: land use structure and landscape pattern [29]. Land use structure involves analyzing the types of landscape categories and their area proportions to reflect the compositional characteristics of land cover. In contrast, landscape pattern quantitatively analyzes the spatial arrangement and combinatorial relationships of different landscape units through the calculation of a series of landscape pattern indices. To comprehensively analyze the spatial heterogeneity of landscapes, three main land use types and five typical landscape pattern indices were selected (Table 2) to evaluate landscape structural characteristics from multiple dimensions, including patch density, dominance, shape complexity, type diversity, and spatial aggregation [30]. To avoid indicator redundancy caused by multicollinearity among landscape pattern indices, Pearson correlation analysis was conducted on the selected indices to ensure that no collinearity exists between them (Figure 2).
Table 2.
Landscape feature index.
Figure 2.
Pearson correlation of selected landscape pattern indices.
2.3.3. XGBoost Algorithm
There are often complex nonlinear relationships between water quality and landscape characteristics. The XGBoost algorithm, an efficient gradient boosting decision tree algorithm, effectively captures nonlinear features in data and fits complex nonlinear patterns through decision tree splits. This makes it highly applicable for analyzing the intricate relationships between landscape characteristics and water quality [31]. The calculation formula is as follows:
In the formula, is the predicted value; is the data sample; is the number of samples; is the number of regression trees; is the prediction result of sample unit in the -th tree; is the ensemble space of regression trees.
In this study, landscape features were used as explanatory variables and the trophic state index (TSI) served as the response variable. All computations were performed in a Python 3.9 environment using the XGBoost (v1.7) and scikit-learn (v1.2) libraries. The dataset was randomly divided into a training set (80%) and a test set (20%) to support model development and evaluation.
To enhance the model’s generalization capacity and reduce overfitting, hyperparameters were optimized through five-fold cross-validation on the training set. During this process, parameters including maximum tree depth, learning rate, minimum child weight, subsampling ratio, and the number of regression trees were systematically tuned. A fixed random seed was applied to ensure full reproducibility of dataset partitioning and cross-validation procedures. Following hyperparameter optimization, the final XGBoost model was trained using the complete training dataset.
The optimized hyperparameters used in this study are summarized in Table 3.
Table 3.
Hyperparameters of the XGBoost algorithm.
2.3.4. SHapley Additive exPlanations
SHapley Additive exPlanations (SHAP) is a model-agnostic machine learning method introduced by Lundberg et al. in 2017 [32]. This method effectively measures feature contributions in individual prediction results and aggregates local results to construct comprehensive explanations of the model. By integrating the XGBoost machine learning algorithm with the SHAP interpretable method, we can elucidate the prediction results of machine learning models and quantitatively analyze the contribution magnitude of various landscape features at the sub-watershed scale to the nutritional status of the Liangzi Lake water body. The SHAP interpretable method assigns a value (SHAP value) to each feature, which reflects both the direction and magnitude of its contribution to the prediction results. Some features positively influence changes in predicted values, while others exhibit inhibitory effects. The SHAP interpretable method employs an additive feature attribution approach, providing reliable explanations. The interpretation model is represented in the following formula [33]:
In the formula, denotes the expected value of the model output over the training dataset. Each represents the Shapley value of feature , quantifying its marginal contribution to the prediction based on all possible feature coalitions. The vector is a binary coalition vector indicating whether a feature is included () or excluded () in the explanatory model. A larger absolute Shapley value indicates a stronger influence of feature on the predicted TSI. Positive Shapley values imply that the feature increases the predicted trophic state, whereas negative Shapley values indicate a suppressing or mitigating effect on the prediction.
3. Results
3.1. Spatial-Temporal Variation Characteristics of the Trophic State of Liangzi Lake
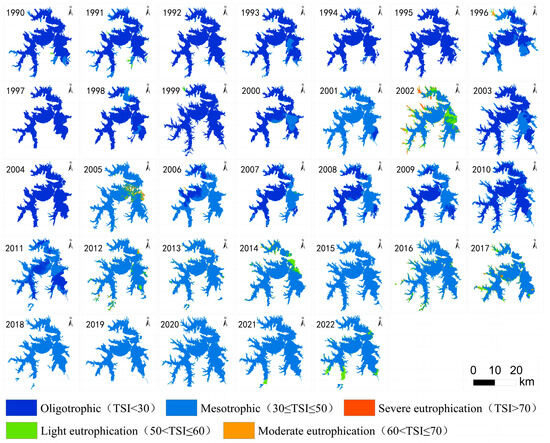
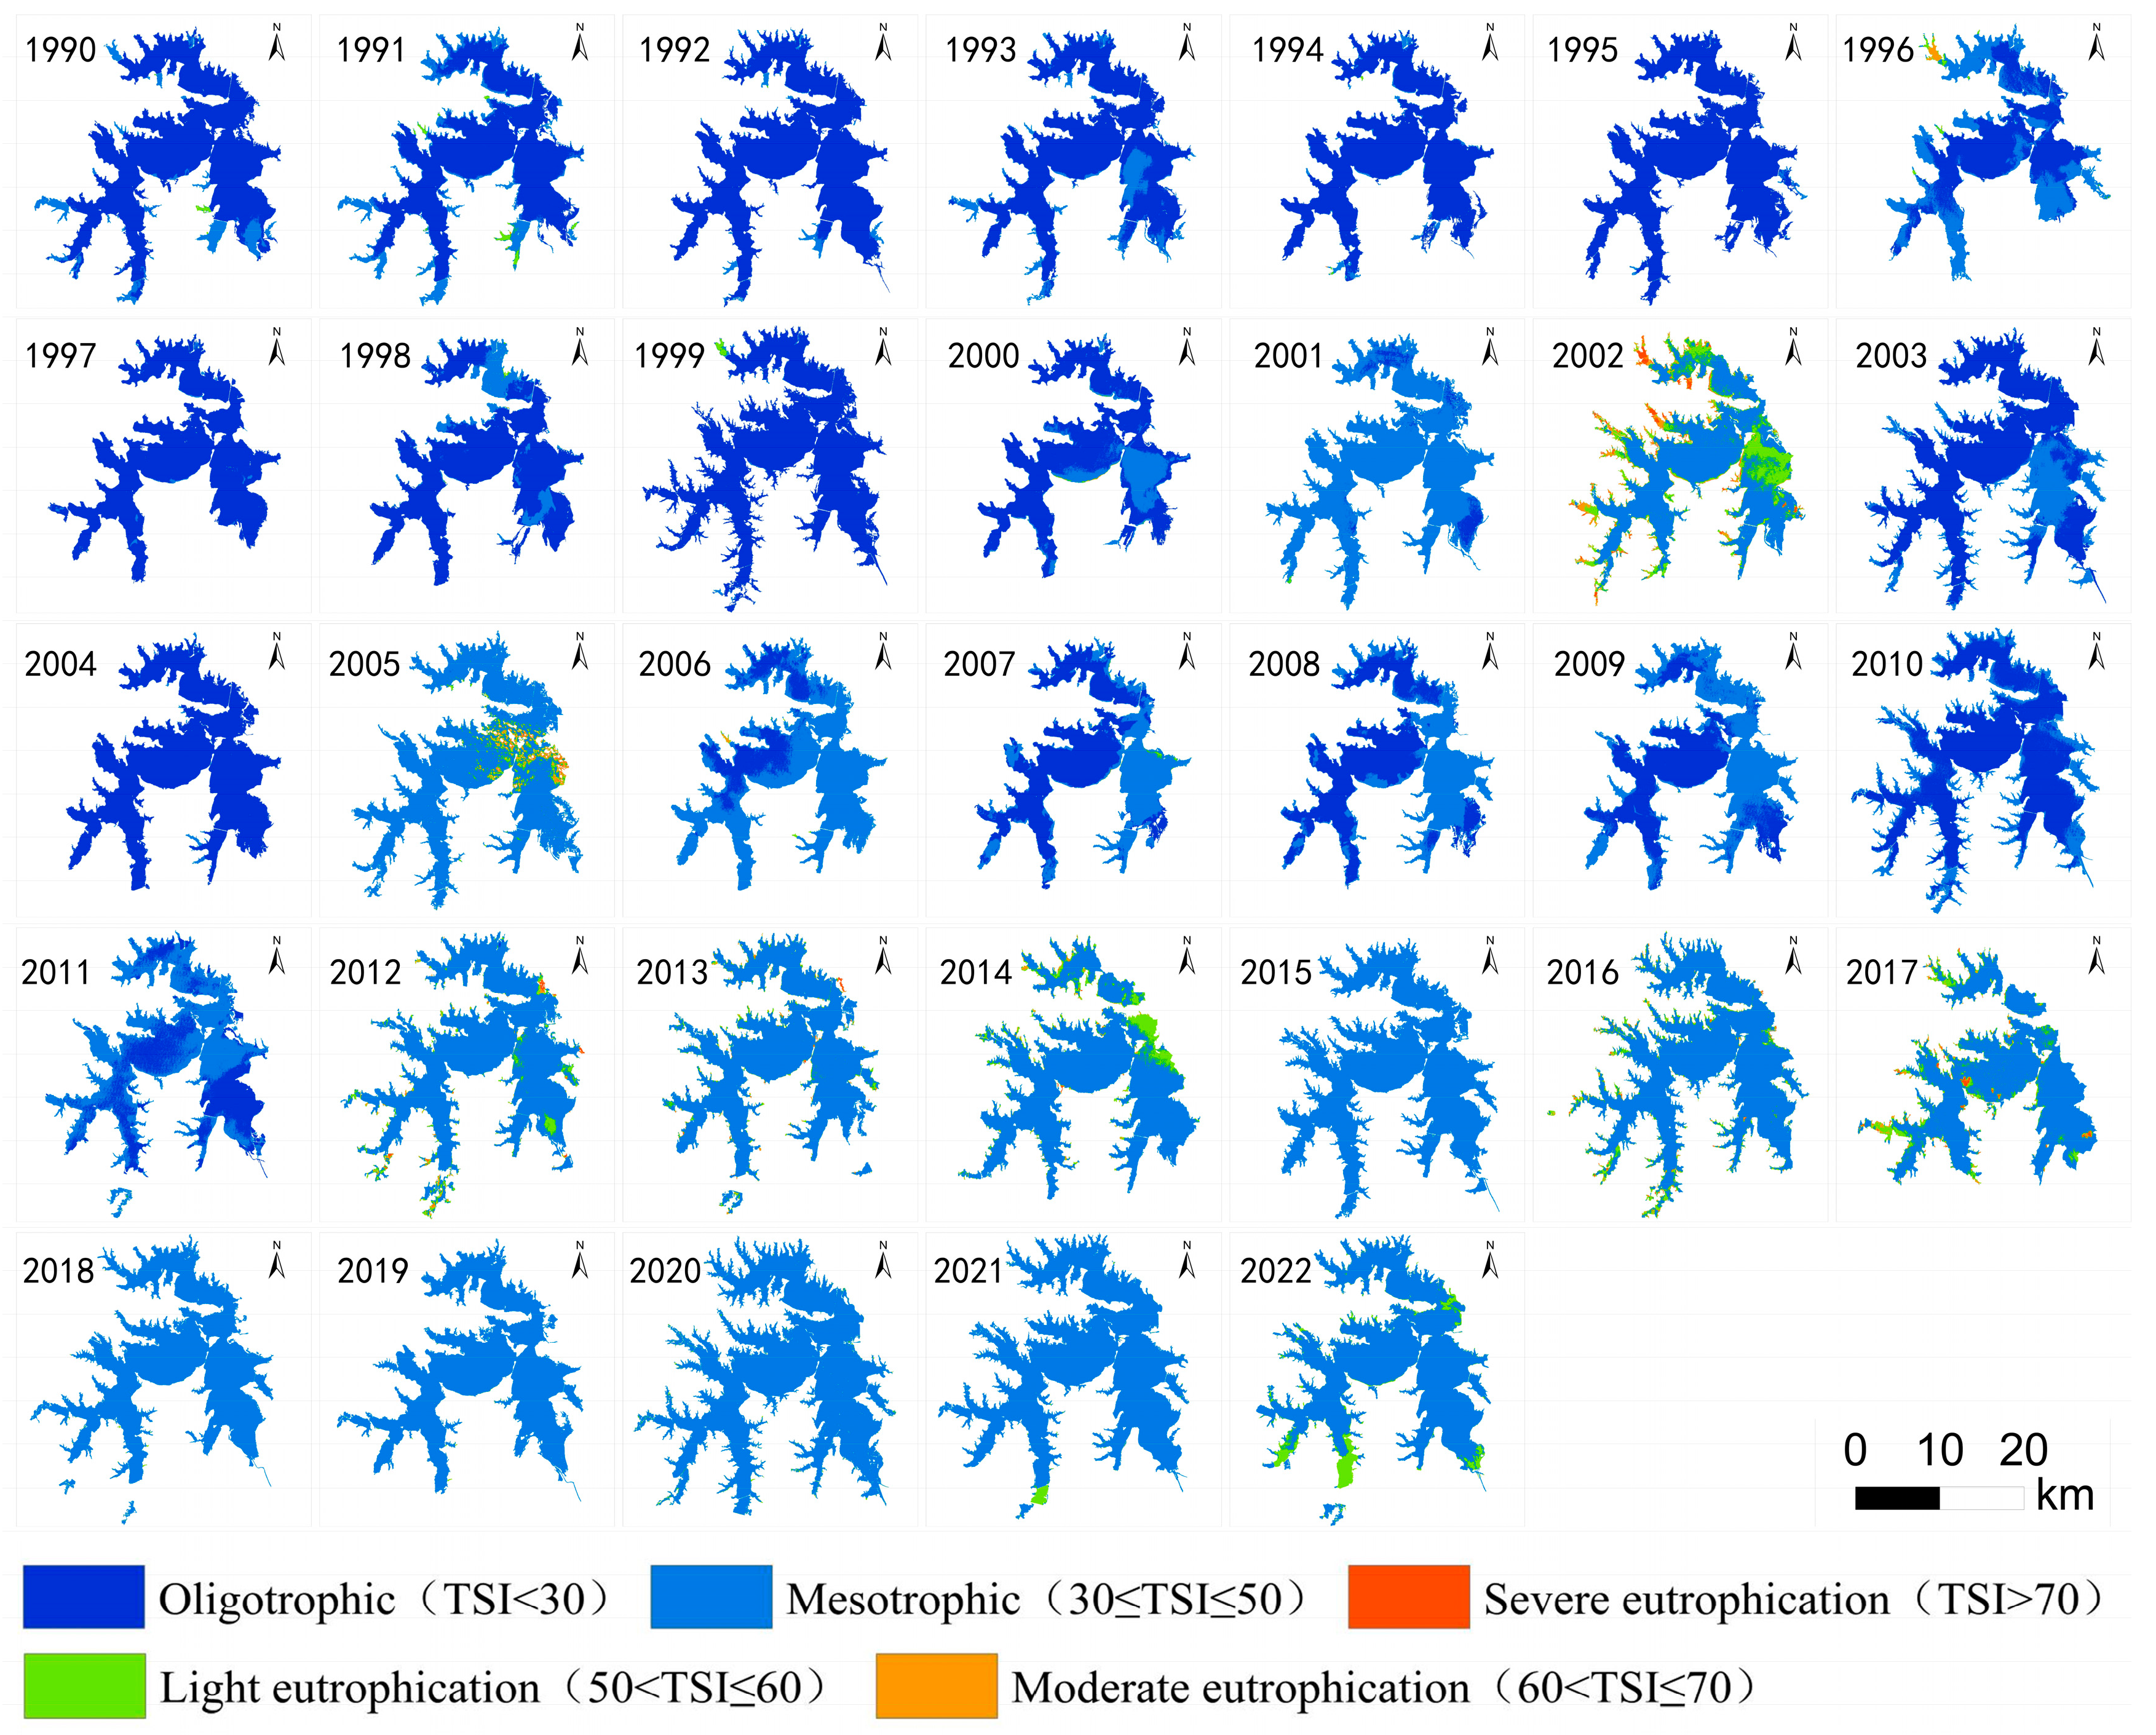
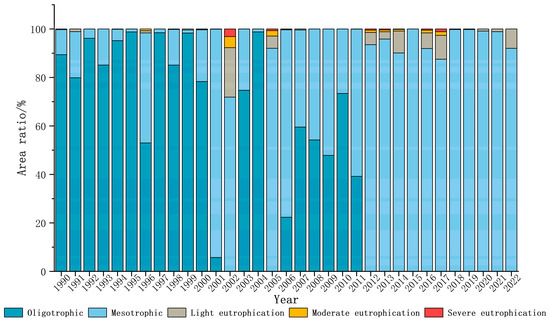
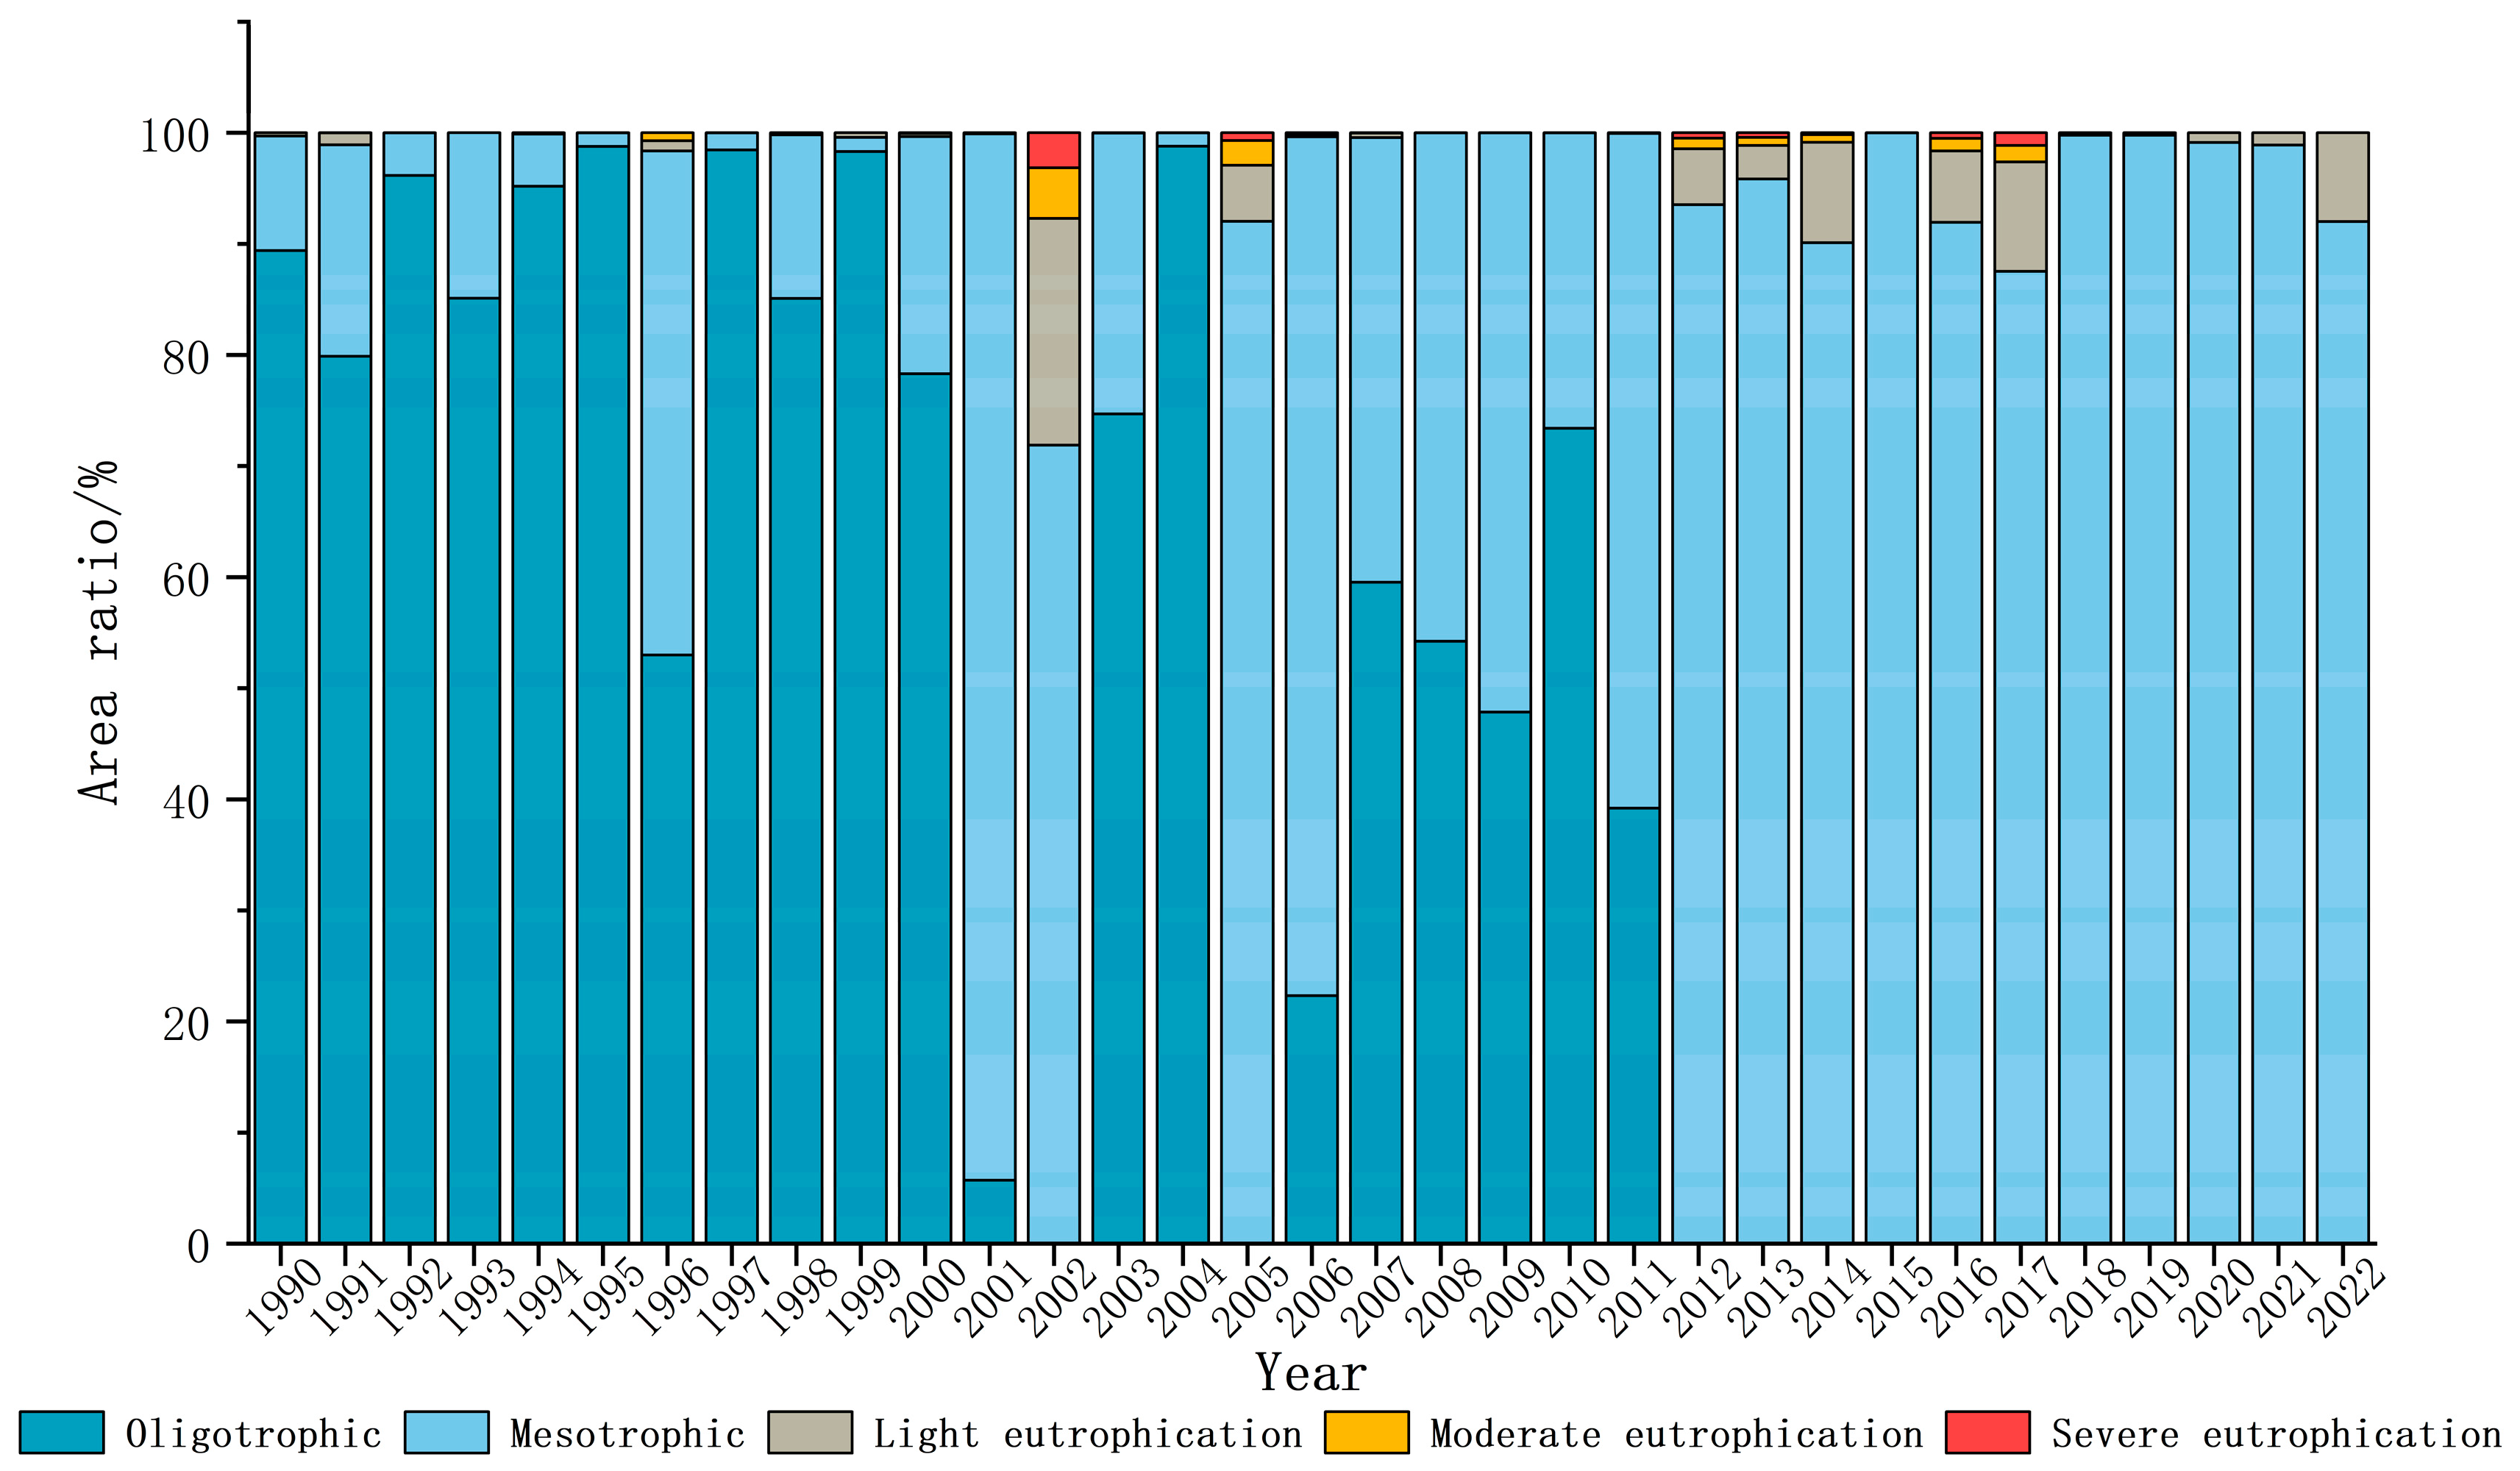
Based on a semi-analytical model, the trophic state index of the Liangzi Lake area during the summer months (June to September) from 1990 to 2022 was determined. Summer-season imagery was specifically selected to ensure the accuracy and temporal comparability of long-term trophic state retrieval. During this period, phytoplankton biomass typically reaches its annual maximum, and water color exhibits strong sensitivity to nutrient-induced optical variations, thereby enhancing the detectability of trophic gradients. In addition, historical Landsat observations provide substantially higher data availability and lower cloud contamination in summer compared with other seasons, enabling the construction of a robust and temporally consistent multi-decadal dataset. Conversely, imagery acquired in spring, autumn, and winter often suffers from cloud cover, unstable optical properties, and irregular temporal coverage, making it unsuitable for reliable interannual analyses. Therefore, the exclusive use of summer imagery strengthens both the accuracy and comparability of the retrieved trophic conditions across years. The trophic level and water quality status of the water body were classified in accordance with the trophic state index, as illustrated in Figure 3 and Figure 4.
Figure 3.
Spatial distribution of trophic state classes in Liangzi Lake from 1990 to 2022.
Figure 4.
Changes in the percentage of area in each trophic state class.
As illustrated in Figure 3, the nutritional status of Liangzi Lake has progressively deteriorated over time. Prior to 2000, Liangzi Lake was predominantly oligotrophic, exhibiting minimal anthropogenic disturbance. During the mid-study period, the lake’s nutritional status transitioned rapidly from oligotrophic to mesotrophic, notably in 2002 and 2005, when extensive eutrophication occurred, particularly in the East Liangzi Lake area and the narrow waters along the reservoir edges. In recent years, rapid economic and social development within the watershed has led to a continuous decline in water quality in Liangzi Lake. Currently, the entire lake is classified as mesotrophic, with certain areas nearing eutrophic conditions. The eutrophic regions of Liangzi Lake are expanding annually, demonstrating a trend of spreading from the shores toward the center.
As illustrated in Figure 4, prior to 2004, the water quality of Liangzi Lake was classified as good, with the entire lake predominantly exhibiting oligotrophic characteristics. However, between 2001 and 2002, there was a marked deterioration in water quality, leading to significant eutrophication across extensive areas. In 2003, the eutrophic conditions were mitigated, resulting in a notable recovery of water quality and a significant decrease in the overall nutritional levels of the lake. From 2005 to 2011, certain areas of the lake transitioned from oligotrophic to mesotrophic states, with partial eutrophication observed in 2005. Beginning in 2012, all lake waters fully transitioned to mesotrophic levels, with varying degrees of eutrophication becoming evident. In recent years, the area of eutrophic waters has exhibited a consistent trend of annual expansion.
3.2. Spatio-Temporal Analysis of Landscape Features in Liangzi Lake
The landscape features of the Liangzi Lake Basin demonstrate significant complexity and diversity. The land use structure is primarily characterized by cultivated land. From 1990 to 2022, the land use pattern exhibited structural adjustments, with the proportion of cultivated land decreasing from 96.01% to 93.89%. Conversely, the proportion of forest land experienced a slight increase, rising from 3.56% to 3.98%. Notably, the proportion of forestland increased markedly around 2007, which corresponds to a series of ecological restoration measures implemented in the basin between 2005 and 2008, including afforestation activities, watershed soil and water conservation projects, and wetland vegetation rehabilitation. These coordinated restoration efforts substantially expanded the area classified as forestland. Simultaneously, the area of impervious surface cover showed a notable growth trend, increasing from 0.43% to 2.12%. This trend reflects an escalation in the intensity of human activities within the region (Table 4).
Table 4.
Land use composition and landscape pattern indices of the Liangzi Lake watershed from 1990 to 2022.
Based on Digital Elevation Model (DEM) data, the Liangzi Lake Basin was spatially divided into 283 sub-basins, each defined as an independent analytical unit. The composition of land use types within each sub-basin was extracted and statistically analyzed. The areas of the sub-basins range from 1.17 to 12.91 km2, with an average area of 3.01 km2 and a coefficient of variation of 52.82%. Among all sub-basins, the maximum proportion of forest land area is 4.66%, with an average proportion of 2.74% and a coefficient of variation of 1.91%. The maximum proportion of impervious surface area is 2.12%, with an average proportion of 1.51% and a coefficient of variation of 2.73%.
During the study period, the watershed landscape pattern underwent significant changes. Patch density (PD) decreased from 7.72 patches/hm2 in 1990 to 6.08 patches/hm2, demonstrating an initial decline followed by an increase, reaching its lowest point of 4.35 patches/hm2 in 2006. The largest patch index (LPI) doubled in 1992 and subsequently stabilized, indicating that the Liangzi Lake watershed experienced high levels of human disturbance beginning in 1992. The landscape shape index (LSI) fluctuated continuously throughout the study period, reflecting constant changes in landscape shape complexity due to the yearly development and protection efforts in Liangzi Lake. The Shannon diversity index (SHDI) increased from 0.18 in 1990 to 0.27, indicating enhanced spatial heterogeneity in the landscape of the study area. The contagion index (CONTAG) exhibited an initial increase followed by a decrease during the study period, rising from 86.88 to 90.44 and then declining to 81.56, which suggests a continuous deterioration of landscape connectivity in the study area after 1999. The differences in patch density (PD) among sub-watersheds were most pronounced, with a distribution range of 1.22 to 1111.11 patches/hm2 and a coefficient of variation of 2.84% (Table 5). It should be noted that the PD values in Table 4 represent the landscape pattern of the entire basin, whereas the PD values in Table 5 are calculated at the sub-basin scale. Due to the smaller spatial units of sub-basins, Patch Density naturally increases, reflecting the scale dependency of landscape metrics.
Table 5.
Sub-basin land use type composition and landscape pattern indices.
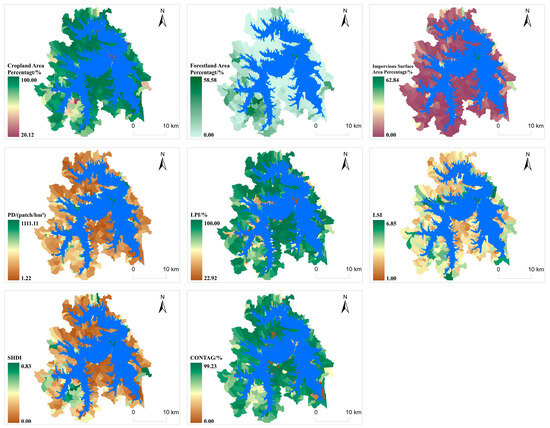
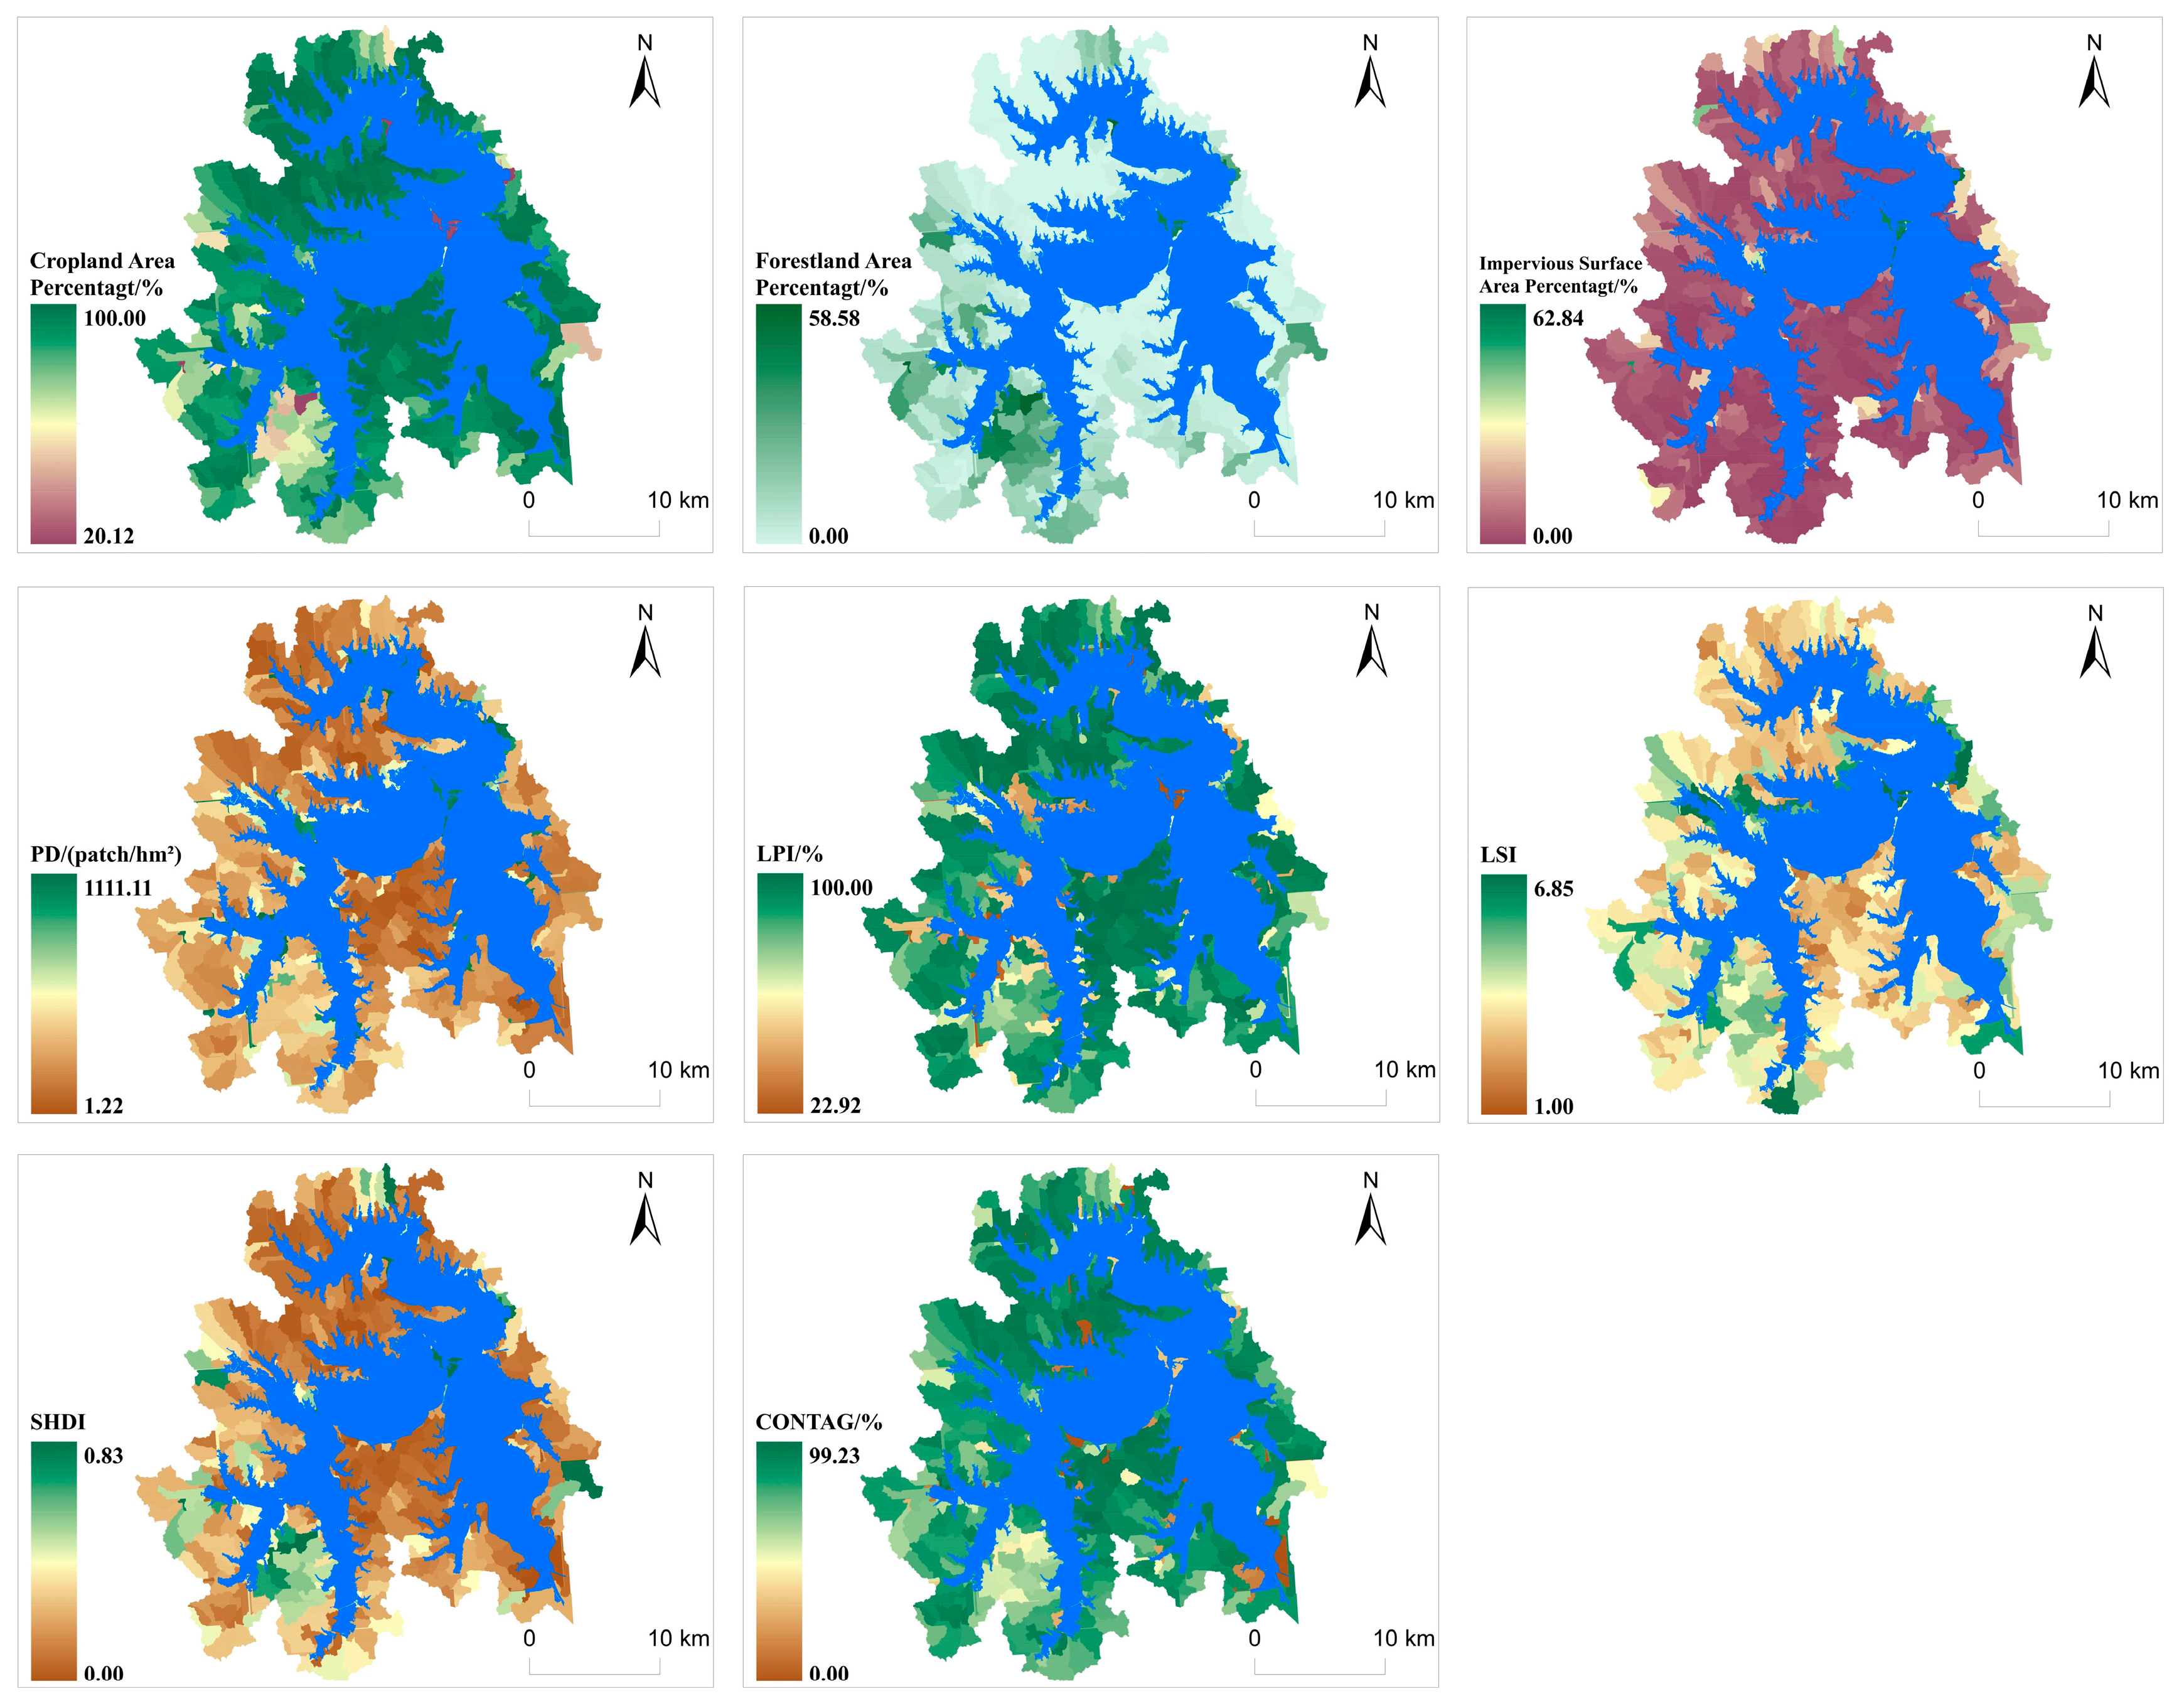
Within the study area, cropland is the predominant land use type, constituting an average area proportion of 95.74%, and is distributed across all regions outside the water bodies. Forestland comprises less than 5% of the total area, primarily located in the southwestern part of the study area. Impervious surfaces are concentrated in residential areas adjacent to the shore and in tourism development zones around Liangzi Lake. The landscape pattern indices of the watershed exhibit similar spatial distribution characteristics, with patch density (PD), landscape shape index (LSI), and Shannon diversity index (SHDI) demonstrating low-value clustering within the study area. Conversely, the largest patch index (LPI) and contagion index (CONTAG) reveal high-value clustering (Figure 5).
Figure 5.
Spatial distribution of sub-basin averages for each indicator.
3.3. Contribution of Landscape Features
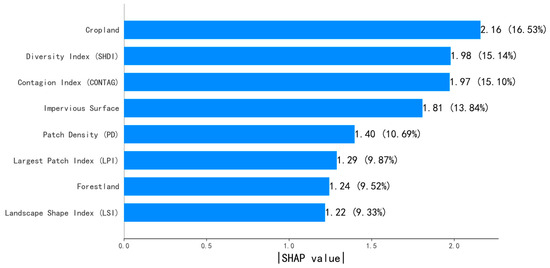
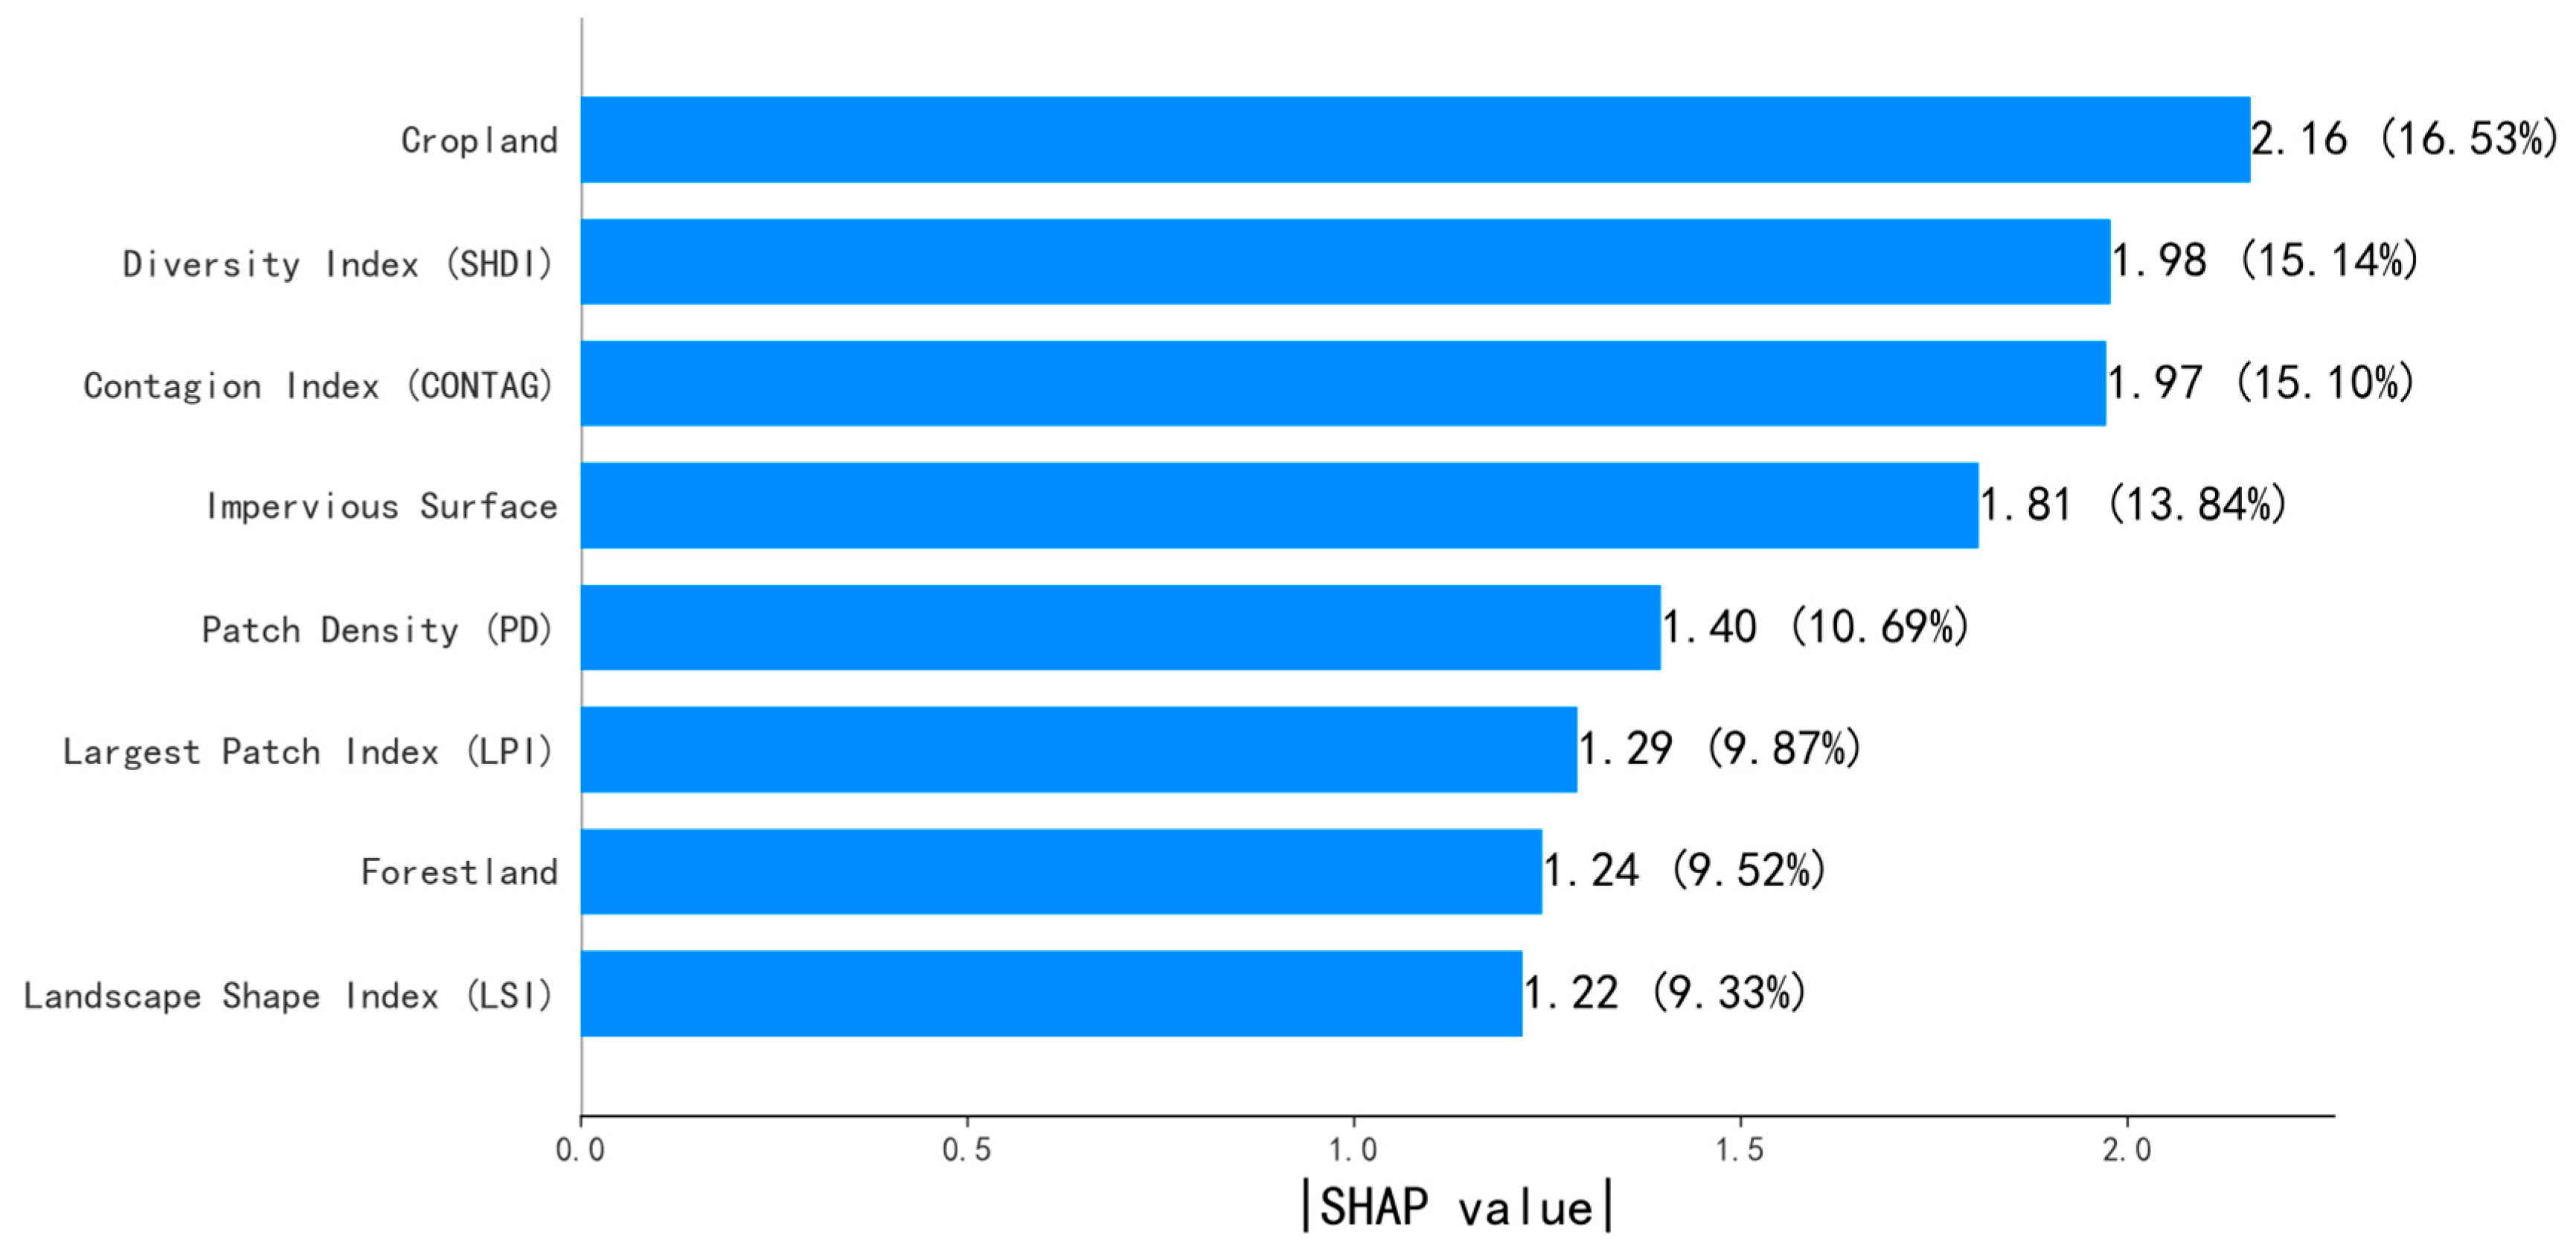
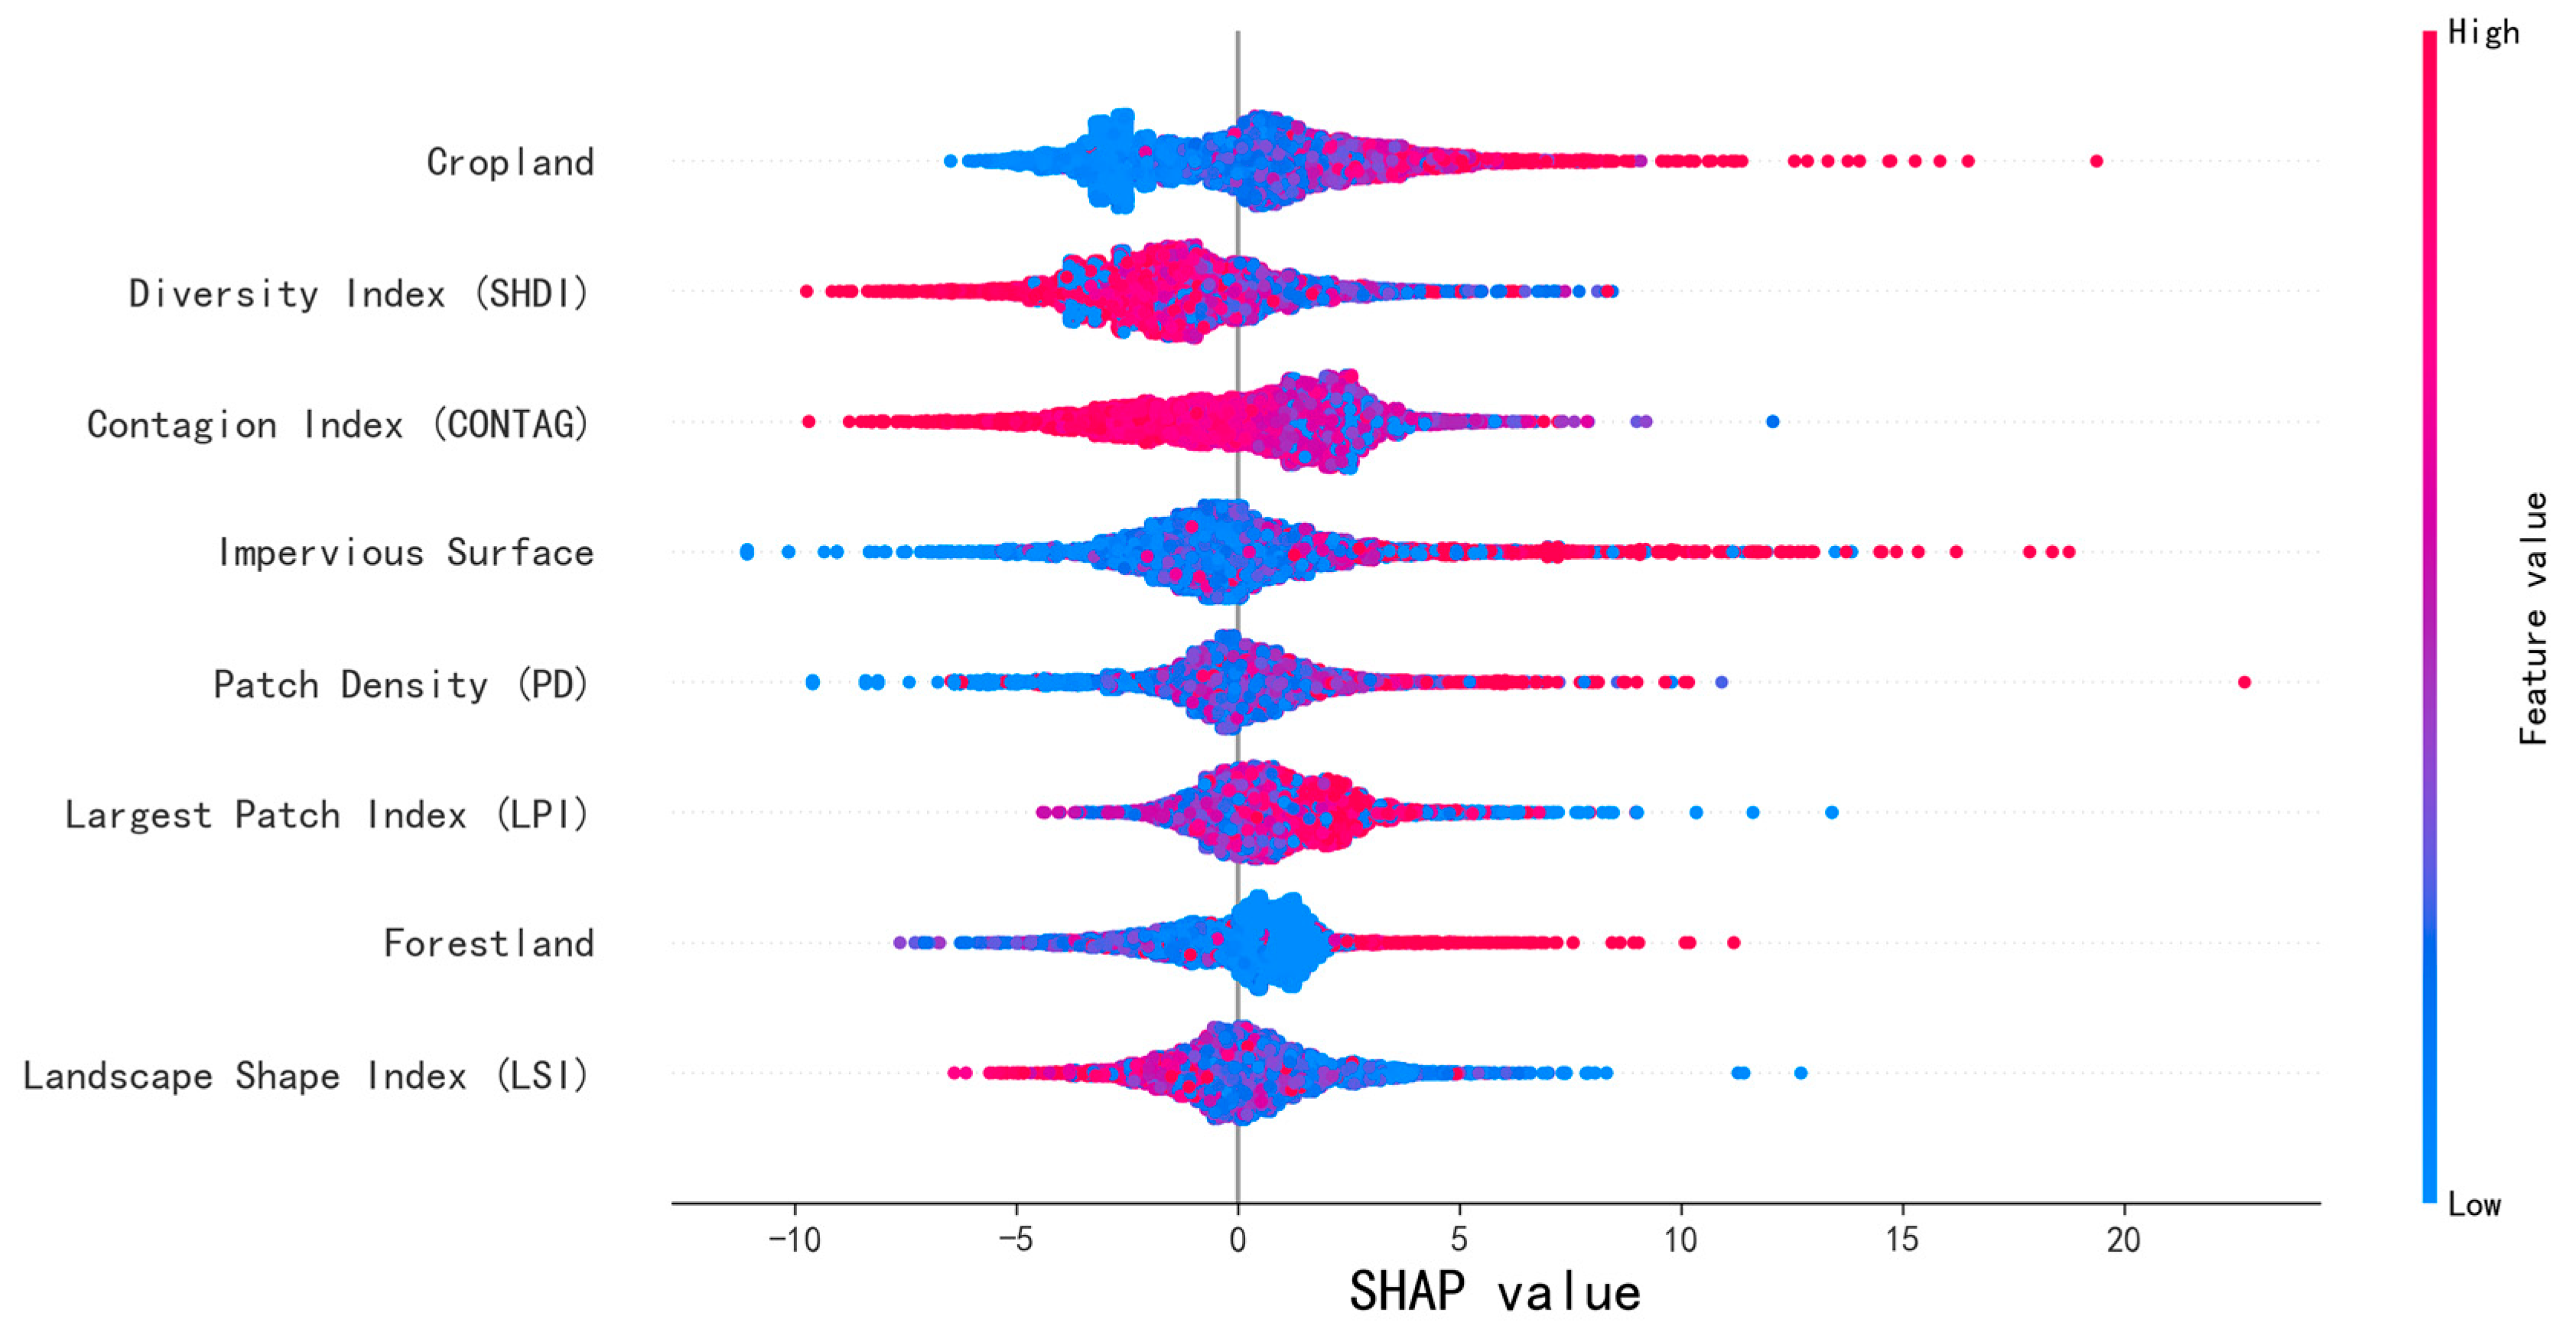
To quantify how landscape characteristics influence the trophic state of Liangzi Lake, the XGBoost model was used to estimate the relative importance of landscape composition and configuration metrics at the sub-basin scale. SHAP values were then computed to decompose the model predictions into feature-level contributions, enabling both magnitude- and direction-based interpretation of individual landscape effects. Feature contributions were ranked according to their global importance (see Figure 6 and Figure 7). To ensure methodological transparency and comparability across features, the contribution rates reported in this study were calculated as the normalized sum of absolute SHAP values across all samples, which leverages the additive property of SHAP and provides an objective measure of each landscape factor’s average influence on model predictions.
Figure 6.
Ranking the contribution of landscape features to the trophic state of water bodies in the Liangzi Lake basin.
Figure 7.
The contribution and direction of landscape features to the trophic state of water bodies in the Liangzi Lake basin.
The results indicate that the contribution of landscape pattern percentage indices to water eutrophication in the Liangzi Lake watershed is significantly higher than that of land use structure, accounting for 60.12% and 39.88%, respectively. Among the various land use types and landscape pattern indices, cultivated land exhibits the highest contribution at 16.53%, followed by the Shannon Diversity Index (SHDI), Contagion Index (CONTAG), impervious surfaces, Patch Density (PD), Largest Patch Index (LPI), forest land, and Landscape Shape Index (LSI).
Analysis of eigenvalues indicates that the proportions of cultivated land, forest land, impervious surface area, and Patch Density (PD) significantly positively influence the trophic state index of water bodies in the Liangzi Lake Basin. Conversely, the Shannon Diversity Index (SHDI) and Contagion Index (CONTAG) demonstrate a negative effect on water eutrophication. Although the Largest Patch Index (LPI) exerts a relatively weak influence on the trophic state index, it still exhibits a certain promoting effect.
Beyond the independent contributions of individual variables, joint SHAP analysis reveals that interactions between land use structure and landscape configuration further shape eutrophication outcomes. Sub-basins characterized by both high cropland proportion and high landscape fragmentation (PD) display amplified positive SHAP responses, indicating that fragmentation intensifies the eutrophication pressure associated with cropland. Similarly, high cropland combined with low CONTAG—representing dispersed and weakly aggregated landscapes—yields stronger positive SHAP values than either factor alone. In contrast, cropland embedded within highly aggregated or compositionally diverse landscapes (high CONTAG or high SHDI) shows notably weaker SHAP contributions. These patterns suggest that the ecological effect of cropland is not uniform but is modulated by the surrounding landscape configuration, demonstrating that composition and configuration jointly influence spatial variability in trophic conditions.
In addition to the overall contribution patterns, the SHAP analysis reveals marked spatial heterogeneity among the sub-basins of the Liangzi Lake Basin. High cropland values are consistently associated with positive SHAP contributions, demonstrating that sub-basins with extensive cropland tend to exhibit elevated trophic state levels. In contrast, sub-basins with low cropland proportions show predominantly negative or weak SHAP responses. This distinct separation between high- and low-cropland sub-basins highlights cropland distribution as a primary driver of spatial differentiation in eutrophication.
Shannon Diversity Index (SHDI) and Contagion Index (CONTAG) exhibit similar spatial tendencies. Higher values of both indices are associated with negative SHAP contributions, indicating that sub-basins characterized by either greater landscape diversity or stronger patch aggregation generally correspond to lower predicted TSI levels. The wide dispersion of SHAP values for these two indices suggests that the strength of their influence varies substantially among sub-basins, reflecting distinct underlying landscape configurations.
Impervious surface cover exhibits a more localized yet distinct contribution pattern. Sub-basins with notable residential or tourism development show concentrated positive SHAP values, whereas those with minimal impervious cover exhibit nearly negligible influence. This indicates that the spatial distribution of human-built surfaces contributes unevenly to eutrophication across the basin.
For Patch Density (PD), SHAP values are generally higher and positive when patch density is high, whereas low PD values cluster around zero or slightly negative SHAP values. This pattern suggests that more fragmented landscapes are more likely to be associated with higher predicted TSI, and that variation in fragmentation intensity among sub-basins is an important source of spatial heterogeneity. Largest Patch Index (LPI) displays a more balanced SHAP distribution with both positive and negative contributions: sub-basins characterized by very large dominant patches can either enhance or attenuate TSI depending on the prevailing land-cover type, highlighting the context-dependent role of patch dominance. Landscape Shape Index (LSI) shows a moderate spread of SHAP values on both sides of zero, with higher LSI values tending slightly toward positive contributions, implying that increased landscape shape complexity can, under certain spatial configurations, contribute to higher trophic states.
Patch Density (PD), Largest Patch Index (LPI), and Landscape Shape Index (LSI) also show substantial SHAP dispersion, indicating considerable variation in their influence on TSI across sub-basins. Higher PD values are generally associated with positive SHAP contributions, suggesting that more fragmented landscapes correspond to higher predicted trophic levels, whereas low PD areas contribute minimally. LPI exhibits bidirectional effects, contributing positively in sub-basins dominated by large cropland patches but tending toward neutral or slightly negative effects where large forest patches prevail. LSI shows moderate variability, with positive contributions in some sub-basins and weaker effects in others. Overall, the heterogeneous SHAP distributions of these metrics highlight the spatially dependent nature of landscape configuration effects and their modulation by the structural characteristics of individual sub-basins.
These results demonstrate that spatial heterogeneity in eutrophication arises not from any single landscape feature but from the combined variability in both landscape composition and configuration across sub-basins.
4. Discussion
4.1. Response Relationship of Nutritional Status to Land Use Structure
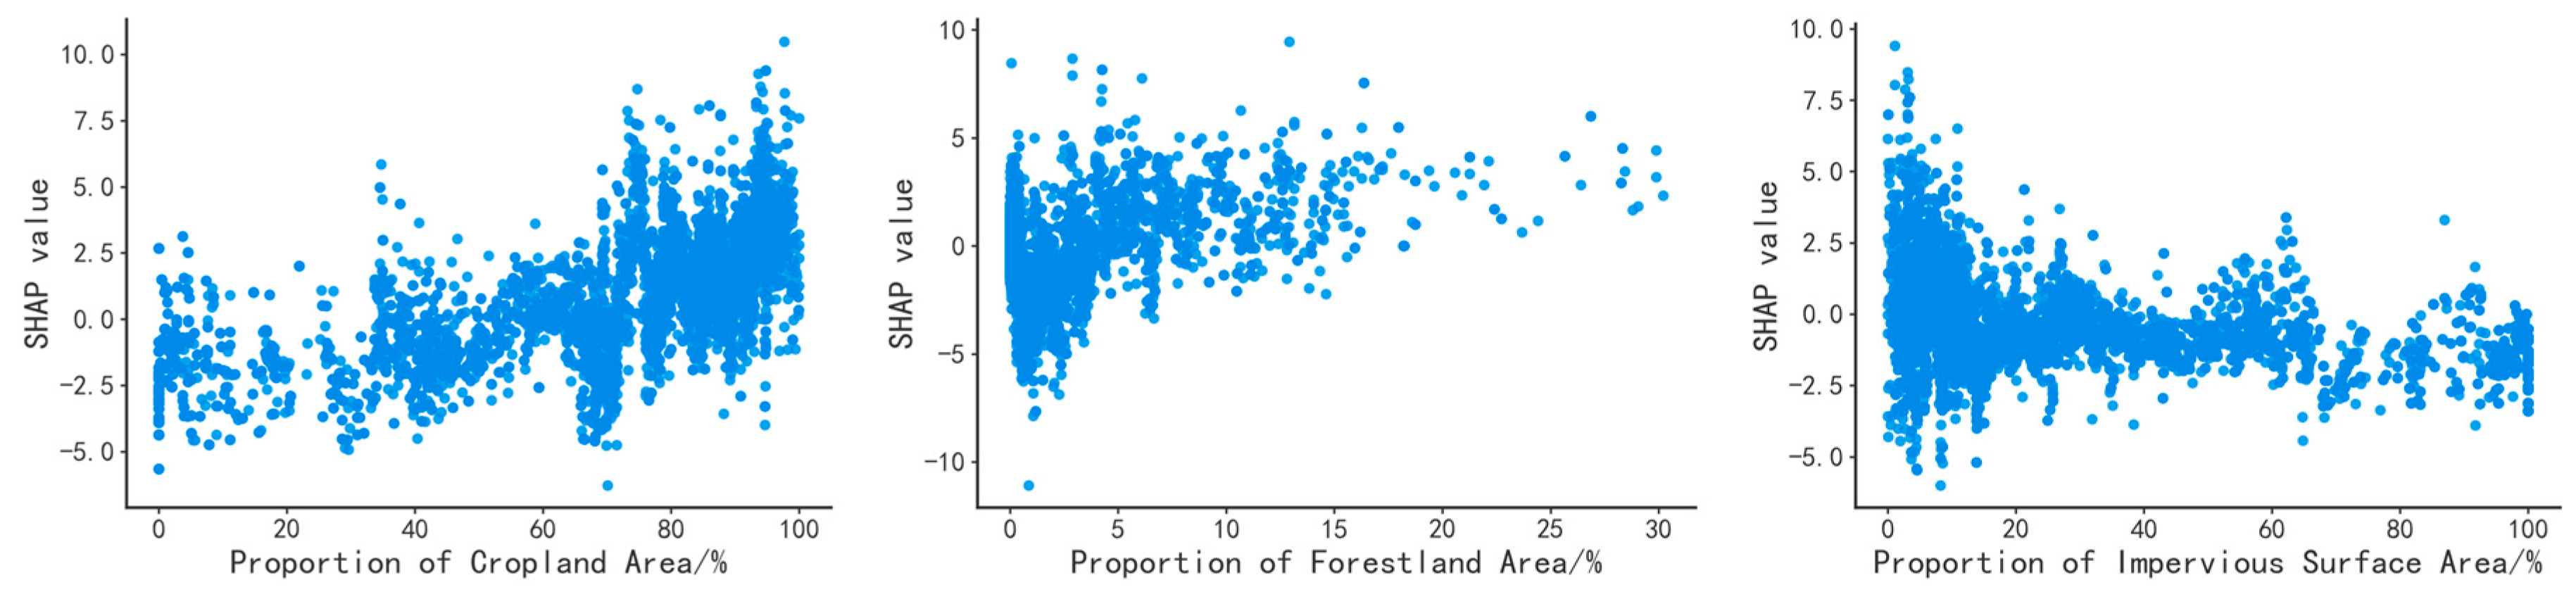
Related research indicates that the land use structure within watersheds plays a crucial regulatory role in key water quality elements, such as nitrogen and phosphorus [34]. By establishing the dependency relationship between land use structure and SHAP values (see Figure 8), this study analyzes the relationship between landscape characteristics and their impact on the nutrient status of water bodies. The results demonstrate that land use structure accounts for 39.89% of the overall nutrient status of water bodies in the Liangzi Lake watershed.
Figure 8.
Dependence of land use types on SHAP values.
It is noteworthy that the impact of landscape characteristics on water eutrophication does not directly affect water quality indicators; rather, it is mediated and amplified through hydrological processes. At the watershed scale, surface runoff, groundwater seepage, and the migration and transformation of pollutants collectively form a chain of interaction between landscape characteristics and water quality. Changes in landscape characteristics indirectly influence the nutrient accumulation process in water bodies by regulating runoff generation, confluence pathways, and pollutant export fluxes.
During agricultural production, the excessive application of pesticides and fertilizers significantly increases the migration risk of pollutants such as nitrogen and phosphorus, particularly under heavy rainfall or irrigation conditions. These nutrients can rapidly enter lakes through surface runoff, constituting a typical form of agricultural non-point source pollution [35]. The increase in the proportion of cultivated land significantly enhances nutrient concentrations in runoff, thereby accelerating the process of water eutrophication [36]. Additionally, urban areas, due to the expansion of impervious surfaces, generate large volumes of surface runoff that converge rapidly after rainfall, easily washing road dust, domestic sewage, and harmful substances directly into water bodies, thereby creating high-intensity point or non-point source pollution [37].
The impervious surfaces in the study area are predominantly located in residential zones surrounding the lake and in tourism development areas. These surfaces impede the natural infiltration of rainwater, leading to increased total runoff volume and flow velocity. This not only diminishes the purification capabilities of underground filtration zones but also places additional stress on urban drainage systems. Significant amounts of surface runoff transport nutrients directly into the lake, disrupting the filtration and buffering functions inherent in the natural hydrological cycle. This disruption triggers ecological risks, including declines in dissolved oxygen levels and algal blooms, which may also pose health risks to humans through bioaccumulation in the food chain. Research [38] indicates that water quality deteriorates significantly in areas where impervious surface coverage exceeds 10%, with nitrogen and phosphorus loads in highly urbanized rivers reaching 5 to 10 times those found in natural areas.
Forest land functions as a natural ecological buffer zone, effectively regulating nutrient input by slowing surface runoff and enhancing soil infiltration capacity. However, the findings indicate that while forest land can modulate hydrological processes and reduce soil erosion, it paradoxically contributes to the nutrient enrichment of Liangzi Lake to some extent. This phenomenon may be attributed to the fact that existing forest land is predominantly located in marginal areas distant from the lake shore, resulting in limited spatial overlap with the primary pathways of pollutant migration. Consequently, this restricts its direct interception and adsorption of nutrients such as nitrogen and phosphorus. Furthermore, the low coverage rate of forest land hampers its ability to effectively regulate hydrological processes and function as an ecological buffer across the entire watershed scale.
4.2. Response Relationship of Trophic Status to Landscape Pattern
The landscape pattern index elucidates the intricate mechanisms governing the relationship between landscape configuration and water quality from a spatial perspective [39]. Various landscape dimensions, including patch density, dominance, shape complexity, type diversity, and spatial aggregation, are pivotal in nutrient interception, adsorption, and purification processes, thereby significantly influencing the eutrophication dynamics of aquatic systems [40]. Patch density (PD) and the landscape shape index (LSI) are key drivers of pollutant migration, arising from landscape fragmentation and patch morphological complexity, respectively [41].
In watersheds characterized by high patch density, landscape fragmentation intensifies the dispersion of surface runoff pathways and the severity of soil erosion, facilitating the penetration of nutrients through the surface cover layer via runoff. This process results in a ‘source-sink’ imbalance, markedly increasing the transport flux to water bodies. Conversely, complex patch shapes extend pollutant migration pathways, enhance ecological interface contact areas, and foster nutrient retention, adsorption, and biological degradation, thereby establishing a natural ‘ecological filtration’ barrier. In the Liangzi Lake Basin, this mechanism is particularly evident in the eastern sub-basins, where cropland is arranged in linear strips along tributaries and exhibits high levels of fragmentation. Such fragmentation disrupts natural buffer zones and creates aligned hydrological pathways that accelerate the transport of nitrogen- and phosphorus-rich runoff into the lake. In contrast, areas dominated by large, contiguous forest patches generally maintain strong landscape connectivity, which enhances ecological interception, slows surface runoff, and increases nutrient retention, thereby reducing the likelihood of nutrient enrichment in adjacent water bodies [42].
Reduced landscape heterogeneity and diversity diminish the ecosystem’s synergistic purification functions, exacerbating the spread of non-point source pollution. In contrast, a well-planned mosaic of natural vegetation patches and artificial landscapes can enhance surface roughness and improve soil permeability, effectively slowing nutrient migration rates. The Shannon Diversity Index (SHDI) demonstrates a significant inverse inhibitory effect on the nutrient status of water bodies in the Liangzi Lake basin. It reflects the diversity of species or land use types within the landscape, with greater diversity indicating a more complex landscape structure and a more stable ecosystem. High-diversity landscapes can efficiently disperse and filter nutrients, thereby reducing the concentration and transport of pollutants. Elevated SHDI values signify greater ecological stability and stronger self-purification capacity within the basin, consequently inhibiting the occurrence of water eutrophication. A high Contagion Index (CONTAG) signifies stronger connectivity of natural landscapes, which intercepts, adsorbs, and filters nutrients in water, creating an effective barrier for material exchange and filtration between water bodies and surrounding areas, thus reducing nutrient input. The maximum patch index (LPI) shows a weak promoting effect on water eutrophication, suggesting that single-use land types or areas of high-intensity human activity dominate the landscape, potentially leading to declines in biodiversity, increased soil erosion, or pollution dispersion [43]. Compared with lake basins characterized by relatively homogeneous landscape structures, where eutrophication dynamics are primarily shaped by uniform agricultural expansion or concentrated urban development, the Liangzi Lake Basin exhibits a considerably more heterogeneous spatial configuration. The Liangzi Lake basin consists of multiple hydrologically semi-independent sub-basins that differ markedly in cropland proportion, forest cover continuity, and landscape fragmentation. Such structural contrasts—particularly the juxtaposition of cropland-dominated and forest-dominated sub-basins, the presence of linear cropland–river interfaces, and variability in patch complexity—create spatially differentiated pathways of nutrient transport and retention. Consequently, trophic responses in Liangzi Lake show heightened sensitivity to localized landscape configuration, reflecting the basin’s intrinsic structural heterogeneity. This configurational dependence underscores the necessity of adopting sub-basin-specific management strategies rather than uniform basin-wide interventions.
5. Conclusions
Remote sensing data and semi-analytical methods were employed to elucidate the spatiotemporal variations in the trophic state index in Lake Liangzi from 1990 to 2022. From 1990 to 2000, the overall water quality of Lake Liangzi was classified as good, primarily characterized as oligotrophic. However, between 2001 and 2011, water quality began to decline, with the trophic state oscillating mainly between oligotrophic and mesotrophic conditions. After 2012, the lake predominantly exhibited mesotrophic characteristics, with eutrophic areas primarily located near tributaries and inlets, while the eastern region displayed significantly higher levels of eutrophication compared to the western part.
By constructing the XGBoost machine learning algorithm and integrating the SHAP interpretable method, this study investigated the mechanisms influencing water eutrophication related to land use structure evolution and landscape spatial heterogeneity in the Liangzi Lake sub-basin. The results indicate that the landscape pattern index significantly contributes to water eutrophication (60.11%), which is considerably higher than the contribution from land use structure (39.89%). This finding underscores the crucial role of landscape spatial configuration in regulating lake nutrient status. In the specific ranking of feature contributions, cropland had the most pronounced impact, followed by the Shannon diversity index (SHDI), contagion index (CONTAG), impervious surfaces, patch density (PD), largest patch index (LPI), forestland, and landscape shape index (LSI).
Several limitations of this study should still be acknowledged. First, trophic-state retrieval is based solely on summer Landsat imagery, restricting the ability to assess seasonal variability and hydrological influences on eutrophication. Second, the 30 m spatial resolution of Landsat limits the detection of near-shore processes and small pollution sources, potentially reducing the precision of landscape–water interaction analysis. Third, the selected landscape metrics represent only part of the landscape characteristics and are sensitive to scale and classification accuracy, meaning that some ecological processes relevant to nutrient transport remain insufficiently captured. Finally, although the XGBoost–SHAP framework enhances interpretability, it remains an empirical model and may not fully reflect underlying ecological mechanisms. Future studies should integrate multi-season, higher-resolution data and process-based models to improve mechanistic understanding.
Author Contributions
S.F. conducted data curation, formal analysis, investigation, wrote the original draft, and wrote the review and edited the article. J.Z. conducted an investigation and a formal analysis, developed the methodology, and validated and visualized the article. S.C. administered the project, brought resources, conducted an investigation, and supervised the work. Y.Z. and Q.Y. visualized the article and conducted investigation and formal analysis. M.W. and H.L. conducted funding acquisition and administered the project. All authors have read and agreed to the published version of the manuscript.
Funding
This research was funded by the National Natural Science Foundation of China (42271318, 42201089). 2025 Annual Ecological and Environmental Scientific Research Projects of Hubei Province, Science and Technology Innovation Project of the Jiangxi Provincial Department of Natural Resources.
Data Availability Statement
Data are contained within the article.
Conflicts of Interest
Author Qi Yu was employed by the company Wuhan Zhihuiyuan Environmental Protection Technology Co., Ltd. The remaining authors declare that the research was conducted in the absence of any commercial or financial relationships that could be construed as a potential conflict of interest.
References
- Lei, P.; Zhang, J.; Zhu, J.; Tan, Q.G.; Kwong, R.; Pan, K.; Jiang, T.; Naderi, M.; Zhong, H. Algal Organic Matter Drives Methanogen-Mediated Methylmercury Production in Water from Eutrophic Shallow Lakes. Environ. Sci. Technol. 2021, 55, 10811–10820. [Google Scholar] [CrossRef] [Scilit]
- Ma, J.G.; Loiselle, S.; Cao, Z.G.; Qi, T.C.; Shen, M.; Luo, J.H.; Song, K.S.; Duan, H.T. Unbalanced impacts of nature and nurture factors on the phenology, area and intensity of algal blooms in global large lakes: MODIS observations. Sci. Total Environ. 2023, 880, 163376. [Google Scholar] [CrossRef] [Scilit] [PubMed]
- Jiang, X.Y.; Du, Q.W.; Huang, X.; She, D.L. Temporal and spatial characteristics of water quality in the Taihu basin Jiangsu section linkage with landscape patterns. J. Soil Water Conserv. 2025, 39, 361–370. [Google Scholar] [CrossRef]
- Yang, Z.X.; Li, Y.X.; Zhu, G.W.; Kang, L.J.; Li, N.; Zhang, Y.L.; Qin, B.Q. Control factors of cyanobacterial bloom area in Lake Taihu, China (2003–2023). J. Lake Sci. 2025, 37, 734–751. [Google Scholar] [CrossRef] [Scilit]
- Shen, W.Z.; Zhang, L.; Li, S.S.; Zhuang, Y.H.; Li, W.C.; Du, Y.; Qin, B.Q. Paradox of lake nitrogen concentration change response to watershed management: Case study of China. J. Hydrol. 2024, 642, 131900. [Google Scholar] [CrossRef] [Scilit]
- Tao, S.L.; Fang, J.Y.; Ma, S.H.; Cai, Q.; Xiong, X.Y.; Tian, D.; Zhao, X.; Fang, L.Q.; Zhang, H.; Zhu, J.L.; et al. Changes in China’s lakes: Climate and human impacts. Natl. Sci. Rev. 2020, 7, 132–140. [Google Scholar] [CrossRef] [Scilit]
- Qin, B.Q.; Gao, G.; Zhu, G.W.; Zhang, Y.L.; Song, Y.Z.; Tang, X.M.; Xu, H.; Deng, J.M. Lake eutrophication and its ecosystem response. Chin. Sci. Bull. 2013, 58, 961–970. [Google Scholar] [CrossRef] [Scilit]
- Zhu, G.W.; Xu, H.; Zhu, M.Y.; Zou, W.; Guo, C.X.; Ji, P.F.; Da, W.Y.; Zhou, Y.Q.; Zhang, Y.L.; Qin, B.Q. Changing characteristics and driving factors of trophic state of lakes in the middle and lower reaches of Yangtze River in the past 30 years. J. Lake Sci. 2019, 31, 1510–1524. [Google Scholar] [CrossRef] [Scilit]
- Cho, E.; Choi, M. Regional scale spatio-temporal variability of soil moisture and its relationship with meteorological factors over the Korean peninsula. J. Hydrol. 2014, 516, 317–329. [Google Scholar] [CrossRef] [Scilit]
- de Oliveira, L.M.; Maillard, P.; de Andrade Pinto, E.J. Application of a land cover pollution index to model non-point pollution sources in a Brazilian watershed. CATENA 2017, 150, 124–132. [Google Scholar] [CrossRef] [Scilit]
- Wu, J.H.; Lu, J. Landscape patterns regulate non-point source nutrient pollution in an agricultural watershed. Sci. Total Environ. 2019, 669, 377–388. [Google Scholar] [CrossRef] [Scilit]
- Chen, L.W.; Yang, Y.T.; Ding, M.J.; Zhang, H.; Zou, F.; Wang, P.; Nie, M.H.; Huang, G.X.; Yan, C.X. Scale effects of multi-medium heavy metals in response to landscape indices in the Yuan River, China. J. Clean. Prod. 2022, 373, 133784. [Google Scholar] [CrossRef] [Scilit]
- Liu, J.; Yan, T.Z.; Bai, J.W.; Shen, Z.Y. Integrating source apportionment and landscape patterns to capture nutrient variability across a typical urbanized watershed. J. Environ. Manag. 2023, 325, 116559. [Google Scholar] [CrossRef] [Scilit]
- Zhang, J.; Li, S.Y.; Jiang, C.S. Effects of land use on water quality in a River Basin (Daning) of the Three Gorges Reservoir Area, China: Watershed versus riparian zone. Ecol. Indic. 2020, 113, 106226. [Google Scholar] [CrossRef] [Scilit]
- Xu, S.; Li, S.L.; Zhong, J.; Li, C. Spatial scale effects of the variable relationships between landscape pattern and water quality: Example from an agricultural karst river basin, Southwestern China. Agric. Ecosyst. Environ. 2020, 300, 106999. [Google Scholar] [CrossRef] [Scilit]
- Li, K.; Wang, L.; Sun, W.; Wang, X.R.; Li, Z.H. Spatial-scale effects of landscape pattern on river water quality under urbanization. J. Environ. Sci. 2020, 40, 343–352. [Google Scholar] [CrossRef]
- Xu, Q.; Wang, P.; Shu, W.; Ding, M.J.; Zhang, H. Influence of landscape structures on river water quality at multiple spatial scales: A case study of the yuan river watershed, China. Ecol. Indic. 2021, 121, 107226. [Google Scholar] [CrossRef] [Scilit]
- Wang, J.; Li, P.; Gao, H.D.; Shi, P.; Zhang, Q.L.; Yang, Q.N.; Ma, Y.Y. Preliminary study on the relationship between land use/landscape index and water quality in the upper reaches of Danjiang River. Soil Water Conserv. Res. 2018, 25, 383–389. [Google Scholar] [CrossRef]
- Yang, Q.Q.; Xu, G.L.; Yang, X.C.; Li, A.J.; Chen, C. Responses of water quality to land use & landscape pattern in the Qingyijiang River watershed. Acta Ecol. Sin. 2020, 40, 9048–9058. [Google Scholar]
- Huo, K.; Shen, W.; Wei, J.; Zhang, L.; Feng, Q.Y.; Zhuang, Y.H.; Li, S.S. Interpretable machine learning reveals the importance of geography and landscape arrangement for surface water quality across China. Water Res. 2025, 281, 123578. [Google Scholar] [CrossRef] [Scilit]
- Shi, C.Y.; Zhuang, N.N.; Li, Y.H.; Xiong, J.; Zhang, Y.; Ding, C.H.; Liu, H. Identifying factors influencing reservoir eutrophication using interpretable machine learning combined with shoreline morphology and landscape hydrological features: A case study of Danjiangkou Reservoir, China. Sci. Total Environ. 2024, 951, 175450. [Google Scholar] [CrossRef] [Scilit]
- Cheng, J.X.; An, K.D.; Long, X.F.; Liu, Z.Z.; Wang, F. Variation Characteristics and Trend Prediction of Water Quality and Trophic State in Liangzi Lake from 2001 to 2022. Environ. Monit. China 2025, 41, 100–113. [Google Scholar] [CrossRef]
- Li, L.S.; Wang, H.; Liu, K.; Ning, Y.H.; Chen, S.; Song, C.Q. The analysis of spatial distribution pattern of Chinese urban lakes and its influence factors. J. Lake Sci. 2024, 36, 587–601. [Google Scholar] [CrossRef] [Scilit]
- Niu, C.; Tan, K.; Wang, X.; Du, P.J.; Pan, C. A semi-analytical approach for estimating inland water inherent optical properties and chlorophyll a using airborne hyperspectral imagery. Int. J. Appl. Earth Obs. Geoinf. 2024, 128, 103774. [Google Scholar] [CrossRef] [Scilit]
- Lee, Z.P.; Carder, K.L.; Aenone, R.A. Deriving Inherent Optical Properties from Water Color: A Multiband Quasi-Analytical Algorithm for Optically Deep Waters. Appl. Opt. 2002, 41, 5755–5772. [Google Scholar] [CrossRef] [Scilit]
- Shi, K.; Zhang, Y.L.; Song, K.S.; Liu, M.L.; Zhou, Y.Q.; Zhang, Y.B.; Li, Y.; Zhu, G.W.; Qin, B.Q. A semi-analytical approach for remote sensing of trophic state in inland waters: Bio-optical mechanism and application. Remote Sens. Environ. 2019, 232, 111349. [Google Scholar] [CrossRef] [Scilit]
- Chen, N.C.; Wang, S.Q.; Zhang, X.; Yang, S.B. A risk assessment method for remote sensing of cyanobacterial blooms in inland waters. Sci. Total Environ. 2020, 740, 140012. [Google Scholar] [CrossRef] [Scilit] [PubMed]
- Wang, M.C.; Lui, X.Q.; Zhang, J.H. Evaluate method and classification standard on lake eutrophication. Environ. Monit. China 2002, 18, 45–49. [Google Scholar]
- Zhou, J.J.; Luo, C.Y.; Ma, D.F.; Shi, W.; Wang, L.Y.; Guo, Z.N.; Tang, H.T.; Wang, X.; Wang, J.R.; Liu, C.F.; et al. The impact of land use landscape pattern on river hydrochemistry at multi-scale in an inland river basin, China. Ecol. Indic. 2022, 143, 109334. [Google Scholar] [CrossRef] [Scilit]
- Wei, W.; Gao, Y.N.; Huang, J.C.; Gao, J.F. Exploring the effect of basin land degradation on lake and reservoir water quality in China. J. Clean. Prod. 2020, 268, 122249. [Google Scholar] [CrossRef] [Scilit]
- Wang, M.; Li, Y.X.; Yuan, H.J.; Zhou, S.Q.; Wang, Y.K.; Ikram, R.M.A.; Li, J.J. An XGBoost-SHAP approach to quantifying morphological impact on urban flooding susceptibility. Ecol. Indic. 2023, 156, 111137. [Google Scholar] [CrossRef] [Scilit]
- Lundberg, S.M.; Lee, S. A Unified Approach to Interpreting Model Predictions. Neural Inf. Process. Syst. 2017, 4768–4777. [Google Scholar]
- Dahal, K.; Sharma, S.; Shakya, A.; Talchabhadel, R.; Adhikari, S.; Pokharel, A.; Sheng, Z.P.; Pradhan, A.M.S.; Kumar, S. Identification of groundwater potential zones in data-scarce mountainous region using explainable machine learning. J. Hydrol. 2023, 627, 130417. [Google Scholar] [CrossRef] [Scilit]
- Tian, Y.X.; Hu, Y.C.; Su, M.; Jia, Q.Q.; Lian, X.H.; Jiao, L.M. Mitigation Measures Could Aggravate Unbalanced Nitrogen and Phosphorus Emissions from Land-Use Activities. Environ. Sci. Technol. 2024, 58, 4627–4636. [Google Scholar] [CrossRef] [Scilit]
- Bu, H.M.; Meng, W.; Zhang, Y.; Wan, J. Relationships between land use patterns and water quality in the Taizi River basin, China. Ecol. Indic. 2014, 41, 187–197. [Google Scholar] [CrossRef] [Scilit]
- Zheng, Q.; Li, Y.X.; Zhu, G.W.; Yu, J.; Zhu, M.Y.; Xu, H.; Wang, Y.C.; Liu, M.L. Spatio-Temporal Distribution and Driving Factors of Organic Carbon in Qiandaohu Reservoir during Summer Storm. Res. Environ. Sci. 2022, 35, 896–907. [Google Scholar] [CrossRef]
- Strokal, M.; Kroeze, C.; Wang, M.; Bai, Z.H.; Ma, L. The MARINA model (Model to Assess River Inputs of Nutrients to seAs): Model description and results for China. Sci. Total Environ. 2016, 562, 869–888. [Google Scholar] [CrossRef] [Scilit]
- Shi, X.Y.; Mao, D.H.; Song, K.S.; Xiang, H.X.; Li, S.J.; Wang, Z.M. Effects of landscape changes on water quality: A global meta-analysis. Water Res. 2024, 260, 121946. [Google Scholar] [CrossRef] [Scilit]
- Han, Y.Y.; Zhang, K.; Lin, Q.; Huang, S.X.; Yang, X.D. Assessing lake ecosystem health from disturbed anthropogenic landscapes: Spatial patterns and driving mechanisms. Ecol. Indic. 2023, 147, 110007. [Google Scholar] [CrossRef] [Scilit]
- Xu, Q.Y.; Guo, S.F.; Zhai, L.M.; Wang, C.Y.; Yin, Y.H.; Liu, H.B. Guiding the landscape patterns evolution is the key to mitigating river water quality degradation. Sci. Total Environ. 2023, 901, 165869. [Google Scholar] [CrossRef] [Scilit]
- Wang, F.; Tao, Q.; Cheng, X.B.; Tao, Y.; Ou, W.X.; Liu, J.J. Influence of Landscape Pattern Change on Water Ecosystem Service in Rapidly Urbanization Areas. J. Soil Water Conserv. 2023, 37, 159–167. [Google Scholar] [CrossRef]
- Paná, S.; Gauto, V.H.; Bonansea, M.; Camacho, V.; Asís, I.V.; Ferral, A. From Land to Rivers: Exploring Landscape Connectivity and Nutrient Transport in River Basins. Sustainability 2025, 17, 10680. [Google Scholar] [CrossRef] [Scilit]
- Liu, K.; Yang, Y.Y.; Shi, R.G.; Shi, R.G.; Li, Q.; Wu, B.; Zheng, H.Y.; Mi, C.H. Spatiotemporal changes and driving forces of landscape patterns in the Yuqiao Reservoir watershed during 1990–2020. J. Agric. Resour. Environ. 2023, 40, 154–164. [Google Scholar] [CrossRef]

Disclaimer/Publisher’s Note: The statements, opinions and data contained in all publications are solely those of the individual author(s) and contributor(s) and not of MDPI and/or the editor(s). MDPI and/or the editor(s) disclaim responsibility for any injury to people or property resulting from any ideas, methods, instructions or products referred to in the content. |
© 2025 by the authors. Licensee MDPI, Basel, Switzerland. This article is an open access article distributed under the terms and conditions of the Creative Commons Attribution (CC BY) license.