


Abstract
Habitat fragmentation due to anthropogenic pressures threats functional connectivity across landscapes for flying mammals. Tadarida brasiliensis depends on nocturnal movement corridors linking refuge and foraging areas, yet these pathways are increasingly constrained in semi-arid regions of northern Mexico. This study developed and analyzed the potential ecological corridors connecting the main colony of T. brasiliensis located in Santa Eulalia with the Irrigation District 005 Delicias, in Chihuahua, Mexico. We integrated multi-source geospatial data within a geographic information system, including wind speed, terrain slope, normalized difference vegetation index, land surface temperature, distance to rivers, landscape aggregation, nighttime lighting, and distance to roads, power lines, and human settlements. Landscape resistance to movement was assessed using a combined framework based on the Analytic Hierarchy Process, the InVEST-Habitat Quality model, and Least Cost Path analysis, generating composite resistance. Five potential corridors were identified, with ranges of lengths and CWD:EucD ratios of 6.8–34.0 km and 20.4–51.3, respectively, reflecting variable cumulative resistance along pathways. Nighttime lighting and proximity to urban areas were major contributors to high resistance, particularly within urban and agricultural environments. The identified corridor network provides a spatial representation of potential routes and supports landscape-level conservation planning to mitigate anthropogenic pressures and maintain functional connectivity.
1. Introduction
The free-tailed bat (Tadarida brasiliensis) is one of the most widely distributed mammal species in the Western Hemisphere, ranging from southern Canada to the southern tip of South America, including Argentina [1,2]. This species relies on refuges that protect from predators and extreme weather conditions, as well as offering essential spaces for reproduction, rearing, and rest. Such refuges can be found in natural caves, abandoned mines, rock crevices, or even human-made structures. The selection of a refuge depends on environmental factors such as temperature, ventilation, height, airflow, and lighting, as well as its proximity to agricultural areas [3,4]. Agriculture production and T. brasiliensis exhibit a beneficial ecological interaction, since the latter consumes large quantities of insects, which are crop pests, providing an essential ecosystem service that reduces the use of agrochemicals and lowers production costs [5].
Despite its broad geographic range and its IUCN classification as a species of “Least Concern” [6], T. brasiliensis faces increasingly severe threats [7]. Threats such as habitat loss and fragmentation, disturbance of natural refuges, light pollution, and urban expansion are key factors undermining its ecological connectivity and the stability of its reproductive colonies [8]. The foregoing factors, along with road infrastructure, power lines, and exposed soil and construction material storage areas, have contributed to landscape fragmentation [9]. In arid and semi-arid regions of northern Mexico, artificial nighttime lighting associated with human settlements and infrastructure is particularly prevalent, potentially intensifying its influence on bat movement and behavior [10]. This process of anthropogenic disturbance and landscape fragmentation reduces the availability of optimal habitat by altering natural movement routes of flying fauna, thereby affecting species such as T. brasiliensis, which depend on functional corridors to move between refuges and feeding areas [11].
In particular, the Santa Eulalia refuge, located in an old mine in the municipality of Aquiles Serdán, Chihuahua, is an example of a colony [12]. This site hosts the largest recorded colony in the state of Chihuahua, with an estimated population between 160,000 and 180,000 individuals, and provides important ecosystem services through the biological control of agricultural pests [13]. However, the physical deterioration of the mine, increased light pollution, and urban sprawl have altered the surrounding landscape, potentially increasing resistance to movement and compromising functional connectivity between the refuge and surrounding foraging areas, thereby placing long-term corridor effectiveness at risk [14].
Habitat fragmentation is recognized as a major driver of biodiversity loss globally, underscoring the need to address bat conservation at the landscape scale. The design and implementation of ecological corridors is an alternative tool for maintaining connectivity between fragmented habitats by facilitating gene flow, dispersal, and access to resources [15,16,17]. In this context, preserving existing natural corridors is particularly important for maintaining functional connectivity between refuges and feeding areas [18]. Ecological connectivity has therefore been recognized as crucial for mitigating the effects of fragmentation and maintaining the continuity of environmental processes. It is a key element of the landscape that links habitats, allowing the persistence of populations in landscapes dominated by human activities [19].
Under this scenario, conservation approaches going beyond the isolated protection of refuges are needed. They must consider the landscape as a whole, integrating feeding areas, flight corridors, and areas of ecological connectivity [16,20]. In this sense, geospatial technologies have transformed the approach to conservation: Geographic Information Systems (GIS), remote sensing data, and connectivity models allow for the integration of information on environmental and socio-spatial variables, which make it possible to analyze habitat quality and degradation, as well as identify and prioritize connectivity corridors, providing a robust and predictive framework that guides where and how to focus conservation efforts [21,22,23,24].
This study is the first geospatial effort to model the ecological connectivity of Tadarida brasiliensis in the state of Chihuahua. The objective was to develop a spatial model of ecological corridors linking the Santa Eulalia refuge, located in the municipality of Aquiles Serdán, with the agricultural areas of Irrigation District 005 Delicias, in northern Mexico. The analysis integrated a multi-criteria assessment approach, habitat quality modeling, and least-cost path (LCP) analysis to assess connectivity between the refuge and feeding areas, thereby contributing to the conservation of habitat and ecosystem services associated with the species. Three specific objectives were set: (1) to identify ecological source nodes, integrating the refuge site (mine) with potential feeding areas derived from vegetation productivity (NDVI) and agricultural landscapes; (2) to generate areas of ecological resistance through multi-criteria assessment and the InVEST Habitat Quality model; and (3) generate ecological corridors and least-cost routes using the Linkage Mapper tool, to delimit potential movement routes of T. brasiliensis.
2. Materials and Methods
2.1. Study Area
This study was conducted in the central region of the state of Chihuahua, Mexico. In this area, several old mines serve as refuges for the T. brasiliensis, including the Santa Eulalia Mine, located in the municipality of Aquiles Serdán. This mine is a strategic site (Figure 1), as thousands of bat individuals emerge each evening and travel toward the surrounding agricultural and natural areas of the municipalities of Rosales, Meoqui, and Delicias in search of food.
Figure 1.
Santa Eulalia Mine, where a Tadarida brasiliensis colony takes shelter. The mine is located in the municipality of Aquiles Serdán, Chih., Mexico.
The mountain system where the mine is located lies within an atmospheric basin (airshed) and was delineated based on the topographic conditions that influence air circulation [25,26]. The study area was defined using an airshed framework rather than a watershed or other ecological units. In the northwestern part of the study area, where the city of Chihuahua is located, the landscape is characterized by a valley with predominant west–east airflow patterns. These atmospheric flows extend toward the area between the Santa Eulalia refuge and the irrigated agricultural zones that constitute the main foraging grounds. Given that wind direction, thermal conditions, and nocturnal atmospheric stability directly influence flight behavior and energetic costs in volant species, the airshed constitutes the primary environmental factor influencing Tadarida brasiliensis during its nightly movements from the refuge to feeding areas. Therefore, for our purposes, the use of an atmospheric basin provides an ecologically meaningful spatial framework for defining the study area and evaluating landscape resistance and potential connectivity. The atmospheric basin covers an area of 2463 km2 and encompasses portions of the Chihuahuan municipalities of Aldama, Aquiles Serdán, Chihuahua, Rosales, Meoqui, Julimes, and Delicias. The predominant landforms consist of low hills, narrow valleys, and plains. These features, together with altitudinal variation, generate microclimates that directly influence the availability of trophic resources [27].
In terms of land use and land cover, the area presents a heterogeneous mosaic in which urban areas, agricultural polygons, grasslands, and scrubland vegetation converge. To the west, the urban expansion of Chihuahua city exerts increasing pressure on ecosystems, leading to increased disturbance factors such as light pollution and habitat fragmentation. To the south and east, there are extensive irrigated and rainfed agricultural areas corresponding to Irrigation District 005 Delicias [28], which are substantial feeding grounds for bats, attracting large populations of insects [29,30]. These agricultural areas are embedded in a heterogeneous landscape in which croplands, urban areas, and isolated industrial developments are adjacent and interspersed.
The study area (Figure 2) combines a key refuge (the mine in Aquiles Serdán) with dispersed foraging zones embedded within agricultural landscapes, while simultaneously exhibiting anthropogenic pressures that challenge the bats’ ability to maintain their movement routes. These two conditions underscore the importance of employing spatial analysis tools to identify corridors to ensure functional connectivity, thereby supporting the conservation of this species and the ecosystem services it provides to the agricultural region [31,32].
Figure 2.
Location of the study area. (a) State of Chihuahua, (b) Mexico, (c) Atmospheric basin, (d) “Santa Eulalia Mine”, T. brasiliensis colony.
2.2. Data Collection
A set of environmental, anthropogenic, and structural variables was selected from various sources (Table 1) and processed within the ArcMap 10.8 geographic information system environment. These variables provided a quantitative and spatial representation of the landscape conditions within the airshed that influence the ease or difficulty of movement for T. brasiliensis between its primary refuge and its foraging areas.
Table 1.
Variables considered in the ecological connectivity modeling.
Wind speed, obtained from publicly available climate products, was incorporated due to its influence on the species’ flight capacity and energy expenditure. Terrain slope, calculated from the Digital Elevation Model (DEM), was used as an indicator of terrain ruggedness, which can influence flight accessibility and energetic costs for bats. Two additional biophysical variables derived from Landsat OLI 8 images were included: the Normalized Difference Vegetation Index (NDVI) and Land Surface Temperature (LST), both calculated as multi-year averages for the period 2015–2025. This temporal aggregation was adopted to emphasize long-term spatial patterns in vegetation productivity and thermal conditions, which are relevant for identifying persistent structural corridors rather than short-term or seasonal dynamics. These variables reflect primary productivity and trophic resource availability, key determinants for insectivorous bat colonies. Distance to watercourses was considered an ecological indicator due to its association with insect concentrations, the species’ primary food source. Meanwhile, landscape aggregation, defined as the degree of spatial clustering of patches of the same land-cover type, was used to assess structural connectivity, defined as the physical arrangement and continuity of landscape elements either facilitating or constraining movement across the environment.
Regarding human pressure, the influence of roads and other infrastructure was assessed using distance-based methods, as distance captures localized disturbance and barrier effects relevant to movement resistance at the spatial scale of this study. That included distances to the road network, power lines, and human settlements. These data were derived from official national digital cartography, due to their role in habitat fragmentation and the risk of collision or disturbance. In addition, nighttime lighting from the VIIRS sensor was used as an indicator of anthropogenic disturbance, given that exposure to light sources can alter foraging and movement patterns. Nighttime lighting was obtained from the NOAA/VIIRS/DNB Monthly V2.2 dataset and represents multi-year average conditions for the period 2015–2025. Monthly composites were aggregated to capture persistent spatial patterns of artificial lighting associated with anthropogenic disturbance, minimizing short-term temporal variability (Table 1, Figure 3).
Figure 3.
Environmental and anthropogenic variables used to model the ecological resistance surface. NDVI = Normalized Difference Vegetation Index.
All variables were converted to raster format and reclassified on a five-level suitability scale (1–5) to represent a relative gradient of ecological resilience, according to the local ranges of the variables. Variable standardization was based on the local range and distribution of raster values using natural breaks, allowing thresholds to reflect spatial heterogeneity within the study area. Suitability values were assigned based on the expected response of Tadarida brasiliensis to each environmental and anthropogenic factor, following a monotonic, expert-based reclassification approach consistent with the hierarchical analytical process framework. For each variable, the lowest values (class 1) represent conditions of lower resistance and greater suitability for movement, while the highest values (class 5) indicate conditions of greater resistance and lower suitability. The specific values and standardization ranges are provided in Appendix A.
To ensure spatial consistency, all raster datasets were harmonized to a common spatial resolution of 30 m. Variables originally available at coarser resolutions (e.g., wind speed, nighttime lighting, and land surface temperature) were resampled to 30 m prior to integration. Continuous variables (wind speed, nighttime lighting, NDVI, land surface temperature, and slope) were resampled using bilinear interpolation. Meanwhile, categorical or discrete layers (land-use/land-cover–derived metrics) were resampled using the nearest-neighbor method to preserve class boundaries and distance relationships. All layers were projected to a common coordinate reference system and spatially aligned before analysis.
2.3. Assessment of Independence
To ensure the validity of the resistance model and reduce multicollinearity issues, the statistical independence between the variables used in the analysis was evaluated. Pearson’s correlation test (r) was applied to identify the strength and direction of linear relationships between pairs of variables. Values of r close to 1 indicated strong collinearity, while those below 0.7 were considered acceptable for joint inclusion in the resistance model [52,53]. This procedure allowed for the discarding of redundant variables, retaining only those that provided independent and complementary information. The correlation analysis between environmental and anthropogenic variables was performed in RStudio (version 2025.09) using the R language. For raster and vector data processing, table manipulation, and result visualization, the following packages were used: terra (1.8), dplyr (1.1.4), tidyr (1.3.1), ggplot2 (4.0.0), corrplot (0.95) and Hmisc (5.2). The correlation matrix was generated using Pearson’s correlation coefficient and visualized with the corrplot package.
2.4. Defining Core Habitat
In this study, the term “core habitat” is used in a functional sense to refer to spatially defined areas playing as primary nodes for refuges or foraging within the connectivity analysis, rather than as habitat critical for long-term population viability. The main refuge was the Santa Eulalia Mine, which serves as a central refuge for T. brasiliensis. From this focal point, three core habitat patches were identified and delineated based on their spatial proximity. In addition, areas of agricultural productivity within the Delicias 05 Irrigation District were incorporated as functional core areas and identified using the multi-year mean NDVI (2010–2015) within a 50 km radius. Across the study area, mean NDVI values ranged approximately from 0.01 to 0.47. Highly productive agricultural core areas were delineated by selecting NDVI values within the upper quartile of the NDVI distribution inside the 50 km buffer, representing zones of elevated primary productivity and potential insect availability. Low or near-zero NDVI values associated with bare soil, urban areas, and water bodies were excluded from the analysis. Local land-use/land-cover data were further used to restrict the selection to irrigated and cultivated agricultural classes, ensuring that the identified cores represented active foraging environments.
The agricultural core areas correspond to the Delicias 05 Irrigation District, a landscape dominated by irrigated agroecosystems and intensive agricultural practices. This region constitutes one of the main agricultural production zones in northern Mexico, characterized by recurrent cropping cycles supported by surface and groundwater irrigation [54]. Therefore, the NDVI-based delineation reflects not only relative vegetation productivity but also the underlying land-use structure and management practices that sustain high insect availability, reinforcing the functional role of these areas as foraging habitats for T. brasiliensis.
The 50 km radius was defined based on the known movement capacity of T. brasiliensis, which can travel distances of approximately 30–60 km from its refuges during foraging and nocturnal movements [55]. This spatial threshold also encompasses the nearest major urban area (Ciudad Delicias), allowing the integration of natural and agricultural environments, as well as areas under anthropogenic pressure, into the analysis. Cultivated productive areas thus represent key feeding zones where bats can access high densities of insects.
2.5. Development of the Resistance Surface
The resistance surface is the basis for calculating species dispersal routes, considering the ability to overcome different degrees of friction in the landscape, a concept initially proposed by Knaapen et al. [56]. In general terms, the greater the ecological functionality of a landscape, the lower the resistance to species movement and vice versa [57,58]. Different ecological contexts and topographical characteristics exert varying influences on the exchange of matter, energy, and information between ecosystems [59]. Steeper slopes and complex relief can increase movement resistance by constraining low-altitude flight, increasing maneuvering and energetic costs, and limiting direct access to foraging areas during nocturnal movements [60]. Likewise, proximity to roads and human settlements can increase landscape resistance for bats by elevating exposure to artificial lighting, noise, and human activity, which may alter flight behavior, increase energetic costs, and reduce the permeability of movement routes during nocturnal movements [61].
The modeling of the resistance surface was approached through two methods: (1) a multicriteria evaluation using the Analytical Hierarchy Process (AHP), and (2) the Habitat Quality model from the open-source Integrated Valuation of Ecosystem Services and Tradeoffs (InVEST) platform. Both approaches were combined to assess landscape permeability for T. brasiliensis, integrating the influence of environmental factors, anthropogenic pressure, and functional landscape structure [62].
2.5.1. Analytical Hierarchy Process (AHP)–Based Multicriteria Evaluation
The resistance surface generated through the multicriteria analysis was developed using the Analytical Hierarchy Process (AHP). Each variable was selected based on its documented or inferred influence on bat movement, flight behavior, or foraging efficiency. Variables represent different ecological mechanisms affecting bats, including atmospheric conditions (wind speed), sensory disturbance (nighttime lighting), terrain accessibility (slope), food availability (NDVI and proximity to rivers), thermal conditions (land surface temperature), and anthropogenic disturbance or barriers (proximity to roads, power lines, and human settlements). To allow integration of these heterogeneous variables into a single resistance surface, all layers were standardized to a common ordinal scale representing relative resistance.
Each variable was reclassified on a standard scale from 1 to 5, where values near one represented area of low resistance or high permeability, and values near five indicated areas with restrictive conditions for movement. The AHP method, developed by Thomas Saaty in 1977, is widely used in multicriteria decision-making [63]. Its purpose is to simplify complex problems by pairwise comparisons among criteria, allowing the establishment of their relative importance in relation to corridor development. A pairwise comparison matrix was constructed in which each variable was evaluated relative to all others using a 1–9 scale to indicate the intensity of importance (where 1 denotes equal importance and 9 denotes extreme importance of one criterion over another) [64,65]. From this matrix, normalized weights were calculated for each variable, representing their relative relevance in the decision-making process. The authors made pairwise comparisons based on local ecological knowledge of the study area and interdisciplinary expertise in ecology, landscape analysis, and conservation. The comparisons were based on the relative influence of each variable on the movement ecology of Tadarida brasiliensis, accounting for known or inferred effects on flight behavior, energy costs, foraging efficiency, and sensitivity to anthropogenic disturbances. This process reflects expert judgment based on regional landscape knowledge gained in the field, with the aim of ranking variables by their expected contribution to landscape resilience, rather than representing absolute biological thresholds.
Consistency of judgments was also evaluated through the consistency index and ratio (CI, RI) to ensure that the comparisons did not contain contradictions. Using the resulting weights and reclassified variables, a weighted overlay was performed in ArcMap 10.5 using the Weighted Overlay tool, producing the resistance surface.
2.5.2. Habitat Quality
In parallel, the Habitat Quality model in InVEST 3.4 [66] was implemented. Habitat quality refers to an ecosystem’s potential capacity to provide suitable conditions for species survival [67]. The Habitat Quality module was used to calculate a habitat quality index (Qxj) within the airshed. For this process, a land-use/land-cover (LULC) map was used as the primary input [68], upon which threats such as urbanization, roads, power lines, and light pollution were defined. Threats were incorporated as independent spatial layers overlaid on the LULC map, with their effects propagated according to distance, decay type, weight, and land-cover–specific sensitivity following the InVEST Habitat Quality framework. Each threat was assigned an impact level, spatial scope, and relative accessibility, while each land-cover category was evaluated based on its sensitivity as habitat for the species. The model produced a spatial habitat quality index. This resulted in a resistance surface that, unlike the AHP model, explicitly incorporated the dimension of habitat degradation and its relationship to disturbance factors. The habitat quality index is calculated using the following Equation (1):
where Qxj is the habitat quality index of cell x in land-use/land-cover type j; Dxj is the habitat degradation level of cell x in land-use/land-cover type j; Hj is the habitat suitability of land-use/land-cover type j; and k is the half-saturation constant.
Cells correspond to square raster pixels at a spatial resolution of 30 m, consistent across all input datasets. Habitat suitability values (Qxj) were assigned to each LULC class following the InVEST framework [66], representing their relative capacity to support bat movement and foraging, based on land-cover structure and disturbance level. The half-saturation constant (k) controls the rate at which habitat quality declines with increasing threat intensity. Specifically, k denotes the threat level at which habitat degradation reaches half of its maximum possible effect, thereby regulating the non-linear relationship between threat pressure and habitat quality. A value of k = 0.5 was used to balance sensitivity to low-to-moderate threat levels while preventing overestimation of degradation under high cumulative pressure, following standard practice in the InVEST Habitat Quality model.
To implement the Habitat Quality model, four main inputs were used: (1) a raster land-use/land-cover (LULC) map in which each cell contains a numerical code representing a specific land-cover type, providing the spatial foundation upon which threats and habitat sensitivity are evaluated; (2) threat factors, defined as landscape elements that exert pressure on habitat quality (Table 2); (3) habitat sensitivity, assigned to each land-cover type according to its degree of vulnerability to the defined threats (Table 3). Habitat sensitivity represents the relative vulnerability of each land-cover type to anthropogenic threats and its suitability for bat movement and foraging. Sensitivity values were assigned based on structural characteristics, disturbance intensity, and expected effects on bat behavior; (4) the half-saturation constant (k), a parameter that regulates the relationship between threat pressure and the resulting habitat quality, functioning as a calibration value that prevents the influence of threats from being overestimated or underestimated.
Table 2.
Habitat threats and their maximum impact distance, weight, and decay type.
Table 3.
Habitat suitability parameters and sensitivity to threats across different land-use/land-cover types.
The parameterization of threat-related inputs, including maximum impact distances and decay types, was informed by empirical spatial exploration and expert judgment. Specifically, GIS-based exploratory analyses were conducted using buffer geoprocessing around major anthropogenic features (roads, power transmission lines, human settlements, and nighttime lighting) to identify the distances at which anthropogenic presence and influence became consistently observable across the landscape. These spatial patterns were further supported by nocturnal field visits to the main agricultural foraging areas, which allowed a qualitative assessment of lighting intensity, human activity, and landscape openness during bat foraging periods.
Habitat suitability and threat sensitivity values assigned to each LULC type represent their relative capacity to support bat movement and foraging, as well as their vulnerability to anthropogenic disturbances, following the InVEST Habitat Quality framework. Suitability values reflect the structural characteristics of each cover type, the degree of human modification, and the expected availability of flight space and prey resources for Tadarida brasiliensis. Sensitivity values describe how strongly each LULC type is affected by different threats (human settlements, power lines, roads, and nighttime lighting).
The selected LULC categories correspond to dominant ecologically distinct land covers in the study area, derived from official land-use mapping. Although some cover types may elicit similar behavioral responses from bats at a coarse scale, they were retained as separate classes to preserve differences in vegetation structure, management intensity, and disturbance context that can influence habitat quality and landscape resistance. This level of thematic detail allows future refinement and validation of the model as additional empirical data become available.
2.5.3. AHP + InVEST Cost Surface
To obtain a robust representation of the ecological resistance of the landscape, the resistance surfaces derived from AHP and InVEST–Habitat Quality (HQ) were integrated into a final composite resistance surface. This integration combined the multicriteria analysis approach, which weights environmental, anthropogenic, and structural variables according to their ecological relevance, with the functional approach of the habitat quality model. The latter incorporates the landscape’s response to specific threats and their impact on ecological integrity.
Prior to their integration, both resistance surfaces, the AHP-derived raster and the resistance derived from the InVEST habitat quality index, were normalized to a standard range (1–100). The normalization to a 1–100 scale was applied for the final resistance surfaces derived from the InVEST Habitat Quality model and the multi-criteria evaluation. This rescaling was implemented through a linear transformation to meet the input requirements of Linkage Mapper, which operates on resistance values within a standardized numeric range. The procedure preserves the relative spatial patterns of resistance and does not alter the underlying ecological relationships represented in each model. In this process, the AHP raster represented structural resistance, linked to physical characteristics and land-use features (e.g., slope, distance to roads, nighttime lighting). In contrast, the InVEST raster represented functional resistance, associated with the cumulative degradation of habitat quality caused by threats.
The final resistance surface was obtained through a linear weighted mean, assigning equal weights (0.5 for AHP and 0.5 for InVEST–HQ), as both components represent complementary structural and functional dimensions of ecological resistance related to landscape configuration and anthropogenic pressure on habitat.
This operation produced an environmental resistance surface scaled from 1 to 100, where one represented area with the highest permeability (low resistance) and 100 indicated areas with the highest resistance to the movement of T. brasiliensis. The composite resistance surface was used as the primary input for connectivity modeling in Linkage Mapper 3.0.0, ensuring that the potential dispersal routes identified simultaneously reflected the biophysical configuration of the landscape and the human-derived pressures that influence movement and functional habitat connectivity for T. brasiliensis.
2.6. Connectivity Model
From the integration of the resistance surfaces generated through the AHP and InVEST–HQ models, a single resistance model was constructed. The composite surface, previously normalized to a 1–100 scale, represented the relative difficulty of movement for T. brasiliensis, combining the structural resistance of the landscape with the functional resistance arising from the impact of threats.
Connectivity among core areas was modeled using Least-Cost Path (LCP) analysis. For this purpose, the Linkage Mapper 3.0.0 Toolkit [69] was implemented in ArcMap 10.8. The tool requires the refuge area, adjacent core areas, and the resistance surface as inputs to calculate accumulated cost distances and delineate corridors that facilitate species movement. In this case, the source node was defined as the mine, which was used as the primary refuge. In contrast, the destination nodes corresponded to agricultural patches located within a 50 km radius inside the airshed.
Additionally, seven quantitative indicators or metrics were obtained [70]: Euclidean Distance (EucD), Cost-Weighted Distance (CWD), Least-Cost Path length (LCP), Geometric Length, the CWD:EucD and CWD:LCP ratios, and the Straightness (STR) Index. This procedure allowed the spatial identification of the most probable dispersal routes, and the critical connectivity areas that may play a strategic role in the conservation and management of the T. brasiliensis corridor. These metrics were used to characterize the identified corridors, allowing comparison of their length, sinuosity, and relative movement efficiency. They provide complementary information on corridor structure and potential movement constraints across the landscape.
Figure 4 summarizes the methodological workflow used to construct the landscape resistance surface and to model ecological connectivity for Tadarida brasiliensis in northern Mexico.
Figure 4.
Workflow illustrating the integration of AHP, InVEST Habitat Quality, and Linkage Mapper to model landscape resistance and ecological connectivity. EucD = Euclidean distance; CWD = cost-weighted distance; LCP = least-cost path length; ShapeL = geometric length of the path; CWD:EucD and CWD:LCP = resistance ratios describing the relative cost per unit distance; STR = straightness index, LULC = Land use/land cover.
3. Results
An integrated and spatially explicit methodological framework was developed to model the ecological connectivity of T. brasiliensis. This multimodel approach (AHP–InVEST-HQ–LCP) allowed: (1) inference of the spatial patterns of structural and functional resistance that optimize the balance between landscape permeability and habitat quality, and (2) identification of ecological corridors that maximize connectivity efficiency under conditions of anthropogenic pressure, using a composite resistance surface derived from the integration of the AHP and InVEST–HQ models. From a landscape-planning perspective, corridors function as ecological flow pathways, strengthening species resilience in the face of global environmental change. Meanwhile, habitat quality represents the intrinsic ecological capacity of the landscape to sustain viable populations [71].
3.1. Correlation Among Environmental and Anthropogenic Variables
An analysis of the Pearson correlation coefficient (r) was used to assess the independence among the variables before generating the landscape resistance models (Figure 5). Correlation coefficients ranged from −0.57 to 0.63, with no values exceeding the |r| ≥ 0.7 threshold, indicating the absence of multicollinearity among predictors. The highest positive correlation was observed between slope and wind speed (r = 0.63), suggesting a degree of correspondence between higher-elevation areas and greater atmospheric exposure. Negative correlations were found between land surface temperature (LST) and NDVI (r = −0.57), reflecting the inverse relationship between vegetation productivity and surface temperature. Since none of the relationships reached an r ≥ 0.7 value, all variables were retained for modeling the AHP and InVEST–HQ resistance surfaces.
Figure 5.
Pearson correlation matrix among variables used in the ecological landscape resistance model. WS = Wind Speed; NTL = Nighttime Lighting (VIIRS); NDVI = Normalized Difference Vegetation Index; DPL = Distance to Power Lines; DHS = Distance to Human Settlements; DW = Distance to Water Bodies; LAI = Landscape Aggregation Index; LST = Land Surface Temperature.
3.2. Resistance Surface
The first resistance surface was generated using a Multicriteria Evaluation (MCE) approach based on the Analytical Hierarchy Process (AHP), to integrate the relative influence of the variables on the movement of T. brasiliensis. The pairwise comparison matrix was constructed using ten criteria (Table 4), considering their ecological relevance and their effect on landscape connectivity [72].
Table 4.
Normalized pairwise comparison matrix for the Analytical Hierarchy Process.
The calculation of the eigenvector and the normalization of the weights enabled the identification of the most influential variables. Nighttime lighting (VIIRS) showed the highest weight (24), followed by the Normalized Difference Vegetation Index (NDVI, 14), distance to human settlements (12), and terrain slope (10). In contrast, distance to electrical transmission lines (7), landscape aggregation (5), and wind speed (5) exhibited lower relative contributions to the resistance surface. The pairwise comparison process was used to represent the relative biological relevance of each variable for Tadarida brasiliensis, translating ecological knowledge of bat movement, foraging behavior, and sensitivity to anthropogenic disturbance into a structured weighting scheme within the AHP framework.
The consistency analysis of the matrix yielded a Consistency Index (CI) of 0.15 and a Consistency Ratio (CR) of 0.098, a value below the 0.10 threshold established by Saaty (1980) [64], confirming the coherence of the assigned judgments. The resulting weights were applied to each standardized raster on a 1–100 scale, generating a spatially continuous resistance surface that represents the relative difficulty of movement for the species, where higher values indicate greater ecological resistance.
The resistance surface displayed a continuous gradient ranging from 1 to 100, in which low-resistance zones (values near 1) corresponded primarily to natural cover types such as shrublands, secondary vegetation, and grasslands, as well as to gentle terrain that facilitates the movement of T. brasiliensis. In contrast, high resistance values (near 100) were associated with intensive agricultural areas, urban zones, and major roadways, where disturbance and fragmentation reduce landscape permeability. This pattern occurs because agricultural areas, while functioning as key foraging environments, are embedded within a heterogeneous matrix closely associated with roads, power distribution lines, and nearby human settlements. The spatial configuration of these combined land-use polygons increases exposure to anthropogenic disturbance, resulting in higher resistance values despite their role as feeding areas. The spatial distribution of resistance exhibited a heterogeneous pattern (Figure 6), indicating that the northwestern and north-central portions of the study area had the most favorable conditions for potential species movement. In contrast, the southeastern portion of the study area presented higher levels of landscape resistance and habitat discontinuity, suggesting a more fragmented landscape that is less conducive to functional connectivity.
Figure 6.
Spatial distribution of the resistance surface for Tadarida brasiliensis obtained by using the Analytical Hierarchy Process.
Low-resistance areas (green tones) were concentrated primarily in zones with gentle slopes and minimal anthropogenic influence, predominating in the northern and central parts of the region. These areas represent favorable conditions for flight and functional connectivity for the species. In contrast, high-resistance areas (red tones) were primarily located around urban centers, roads, and zones with high nighttime lighting levels, mainly in the western, southern, and southeastern sectors of the study area. These areas exhibit a high degree of landscape disturbance, which may limit bat movement and reduce connectivity between habitats.
The model’s spatial pattern reveals a discontinuity in ecological connectivity along the urbanization gradient, underscoring the importance of natural vegetation areas as key structural elements for maintaining the ecological corridor.
The habitat quality model implemented in InVEST–HQ enabled the estimation of habitat quality as a function of landscape sensitivity to anthropogenic threats (Figure 7). The threats included roads, power lines, urban settlements, and nighttime lighting. The weights were obtained using the AHP method, yielding a consistency index (CI) of 0.06.
Figure 7.
Spatial distribution of the resistance surface for Tadarida brasiliensis obtained by using the InVEST Habitat Quality model (InVEST–HQ).
Habitat quality values were rescaled to a resistance range from 1 (low quality/high resistance) to 100 (high quality/low resistance). The results show clear spatial differentiation between natural and human-modified areas. Zones with the highest habitat quality were primarily concentrated in natural regions with high vegetation cover and low anthropogenic influence, particularly in shrublands, grasslands, and riparian vegetation. In contrast, low-quality areas were distributed around urban centers, agricultural zones, and infrastructure corridors, where human pressure is pronounced.
The spatial pattern reveals the presence of high-quality environmental cores that may function as source areas for ecological connectivity, highlighting the role of anthropogenic threats and functional habitat loss. This resistance surface was combined with the AHP-derived surface to generate the composite ecological resistance surface.
The resistance patterns obtained from the AHP and InVEST–HQ models demonstrated structural and functional complementarity within the landscape. While the AHP model reflected the influence of physical and anthropogenic factors (slope, distance to roads, nighttime lighting, among others), delineating resistance zones primarily associated with terrain morphology and infrastructure, the InVEST–HQ model captured the functional degradation of habitat caused by the intensity and proximity of threats.
Together, both models revealed consistent patterns in areas of high human pressure; however, AHP tended to represent a smoother gradient, whereas InVEST–HQ exhibited sharper contrasts around urban cores and road corridors. This complementary difference supported their weighted integration, producing a more comprehensive representation of ecological landscape resistance.
3.3. Combined Resistance Surface
The composite resistance surface was obtained through the weighted integration of the AHP- and InVEST–HQ–derived models, aiming to simultaneously represent the structural (biophysical and anthropogenic attributes) and functional (habitat quality) components of the landscape (Figure 8). The spatial pattern of the combined model shows a more balanced distribution than that of the individual models, effectively integrating environmental heterogeneity and anthropogenic influences. Low-resistance areas (green tones) are primarily concentrated in the central and northern portions of the study area, coinciding with zones of natural vegetation, moderate topography, and low infrastructure density. In contrast, high-resistance areas (red tones) are associated with the main agricultural–urban zones and road corridors, where fragmentation and human pressure constrain functional connectivity.
Figure 8.
Spatial distribution of the composite resistance surface for Tadarida brasiliensis obtained through the combination of the AHP and InVEST–HQ models.
The final surface revealed the continuity of low-resistance zones in the northern and central portions of the study area. In contrast, the western and southeastern zones are critical sectors where connectivity is constrained by urban expansion and linear infrastructure. This integrated surface provides a more robust representation of the overall ecological resistance of the landscape by combining indicators of habitat quality with environmental factors that influence the mobility of T. brasiliensis. Its subsequent use in connectivity modeling allowed the identification of potential corridors that more realistically reflect the interaction between natural components and anthropogenic disturbances across the landscape.
The ecological connectivity network was generated using the Build Network and Map Linkages tool from the Linkage Pathways module of the Linkage Mapper Toolkit. This tool helped identify and map the least-cost pathways based on the composite ecological resistance surface (AHP and InVEST–HQ; Figure 9).
Figure 9.
Map of the least-cost pathways based on the composite ecological resistance surfaces of AHP and InVEST–HQ.
The resulting model showed accumulated cost values ranging from 0 to 1,567,695 across the atmospheric basin. Low values (green tones) represent zones of high connectivity or low ecological resistance, whereas high values (orange to red tones) indicate areas with elevated friction to movement. The spatial analysis revealed a primary connectivity corridor linking the reference colony (Core 4) in the northwest to the destination nodes in the southeast (Cores 1, 2, and 3), following pathways through continuous natural areas and moderate terrain. Additionally, alternative routes with higher cost values were delineated, which may function as secondary or complementary corridors within the regional connectivity network.
The results reflect the influence of anthropogenic factors on the landscape’s potential mobility of T. brasiliensis, underscoring the importance of remaining natural areas as strategic elements for maintaining functional connectivity.
The ecological connectivity analysis, performed using the Build Network and Map Linkages tool from the Linkage Pathways module, generated five least-cost corridors (Least-Cost Paths, LCPs) connecting the habitat cores identified for T. brasiliensis (Table 5). Euclidean distances (EucD) between cores ranged from 6.8 to 34.0 km (mean = 19.8 km; SD = 11.1 km), while cost-weighted distances (CWD) ranged from 268,047 to 926,268 friction units (mean = 574,753; SD = 279,756), revealing marked differences in the ecological resistance of the landscape.
Table 5.
Characteristics of the five mapped linkages between the habitat cores in the airshed.
The LCP connecting Cores 1 and 2 exhibited the lowest accumulated resistance and the smallest CWD:EucD ratio (≈20.4), suggesting a priority and energetically efficient pathway for species movement. In contrast, the corridors linking Cores 2–3 and 2–4 recorded the highest accumulated costs and a CWD:EucD ratio of up to 51.3, indicating increased movement effort associated with the presence of anthropogenic barriers and high-friction zones. The CWD:LCP ratios, which relate accumulated resistance to corridor length, ranged from 14.6 to 24.1 (mean = 18.1), reflecting moderate variability in the energetic effort required along the modeled routes.
The STR values ranged from 1.26 to 2.81 (mean = 1.81), indicating that most routes followed relatively direct trajectories; however, the 2–4 corridor exhibited greater curvature, possibly associated with physical obstacles or high-resistance zones. These results suggest that T. brasiliensis retains the ability for functional movement through the remaining natural corridors, although under increasing pressure resulting from anthropogenic landscape transformation.
Figure 10 illustrates the spatial distribution of the five least-cost paths (LCPs) or corridors connecting the identified habitat cores. The corridors follow a general northwest–southeast pattern, linking the source colony in Santa Eulalia (Core 4) with the habitat cores situated toward the southeast (Cores 1, 2, and 3). The shortest and most efficient pathways are concentrated in the north-central sector, characterized by gentle terrain and continuous natural cover, whereas routes with higher cost-weighted distances (CWD), represented by orange and red tones, traverse agricultural and urban zones where ecological friction increases due to anthropogenic exposure.
Figure 10.
Spatial representation of five least-cost paths (LCPs) or corridors connecting three core identified habitat cores with the source colony of Tadarida brasiliensis located in mine of Santa Eulalia, Chihuahua, Mexico.
The metrics derived from the connectivity analysis reveal differential patterns of resistance and movement efficiency. Euclidean Distance (EucD) and Cost-Weighted Distance (CWD) showed increasing gradients toward the central and eastern portions of the landscape, areas associated with higher friction. Likewise, Least-Cost Path length (LCP) and Geometric Length indicated that the 1–2 and 2–3 corridors are the most efficient, whereas those involving Core 4 exhibited longer distances and higher movement costs.
The CWD:EucD and CWD:LCP ratios revealed notable contrasts in the relative resistance of the landscape: low values (≈20–25) were concentrated in the western sector, representing highly permeable routes, whereas high values (>40) were located toward the southeast, where the terrain is more fragmented and subject to greater anthropogenic pressure. Finally, the STR indicated that the links with the least geometric deviation, particularly those between Cores 1–2 and 2–3, constitute the most direct and efficient routes for the potential movement of T. brasiliensis, representing the priority corridors for functional connectivity within the study area.
The route connecting Core 4 (Santa Eulalia Mine) with the other habitat cores represents the principal potential movement route for T. brasiliensis in the region. This linkage functions as the primary dispersal axis, enabling movement from the refuge site toward the agricultural foraging zones of Irrigation District 05 Delicias. Unlike the other corridors, which develop mainly among agricultural patches of lower structural value, the Core 4 corridor traverses a complex environmental gradient, where resistance increases as it approaches agricultural and urban areas, reflecting an ecological transition from natural habitats to anthropogenic matrices.
Despite its high accumulated friction values (CWD > 600,000) and elevated CWD:EucD ratios, this corridor retains functional continuity, indicating that the species maybe maintains the ability to move across fragmented landscapes by utilizing secondary vegetation patches and intermediate terrain.
4. Discussion
This study represents the first attempt to model the ecological connectivity of T. brasiliensis in northern Mexico by identifying potential movement routes derived from landscape resistance patterns. The corridors identified here highlight areas of relatively low and high resistance across the landscape, providing insight into hypothesized connectivity between the primary refuge of T. brasiliensis, the Santa Eulalia Mine located in the municipality of Aquiles Serdán, and the foraging areas within Irrigation District 05 Delicias. Recently, the mine was declared a Sanctuary [73]; however, its foraging route has not yet been considered. The results offer a meaningful contribution to regional conservation planning and may serve as technical input for land-use planning instruments, habitat management, and public policy design aimed at protecting ecological corridors, not only for T. brasiliensis but also for other insectivorous bat species [74].
The least-cost corridors identified reflect the functional interaction between landscape structure and the species’ theoretical movement behavior. Areas of low ecological resistance were primarily associated with natural cover types, including shrublands, secondary vegetation, and semi-natural grasslands. These environments have been described in the literature as highly permeable habitats for insectivorous bats due to their open structure and lower density of vertical obstacles, which can reduce energetic expenditure and facilitate efficient aerial navigation [75]. This aligns with the highly mobile and aerodynamic nature of T. brasiliensis, a species capable of traveling dozens of kilometers per night in search of food, using natural landscape elements as topographic and thermal references [76].
The potential movement route connecting the Santa Eulalia refuge (Core 4) with the agricultural areas of Irrigation District 05 Delicias represents a strategic functional route that links the species’ resting site to the most productive foraging areas [1,12]. Although this modeled pathway exhibits high resistance values, its structural continuity highlights zones where potential connectivity may persist within a fragmented landscape. These results identify landscape configurations that may facilitate movement. In this context, remnant natural vegetation and heterogeneous agricultural mosaics emerge as key landscape elements that could support potential flight routes, a hypothesis that requires validation through field-based movement data and empirical observations [77].
The selection of low-friction routes (low CWD and CWD:EucD values) is consistent with the documented mobility scale of T. brasiliensis, whose nightly movements can exceed 60 km and whose migratory distances may surpass 1000 km [55]. This movement capacity enables the species to traverse extensive landscapes, using broad corridors as long as they maintain continuity and low energetic cost. In addition, the influence of wind and its direction is reflected in the most efficient trajectories, where corridors that follow valleys or favorable wind directions tend to exhibit lower CWD values and higher values of the STR index [78,79], resulting in more direct routes with reduced metabolic expenditure. This pattern aligns with recent studies showing that bats can adjust their flight speed and altitude in response to atmospheric conditions, optimizing their transport energy use [80].
Conversely, areas with artificial nighttime lighting, roads, and urbanized zones exhibited higher ecological resistance, altering the functional connectivity of the landscape [81]. Light pollution disrupts activity rhythms, interferes with prey detection, and increases vulnerability to predators, potentially leading to changes in foraging behavior or shifts in flight height and speed [82]. Similarly, roads act as linear barriers that fragment potential movement pathways and increase the risk of collision or mortality [83,84]. These findings align with the high weights assigned to nighttime lighting and human settlements in the AHP matrix, as well as with the elevated CWD values observed in urbanized sectors.
The cost-weighted distance values (CWD = 2.7 × 10⁵–9.3 × 10⁵) and the CWD:EucD ratios (20–51) are consistent with ranges reported in functional connectivity studies of bats in agricultural landscapes [85,86,87]. Unlike more sedentary species, T. brasiliensis is known to operate across much larger spatial scales. In this study, the extensive lengths of the modeled corridors and their associated accumulated resistance values are consistent with this large-scale movement capacity; however, these patterns are theoretical outcomes of the resistance-based modeling framework [80].
Connectivity corridors function not only as movement routes but also as zones of ecological flow that sustain key processes and ecosystem services [15,88]. The identification of potential connectivity routes may provide a spatial framework to inform future investigations on landscape permeability for other volant organisms [89]. Conserving these corridors can help ensure the persistence of viable populations and promote an aerial ecological network that maintains the stability of trophic interactions [90].
From a physiological perspective, the variables used in the model reflect mechanisms that directly influence flight costs and the species’ energetic efficiency. Areas with moderate winds, gentle slopes, and intermediate surface temperatures facilitate movement and reduce metabolic expenditure [91]. In turn, vegetation productivity (as indicated by NDVI) is positively associated with insect availability, underscoring the importance of heterogeneous agricultural and riparian zones as preferred trophic pathways [82]. These relationships confirm the ecological validity of the variables included in the model and their correspondence with the physiological processes underlying the species’ movement.
The combination of multicriteria (AHP), functional (InVEST–HQ), and least-cost path (LCP) approaches enabled the characterization and description of the ecological connectivity of T. brasiliensis. The results suggest that, despite anthropogenic pressures, the regional landscape retains the capacity to sustain functional ecological flows, particularly along the corridors linking the Santa Eulalia refuge to the agricultural zones of Delicias. Recognizing and safeguarding these potential movement routes is the principal challenge for ensuring the species’ population viability and strengthening aerial connectivity in the semiarid landscapes of northern Mexico.
4.1. Implications for Conservation
The results of this study provide a foundation for the conservation of T. brasiliensis in northern Mexico. Given that the Santa Eulalia colony is one of the most important refuges in the country and is increasingly affected by urban expansion and infrastructure development, the identified low-resistance corridors should be prioritized for management and planning. Conservation actions should focus on regulating artificial nighttime lighting, conserving remnant natural vegetation, and integrating connectivity considerations into ecological land-use planning and landscape restoration programs.
At a broader scale, coordinated institutional management is needed to explicitly incorporate aerial connectivity into land-use planning instruments, recognizing the role of movement corridors in sustaining ecosystem services provided by insectivorous bats [92]. The connectivity patterns identified here offer a baseline scenario that highlights priority areas for future research, monitoring, and conservation intervention.
At the corridor level, targeted management actions may enhance functional connectivity across the agricultural matrix. Priority measures include reducing or shielding nighttime lighting along movement routes and near agricultural foraging areas, promoting wildlife-friendly agricultural practices that maintain heterogeneous crop mosaics and field margins, and conserving riparian strips and remnant vegetation patches. Where corridors intersect linear infrastructure, mitigation efforts such as limiting new road development, applying low-impact lighting, and avoiding the placement of power lines in key movement areas may further reduce resistance. Collectively, these actions translate the modeled corridors into actionable guidance for local and regional conservation planning.
4.2. Limitations
Although the results provide an approximation of the potential habitat connectivity of T. brasiliensis, this study has limitations inherent to its methodological nature. The model was developed using geospatial data and lacks direct validation against empirical movement records, which are currently unavailable. While the selected environmental and anthropogenic variables adequately represent landscape-scale resistance patterns, the lack of field observations introduces uncertainty regarding the routes actually used by the species.
The use of multi-year NDVI averages was intended to emphasize landscape structures that are persistent in space and time, thereby supporting the identification of long-term structural connectivity patterns. However, this temporal aggregation may smooth seasonal variability in vegetation productivity and microclimatic conditions that can influence bat movement and foraging behavior, particularly in intensively managed agricultural systems. Accordingly, the modeled corridors should be interpreted as representations of long-term structural connectivity rather than as indicators of seasonal or short-term movement routes.
Wind speed was incorporated as a landscape-scale proxy for atmospheric exposure, based on near-surface estimates (10 m above ground level). While this approach captures broad spatial gradients relevant to energetic costs and movement resistance, it does not represent flight conditions at specific altitudes. Thus, wind effects should be interpreted as relative constraints on potential movement rather than as direct representations of in-flight conditions experienced by bats.
In addition, the Least-Cost Path (LCP) approach represents movement across a two-dimensional surface and it does not fully capture the three-dimensional nature of flight or short-term meteorological variability that may influence insectivorous bats. In this study, LCP was prioritized to delineate interpretable landscape-scale connectivity routes between refuge and foraging core areas under the resistance assumptions derived from the selected variables. Although circuit-theory modeling was not implemented, we acknowledge that such approaches could provide complementary information on corridor redundancy, pinch points, and areas of concentrated movement. Future research should integrate circuit-theory analyses together with field-based observations and species records to refine corridor structure and support targeted conservation and management actions.
Future studies integrating empirical movement and data with advanced monitoring techniques, such as wildlife radar systems [93,94], Doppler sensors [95], multispectral thermal cameras, or acoustic telemetry [96], would be valuable for validating and refining the potential corridors identified here.
5. Conclusions
This study represents the first assessment of the ecological connectivity of T. brasiliensis integrating multicriteria (AHP), functional (InVEST–HQ), and least-cost path (LCP) approaches. The combination of these methods enabled the identification of potential movement routes for T. brasiliensis between the main Santa Eulalia colony and the agricultural zones of the Delicias Irrigation District 05. This generated a composite resistance surface reflecting the interaction among environmental, anthropogenic, and habitat-quality factors.
The generation of resistance surfaces represented a key step toward understanding the ecological connectivity of T. brasiliensis in agricultural and semiarid landscapes of northern Mexico. Despite the absence of empirical movement data, the models identified potential movement routes and critical conservation areas, integrating environmental and anthropogenic factors.
An ecological network composed of five main corridors was identified, connecting the T. brasiliensis colony at the Santa Eulalia Mine to the foraging areas of Irrigation District 005 in Delicias. Anthropogenic disturbances, particularly nighttime lighting and proximity to urban areas, exerted the strongest influence on the spatial distribution of ecological resistance.
The quantitative characterization of the identified corridors revealed moderate functional connectivity influenced by urban development and landscape fragmentation. This study underscores the importance of conserving semiarid landscapes and controlling sources of light pollution to maintain the ecological mobility of T. brasiliensis.
Author Contributions
Conceptualization, K.M.-M.; Formal analysis, J.S.I.-B.; Investigation, S.D.L.-G.; Methodology, K.M.-M.; Software, N.S.H.-Q.; Supervision, I.F.-P. and J.H.V.-M.; Validation, A.P.-A.; Visualization, I.F.-P. and J.H.V.-M.; Writing—original draft, J.A.P.-A.; Writing—review and editing, F.V.-G. All authors have read and agreed to the published version of the manuscript.
Funding
This research received no external funding.
Data Availability Statement
The raw geospatial and analytical datasets supporting the conclusions of this study are available from the corresponding author upon reasonable request. Open-access datasets used in the analysis are fully cited within the manuscript and include direct links to their respective data sources.
Acknowledgments
We thank the ‘Secretaría de Ciencia, humanidades, Tecnología e Innovación (SECIHTI)’ of Mexico—for the scholarship (No. 4046450) granted to the first author of this manuscript while pursuing her PhD degree.
Conflicts of Interest
The authors declare no conflicts of interest.
Appendix A
Table A1.
Standardization ranges of environmental and anthropogenic variables used in the multi-criteria evaluation (AHP) to generate the resistance surface.
References
- Russell, A.L.; Medellín, R.A.; McCracken, G.F. Genetic variation and migration in the Mexican free-tailed bat (Tadarida brasiliensis mexicana). Mol. Ecol. 2005, 14, 2207–2222. [Google Scholar] [CrossRef] [Scilit]
- do Amaral, I.S.; Pereira, J.B.; Vancine, M.H.; Morales, A.E.; Althoff, S.L.; Gregorin, R.; Ramos-Pereira, M.J.; Valiati, V.H.; de Oliveira, L.R. Where do they live? Predictive geographic distribution of Tadarida brasiliensis brasiliensis (Chiroptera, Molossidae) in South America. Neotrop. Biol. Conserv. 2023, 18, 139–156. [Google Scholar] [CrossRef] [Scilit]
- Drake, E.C.; Gignoux-Wolfsohn, S.; Maslo, B. Systematic review of the roost-site characteristics of North American forest bats: Implications for conservation. Diversity 2020, 12, 76. [Google Scholar] [CrossRef] [Scilit]
- Moran, M.L.; Steven, J.C.; Williams, J.A.; Sherwin, R.E. Bat use of abandoned mines throughout Nevada. Wildl. Soc. Bull. 2023, 47, e1468. [Google Scholar] [CrossRef] [Scilit]
- Rodríguez-San Pedro, A.; Allendes, J.L.; Beltrán, C.A.; Chaperon, P.N.; Saldarriaga-Córdoba, M.M.; Silva, A.X.; Grez, A.A. Quantifying ecological and economic value of pest control services provided by bats in a vineyard landscape of central Chile. Agric. Ecosyst. Environ. 2020, 302, 107063. [Google Scholar] [CrossRef] [Scilit]
- International Union for Conservation of Nature (IUCN). Tadarida brasiliensis (I. Geoffroy, 1824); The IUCN Red List of Threatened Species; International Union for Conservation of Nature (IUCN): Cambridge, UK, 2015. [Google Scholar] [CrossRef] [Scilit]
- Gutiérrez-Granados, G.; Rodríguez-Zúñiga, M.T. Bats as indicators of ecological resilience in a megacity. Urban Ecosyst. 2024, 27, 479–489. [Google Scholar] [CrossRef] [Scilit]
- Puelles-Escobar, B.; Muñoz-Sáez, A. The influence of habitat diversity on bat species richness and feeding behavior in Chilean vineyards: Implications for agroecological practices. Agriculture 2024, 14, 1812. [Google Scholar] [CrossRef] [Scilit]
- Briones-Salas, M.; Medina-Cruz, G.E.; Martin-Regalado, C.N. Taxonomic, functional, and phylogenetic diversity of bats in urban and suburban environments in southern México. Diversity 2024, 16, 527. [Google Scholar] [CrossRef] [Scilit]
- Stone, E.L.; Harris, S.; Jones, G. Impacts of artificial lighting on bats: A review of challenges and solutions. Mamm. Biol. 2015, 80, 213–219. [Google Scholar] [CrossRef] [Scilit]
- Davis, R.; Van Rensburg, B.J.; Haddock, J.; Blomberg, S.; Dayanandra, B.; Buelow, C.; Ford, G.; Reside, A.E. Artificial light influences urban habitat use by insectivorous bats. Landsc. Ecol. 2025, 40, 161. [Google Scholar] [CrossRef] [Scilit]
- Rodríguez-Moreno, Á.; Martínez-Hernández, E.Y.; Fernández, J.A. A Brazilian free-tailed bat, Tadarida brasiliensis (I. Geoffroy, 1824) (Chiroptera: Molossidae), colony in Santa Eulalia, Chihuahua, Mexico, with records of other bat species. Check List 2022, 18, 1369–1375. [Google Scholar] [CrossRef] [Scilit]
- Gándara, G.; Correa, A.N.; Hernández, C.A. Ecological service offered by Tadarida brasiliensis bats as natural plague controllers in northern Mexico and their economic valuation. Open Access Libr. J. 2023, 10, 1–16. [Google Scholar] [CrossRef]
- Elliott, W.R. Protecting Caves and Cave Life. In Encyclopedia of Caves, 1st ed.; Gunn, J., Ed.; Academic Press: Cambridge, MA, USA, 2004; pp. 458–468. [Google Scholar]
- Hilty, J.; Worboys, G.L.; Keeley, A.; Woodley, S.; Lausche, B.J.; Locke, H.; Carr, M.; Pulsford, I.; Pittock, J.; White, J.; et al. Guidelines for Conserving Connectivity Through Ecological Networks and Corridors; International Union for Conservation of Nature (IUCN): Gland, Switzerland, 2020. [Google Scholar]
- Carlier, J.; Moran, J.; Aughney, T.; Roche, N. Effects of greenway development on functional connectivity for bats. Glob. Ecol. Conserv. 2019, 18, e00613. [Google Scholar] [CrossRef] [Scilit]
- Laforge, A.; Barbaro, L.; Bas, Y.; Calatayud, F.; Ladet, S.; Sirami, C.; Archaux, F. Road density and forest fragmentation shape bat communities in temperate mosaic landscapes. Landsc. Urban Plan. 2022, 221, 104353. [Google Scholar] [CrossRef] [Scilit]
- Martínez-Medina, D.; Ahmad, S.; González-Rojas, M.F.; Reck, H. Wildlife crossings increase bat connectivity: Evidence from Northern Germany. Ecol. Eng. 2022, 174, 106466. [Google Scholar] [CrossRef] [Scilit]
- Vazquez-Rueda, E.; Cuervo-Robayo, A.P.; Ayala-Berdon, J. Forest dependency could be more important than dispersal capacity for habitat connectivity of four species of insectivorous bats inhabiting a highly anthropized region in central Mexico. Mamm. Res. 2023, 68, 561–573. [Google Scholar] [CrossRef] [Scilit]
- Russo, D.; Voigt, C.C. The use of automated identification of bat echolocation calls in acoustic monitoring: A cautionary note for a sound analysis. Ecol. Indic. 2016, 66, 598–602. [Google Scholar] [CrossRef] [Scilit]
- Zlinszky, A.; Heilmeier, H.; Balzter, H.; Czúcz, B.; Pfeifer, N. Remote sensing and GIS for habitat quality monitoring: New approaches and future research. Remote Sens. 2015, 7, 7987–7994. [Google Scholar] [CrossRef] [Scilit]
- Berta Aneseyee, A.; Noszczyk, T.; Soromessa, T.; Elias, E. The InVEST habitat quality model associated with land use/cover changes: A qualitative case study of the Winike Watershed in the Omo-Gibe Basin, Southwest Ethiopia. Remote Sens. 2020, 12, 1103. [Google Scholar] [CrossRef] [Scilit]
- Masha, M.; Tadila, G.; Bojago, E. GIS and remote sensing-based wildlife habitat suitability analysis for Mountain Nyala (Tragelaphus buxtoni) at Bale Mountains National Park, Ethiopia. Quat. Sci. Adv. 2024, 16, 100251. [Google Scholar] [CrossRef] [Scilit]
- Kim, D.U.; Yoon, H.Y. Objective parameterization of InVEST habitat quality model using integrated PCA-SEM-spatial analysis: A biotope map-based framework. Land 2025, 14, 2050. [Google Scholar] [CrossRef] [Scilit]
- Instituto Nacional de Estadística y Geografía (INEGI). Climatología: Recursos Cartográficos Nacionales de Clima; INEGI: Aguascalientes, Mexico, 2020; Available online: https://en.www.inegi.org.mx/temas/climatologia/#downloads (accessed on 7 July 2025).
- Instituto Nacional de Estadística y Geografía (INEGI). Síntesis Geográfica, Climática y de Topoformas del Estado de Chihuahua; INEGI: Aguascalientes, Mexico, 2020; Available online: https://www.inegi.org.mx/contenidos/productos/prod_serv/contenidos/espanol/bvinegi/productos/historicos/2104/702825224332/702825224332_5.pdf (accessed on 7 July 2025).
- Comisión Nacional para el Conocimiento y Uso de la Biodiversidad (CONABIO). Mapa de Climas de México (Clasificación de Köppen Modificada por García). Geoportal CONABIO. 2023. Available online: http://geoportal.conabio.gob.mx/metadatos/doc/html/clima1mgw.html (accessed on 5 August 2025).
- Gobierno Municipal de Delicias. Plan Municipal de Desarrollo de Delicias 2021–2024; Gobierno Municipal de Delicias: Chihuahua, Mexico, 2021; Available online: https://municipiodelicias.com/images/2021-2024/planMunicipalDesarrollo2021-2024/PMD-2021-2024-29dic2021.pdf (accessed on 18 August 2025).
- Federico, P.; Hallam, T.G.; McCracken, G.F.; Purucker, S.T.; Grant, W.E.; Correa-Sandoval, A.N.; Westbrook, J.K.; Medellín, R.A.; Cleveland, C.J.; Sansone, C.G.; et al. Brazilian free-tailed bats as insect pest regulators in transgenic and conventional cotton crops. Ecol. Appl. 2008, 18, 826–837. [Google Scholar] [CrossRef] [Scilit] [PubMed]
- Maine, J.J.; Boyles, J.G. Bats initiate vital agroecological interactions in corn. Proc. Natl. Acad. Sci. USA 2015, 112, 12438–12443. [Google Scholar] [CrossRef] [Scilit] [PubMed]
- Bhalla, I.S.; Razgour, O.; Rigal, F.; Whittaker, R.J. Landscape features drive insectivorous bat activity in Indian rice fields. Landsc. Ecol. 2023, 38, 2931–2946. [Google Scholar] [CrossRef] [Scilit]
- Calderón-Acevedo, C.A.; Rodríguez-Durán, A.; Soto-Centeno, J.A. Effect of land use, habitat suitability, and hurricanes on the population connectivity of an endemic insular bat. Sci. Rep. 2021, 11, 9115. [Google Scholar] [CrossRef] [Scilit]
- Fick, S.E.; Hijmans, R.J. WorldClim 2: New 1-km spatial resolution climate surfaces for global land areas. Int. J. Climatol. 2017, 37, 4302–4315. [Google Scholar] [CrossRef] [Scilit]
- Swartz, S.M.; Konow, N. Advances in the study of bat flight: The wing and the wind. Can. J. Zool. 2015, 93, 977–990. [Google Scholar] [CrossRef] [Scilit]
- Earth Engine Data Catalog. VIIRS Nighttime Day/Night Annual Band Composites V2.2. Available online: https://developers.google.com/earth-engine/datasets/catalog/?hl=es_419 (accessed on 15 September 2025).
- Hu, J.; Liu, Y.; Fang, J. Ecological corridor construction based on least-cost modeling using VIIRS nighttime light data and the normalized difference vegetation index. Land 2021, 10, 782. [Google Scholar] [CrossRef] [Scilit]
- Instituto Nacional de Geografía e Informática. Continuo de Elevaciones Mexicano (CEM). Available online: https://www.inegi.org.mx/app/geo2/elevacionesmex/ (accessed on 12 September 2025).
- Frey-Ehrenbold, A.; Bontadina, F.; Arlettaz, R.; Obrist, M.K. Landscape connectivity, habitat structure and activity of bat guilds in farmland-dominated matrices. J. Appl. Ecol. 2013, 50, 252–261. [Google Scholar] [CrossRef] [Scilit]
- U.S. Geological Survey. GloVis. Available online: https://glovis.usgs.gov/ (accessed on 13 August 2025).
- Wei, S.; Yu, T.; Ji, P.; Xiao, Y.; Li, X.; Zhang, N.; Liu, Z. Analysis on ecological network pattern changes in the Pearl River Delta forest urban agglomeration from 2000 to 2020. Remote Sens. 2024, 16, 3800. [Google Scholar] [CrossRef] [Scilit]
- Instituto Nacional de Geografía e Informática. Red Nacional de Caminos. RNC. 2024. Available online: https://www.inegi.org.mx/app/biblioteca/ficha.html?upc=794551132166 (accessed on 25 July 2025).
- Claireau, F.; Bas, Y.; Pauwels, J.; Barré, K.; Machon, N.; Allegrini, B.; Puechmaille, S.J.; Kerbiriou, C. Major roads have important negative effects on insectivorous bat activity. Biol. Conserv. 2019, 235, 53–62. [Google Scholar] [CrossRef] [Scilit]
- GeoComunes. Líneas de Transmisión en Operación en México. Available online: http://132.248.26.105/catalogue/#/dataset/544 (accessed on 25 July 2025).
- Instituto Nacional de Geografía e Informática. Marco Geoestadístico 2024. Available online: https://www.inegi.org.mx/app/biblioteca/ficha.html?upc=794551132173 (accessed on 25 July 2025).
- Jung, K.; Threlfall, C.G. Trait-dependent tolerance of bats to urbanization: A global meta-analysis. Proc. R. Soc. B 2018, 285, 20181222. [Google Scholar] [CrossRef] [Scilit] [PubMed]
- SIATL. Simulador de Flujos de Agua de Cuencas Hidrográficas. Available online: http://antares.inegi.org.mx/analisis/red_hidro/siatl/ (accessed on 12 May 2025).
- Amorim, F.; Jorge, I.; Beja, P.; Rebelo, H. Following the water? Landscape-scale temporal changes in bat spatial distribution in relation to Mediterranean summer drought. Ecol. Evol. 2018, 8, 5801–5814. [Google Scholar] [CrossRef] [Scilit] [PubMed]
- Hesselbarth, M.H.; Sciaini, M.; With, K.A.; Wiegand, K.; Nowosad, J. landscapemetrics: An open-source R tool to calculate landscape metrics. Ecography 2019, 42, 1648–1657. [Google Scholar] [CrossRef] [Scilit]
- Lin, J.; Zeng, Y.; He, Y. Spatial optimization with morphological spatial pattern analysis for green space conservation planning. Forests 2023, 14, 1031. [Google Scholar] [CrossRef] [Scilit]
- Earth Engine Data Catalog. USGS Landsat 8 Level 2, Collection 2, Tier 1. Available online: https://developers.google.com/earth-engine/datasets/catalog/LANDSAT_LC08_C02_T1_L2?hl=es-419 (accessed on 15 September 2025).
- Li, H.; Zhang, T.; Cao, X.S.; Zhang, Q.Q. Establishing and optimizing the ecological security pattern in Shaanxi Province (China) for ecological restoration of land space. Forests 2022, 13, 766. [Google Scholar] [CrossRef] [Scilit]
- Kohles, J.E.; Page, R.A.; Wikelski, M.; Dechmann, D.K. Seasonal shifts in insect ephemerality drive bat foraging effort. Curr. Biol. 2024, 34, 3241–3248. [Google Scholar] [CrossRef] [Scilit]
- Braunisch, V.; Coppes, J.; Arlettaz, R.; Suchant, R.; Schmid, H.; Bollmann, K. Selecting from correlated climate variables: A major source of uncertainty for predicting species distributions under climate change. Ecography 2013, 36, 971–983. [Google Scholar] [CrossRef] [Scilit]
- Instituto Nacional de Estadística y Geografía (INEGI). Censo Agropecuario: Agricultura de Riego en el Norte de México; INEGI: Aguascalientes, México, 2022; Available online: https://www.inegi.org.mx/programas/ca/2022/ (accessed on 20 July 2025).
- Best, T.L.; Geluso, K.N. Summer foraging range of Mexican free-tailed bats (Tadarida brasiliensis mexicana) from Carlsbad Cavern, New Mexico. Southwest. Nat. 2003, 48, 590–596. [Google Scholar] [CrossRef] [Scilit]
- Knaapen, J.P.; Scheffer, M.; Harms, B. Estimating habitat isolation in landscape planning. Landsc. Urban Plan. 1992, 23, 1–16. [Google Scholar] [CrossRef] [Scilit]
- McRae, B.H.; Dickson, B.G.; Keitt, T.H.; Shah, V.B. Using circuit theory to model connectivity in ecology, evolution, and conservation. Ecology 2008, 89, 2712–2724. [Google Scholar] [CrossRef] [Scilit] [PubMed]
- Unnithan Kumar, S.; Cushman, S.A. Connectivity modelling in conservation science: A comparative evaluation. Sci. Rep. 2022, 12, 16680. [Google Scholar] [CrossRef] [Scilit]
- Mayor, S.; Altermatt, F.; Crowther, T.W.; Hordijk, I.; Landauer, S.; Oehri, J.; Chacko, M.R.; Schaepman, M.E.; Schmid, B.; Niklaus, P.A. Landscape diversity promotes landscape functioning in North America. Commun. Earth Environ. 2025, 6, 28. [Google Scholar] [CrossRef] [Scilit]
- Zhang, J.; Pannell, J.L.; Case, B.S.; Hinchliffe, G.; Stanley, M.C.; Buckley, H.L. Interactions between landscape structure and bird mobility traits affect the connectivity of agroecosystem networks. Ecol. Indic. 2021, 129, 107962. [Google Scholar] [CrossRef] [Scilit]
- De Rivera, C.E.; Bliss-Ketchum, L.L.; Lafrenz, M.D.; Hanson, A.V.; McKinney-Wise, L.E.; Rodriguez, A.H.; Schultz, J.; Simmons, A.L.; Rodriguez, D.T.; Temple, A.H.; et al. Visualizing connectivity for wildlife in a world without roads. Front. Environ. Sci. 2022, 10, 757954. [Google Scholar] [CrossRef] [Scilit]
- Edosa, B.T.; Erena, M.G. Wildlife habitat suitability analysis and mapping of the former Dhidhessa Wildlife Sanctuary using GIS-based analytical hierarchical process and weighted linear combination methods. Heliyon 2024, 10, e28902. [Google Scholar] [CrossRef] [Scilit]
- Saaty, T.L. A scaling method for priorities in hierarchical structures. J. Math. Psychol. 1977, 15, 234–281. [Google Scholar] [CrossRef] [Scilit]
- Saaty, T.L. The Analytic Hierarchy Process; McGraw-Hill: New York, NY, USA, 1980. [Google Scholar]
- Saaty, T.L.; Vargas, L.G. The analytic network process. In Decision Making with the Analytic Network Process: Economic, Political, Social and Technological Applications with Benefits, Opportunities, Costs and Risks; Springer US: Boston, MA, USA, 2013; pp. 1–40. [Google Scholar] [CrossRef] [Scilit]
- Sharp, R.; Tallis, H.T.; Ricketts, T.; Guerry, A.D.; Wood, S.A.; Chaplin-Kramer, R.; Nelson, E.; Ennaanay, D.; Wolny, S.; Olwero, N.; et al. InVEST—Integrated Valuation of Ecosystem Services and Tradeoffs; The Natural Capital Project, Stanford University: Stanford, CA, USA; The Nature Conservancy: Arlington, VA, USA; University of Minnesota: Minneapolis, MN, USA, 2016. [Google Scholar]
- Zhang, Y.; Zhang, C.; Zhang, X.; Wang, X.; Liu, T.; Li, Z.; Ma, F. Habitat quality assessment and ecological risks prediction: An analysis in the Beijing–Hangzhou Grand Canal (Suzhou Section). Water 2022, 14, 2602. [Google Scholar] [CrossRef] [Scilit]
- Zheng, G.; Li, C.; Li, R.; Luo, J.; Fan, C.; Zhu, H. Spatio-temporal evolution analysis of landscape pattern and habitat quality in the Qinghai Province section of the Yellow River Basin from 2000 to 2022 based on InVEST model. J. Arid Land 2024, 16, 1183–1196. [Google Scholar] [CrossRef] [Scilit]
- McRae, B.H.; Kavanagh, D.M. Linkage Mapper Connectivity Analysis Software; The Nature Conservancy: Seattle, WA, USA, 2011. [Google Scholar]
- Park, H.; Jeong, A.; Koo, S.; Lee, S. Conservation strategies for endangered species in forests utilizing landscape connectivity models. Sustainability 2024, 16, 10970. [Google Scholar] [CrossRef] [Scilit]
- MacKinnon, M.; Pedersen Zari, M.; Brown, D.K. Improving urban habitat connectivity for native birds: Using least-cost path analyses to design urban green infrastructure networks. Land 2023, 12, 1456. [Google Scholar] [CrossRef] [Scilit]
- Adem Esmail, B.; Geneletti, D. Multi-criteria decision analysis for nature conservation: A review of 20 years of applications. Methods Ecol. Evol. 2018, 9, 42–53. [Google Scholar] [CrossRef] [Scilit]
- Red Latinoamericana y del Caribe para la Conservación de los Murciélagos (RELCOM). Santuario de los Murciélagos de Santa Eulalia (SICOMs, S-MX-002). Sitio de Importancia para la Conservación de los Murciélagos. 2025. Available online: https://www.relcomlatinoamerica.net/%C2%BFqu%C3%A9-hacemos/conservacion/aicoms-sicoms/aicoms-sicoms-buscador/ad/sicoms%2C2/santa-eulalia%2C233.html (accessed on 7 July 2025).
- Zhang, X.; Zhang, Z. Identification and optimization of urban avian ecological corridors in Kunming: Framework construction based on multi-model coupling and multi-scenario simulation. Diversity 2025, 17, 427. [Google Scholar] [CrossRef] [Scilit]
- Allegrini, C.; Korine, C.; Krasnov, B.R. Insectivorous bats in eastern Mediterranean planted pine forests—Effects of forest structure on foraging activity, diversity, and implications for management practices. Forests 2022, 13, 1411. [Google Scholar] [CrossRef] [Scilit]
- Mark, M.; Drake, E.; Kerwin, K.; Maslo, B. Non-native plants influence forest vegetative structure and the activity of eastern temperate insectivorous bats. Forests 2024, 15, 711. [Google Scholar] [CrossRef] [Scilit]
- McCracken, G.F.; Bernard, R.F.; Gamba-Rios, M.; Wolfe, R.; Krauel, J.J.; Jones, D.N.; Russell, A.L.; Brown, V.A. Rapid range expansion of the Brazilian free-tailed bat in the southeastern United States, 2008–2016. J. Mammal. 2018, 99, 312–320. [Google Scholar] [CrossRef] [Scilit]
- Bogoni, J.A.; Peres, C.A.; Ferraz, K.M.P.M.B. Medium- to large-bodied mammal surveys across the Neotropics are heavily biased against the most faunally intact assemblages. Mammal Rev. 2022, 52, 221–235. [Google Scholar] [CrossRef] [Scilit]
- Braun de Torrez, E.C.; Ober, H.K.; McCleery, R.A. Critically imperiled forest fragment supports bat diversity and activity within a subtropical grassland. J. Mammal. 2018, 99, 273–282. [Google Scholar] [CrossRef] [Scilit]
- McCracken, G.F.; Safi, K.; Kunz, T.H.; Dechmann, D.K.; Swartz, S.M.; Wikelski, M. Airplane tracking documents the fastest flight speeds recorded for bats. R. Soc. Open Sci. 2016, 3, 160398. [Google Scholar] [CrossRef] [Scilit]
- Barré, K.; Vernet, A.; Azam, C.; Le Viol, I.; Dumont, A.; Deana, T.; Vincent, S.; Challéat, S.; Kerbiriou, C. Landscape composition drives the impacts of artificial light at night on insectivorous bats. Environ. Pollut. 2022, 292, 118394. [Google Scholar] [CrossRef] [Scilit]
- Straka, T.M.; Lentini, P.E.; Lumsden, L.F.; Buchholz, S.; Wintle, B.A.; van der Ree, R. Clean and green urban water bodies benefit nocturnal flying insects and their predators, insectivorous bats. Sustainability 2020, 12, 2634. [Google Scholar] [CrossRef] [Scilit]
- Myczko, Ł.; Sparks, T.H.; Skórka, P.; Rosin, Z.M.; Kwieciński, Z.; Górecki, M.T.; Tryjanowski, P. Effects of local roads and car traffic on the occurrence pattern and foraging behaviour of bats. Transp. Res. Part D Transp. Environ. 2017, 56, 222–228. [Google Scholar] [CrossRef] [Scilit]
- Lacoeuilhe, A.; Machon, N.; Julien, J.F.; Kerbiriou, C. The relative effects of local and landscape characteristics of hedgerows on bats. Diversity 2018, 10, 72. [Google Scholar] [CrossRef] [Scilit]
- Finch, D.; Corbacho, D.P.; Schofield, H.; Davison, S.; Wright, P.G.; Broughton, R.K.; Mathews, F. Modelling the functional connectivity of landscapes for greater horseshoe bats (Rhinolophus ferrumequinum) at a local scale. Landsc. Ecol. 2020, 35, 577–589. [Google Scholar] [CrossRef] [Scilit]
- Finch, D.; Schofield, H.; Mathews, F. Habitat associations of bats in an agricultural landscape: Linear features versus open habitats. Animals 2020, 10, 1856. [Google Scholar] [CrossRef] [Scilit] [PubMed]
- Keeley, A.T.; Beier, P.; Keeley, B.W.; Fagan, M.E. Habitat suitability is a poor proxy for landscape connectivity during dispersal and mating movements. Landsc. Urban Plan. 2017, 161, 90–102. [Google Scholar] [CrossRef] [Scilit]
- Pinaud, D.; Claireau, F.; Leuchtmann, M.; Kerbiriou, C. Modelling landscape connectivity for greater horseshoe bat using an empirical quantification of resistance. J. Appl. Ecol. 2018, 55, 2600–2611. [Google Scholar] [CrossRef] [Scilit]
- Boyles, J.G.; Cryan, P.M.; McCracken, G.F.; Kunz, T.H. Economic importance of bats in agriculture. Science 2011, 332, 41–42. [Google Scholar] [CrossRef] [Scilit]
- Kunz, T.H.; Braun de Torrez, E.; Bauer, D.; Lobova, T.; Fleming, T.H. Ecosystem services provided by bats. Ann. N. Y. Acad. Sci. 2011, 1223, 1–38. [Google Scholar] [CrossRef] [Scilit]
- Sapir, N.; Horvitz, N.; Dechmann, D.K.; Fahr, J.; Wikelski, M. Commuting fruit bats beneficially modulate their flight in relation to wind. Proc. R. Soc. B 2014, 281, 20140018. [Google Scholar] [CrossRef] [Scilit]
- Keeley, A.T.; Beier, P.; Jenness, J.S. Connectivity metrics for conservation planning and monitoring. Biol. Conserv. 2021, 255, 109008. [Google Scholar] [CrossRef] [Scilit]
- Werber, Y. Batscan: A radar classification tool reveals large-scale bat migration patterns. Methods Ecol. Evol. 2023, 14, 1764–1779. [Google Scholar] [CrossRef] [Scilit]
- Happ, C.; Sutor, A.; Hochradel, K. UAV-based 3D calibration of thermal cameras for bat flight monitoring in large outdoor environments. Remote Sens. 2024, 16, 4682. [Google Scholar] [CrossRef] [Scilit]
- Erhardt, S.; Koch, M.; Kiefer, A.; Veith, M.; Weigel, R.; Koelpin, A. Mobile-BAT—A novel ultra-low-power wildlife tracking system. Sensors 2023, 23, 5236. [Google Scholar] [CrossRef] [Scilit]
- Hermans, C.; Koblitz, J.C.; Bartholomeus, H.; Stilz, P.; Visser, M.E.; Spoelstra, K. Combining acoustic tracking and LiDAR to study bat flight behaviour in three-dimensional space. Mov. Ecol. 2023, 11, 25. [Google Scholar] [CrossRef] [Scilit]
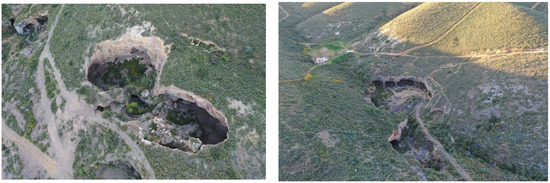
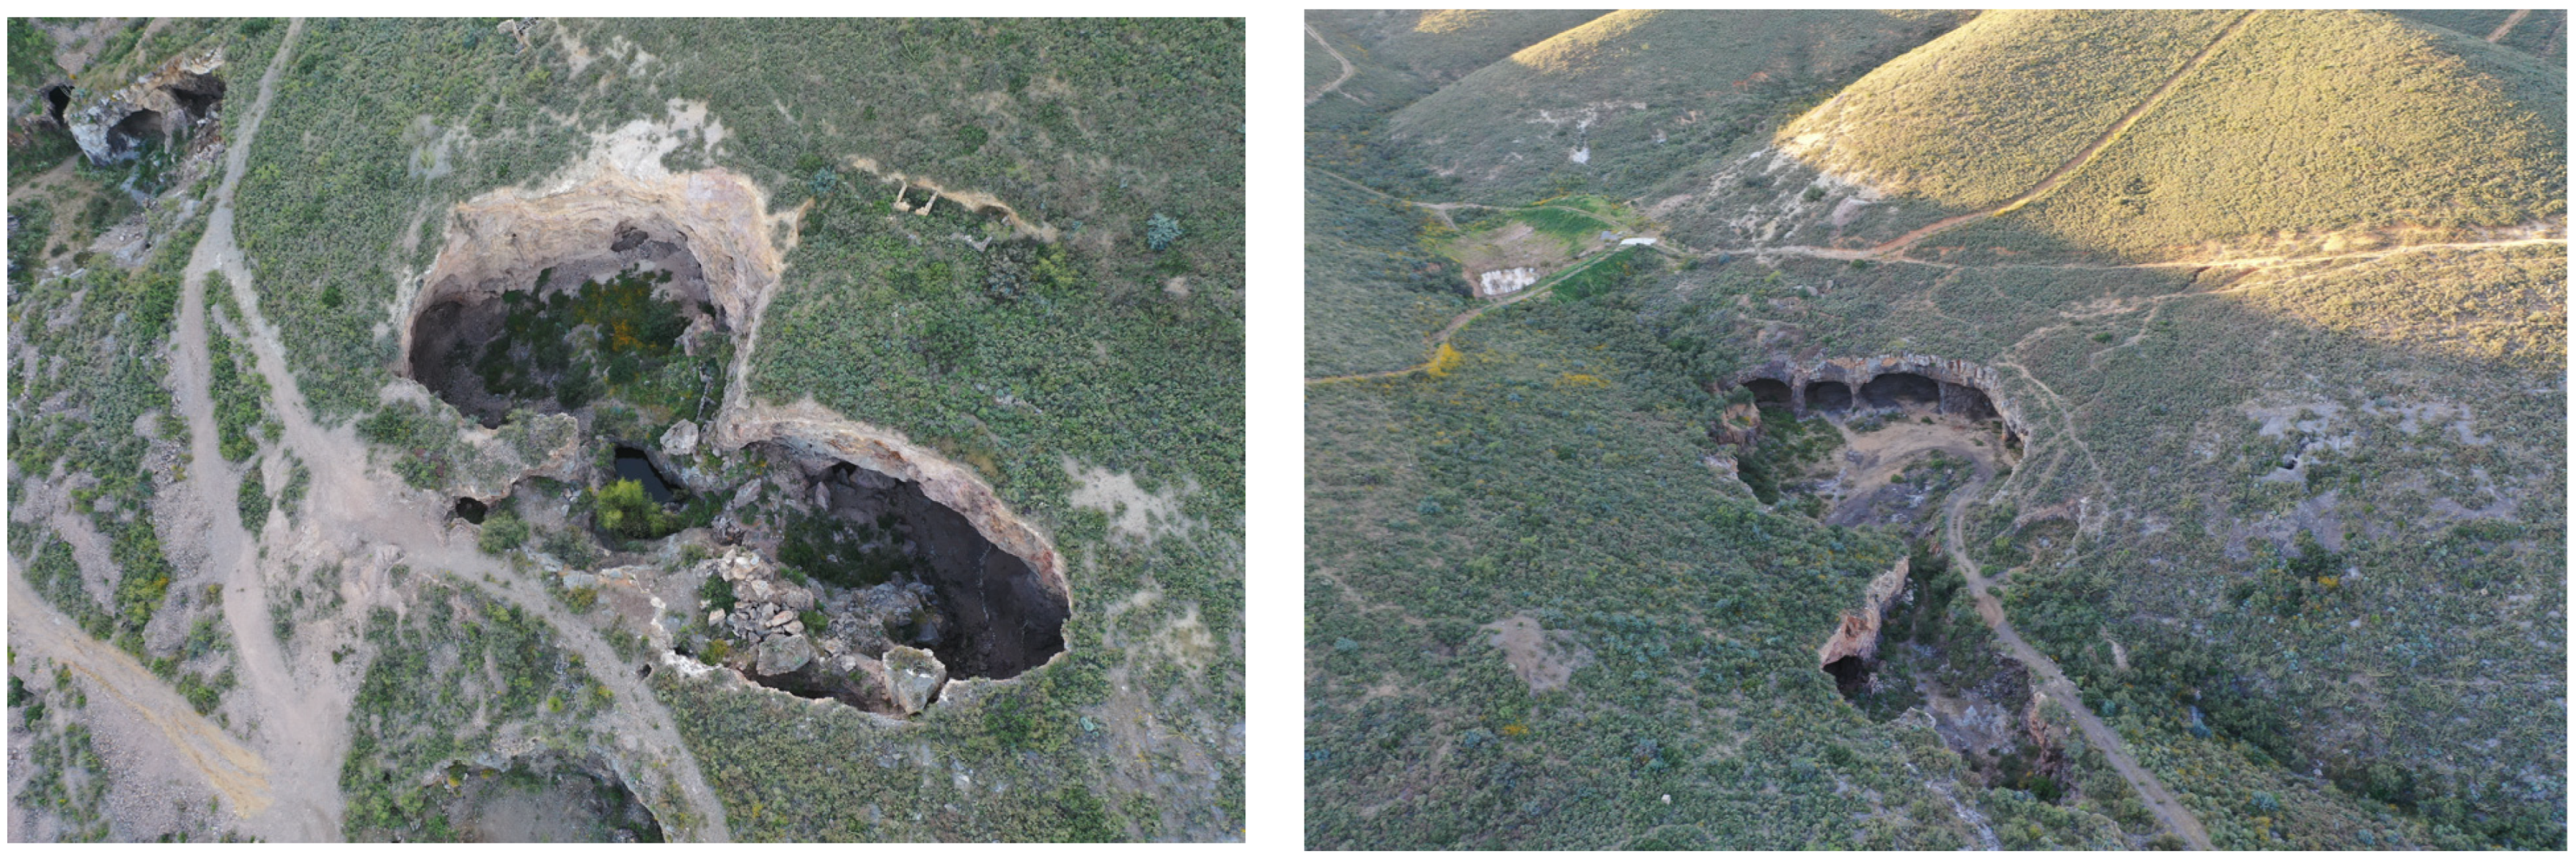
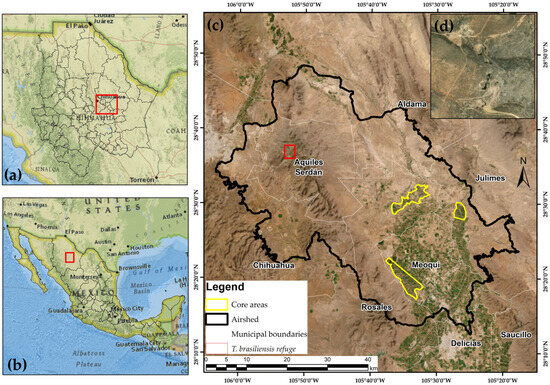
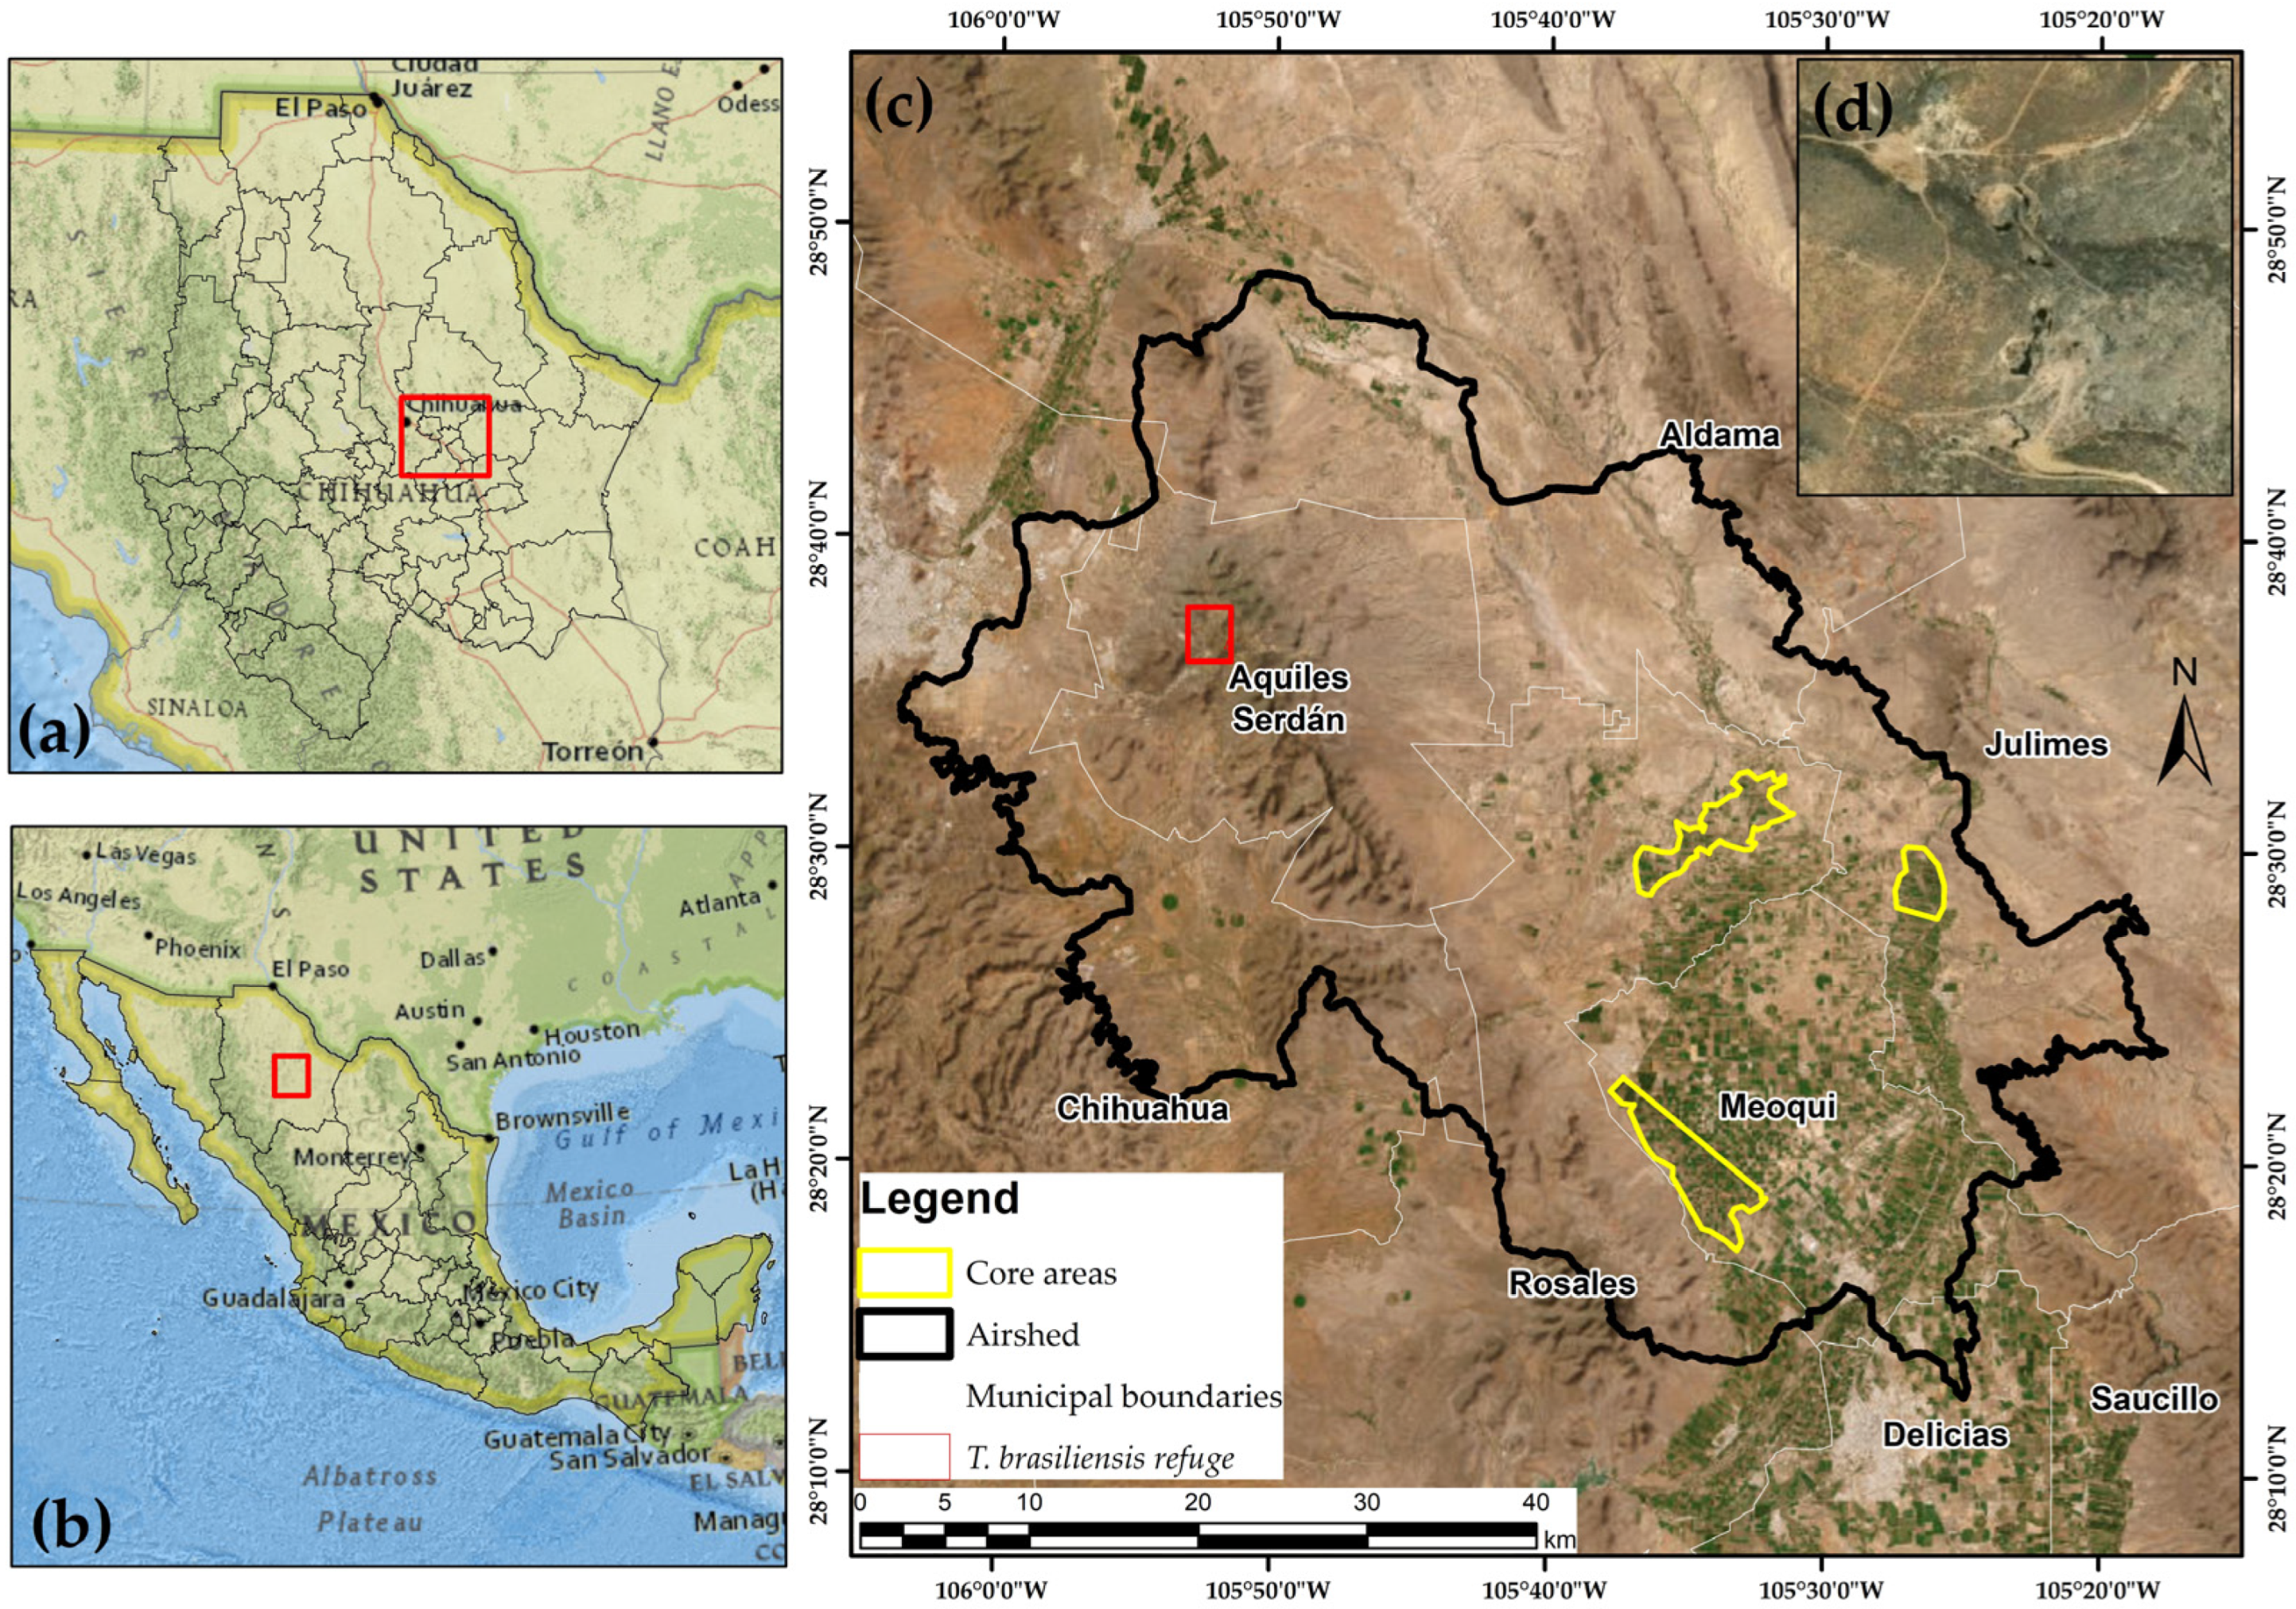
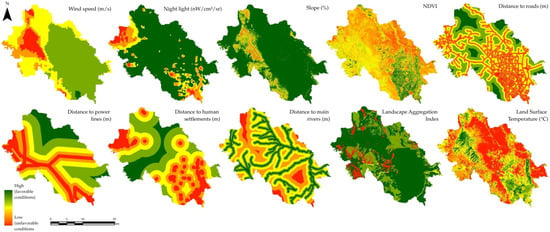
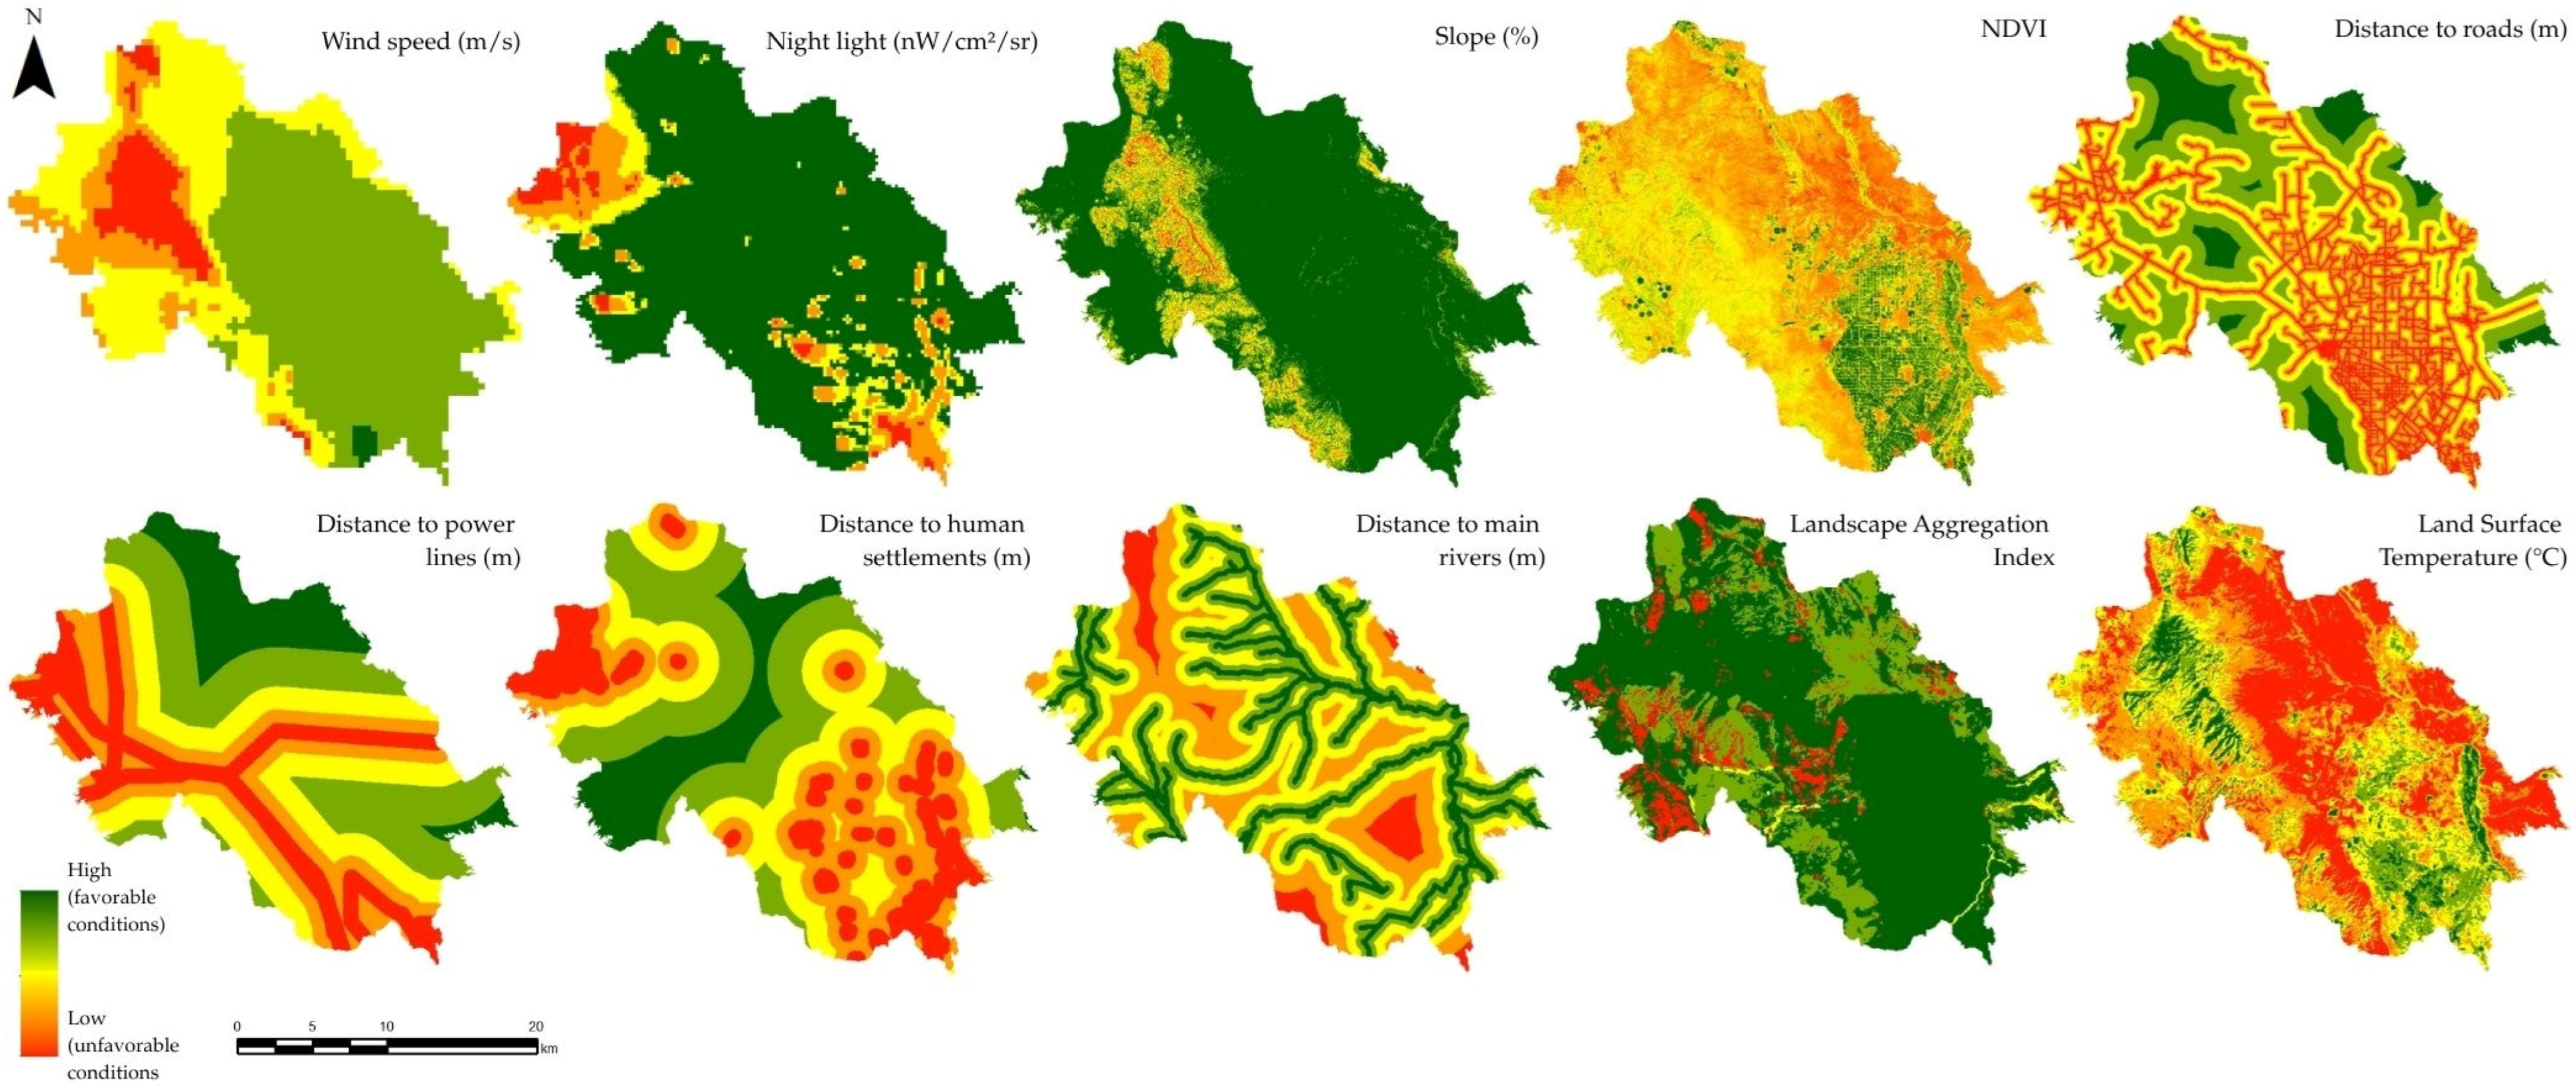
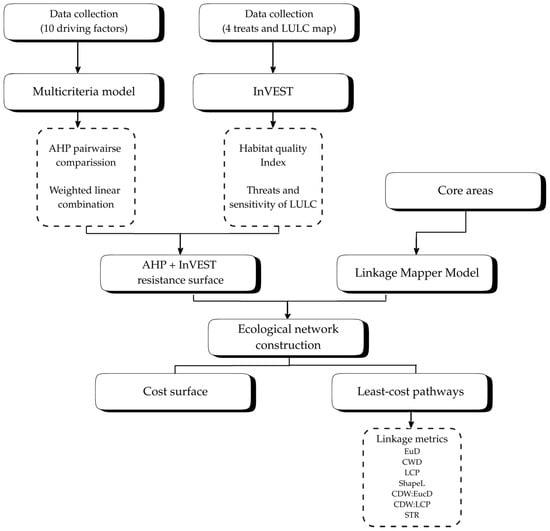
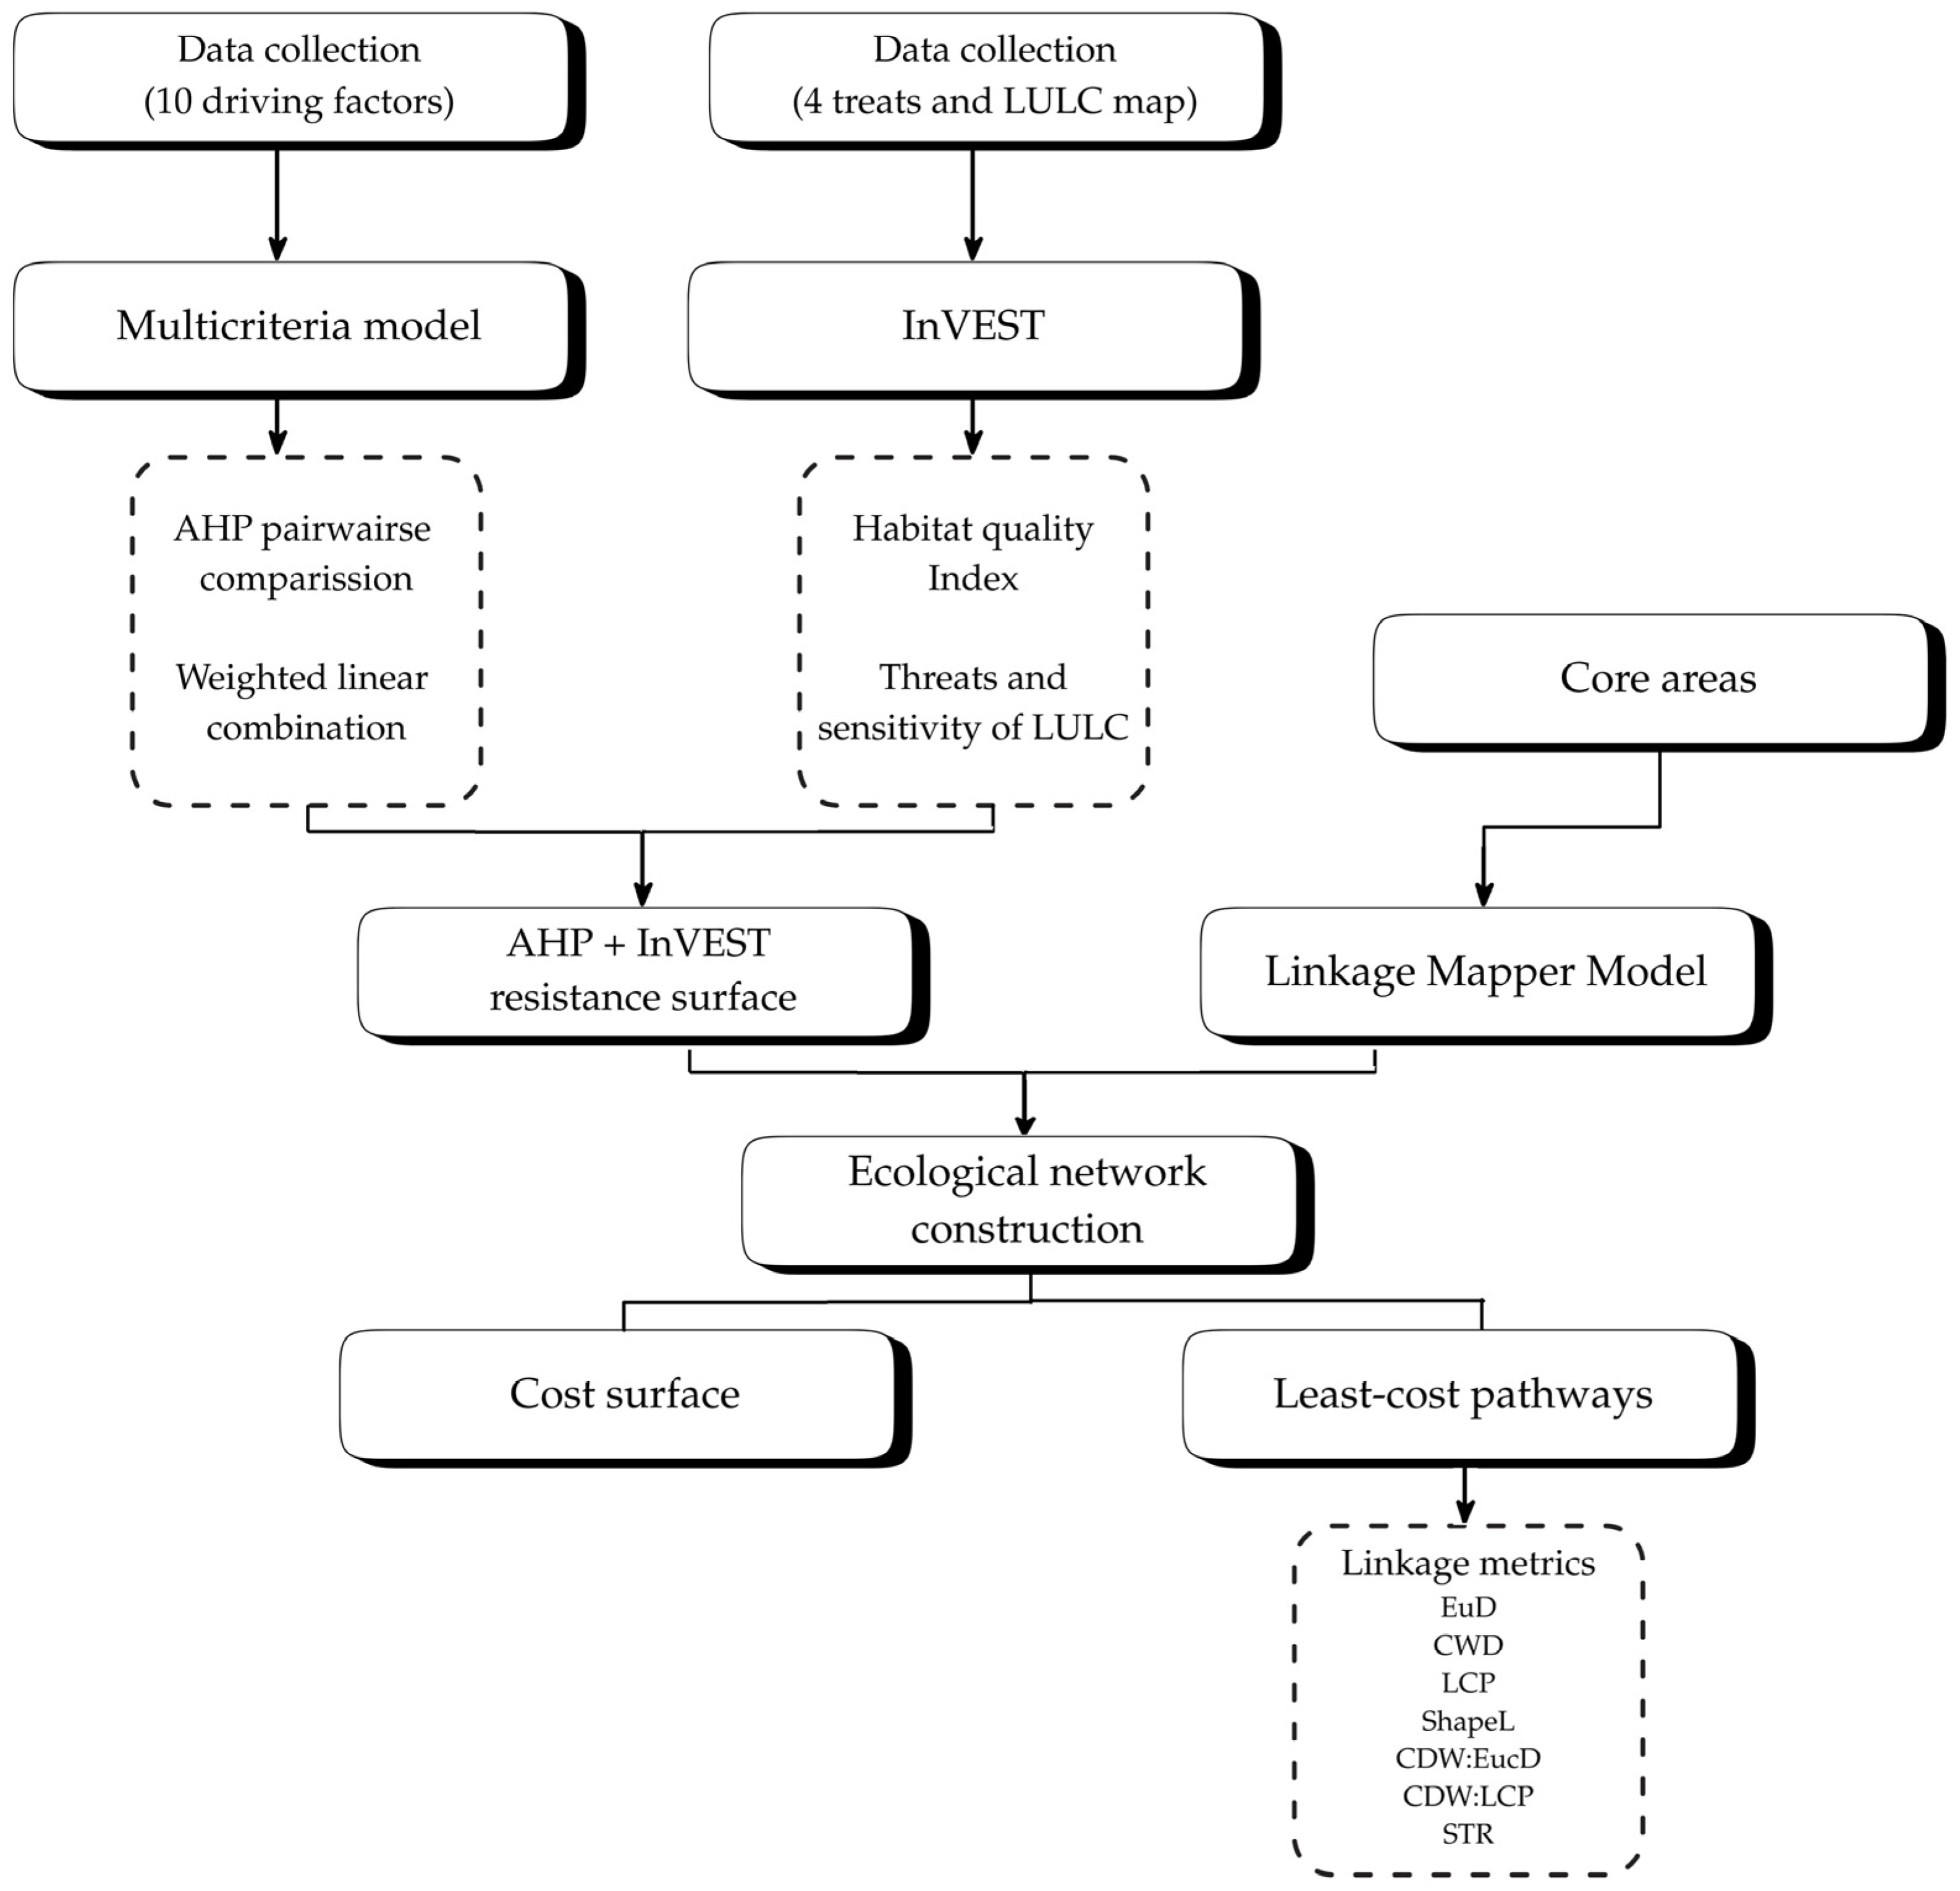
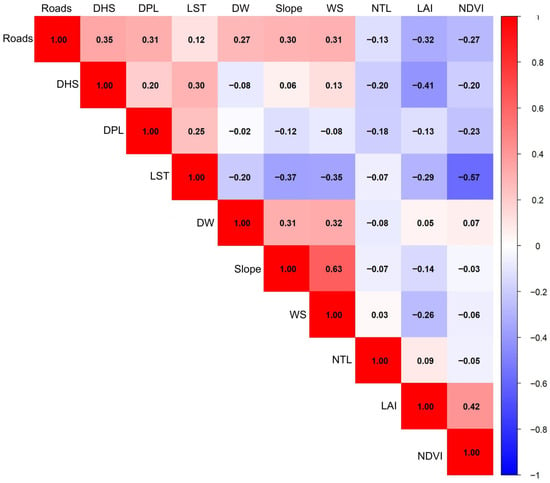
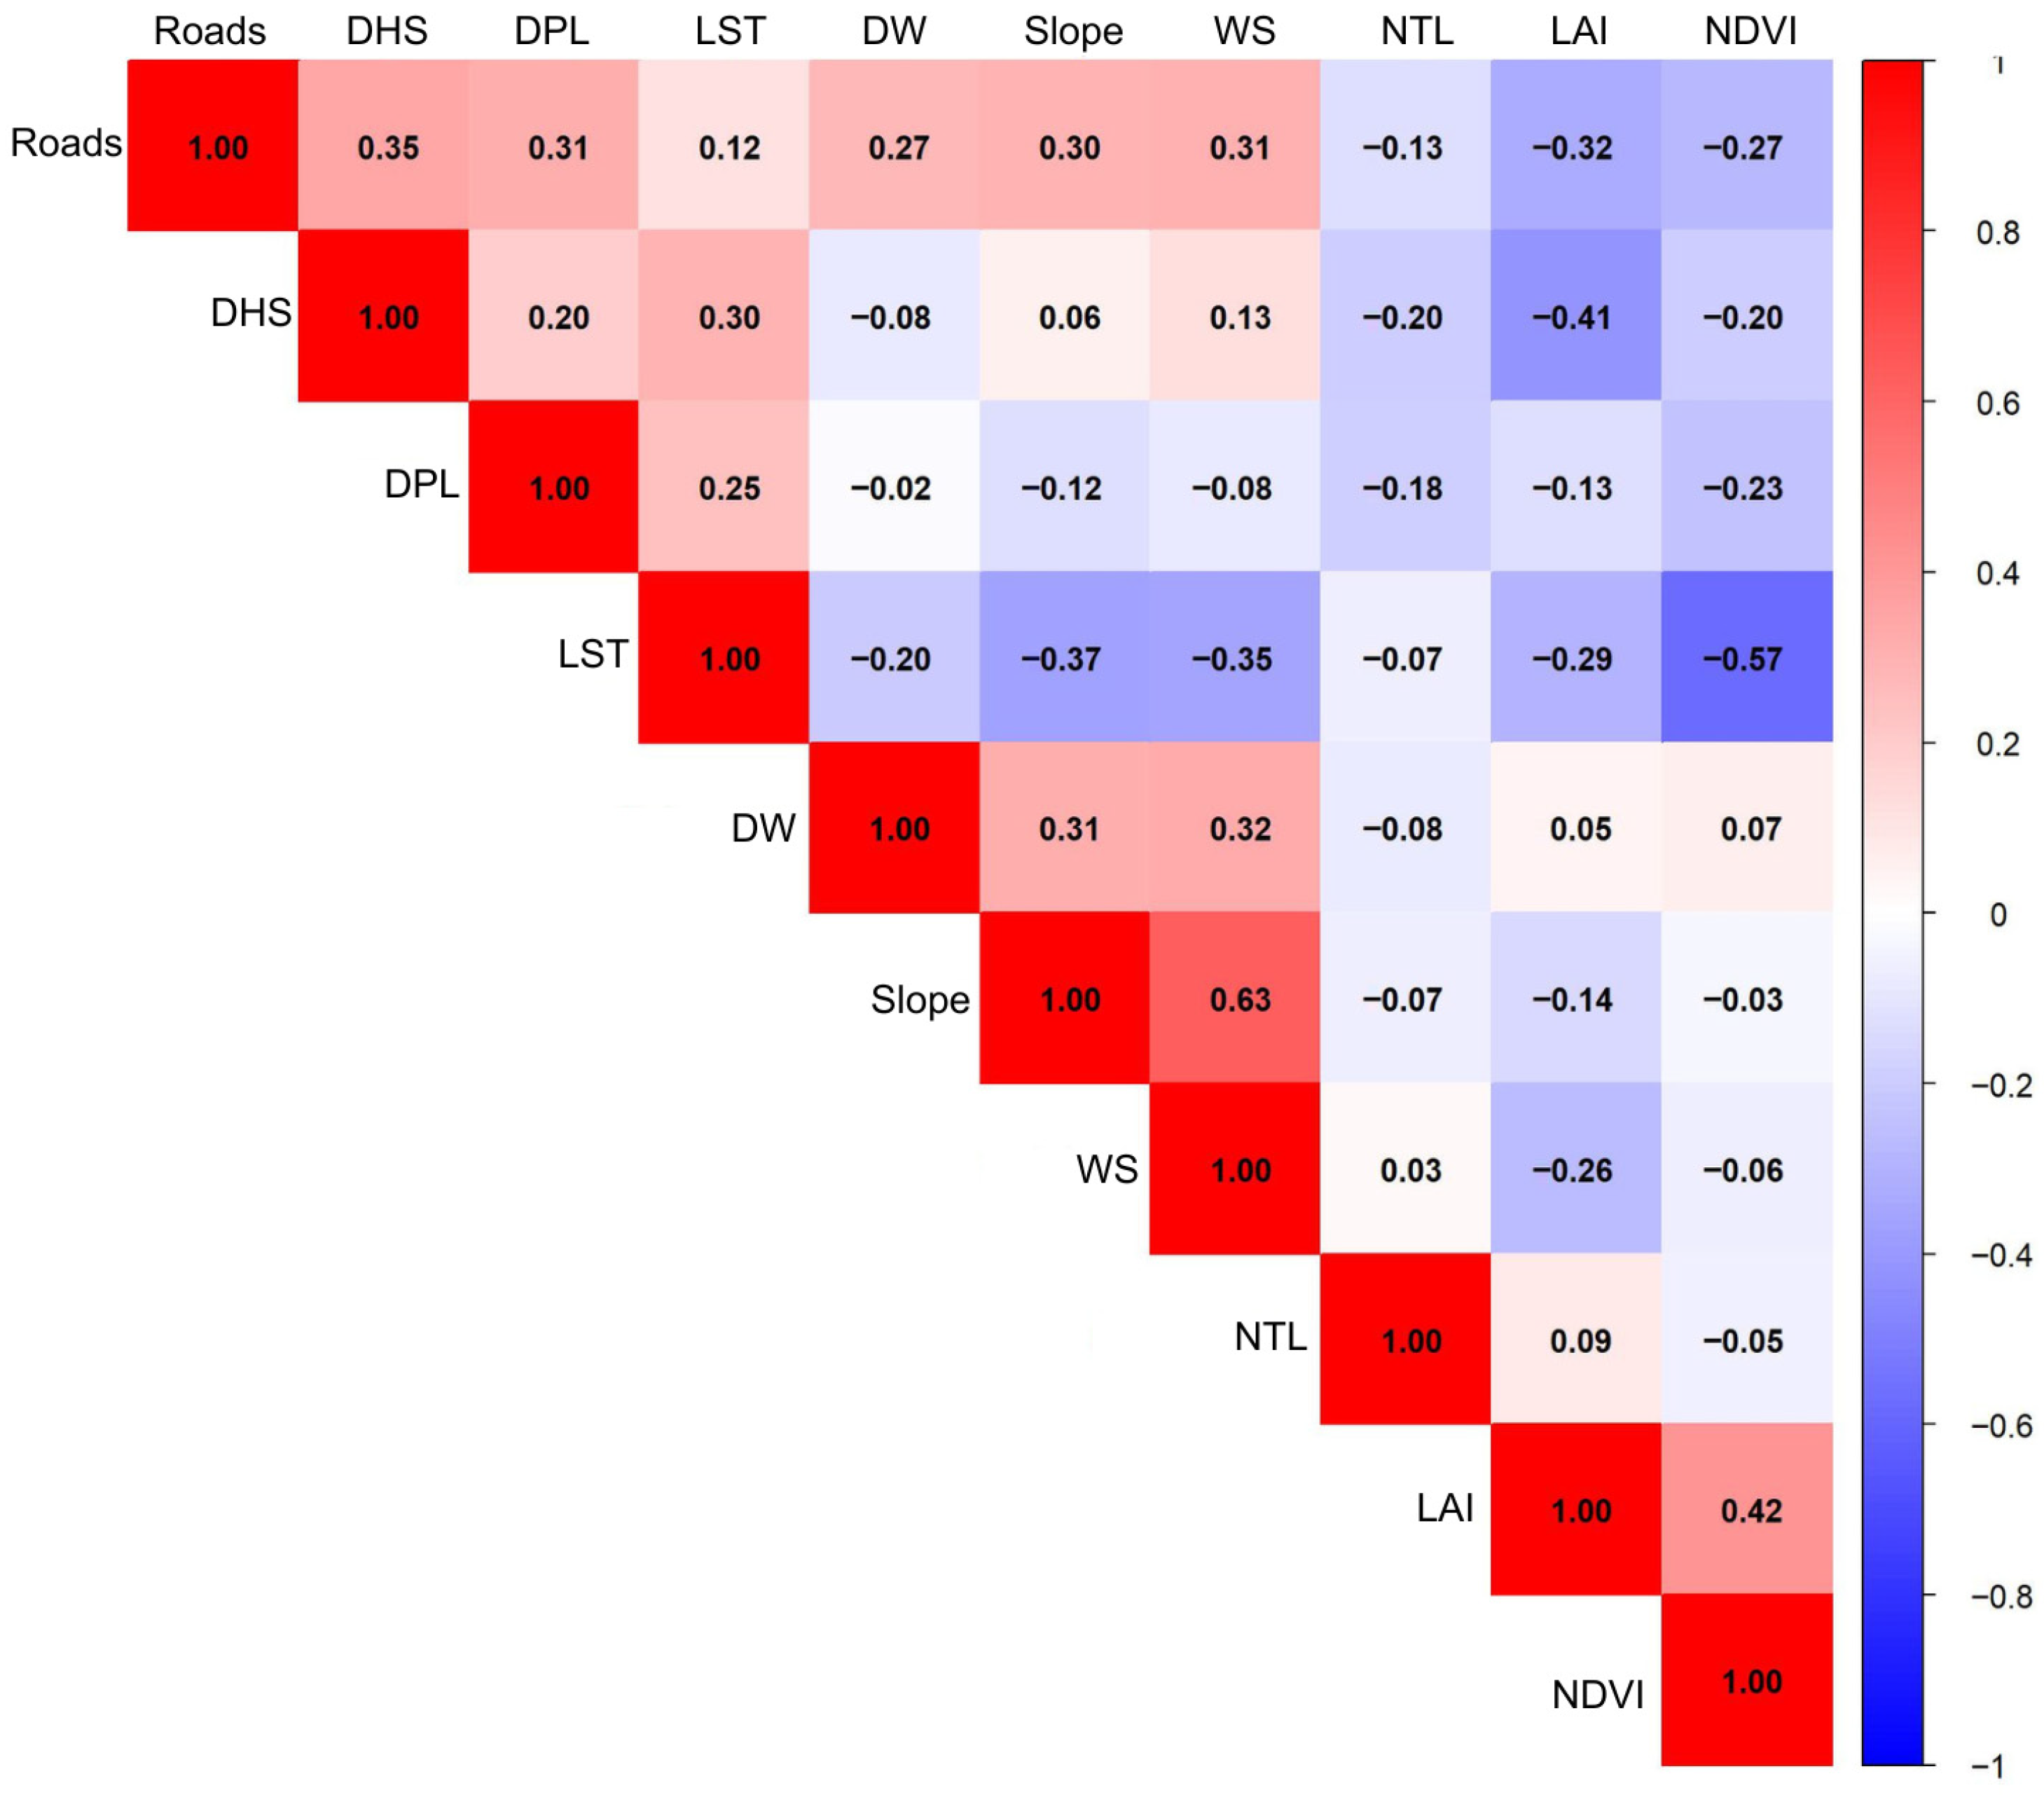
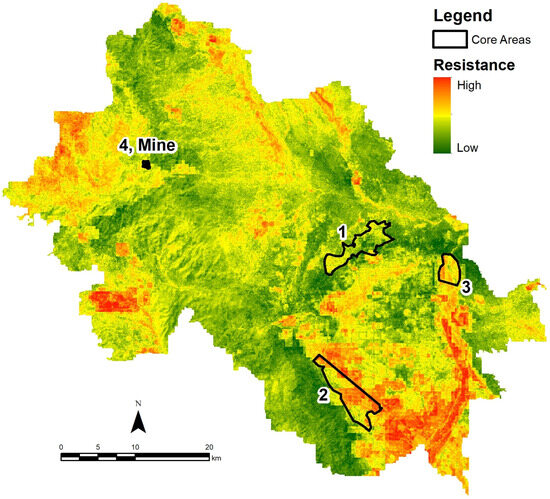
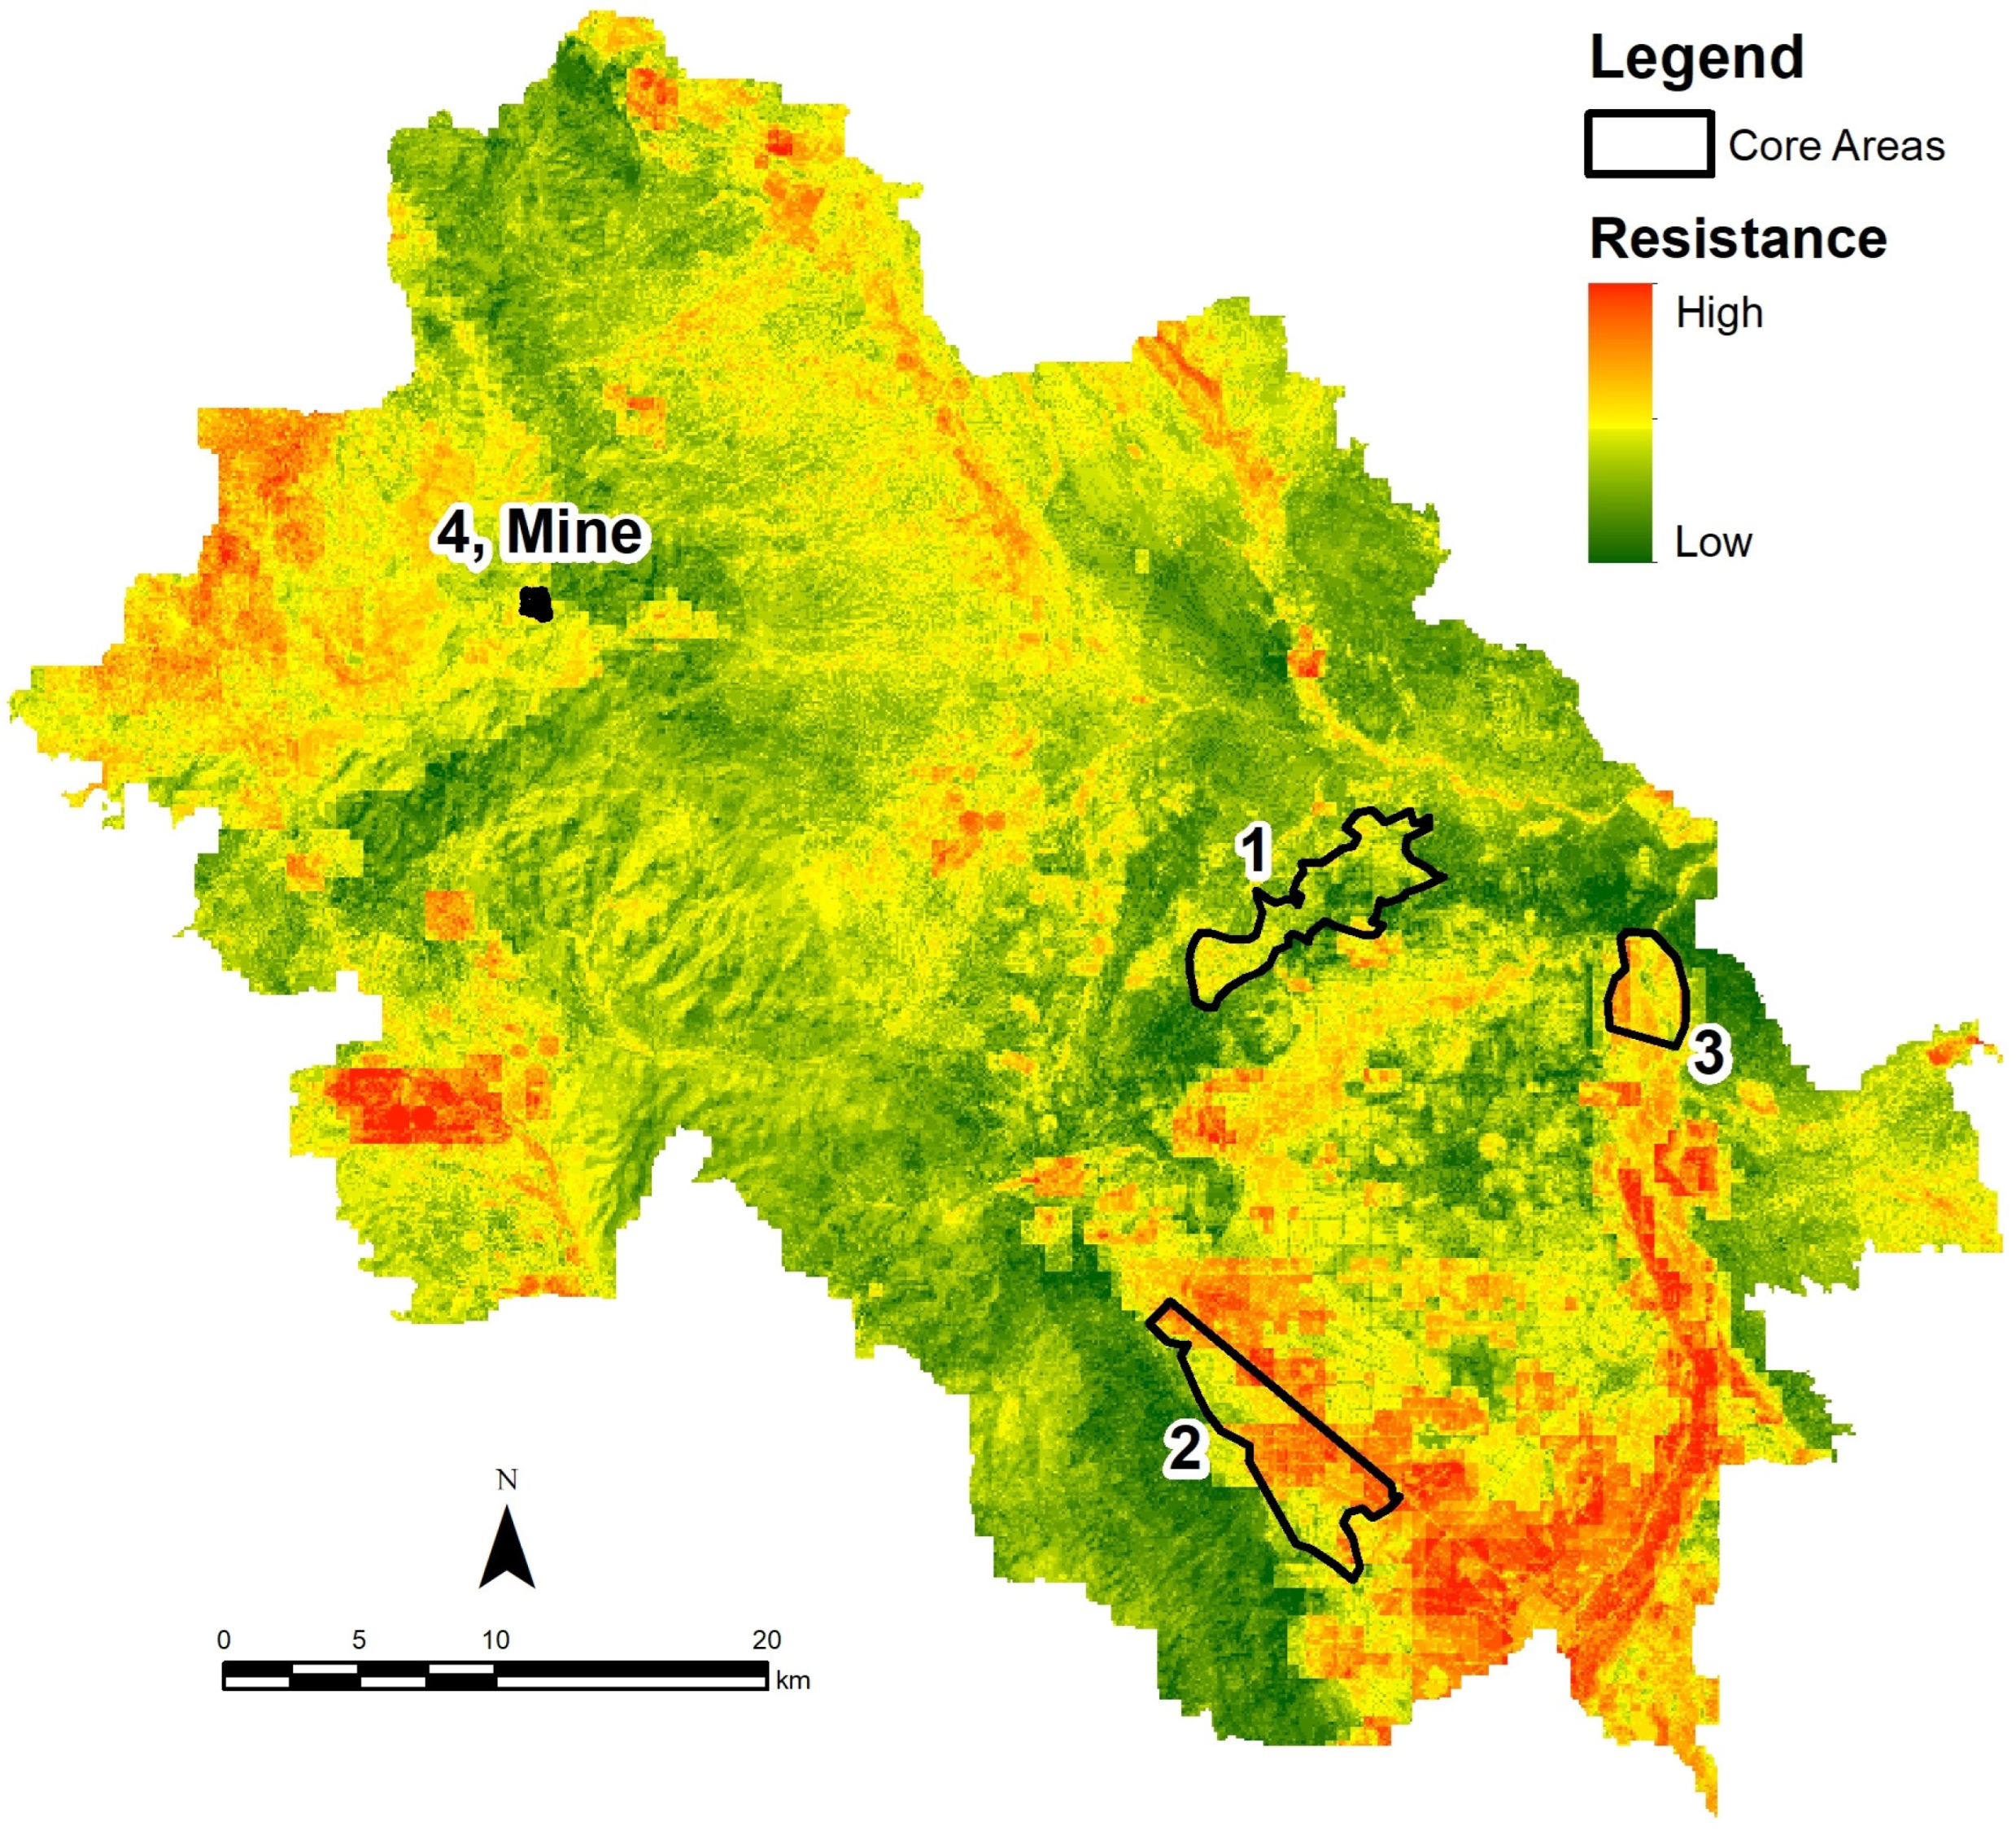
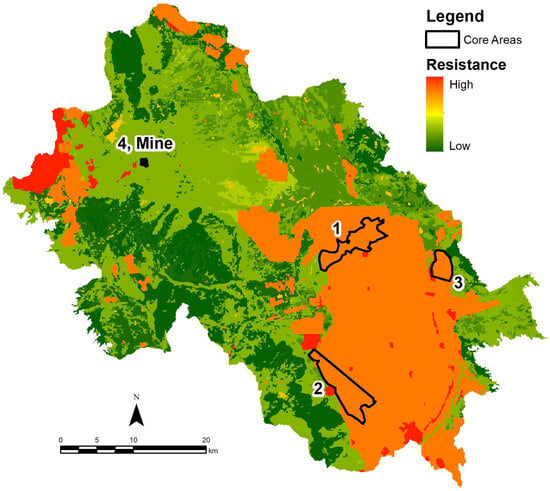
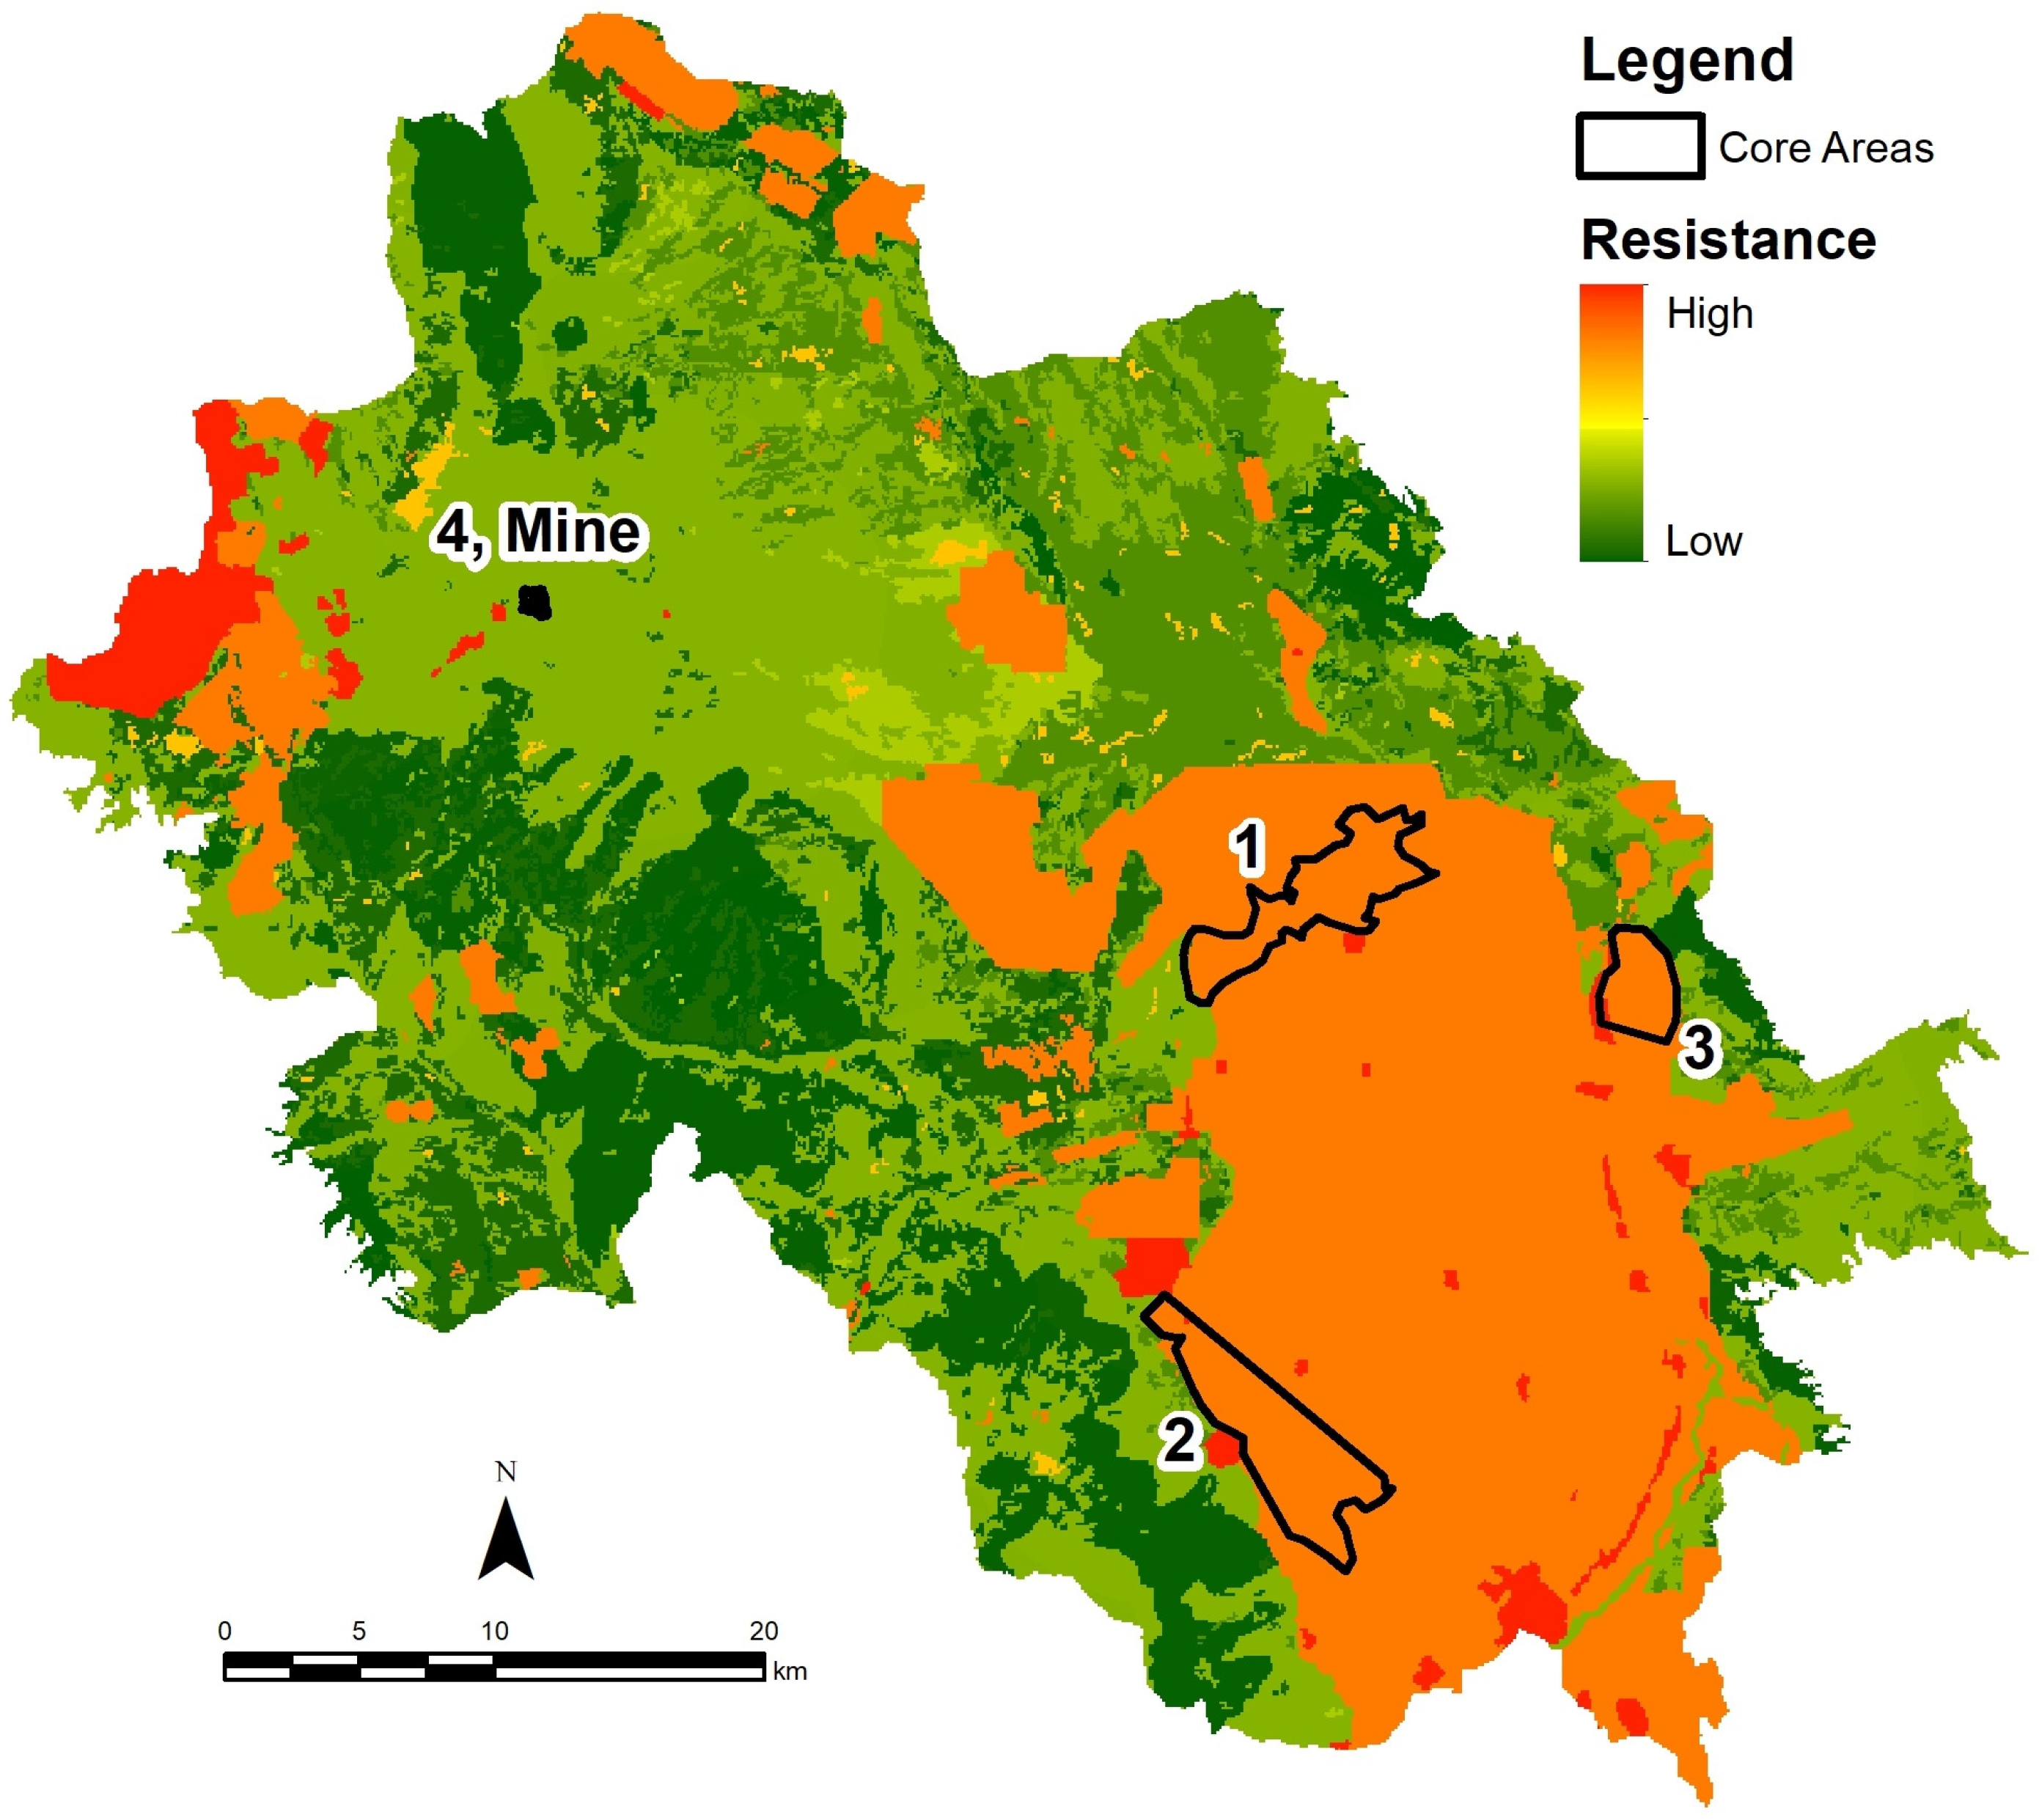
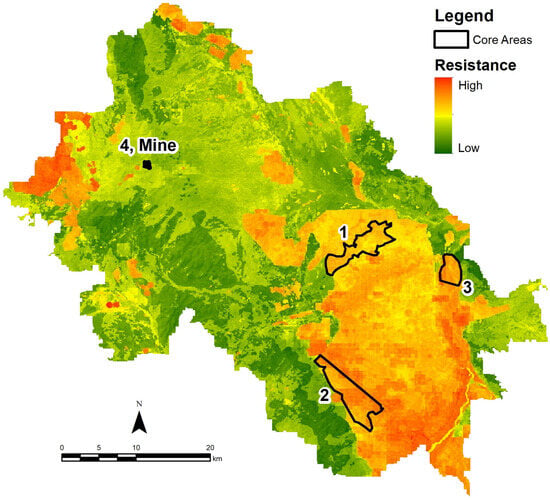
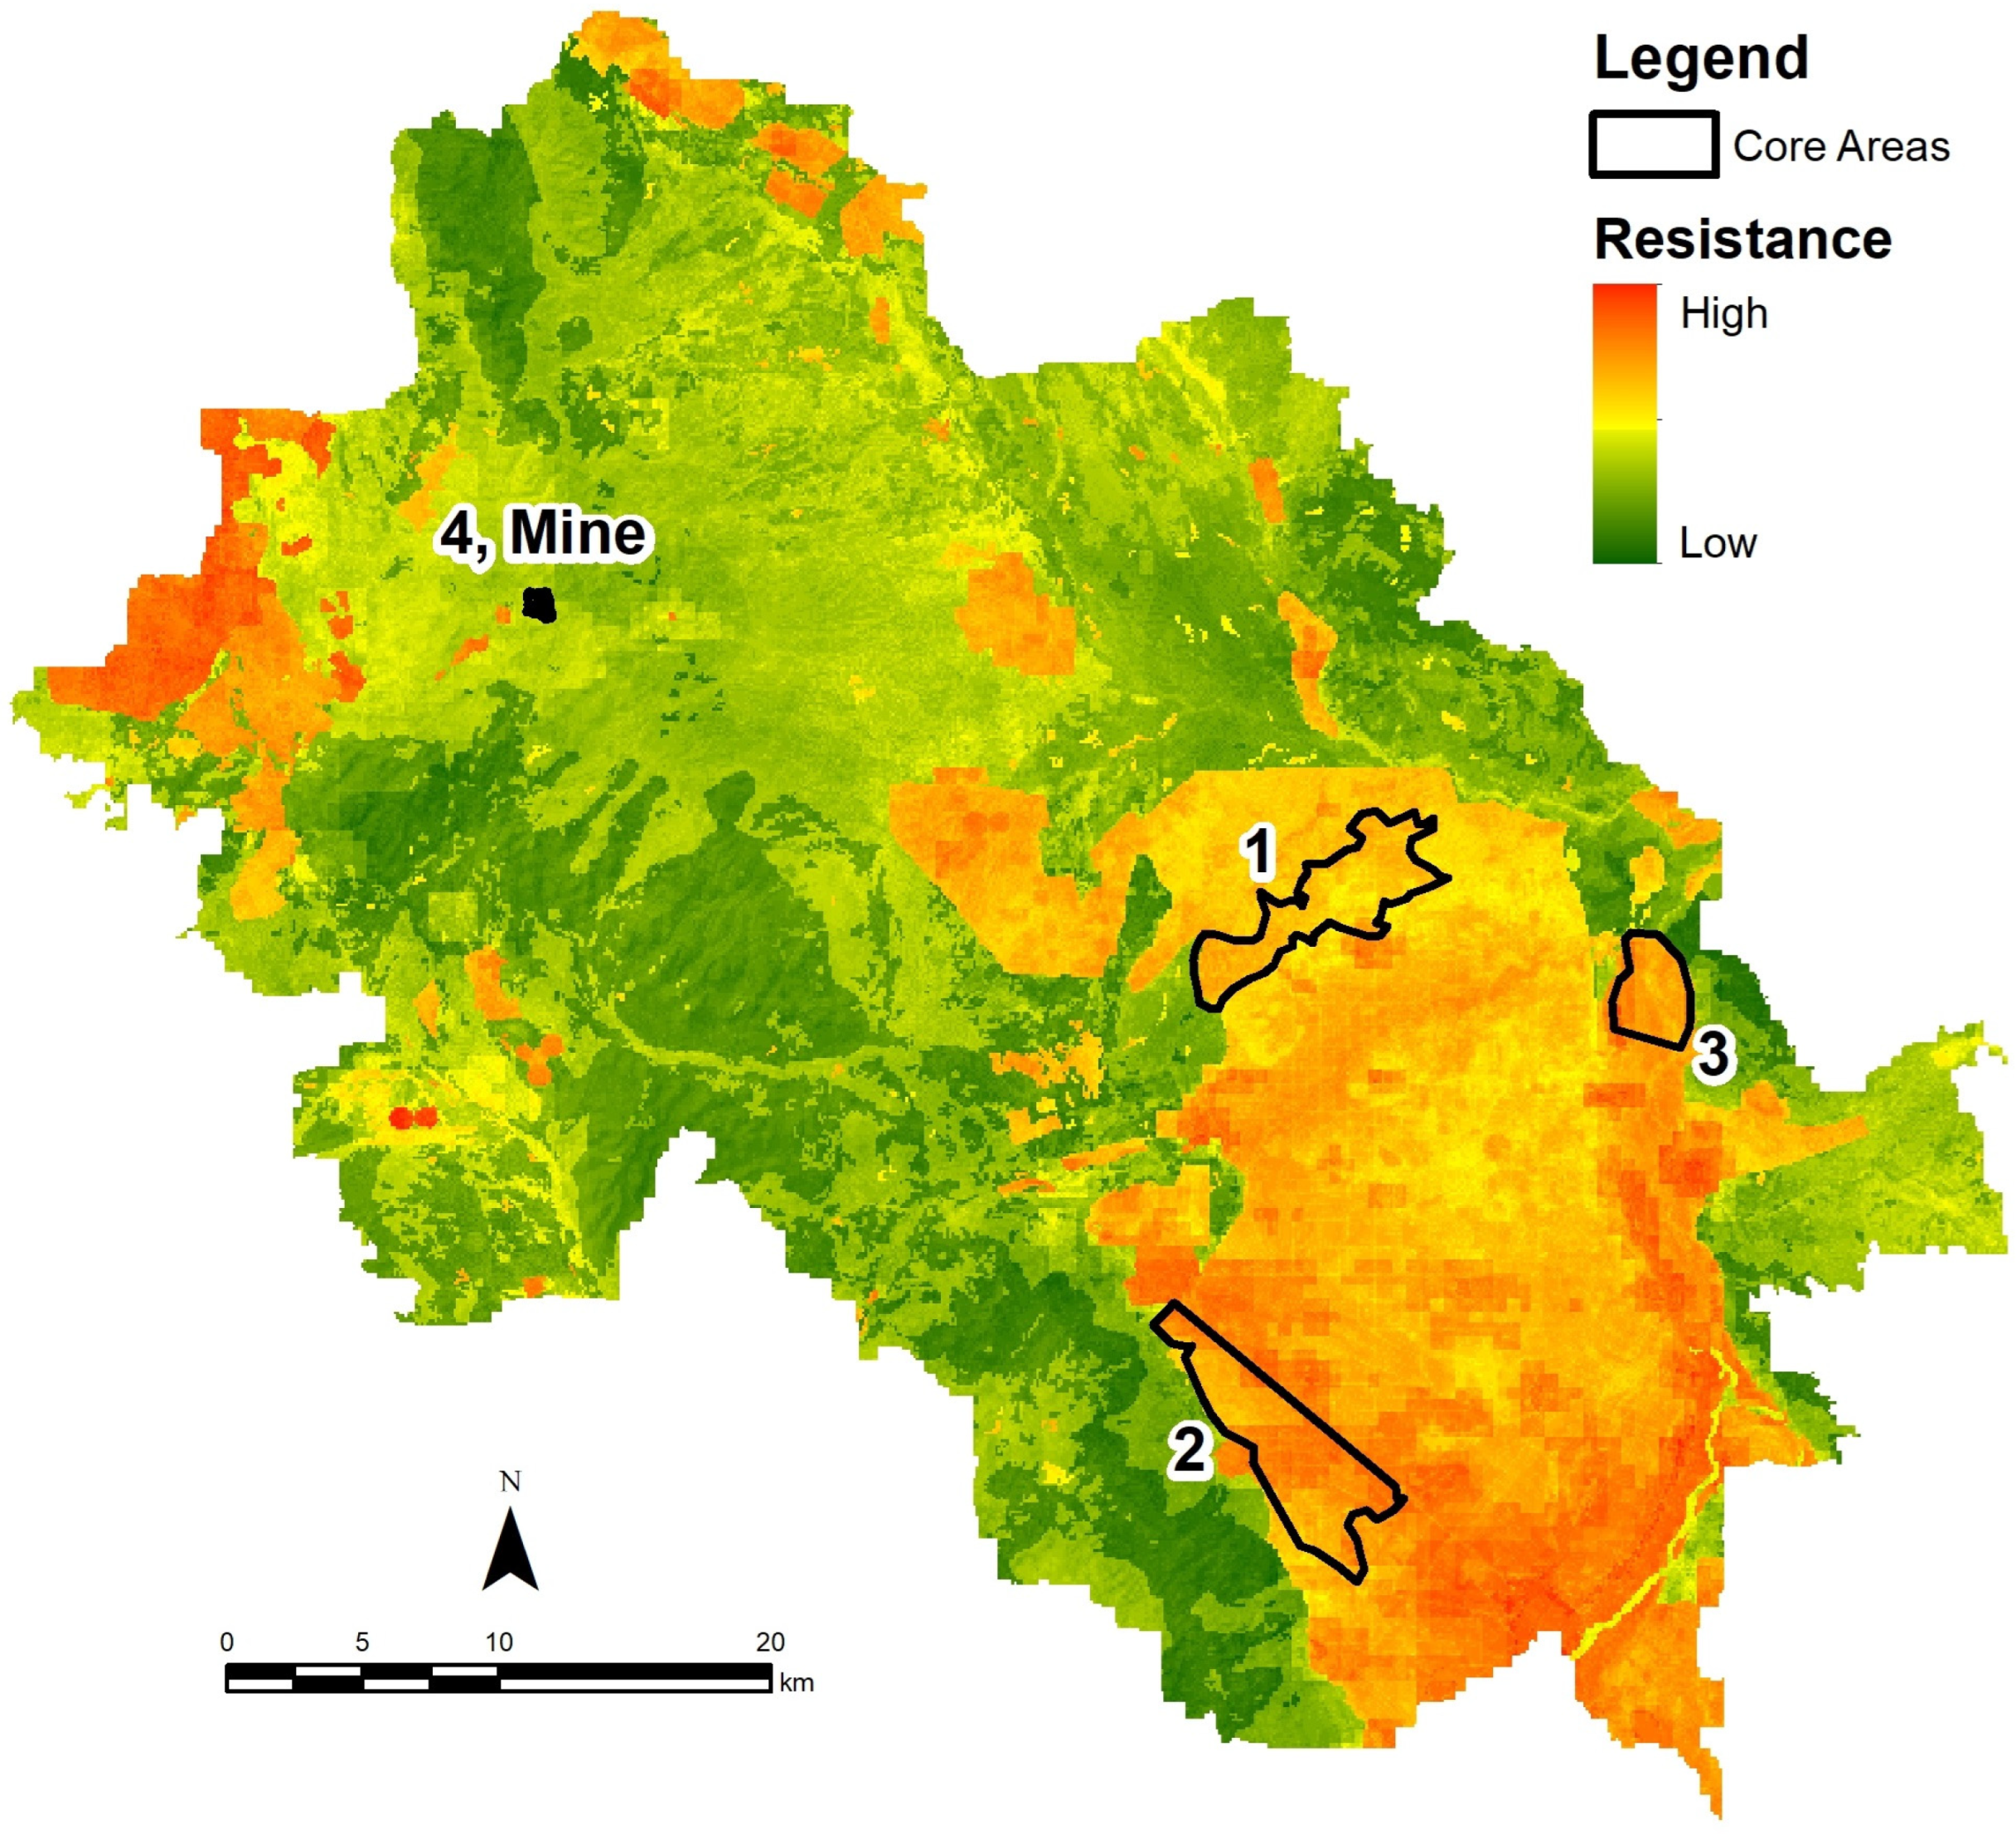
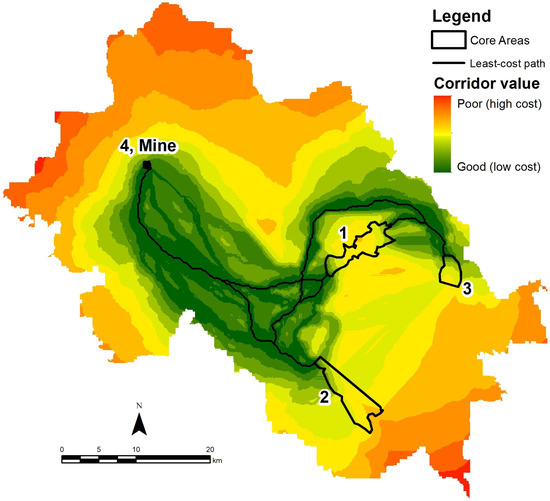
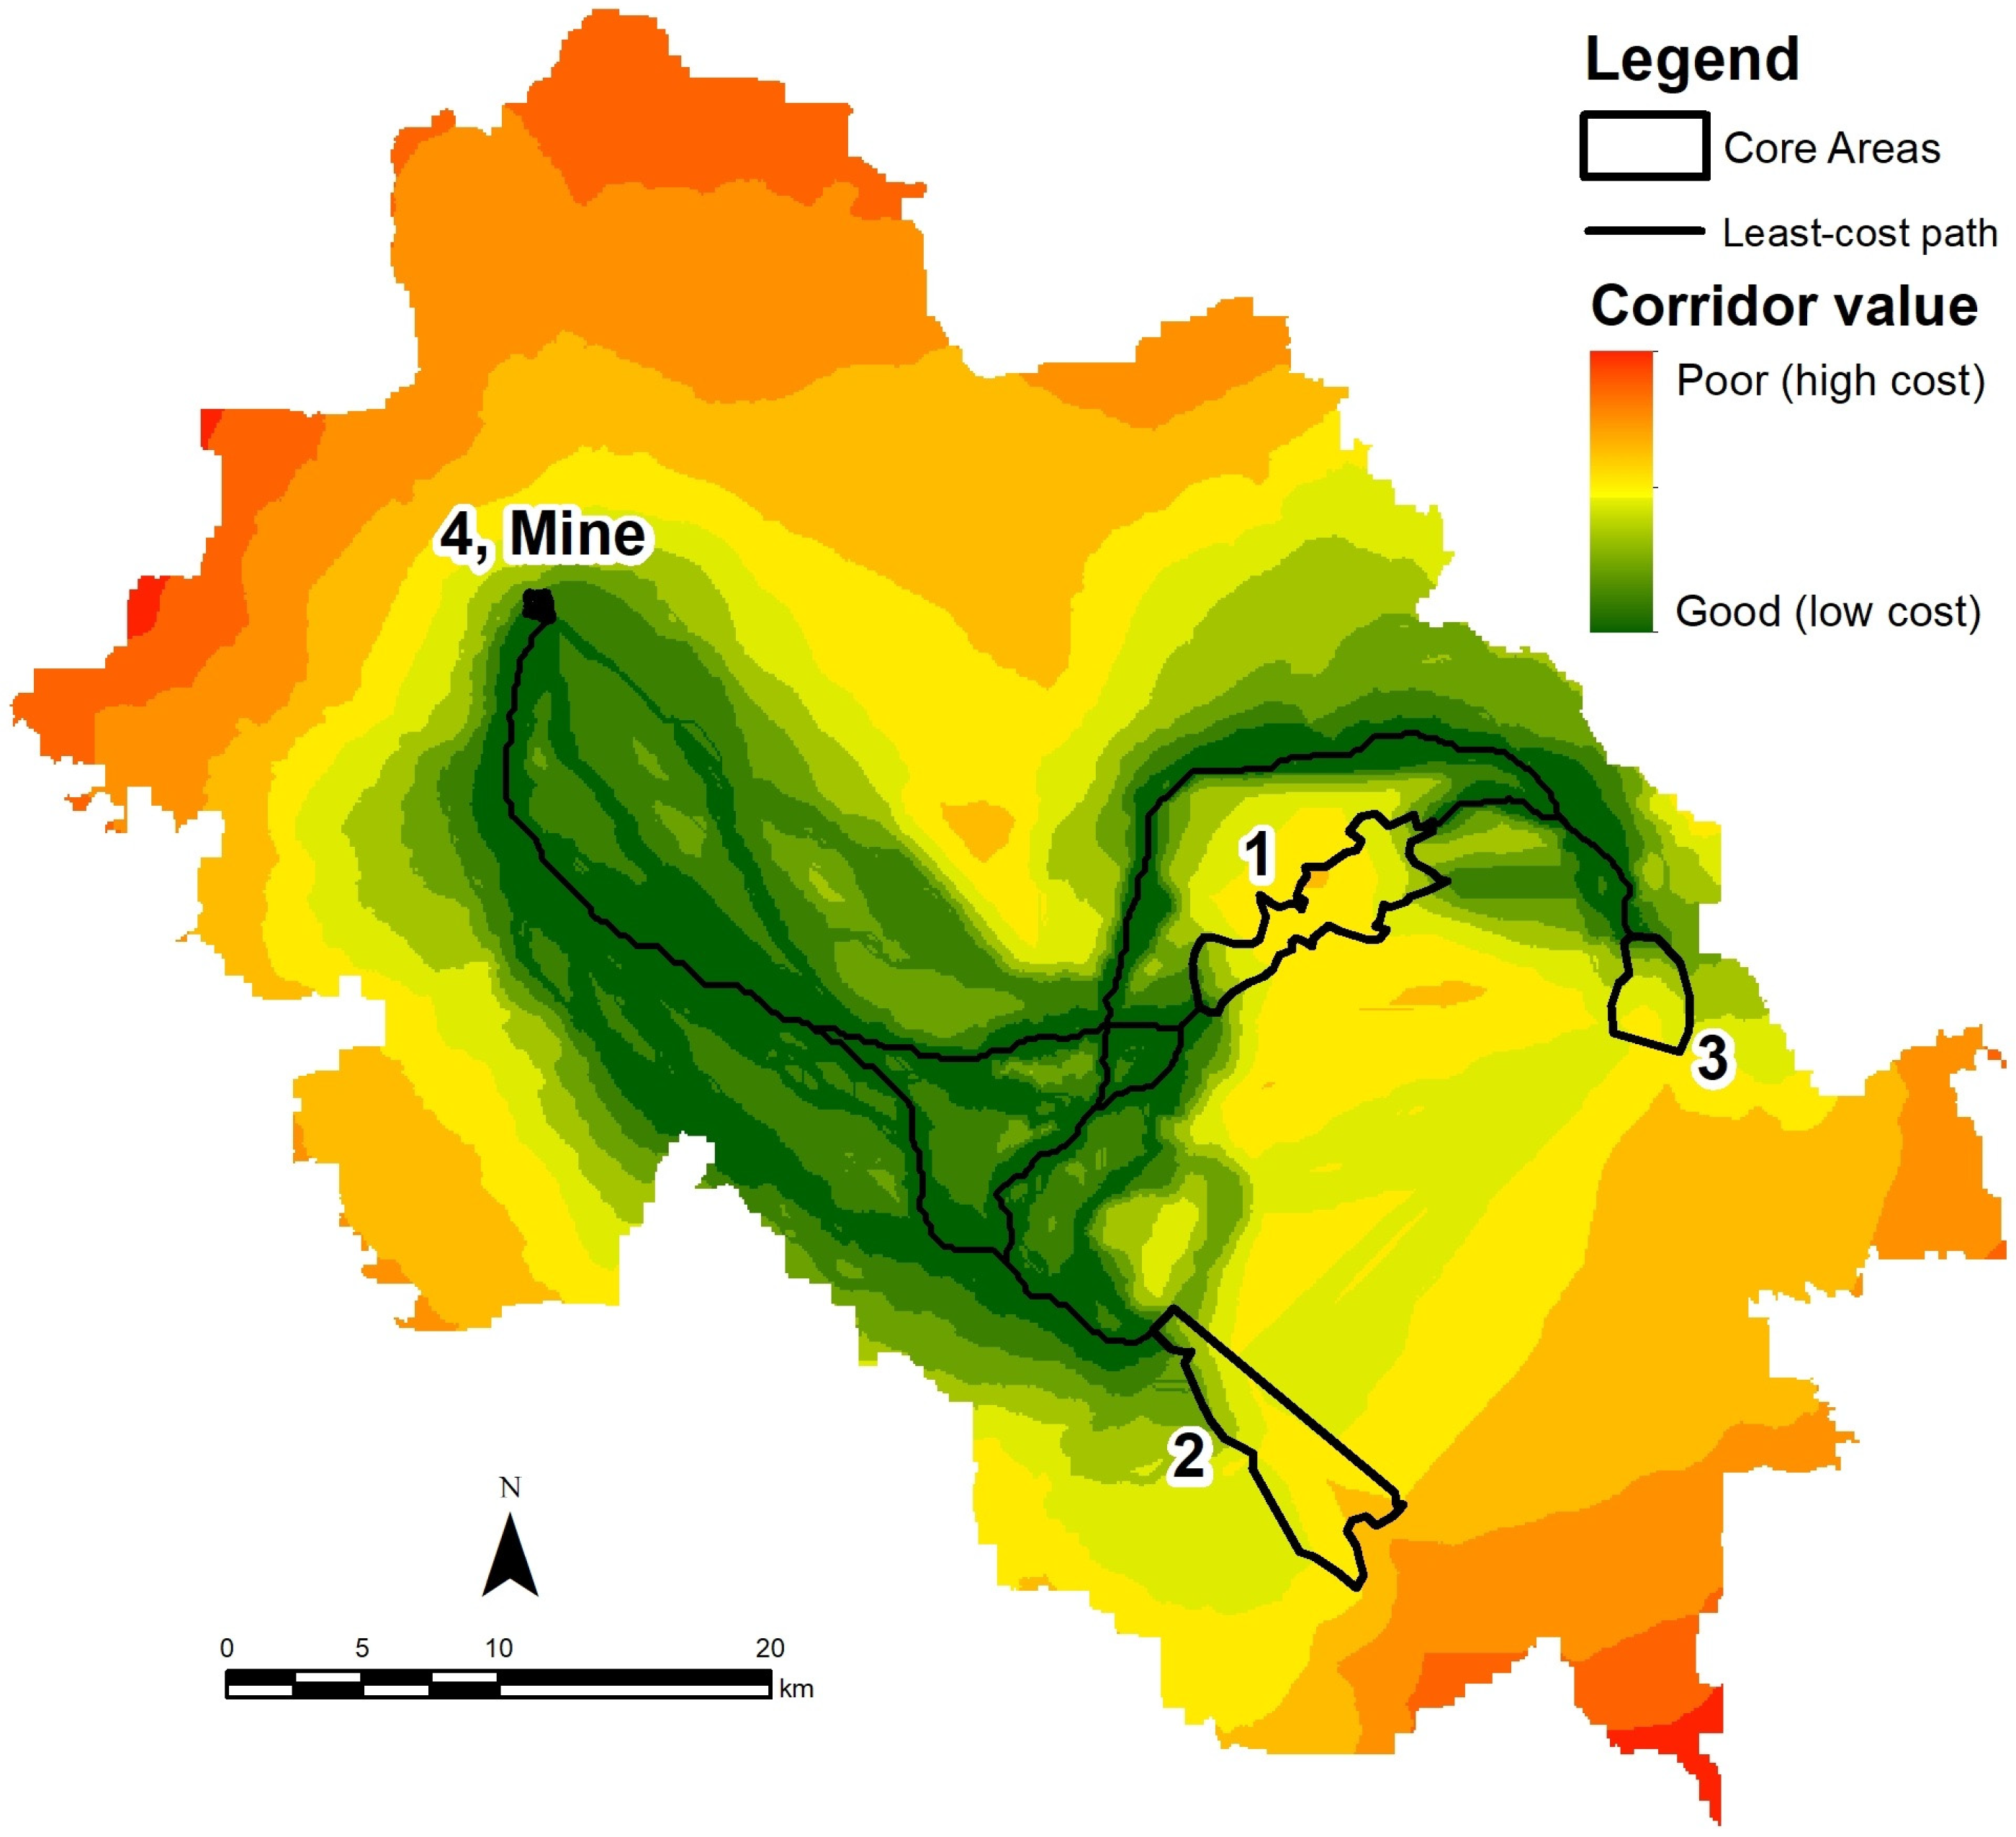
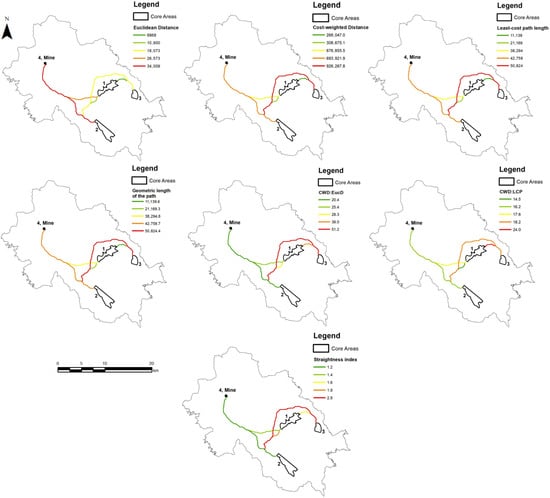
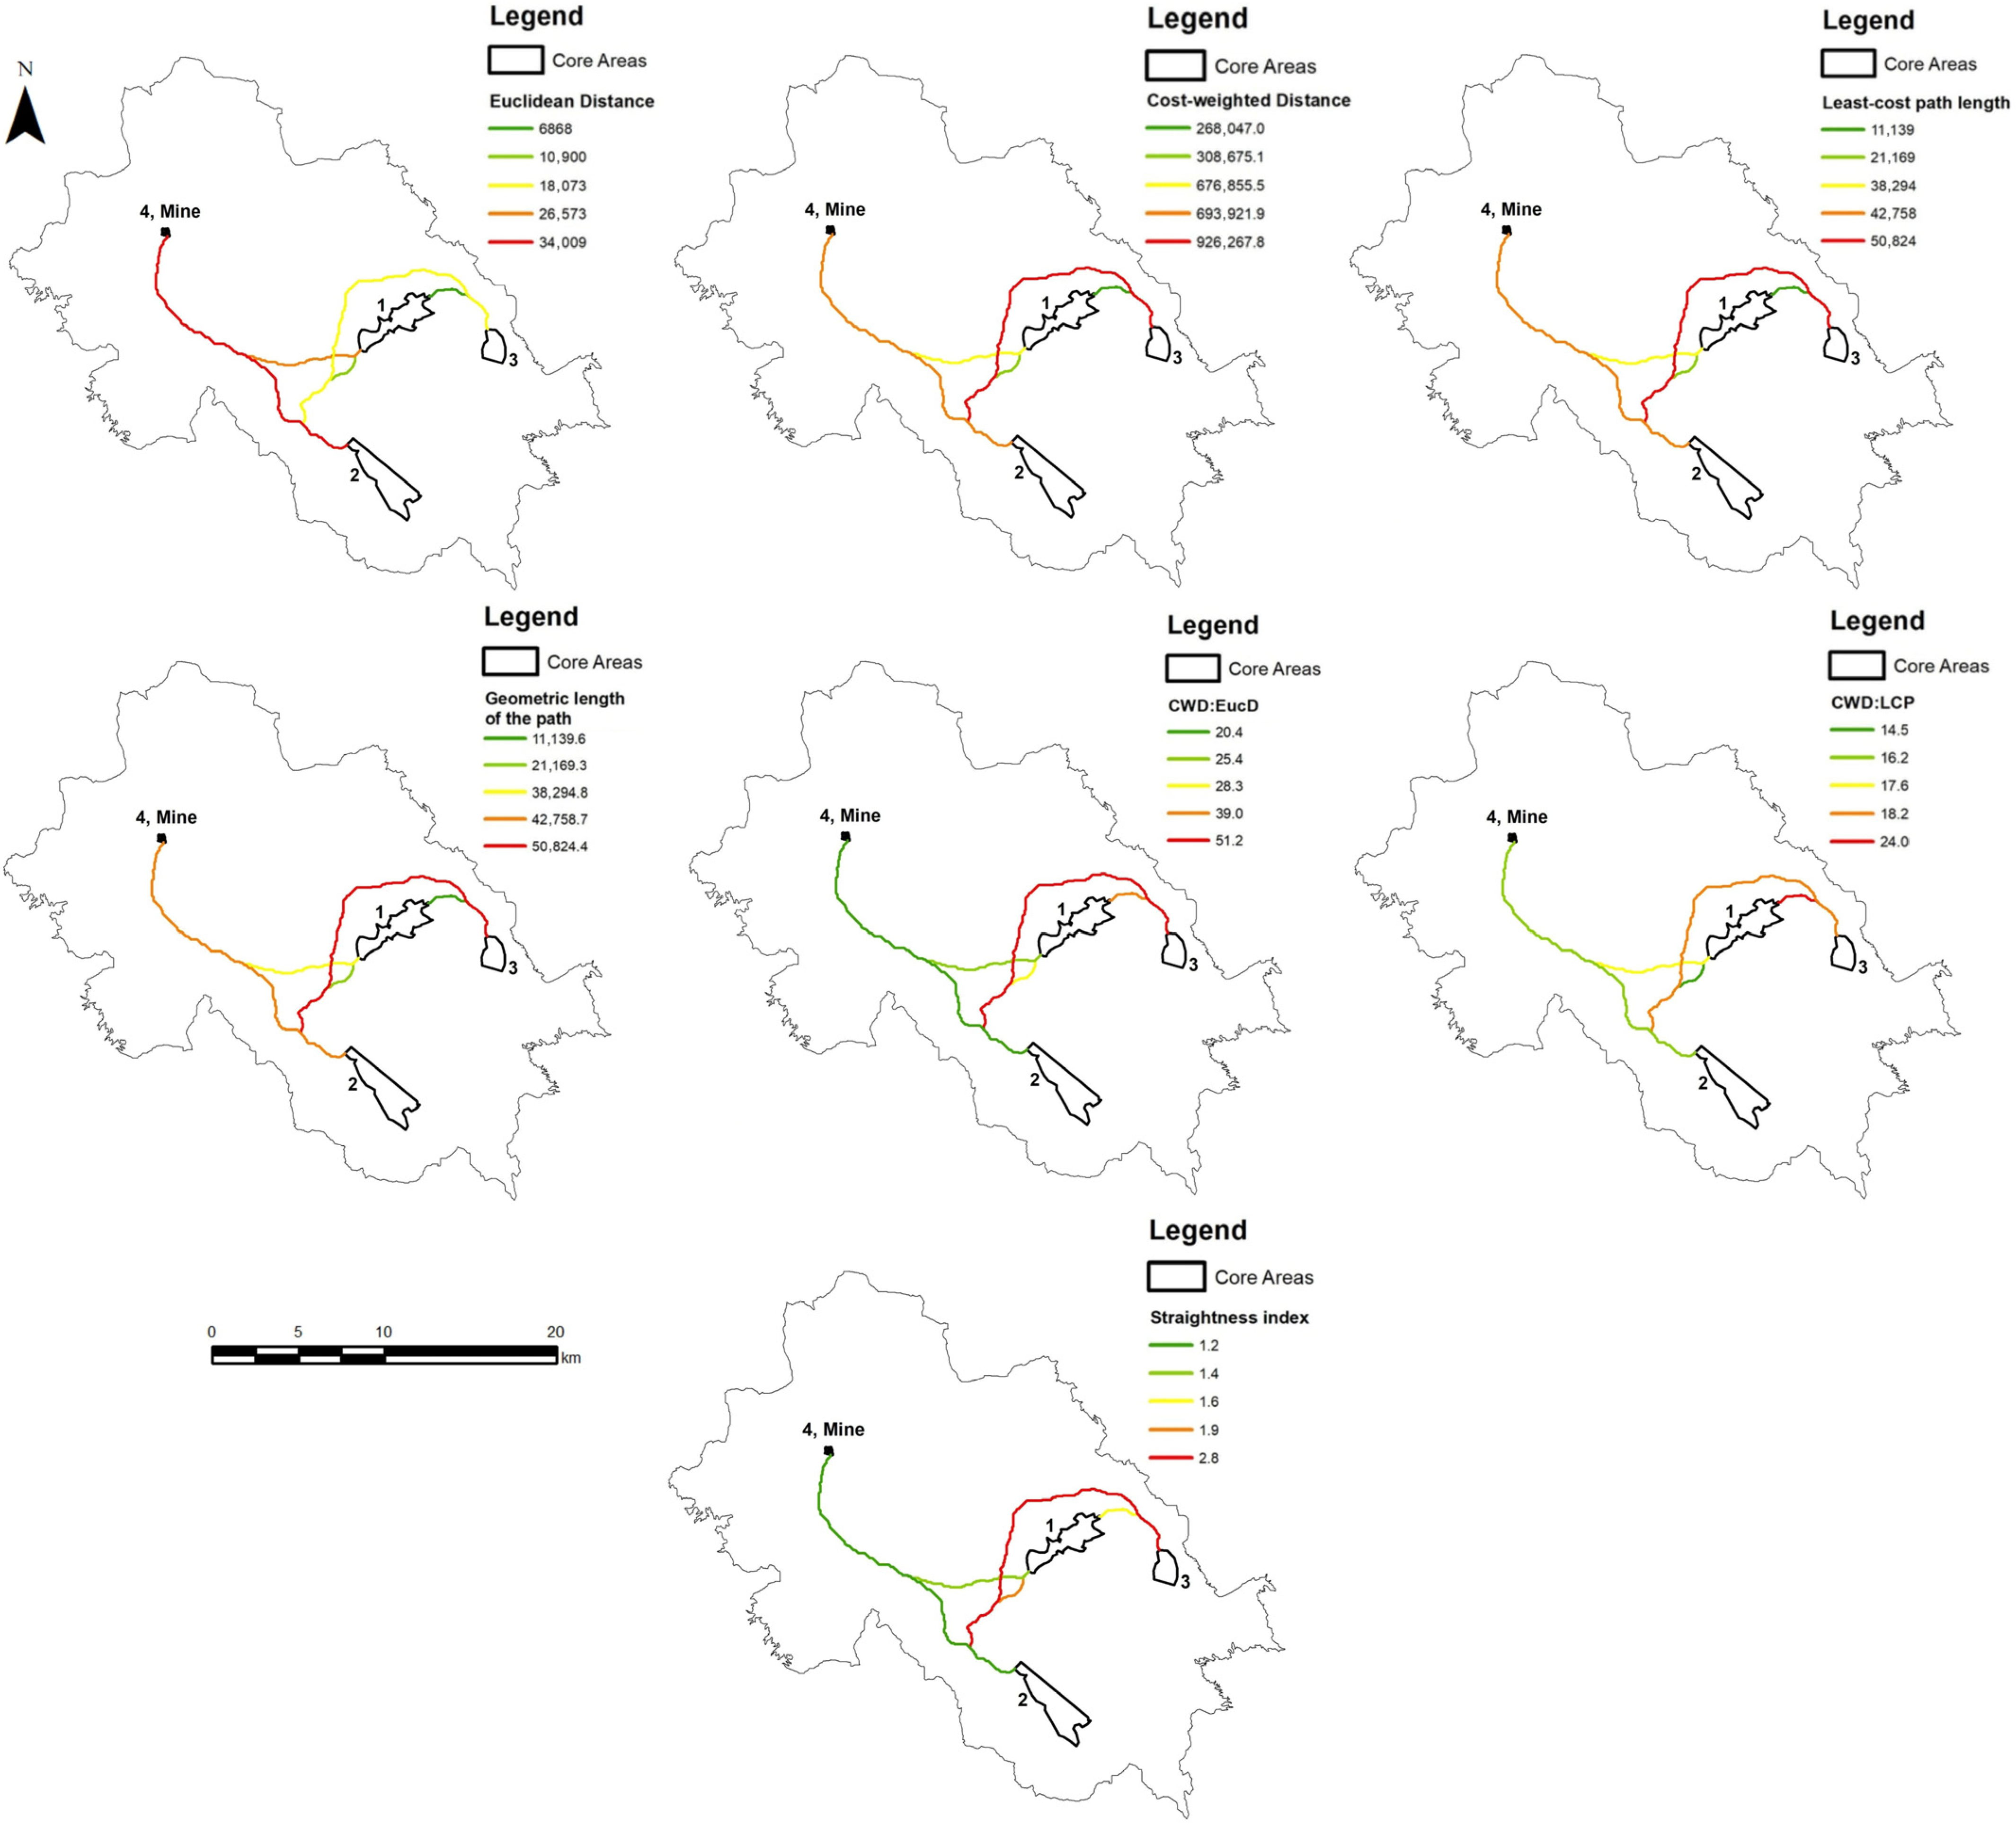

Disclaimer/Publisher’s Note: The statements, opinions and data contained in all publications are solely those of the individual author(s) and contributor(s) and not of MDPI and/or the editor(s). MDPI and/or the editor(s) disclaim responsibility for any injury to people or property resulting from any ideas, methods, instructions or products referred to in the content. |
© 2025 by the authors. Licensee MDPI, Basel, Switzerland. This article is an open access article distributed under the terms and conditions of the Creative Commons Attribution (CC BY) license.