Abstract
Rapid urbanization has intensified resource and population agglomeration while exacerbating urban-rural disparities. To address the long-standing dual structure, China advocates urban-rural integrated development (URID) to achieve common prosperity. However, the long-term evolutionary patterns and explanatory mechanisms of URID remain insufficiently explored, particularly at the county (district)-level in western China. This study constructed an entropy-weighted TOPSIS evaluation system combined with kernel density estimation and an optimal parameters-based geographical detector (OPGD) model to analyze the spatiotemporal evolution and explanatory mechanisms of URID in 26 counties (districts) of the Xi’an metropolitan area from 2010 to 2022. The results showed that: (1) URID levels increased steadily over the study period, forming a pronounced core-periphery gradient with faster improvement in national URID pilot counties. (2) Factor associations evolved from being dominated by a few dimensions to multidimensional coupling. Socioeconomic and geographical factors remained dominant and relatively stable, demographic influences were clearly stage specific, and the interaction between forest coverage and economic variables weakened over time. (3) Enhancing regional transport accessibility, optimizing land use efficiency, and fostering positive population-industry interaction are key pathways for promoting URID in the study area. Methodologically, this study introduces a “significance testing followed by threshold verification” logic into the OPGD model, refining the parameter-setting process and improving the robustness and q-value of factor detection. The findings enrich URID theory, provide county (district)-scale evidence for western China, and offer policy implications for optimizing factor allocation and promoting coordinated regional development.
1. Introduction
By 2010, the global urbanization rate had exceeded 50% [1]. According to World Bank Open Data, this figure reached 58% by 2024, confirming cities as the primary habitat for humanity. While rapid urbanization has propelled regional economic growth, it has also intensified regional disparities and contributed to the spatial concentration of poverty and inequality [2]. These disparities largely stem from the excessive agglomeration of resources and factors of production and from spatial differentiation during the urbanization process, which together widen the urban-rural divide [3]. Consequently, the United Nations identifies “Reduce inequality within countries” (Sustainable Development Goal 10) as a key objective for sustainable development [4]. As the largest developing country, China increased its urbanization rate from 10.6% (1949) to 67% (2024) over roughly seven decades, thereby offering valuable experience for the Global South. However, amid rapid urbanization, the intrinsic linkages between urban and rural areas as an integrated whole have, to some extent, been overlooked [5], leading to regional imbalances and insufficient rural development [6]. Thus, narrowing the urban-rural divide and achieving high-quality regional development have become central challenges in China’s ongoing economic and social transformation [7,8]. In response, the Report to the 19th National Congress of the Communist Party of China called for “establishing and improving the institutional mechanisms for urban-rural integrated development (URID),” formally elevating URID to a national strategic objective.
The relationship between urban and rural areas is a foundational axis of a nation’s socioeconomic system [9]. For decades, China’s urban-rural development has exhibited a segmented pattern, characterized by an imbalanced industrial and agricultural relationship, restricted factor mobility, and pronounced disparities in infrastructure and public services [10]. As a result, the urban-rural dual structure has not been fundamentally transformed, and URID has been proposed to overcome this segmentation and reshape urban-rural relations [11,12]. Accordingly, URID is conceptualized as a process that respects the distinct functional characteristics and the division of labor between urban and rural areas [13]. It aims to achieve comprehensive and coordinated integration, encompassing key economic, social, demographic, and spatial dimensions [14,15]. In this way, it seeks to establish a new relationship in which industry and agriculture are mutually reinforcing, urban and rural functions are complementary, and coordinated development and common prosperity advance in tandem [16]. Essentially, URID marks a transition from segregation to integration [17], emphasizing equal status, rational flows of factors of production, and shared prosperity [10,13]. This shift improves the efficiency of resource utilization, elevates living standards, and helps narrow regional disparities [12,18]. Consequently, URID is regarded as the primary pathway to rural revitalization [19] and a key driver of high-quality development under new-type urbanization in China [5].
A scientific assessment of URID is a fundamental prerequisite for identifying how urban-rural relations evolve and for informing planning and policy decisions [20]. Existing studies have proposed several assessment pathways. From the perspective of components, population, land, and industry are widely recognized as the core variables that characterize URID [21], and evaluation frameworks have been developed at both urban agglomeration and county (district) scales on this basis [18,22]. From the perspective of developmental stages, Luo et al. (2023) constructed the “foundation-motivation-result” process framework of URID and an associated indicator system by aligning URID stages with policy evolution [15]. From the perspective of system coupling, scholars have built indicator systems for rural revitalization and new-type urbanization, thereby conducting coupling coordination analyses that reflect the level of URID [23]. From the perspective of subsystem interactions, several studies have developed evaluation frameworks around interactions among economic, social, ecological, and spatial subsystems [24,25]. Overall, URID assessment should follow its internal logic: narrowing the urban-rural divide, upgrading public services, improving the ecological environment, and achieving efficient allocation of factors of production are key manifestations of multidimensional integration [20]. However, URID exhibits pronounced temporal dynamics, and reliance on cross-sectional data alone cannot reveal its changes across stages or the mechanisms that underlie them [15,20]. Meanwhile, substantial differences in resource endowments, policy environments, and development bases across regions lead to spatial heterogeneity in both the level and the underlying factors of URID [26,27]. Therefore, regionally adaptive, multidimensional evaluation frameworks combined with time-series analyses are needed to accurately identify the factors that constrain coordinated regional development [28].
URID exhibits distinct characteristics and priorities across different spatial scales. At the provincial scale, research focuses on the relationship between policy evolution and macro-level development patterns [7,15]. At the urban agglomeration scale, the focus shifts to spatial polarization, core-periphery structures, and interaction mechanisms [14]. At the county (district) scale, research focuses on their role as fundamental administrative units in channeling factor flows between urban and rural areas and coordinating integrated development [21]. Since 2017, China has successively issued policy directives such as “taking counties as an important entry point for promoting URID” and “accelerating URID within counties”. Furthermore, the Key Tasks for New-Type Urbanization and URID in 2021, issued by the National Development and Reform Commission, explicitly stated that “URID should be advanced with counties as the fundamental unit” [29]. Hence, counties (districts) are not only key carriers of urban-rural factor mobility but also the principal locus of URID policies. However, existing research still focuses mainly on provincial and municipal scales, and county (district)-level URID measurement and monitoring frameworks remain underdeveloped [11]. Conducting URID research at the county (district)-level can therefore provide more precise guidance for practice.
The Xi’an metropolitan area, one of China’s national-level metropolitan regions, is among the strongest economic bases in western China and has one of the greatest capacities to accommodate population. In 2020, its gross domestic product (GDP) reached CNY 1.3 trillion (USD 188.3 billion at the contemporaneous exchange rate), accounting for nearly half of Shaanxi province’s total. The urbanization rate of its permanent residents exceeded 72% in 2020 [30]. As such, it serves as a pivotal driver of regional development in northwest China. Nevertheless, complex topography and marked urban-rural disparities expose the area to the dual challenges of insufficient overall competitiveness and unbalanced, inadequate development [31]. To combat these challenges, in 2019, eight administrative units, including Gaoling district and Yanliang district, were designated as a national URID pilot zone. Subsequently, the Xi’an Metropolitan Area Development Plan (2022) identified URID as a key strategic objective, emphasizing the free flow of factors and the rational allocation of public resources. Thus, investigating the level of URID within the Xi’an metropolitan area not only helps evaluate the effectiveness of policy implementation but also provides insights for promoting coordinated metropolitan development in less developed parts of western China.
In summary, research on URID still faces two overarching limitations: insufficient attention to temporal dynamics and underdeveloped county (district)-level evaluation frameworks. As a result, the evolutionary trajectories and the mechanisms influencing and constraining county (district)-scale URID remain insufficiently understood, particularly in the less developed regions of western China. To bridge these gaps, this study uses the 26 counties (districts) of the Xi’an metropolitan area as the units of analysis and examines the evolution of URID and its explanatory factors from 2010 to 2022. The main innovations of this study are a county (district)-level URID evaluation framework based on continuous time-series data and a refined OPGD model. This study focuses on the following three questions: (1) How has the spatiotemporal pattern of URID evolved across counties (districts) in the Xi’an metropolitan area from 2010 to 2022? (2) What are the dominant explanatory factors and their interactions at different stages? (3) What policy pathways can effectively unlock URID potential within different zones in the Xi’an metropolitan area?
2. Materials and Methods
2.1. Study Area
The Xi’an metropolitan area is located near the geometric center of China’s land area (33°42′–34°45′ N, 107°40′–109°49′ E). It is a key node of the Belt and Road Initiative and a core hub on the Eurasian Land Bridge, and it plays an important role in the economic, technological, and cultural development of northwest China. According to the Xi’an Metropolitan Area Development Plan, the region covers the entire administrative area of Xi’an city; Yaozhou district of Tongchuan city; Linwei district, Fuping county, and Huazhou district of Weinan city; Qindu district, Weicheng district, Xingping city, Qianxian county, Wugong county, Sanyuan county, Jingyang county, and Liquan county of Xianyang city; and the Yangling agricultural high-tech industrial demonstration zone (Figure 1). In total, it comprises 26 counties (districts) covering approximately 2.06 × 10⁴ km2, roughly 10% of Shaanxi province [32]. The area includes both the province’s core functional zone for socioeconomic development and representative agricultural areas, making it an ideal sample for tracking URID.
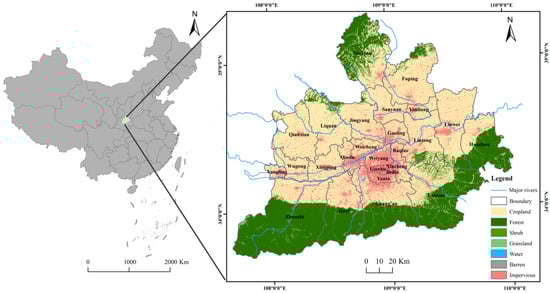
Figure 1.
Map of the study area.
From a geographical perspective, the Xi’an metropolitan area is characterized by higher terrain in the north and south and a lower central plain, with a mean elevation of approximately 400 m. The climate is warm-temperate and semi-humid, with a continental monsoon regime. Topographic controls shape land use: cropland, built-up areas, and forest predominate, producing a spatial pattern of mountain forests in the north and south and a central plain where cropland coexists with built-up areas [31]. From a socioeconomic perspective, the period from 2010 to 2022 was a critical phase of urban-rural transition. During this period, the permanent population increased from 14.66 million to 17.39 million, and per capita GDP rose from CNY 30,622 to CNY 72,794, with an average annual growth rate of 7.48%. Over the same period (2010 to 2022), the ratio of per capita disposable income between urban and rural residents fell from 2.93 to 2.33, slightly better than the national average of 2.34, indicating a marked narrowing of the income gap. Overall, the Xi’an metropolitan area features complex geography and pronounced environmental differences, and is in a pivotal transition from urban-rural differentiation toward deeper integration.
2.2. URID Evaluation Framework and Explanatory Factor System
2.2.1. Review of URID Theory
Conceptually, URID has evolved from early normative visions of urban-rural relations into a multiscale framework embedded in specific institutional and spatial contexts [33]. This subsection reviews this evolution, clarifies the connotation of URID at the county (district) scale, and summarizes the main evaluation frameworks.
The concept of urban-rural integration can be traced back to utopian socialist visions of urban-rural development, which offered a critical reflection on established urban-rural relations [5]. In the 19th century, Marx divided the evolution of the urban-rural relationship into three stages: opposition, separation, and integration [5]. Internationally, debates on urban-rural relations have oscillated between urban-led and rural-oriented approaches. Some perspectives emphasize relying on urban growth and modern industry to drive broader regional development, whereas others focus on correcting “urban bias” by strengthening rural development so that both can evolve in a more integrated way [20,34]. In China, with shifting policy priorities and contexts, URID has successively undergone phases of dual, harmonious, coordinated, and unified development, before entering the current stage of integrated development [5]. These policy shifts have promoted URID along multiple dimensions. Within this evolving process, urban and rural areas are core concepts for understanding URID. Urban areas are spatial domains dominated by non-agricultural activities and populations, whereas rural areas encompass all remaining territory outside urban areas [12]. In China’s administrative system, a city typically comprises several counties (districts), each of which contains both urban and rural areas within its jurisdiction. At a broader regional scale, a metropolitan area is a functionally integrated region formed by one or more core cities and their linked commuting zones [35]. Accordingly, URID within metropolitan areas can be analyzed at either the city or the county (district) scale.
Against this multiscale background, URID at the county (district)-level can be understood as a process in which the county (district) serves as a spatial platform for interaction between urban and rural areas. By leveraging its nodal and hub functions, the county (district) enables efficient flows of factors of production and optimizes territorial functions [12,21]. In this process, the county (district) performs core functions: removing barriers to factor mobility, balancing the allocation of public services, and narrowing development gaps [5]. It should be noted that URID does not aim to achieve absolute equilibrium between urban and rural areas; rather, it seeks to keep disparities within a reasonable range and to promote coordinated development through functional complementarity [36].
On this conceptual basis, diverse URID evaluation frameworks have been developed. Despite their differences, most follow a common technical route: constructing an indicator system, calculating composite scores, and applying quantitative analytical methods. Zhang et al. [14] focused on economic, social and ecological dimensions, and classified quantitative indicators into comprehensive, comparative and catch-up types. They argued that assessments of URID in metropolitan areas should pay attention not only to the overall level but also to internal disparities. Liu et al. [25] analyzed URID within urban agglomerations across five dimensions: population, economy, society, ecology and space. Their results highlight the driving role of multidimensional, integrated development in promoting URID. He et al. [37] evaluated URID in terms of urban-rural spatial connectivity, social integration and industrial convergence. They suggested that improving infrastructure and enhancing local public services can promote social equity and advance urban-rural social integration. Although diverse, these evaluation frameworks predominantly revolve around the composition of urban-rural subsystems [11]. On this basis, commonly used quantitative methods such as the entropy method [25], principal component analysis [38], and the TOPSIS (Technique for Order Preference by Similarity to Ideal Solution) method [39] are employed to calculate URID scores. For further analysis, methods such as kernel density estimation and the geographical detector model are used to examine the temporal evolution of URID and its associated factors [15].
Consistent with these frameworks, economic vitality, demographic dynamics, public service provision and land use patterns are widely regarded as key factors driving URID [5,40]. These factors condition how resources and opportunities are distributed between urban and rural areas and thus influence both the pace and quality of integration. Among them, economic integration functions as the endogenous driving force of URID and exerts the most immediate and pronounced effects [13]. Industrial restructuring, value-chain extension and growth spillovers to surrounding rural areas serve as its primary mechanisms. These processes create jobs, raise household incomes and expand consumption, thereby reshaping employment structures and enhancing investment capacity [21,29]. In turn, they provide the essential material basis for improvements in infrastructure, public services and ecological protection, while fostering coordinated agricultural-industrial development and strengthening urban-rural economic integration. As core spatial factors, land use patterns and land use efficiency directly shape the urban-rural spatial configuration and the efficiency of factor allocation [21,41]. However, overreliance on land urbanization at the expense of farmland’s ecological and productive functions may diminish agricultural capacity and amplify food security risks, thereby undermining regional resilience and sustainability [42,43]. Therefore, URID should seek an equilibrium between land urbanization and agricultural space conservation to achieve an optimal allocation of production, living, and ecological spaces [6]. From an environmental perspective, the ecosystem acts as a fundamental supporting factor for URID. It provides sustained resources and environmental services and constitutes the baseline for high-quality integrated development [6]. A healthy ecosystem not only enhances the living standards of urban and rural residents but also fosters the coordinated evolution of spatial functions by strengthening environmental carrying capacity and optimizing the ecological spatial structure.
In summary, although existing URID evaluation frameworks are diverse, quantitative assessments remain relatively fragmented and many still lack a systematic logic framework [11,38]. Many studies construct static indicator systems that treat urban and rural areas as two separate subsystems and evaluate only their coupling-coordination. In addition, most empirical analyses remain at the city or provincial scale, with limited attention to the continuous spatiotemporal evolution of URID at the county (district)-level. Given these limitations, the county (district)-level constitutes a crucial scale for advancing URID research. Evaluation and development perspectives need to move beyond the one-sided views of either “using the city to promote the countryside” or “using the countryside to support the city” [44]. Instead, URID should be understood as a process in which different subsystems coordinate and production factors circulate efficiently across space. From this viewpoint, urban and rural areas form an interdependent system, linked through the flows of population, industry, land and ecological functions [11]. This integrated perspective provides the theoretical foundation for the county (district)-level URID evaluation framework and explanatory factor system constructed in this study.
2.2.2. Design of the URID Evaluation Framework
Following the principles of data representativeness, objectivity and availability, and considering both the connotation of URID and the practical characteristics of the Xi’an metropolitan area, this study selects 13 indicators across three core dimensions: economic, social and ecological (Figure 2). Due to constraints in data availability at the county (district)-level, dimensions such as infrastructure, spatial structure and governance are not established as independent criterion layers but are incorporated indirectly within the selected indicators and examined as explanatory factors in the subsequent analysis. These dimensions respectively capture economic vitality and structural optimization, public service provision and social carrying capacity, and ecological quality and environmental coordination, thereby constituting a tailored evaluation framework for URID in the study area (Table 1). It should be noted that, according to previous studies [45], when the regional urbanization rate reaches 100%, traditional rural functions tend to disappear, and several urban-rural indicators lose statistical significance. Therefore, such regions are designated as “no-data zones” in this study to ensure analytical rigor and scientific validity.
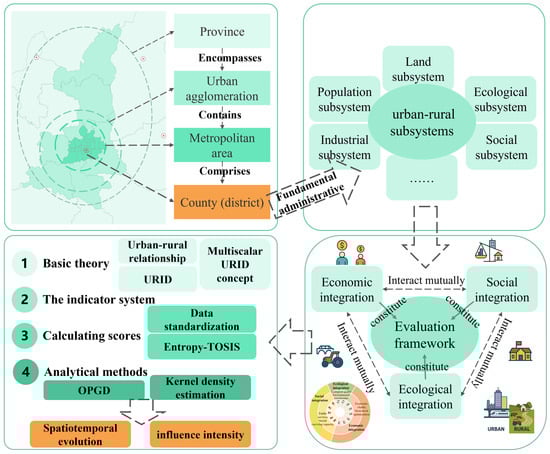
Figure 2.
Theoretical framework of urban-rural integrated development (URID).

Table 1.
Evaluation indicator system for URID.
The economic integration dimension (A1–A6) evaluates the strength and balance of urban-rural economic linkages. Specifically, per capita retail sales of consumer goods of urban and rural residents (A1) reflects regional consumption potential and the level of commodity circulation; the ratio of per capita disposable income between urban and rural residents (A2) measures income disparity and economic equity; per capita GDP of urban and rural residents (A3) indicates the equalization of regional economic development; the proportion of non-agricultural industrial output value (A4) signifies the degree of industrial upgrading; the ratio of primary industry added value to cultivated land area (A5) assesses cultivated land use efficiency and agricultural output; and the number of industrial enterprises above designated size (A6) represents regional economic vitality and industrial agglomeration capacity. The social integration dimension (B1–B5) assesses the equilibrium of public resource allocation and the coordination of social functions between urban and rural areas. Population density (B1) indicates demographic concentration and spatial carrying capacity. The ratio of primary and secondary school students to permanent population (B2) reveals educational potential and demographic structure. The number of hospital beds per 10,000 urban and rural residents (B3) quantifies the accessibility of medical services. Lastly, the primary-school teacher-student ratio of urban and rural residents (B4) and the middle-school teacher-student ratio of urban and rural residents (B5) reflect the balanced allocation of educational resources across different age cohorts. The ecological integration dimension (C1–C2) captures the ecological sustainability of URID. Net primary productivity (NPP) (C1) characterizes ecosystem productivity and vegetation cover, providing a precise measure of the regional ecological baseline. Meanwhile, average PM2.5 concentration (C2) indicates air quality and environmental health, serving as a key gauge of coordinated ecological governance.
2.2.3. Explanatory Factors Selection and Data Processing
URID results from the interplay of regional resource endowments, socioeconomic conditions, and geographical factors. These factors collectively shape the spatial pattern of URID by influencing the efficiency of resource allocation, the degree of factor mobility, and the strength of spatial linkages. Accordingly, considering the developmental context of the Xi’an metropolitan area, this study selects nine explanatory factors across three dimensions: ecological environment, socioeconomic factors, and geographical factors. These factors are used to systematically identify the variables associated with spatial heterogeneity in URID (Table 2).
Table 2.
Selection of explanatory factors for URID in the Xi’an metropolitan area.
In the ecological environment dimension, the provisioning and regulating services of regional ecosystems constitute the foundational support for URID. The output of grain crops directly reflects the provisioning services of the ecosystem and serves as a key indicator of agricultural productivity and the sustainability of rural livelihoods [37]. The forest coverage rate represents the stability and sustainability of the regional ecological environment, indicating the level of its regulating services [48]. Therefore, this study employs the output of grain crops and the forest coverage rate to characterize the provisioning and regulating functions of regional ecosystems, respectively.
In the socioeconomic dimension, regional economic strength and social vitality jointly determine the level of urban-rural factor mobility and integration. Compared with per capita GDP, gross regional product (GRP) reflects the overall scale of the regional economic base. A stronger economic capacity facilitates infrastructure construction and urban functional expansion, thereby promoting factor flows and the accumulation of social capital, which in turn enhances URID [15,22]. Per capita fiscal budget revenue indicates the capacity of local governments to provide public services and redistribute resources, reflecting the ability to share developmental benefits. The proportion of built-up area captures the spatial expansion of cities and the transformation of the urban-rural spatial structure [11], while the rate of net migration reveals regional attractiveness and the direction of population-factor flows [49].
In the geographical dimension, geographical conditions not only directly constrain the development and utilization of land resources and the spatial distribution of human settlements but also play an important role in shaping regional connectivity and spatial interactions [26]. Topographic factors influence land development costs, determine the difficulty of infrastructure construction, and affect the suitability of agricultural development [15]. Commute time to the core area reflects spatial accessibility and indicates the strength of spatial linkages between peripheral areas and core functional zones, directly affecting the efficiency of factor flows [31]. Therefore, this study selects the digital elevation model (DEM), slope, and commute time to the core area as key spatial variables representing the topographic and locational conditions associated with URID.
2.3. Methods
2.3.1. Entropy-Weighted TOPSIS Method
As shown in Figure 2, the research design follows four basic steps. First, a URID theoretical framework is established to clarify the core concepts and dimensions. Second, a county-level indicator system consistent with this framework is constructed. Third, the entropy-weighted TOPSIS method is used to calculate composite URID scores for each county (district) and year. Fourth, kernel density estimation and the OPGD model are applied to, respectively, depict the spatiotemporal evolution of URID and identify key explanatory factors and their interaction patterns. These steps provide a coherent approach to relating overall URID levels to their spatiotemporal gradients and underlying explanatory patterns.
Since the URID scores depend directly on the indicator weights, the choice of weighting scheme has a key influence on the reliability of the evaluation results. The entropy-weighted TOPSIS method is an enhanced version of the traditional TOPSIS approach and helps overcome the limitations of conventional TOPSIS in constructing the weight matrix [50]. Its computational procedure consists of four main steps: data standardization, entropy-based weighting, construction of a weighted normalized matrix, and application of the TOPSIS principle to determine the relative superiority of each evaluation object by measuring its distances from the ideal solutions [51].
Consider an original data matrix with objects and indicators:
Data standardization is performed using the range method.
Positive indicators:
Negative indicators:
where denotes the standardized value, represents the raw value of indicator for object , and indicate the maximum and minimum values of indicator across all evaluation objects, respectively.
Based on the standardized data, the proportion of indicator for object :
The information entropy of each indicator:
where is a constant, . The entropy weight :
Based on the calculated weights, the weighted normalized matrix :
The positive ideal solution (PIS) and the negative ideal solution (NIS):
The Euclidean distances from each object to the PIS and NIS:
The relative closeness :
2.3.2. Kernel Density Estimation
Kernel density estimation is a non-parametric method that fits the probability density function directly from the observed data, making it suitable for analyzing the temporal evolution characteristics of variables. The formula is as follows:
where K is the kernel function, is the total number of sample observations, denotes the observed value, represents the mean, and is the bandwidth. The bandwidth is selected by integrating multiple criteria to capture the primary variation patterns in the data while preventing over-smoothing.
2.3.3. Optimal Parameters-Based Geographical Detector (OPGD) Model
The geographical detector (GD) is a statistical method used to quantify the q-value of candidate explanatory factors for a target spatial pattern and to assess the interaction effects between pairs of variables [52]. A fundamental requirement of the GD framework is the discretization of input variables, wherein both the discretization method and the break number significantly influence the results. The OPGD model identifies, from a predefined set of parameter combinations, the one that yields the highest q-value, thereby enhancing the accuracy of spatially stratified heterogeneity analysis [53]. However, the performance of the OPGD model is highly dependent on the parameter settings, particularly the discretization method and the break number. Variations in these parameters can cause notable fluctuations in the resulting q-value and in statistical significance. When a dataset contains few unique values, using an excessively large break number may artificially inflate the q-value and distort significance tests. Therefore, it is essential to consider the potential variations in q-value and significance levels resulting from an increase in the break number. This study applies five discretization methods to the explanatory factors: equal interval, natural breaks, quantile, geometric interval, and standard deviation. Considering the sample size and data distribution characteristics, the break number was set within a range of 3 to 13 for the years 2010 to 2022, and between 3 and 7 for the remaining years. The q-value is calculated as follows:
where denotes the explanatory power of the factor, h indexes the stratum, is the total number of strata, is the sample size of a sub-region; is the sample size of the entire study area; is the variance within a sub-region; is the variance over the whole study area.
2.4. Data Sources and Preprocessing
This study integrated remote sensing and statistical data to systematically assess the level of URID in the study area. The remote sensing data comprised various land use types, including built-up areas, cultivated land, and forest cover, which were obtained from the Annual Land Cover Dataset of China produced by Wuhan University [54]. NPP data were acquired from the MOD17A3HGF dataset, accessible via NASA’s public data platform “https://www.earthdata.nasa.gov (accessed on 16 August 2025)”. DEM data were sourced from the Geospatial Data Cloud “https://www.gscloud.cn/ (accessed on 11 August 2025)”, and slope data were derived from the DEM. Road network data came from OpenStreetMap “https://www.openstreetmap.org (accessed on 2 September 2025)”. For statistical data, socioeconomic statistics for counties (districts) were primarily drawn from the China County Statistical Yearbook, and supplemented by the Shaanxi Statistical Yearbook, Xi’an Statistical Yearbook, Tongchuan Statistical Yearbook, Weinan Statistical Yearbook, and Xianyang Statistical Yearbook, as well as by the Statistical Bulletins on National Economic and Social Development issued by respective county (district) governments. Missing values in statistical records were first addressed by consulting local statistics and education departments. Remaining gaps, including those in both statistical and remote sensing data, were filled using interpolation to ensure temporal and spatial continuity.
To mitigate potential redundancy and instability in the indicator system, all indicators included in the URID evaluation framework were tested for multicollinearity. Only indicators with a variance inflation factor (VIF) < 10 were retained for subsequent analysis. The research framework is illustrated in Figure 3.
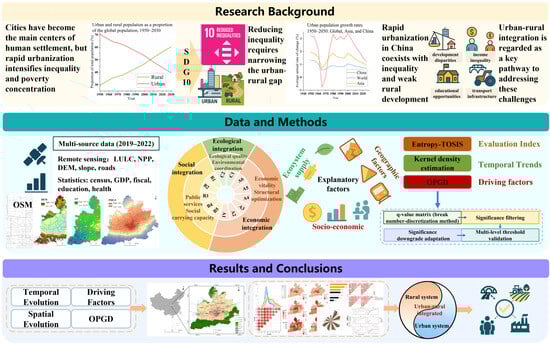
Figure 3.
Research framework.
3. Results
3.1. Temporal Evolution of URID in the Xi’an Metropolitan Area
The temporal evolution of URID in the Xi’an metropolitan area from 2010 to 2022 can be visualized using kernel density curves. Figure 4 shows rightward peak shifts, lower peak heights, and broader distributions, indicating a transition from a unimodal to a multimodal form. These features demonstrate a steady rise in the overall URID level, coupled with a persistent increase in regional disparities. From 2010 to 2013, URID remained at a low-level equilibrium. The main peak of the kernel density curve was high and concentrated, and most counties (districts) recorded URID levels around 0.2, reflecting a relatively balanced initial state of regional development. From 2014 to 2020, URID entered a phase of accelerated differentiation. The main peak flattened, its height declined, its width increased, and the right tail became more pronounced. This pattern indicated rising dispersion across counties (districts) and reflected widening interregional disparities. The change was associated with stronger factor agglomeration in core cities. Population, capital, and industries increasingly concentrated in central urban areas, lifting URID levels in core districts. By contrast, peripheral counties (districts), constrained by limited inputs and factor supply, experienced slower growth. From 2021 to 2022, URID exhibited a multimodal differentiation pattern. The kernel density curve developed a distinct bimodal structure and became flatter overall, indicating a pronounced gradient across counties (districts). This evolution signaled that the pattern of URID was gradually shifting from one of “overall synchronous improvement” to a differentiated model characterized by “core leadership and peripheral catch-up.”
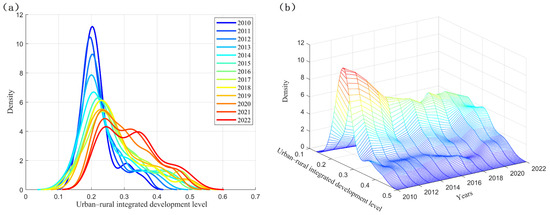
Figure 4.
Kernel density curves of URID in the Xi’an metropolitan area from 2010 to 2022: (a) two-dimensional kernel density curve; (b) three-dimensional kernel density curve.
Specifically, the average URID level in the Xi’an metropolitan area rose from 0.218 (2010) to 0.323 (2022) (Table 3), marking a cumulative increase of 48.2% and reflecting a notable overall improvement in URID. Nevertheless, the absolute interregional gap remained substantial, with the difference between the maximum and minimum values consistently ranging from 0.2 to 0.3 throughout the period. The highest URID levels were persistently observed in core urban districts such as Yanta district, Qindu district, and Weiyang district. Benefiting from well-developed infrastructure, diversified industrial structures, and dense public service networks, these districts functioned as growth poles for URID within the metropolitan area. In contrast, the lowest values were predominantly found in peripheral agricultural counties (districts) such as Fuping county and Jingyang county, where natural constraints and a weak industrial base slowed the pace of integration. It is worth noting that in 2017, Jingyang county experienced an abrupt decline in its URID level compared with 2016. This drop was largely related to a reduction in its administrative jurisdiction following the territorial readjustment of the Xixian New Area, which led to a sharp decrease in several key statistical indicators. In addition, dispersion in county-level URID increased over time. Table 3 shows that the standard deviation rose from 0.048 (2010) to 0.085 (2022), with a temporary dip in 2020 likely related to the disruptive effects of the COVID-19 pandemic. Similarly, the coefficient of variation increased from 0.22 (2010) to 0.264 (2022), indicating that relative developmental disparities among counties (districts) widened over the study period. This pattern is consistent with the polarization and differentiation revealed by the kernel density analysis.
Table 3.
Statistical characteristics of URID levels in the Xi’an metropolitan area from 2010 to 2022.
3.2. Spatial Evolution of URID in the Xi’an Metropolitan Area
Based on the temporal evolution characteristics of URID and the Jenks natural breaks method, county-level URID values were classified into four levels. To ensure comparability across years, the breakpoints were derived from the aggregated distribution of URID values for all counties and years and then applied uniformly to each year. Specifically, URID values of 0.001–0.215, 0.216–0.287, 0.288–0.377, and 0.378–0.498 correspond to low, relatively low, moderate, and relatively high levels, respectively.
The spatial distribution of URID exhibited a staged core-periphery structure, characterized by a gradual decline in URID levels radiating outward from the metropolitan core (Figure 5). In 2010, the spatial pattern showed full coverage at a low level across the Xi’an metropolitan area (Figure 5a). Apart from Lianhu district, Xincheng district, and Beilin district, which had reached 100% urbanization, only three districts had attained the moderate level, while all other districts remained at the initial stage of URID. By 2013, the overall configuration had not changed markedly, but the radiating effect of the core had become discernible (Figure 5b). Yanta district, benefiting from the industrial clustering of the Xi’an high-tech industrial development zone, advanced to the relatively high level, forming a spatial pattern of point breakthrough amid overall lag. In 2016, the region entered a core expansion stage (Figure 5c). The overall URID level improved significantly, and a north–south rapid development belt emerged. Qindu district and Weiyang district rose to the relatively high level, together shaping a dual-core high-value zone with Xi’an city as the primary core and Xianyang city as the secondary core. By 2019, the spatial structure of URID had become further optimized (Figure 5d). Only five peripheral areas remained at the low level; among them were Fuping county, Huazhou district, and Qianxian county.
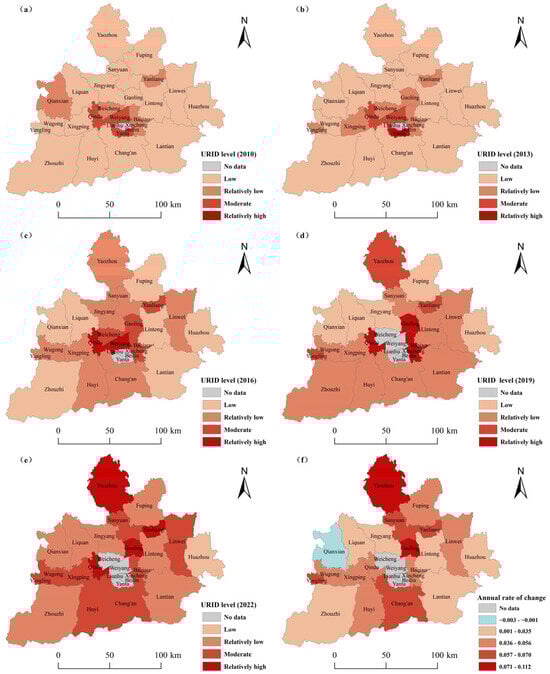
Figure 5.
Spatiotemporal evolution of the URID level in the Xi’an metropolitan area from 2010 to 2022: (a) URID level in 2010; (b) URID level in 2013; (c) URID level in 2016; (d) URID level in 2019; (e) URID level in 2022; (f) average annual change rate of URID.
In 2022, the Xi’an metropolitan area exhibited a pattern of localized optimization and overall improvement in URID (Figure 5e). Counties (districts) at the relatively low level or above accounted for 96.2% of the total, and Huazhou district was the only area that remained at the low level. URID levels in the national pilot zones for URID continued to outperform those in non-pilot zones, highlighting the positive role of policy support in narrowing regional disparities and fostering balanced development. The URID level in Baqiao district began a two-year decline after reaching a peak of 0.403 in 2019. This decline coincided with the impact of the COVID-19 pandemic, which severely undercut the district’s manufacturing and cultural tourism sectors, such as the Bailuyuan Scenic Area. As a result, local economic vitality was weakened and employment opportunities diminished, thereby curtailing the flow and interaction of urban-rural factors. The persistently low level in Huazhou district can be linked to combined constraints of natural conditions, population dynamics, and economic capacity [55]. First, despite its extensive administrative area (1139 km2), the district featured highly undulating terrain, with elevations ranging from 334 m to 2646 m, which severely limited suitable land for construction. This topographic complexity led to high infrastructure costs and significant engineering challenges. Second, statistical data revealed a continuous decline in the resident population during the study period. From 2010 to 2022, Huazhou district experienced a net population outflow of approximately 60,000 people, reducing its total population to 264,100. This demographic shrinkage, coupled with weak local consumption, considerably undermined the district’s economic vitality. Third, the conversion of ecological assets into economic benefits remained inefficient in Huazhou district. The area had yet to establish a virtuous cycle whereby ecological advantages translated into sustainable economic returns that, in turn, promoted further URID. This absence of positive feedback made Huazhou district a bottleneck in the metropolitan area’s overall URID.
In terms of the average annual change rate (Figure 5f), most counties (districts) in the Xi’an metropolitan area experienced a generally positive trend in URID from 2010 to 2022. However, interregional differences remained pronounced and were closely associated with location and industrial characteristics. Yaozhou district (11.2%) and Yanliang district (9.5%) recorded the highest annual growth rates, indicating an accelerated integration trend. Yaozhou district benefited from dual locational advantages: it served as both the core development zone of Tongchuan city and a pivotal hub along the metropolitan north–south development axis [30]. These advantages resulted in a concentration of economic and demographic activities within Tongchuan city, which contributed nearly half of the city’s total GDP in 2022. Additionally, its position as a strategic conduit linking the northern part of the metropolitan area with the core urban zone facilitated more efficient flows of urban-rural factors and enhanced spatial connectivity during the study period. Yanliang district, by contrast, leveraged its aviation industry to foster a distinctive industrial cluster, which stimulated local employment and attracted population inflow, thereby accelerating URID. In contrast, Qianxian county was the only unit that experienced negative growth in URID (−0.3%). As a typical traditional agricultural county on the periphery of the metropolitan area, Qianxian county’s primary industry consistently accounted for more than 20% of its total output value from 2010 to 2022. The sluggish development of non-agricultural sectors led to limited employment opportunities and a widening urban-rural income gap. Consequently, an outdated industrial structure and restricted factor mobility became key constraints on URID. These findings indicate that URID across the Xi’an metropolitan area is shaped by a combination of economic and spatial factors. To advance high-quality development, it is therefore necessary to identify key explanatory factors and clarify the mechanisms through which they are associated with URID.
3.3. Explanatory Factors and Their Interaction Effects on URID in the Xi’an Metropolitan Area
3.3.1. Explanatory Factors and Interaction Effects from 2010 to 2022
Based on the nine selected explanatory factors, the OPGD model was applied to identify the principal factors associated with URID in the Xi’an metropolitan area. As shown in Figure 6, the socioeconomic factors constituted the core explanatory dimension. Except for the rate of net migration (X6), all variables recorded q-value above 0.5, indicating strong explanatory power. The proportion of built-up area (X3) had the highest q-value (0.760), underscoring its dominant association with URID. This pattern highlights the pivotal role of land-use efficiency. An increase in the proportion of built-up area signifies more developed infrastructure and expanded space for industrial activity. It facilitates urban population agglomeration by providing housing and employment, and promotes bidirectional factor flows between urban and rural areas through the extension of transport networks, thereby improving the efficiency of resource allocation [28]. The GRP (X4) ranked second by q-value (0.664). As a direct indicator of regional economic vitality and development potential, a higher GRP reflects a more diversified industrial system and greater employment availability. It is consistent with a pattern of narrowing the urban-rural gap through the pathway of “industrial upgrading-income growth-consumption expansion” [15]. Geographical and locational factors also exerted a fundamental conditioning effect on URID. Both slope (X8) (0.542) and DEM (X7) (0.485) demonstrated relatively high q-value. The Xi’an metropolitan area features higher terrain in the north and south and a lower central plain. Flatter counties (districts) on the central plain can extend transport networks and expand built-up areas more readily, which in turn strengthens spatial interaction and factor exchange between urban and rural areas. Within the ecological environment, the output of grain crops (X2) showed a relatively high q-value (0.532), whereas the forest coverage rate (X1) exhibited a more limited influence (0.177). This pattern is closely linked to the functional division of “core consumption and peripheral production” within the metropolitan area. The central-plain counties (districts), which function as the main grain-producing zone, not only supply agricultural products to the core urban areas but also raise farmer incomes through scaled operations, thereby indirectly strengthening urban-rural economic and social linkages [55]. In contrast, the forested northern and southern mountainous areas, where development is restricted by ecological conservation policies, possess relatively homogeneous industrial structures and contribute less significantly to URID.
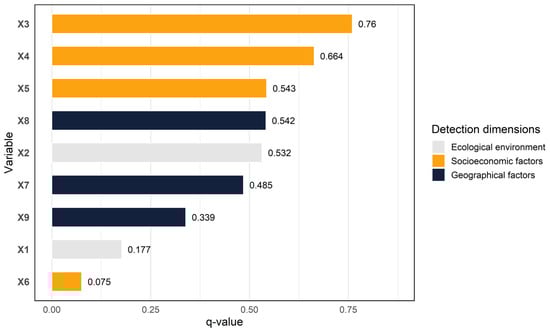
Figure 6.
Explanatory factors of URID in the Xi’an metropolitan area from 2010 to 2022.
Further analysis of the interaction effects among the explanatory factors on URID in the Xi’an metropolitan area revealed distinctive patterns. Figure 7 shows that the interaction types among the nine factors were predominantly characterized by significant bi-factor enhancement and significant nonlinear enhancement, with only a few factor pairs showing insignificant enhancement. Among all factors, the proportion of built-up area (X3) exhibited the most pronounced interaction effects. Most of its interactions fell into the category of significant bi-factor enhancement. Notably, its interaction with GRP (X4) achieved the highest q-value (0.857). This result is consistent with a synergistic relationship between land development and economic growth: economically stronger districts and counties can enhance land-use efficiency through higher capital investment, while rational land planning in turn provides essential spatial support for economic expansion, creating a virtuous cycle. It is noteworthy that population mobility is often considered a core element in urban-rural relationships [49]. Although the rate of net migration (X6) alone showed a relatively low q-value, its interaction effects with other factors were substantial. Specifically, its interactions with output of grain crops (X2), per capita fiscal budget revenue (X5), DEM (X7), and commute time to the core area (X9) all exhibited significant nonlinear enhancement. This pattern indicates that the influence of population mobility on URID is contingent upon support from other factors. In counties (districts) with a solid economic base and well-developed public services, population inflow often accompanies industrial optimization and the concentration of public resources, promoting spatial reconfiguration of production, consumption, and residence across urban and rural areas. In traditional agricultural counties, however, sluggish industrial development and insufficient employment opportunities mean the local labor force often exceeds absorption capacity. Consequently, the demographic dividend fails to translate into a developmental advantage, hindering the equalization of public services and ultimately restraining deeper URID. Furthermore, geographical factors demonstrated significant enhancement in interaction effects with most other variables, showing particularly high q-value when interacting with socioeconomic factors. Mechanistically, surface relief shapes the urban-rural spatial structure not only by influencing land availability, infrastructure costs, and public service accessibility but also by indirectly affecting agricultural productivity and settlement distribution. Thus, topography constrains or promotes URID across multiple dimensions [26,56].
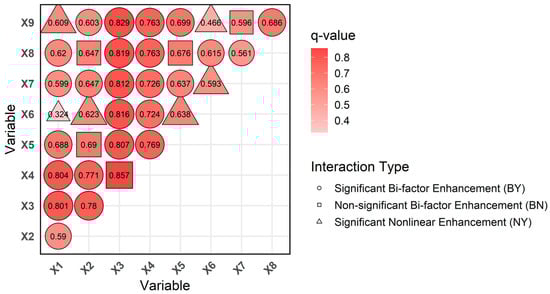
Figure 7.
Interaction effects of explanatory factors of URID in the Xi’an metropolitan area, 2010 to 2022.
Overall, geographical conditions constitute a relatively stable foundational constraint by shaping spatial patterns and accessibility of regional development. These factors further determine the potential scope and direction of cross-regional factor mobility and agglomeration. Within such geographic constraints, socioeconomic development and land-use patterns restructuring act as core explanatory forces, which directly regulate the intensity of factor flows and the level of URID. Meanwhile, the ecological environment contributes to URID by mediating the balance between agricultural productivity and ecological protection. This balance helps set practical bounds on development intensity and supports long-term sustainability.
3.3.2. Stage-Specific Heterogeneity of Explanatory Patterns
Based on the temporal evolution characteristics of URID levels, this study divided the period 2010 to 2022 into four distinct stages (2010 to 2013, 2014 to 2016, 2017 to 2019, and 2020 to 2022) to investigate the stage-specific explanatory patterns, including dominant factors and their interaction effects. As illustrated in Figure 8, the ranking of factors by their average q-value across these stages is as follows: X3 (0.783) > X4 (0.669) > X5 (0.647) > X8 (0.624) > X2 (0.589) > X7 (0.588) > X9 (0.315) > X1 (0.225) > X6 (0.156). Socioeconomic factors consistently served as the core explanatory dimension of URID in all stages, although the overall mean q-value showed a clear downward trend. The average q-value of these factors peaked during 2014 to 2016 (0.77), a period during which the Xi’an metropolitan area was in a phase of accelerated industrialization. This stage was characterized by an average annual GDP growth rate of 6.08% and an annual built-up area expansion rate of 3.36%, indicating that economic growth and land development played the most substantial role in explaining URID at that time. In 2020 to 2022, the average q-value of socioeconomic factors fell to 0.61 under the impact of COVID-19. As China entered the post-pandemic era, the q-value of traditional economic variables weakened markedly [57], indicating a shift in URID from an economy-driven stage toward multidimensional coordination.
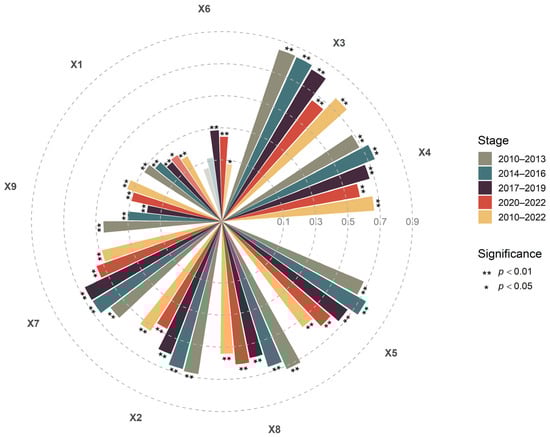
Figure 8.
Explanatory factors at different stages of URID in the Xi’an metropolitan area, 2010 to 2022.
The q-value of the rate of net migration (X6) displayed a distinct “rise and fall” pattern over the study period. From 2017 to 2022, its q-value consistently exceeded 0.2 and passed the significance test (p < 0.01), a trend closely linked to the widening disparities in regional economic foundations. After 2017, the metropolitan core shifted toward higher-end industries, demand for skilled labor increased, population inflows expanded, and the demographic dividend was gradually released [49,58]. In contrast, peripheral agricultural counties continued to experience population outflows, indicating that the positive effect of population factors on URID was primarily evident in regions with stronger economic bases. Meanwhile, the q-value of output of grain crops (X2) and the geographical factors (X7, X8) declined over time. This suggests that regional industrial upgrading progressively reduces the dependence of URID on agriculture and the natural environment. In the early stage, traditional agricultural counties relied mainly on land-supply services to advance URID. As the economic structure transformed and land-use efficiency improved, the expanding roles of the secondary and tertiary sectors progressively weakened the contribution of agricultural factors. Similarly, improvements in transportation and infrastructure lowered the barriers imposed by terrain on factor mobility, thereby alleviating the geographical constraints on URID.
Analysis of the interaction effects among explanatory factors across different stages revealed variations in the number and composition of highly explanatory combinations (Figure 9). During 2010 to 2013, a period characterized as a “low-level equilibrium” stage for URID in the Xi’an metropolitan area, the average interaction q-value among the three dimensions was generally comparable. The interaction q-value of the ecological environment recorded the highest value (0.80), followed closely by the socioeconomic and geographical factors (both 0.79). The pair of forest coverage rate (X1) and proportion of built-up area (X3) reached the peak (0.938), indicating that the urban-rural pattern was primarily shaped by the combined constraints of land use and the ecological base, reflecting an overall low-level, balanced state of URID. From 2014 to 2016, as the metropolitan economy development, the interaction effects between socioeconomic and ecological factors intensified. The interaction q-value between forest coverage rate (X1) and per capita fiscal budget revenue (X5) reached its highest point (0.944). URID during this stage was jointly shaped by ecological and economic forces. While meeting basic production and living needs, urban areas placed growing emphasis on ecological quality and environmental governance [59], making the synergy between ecology and the economy particularly prominent.
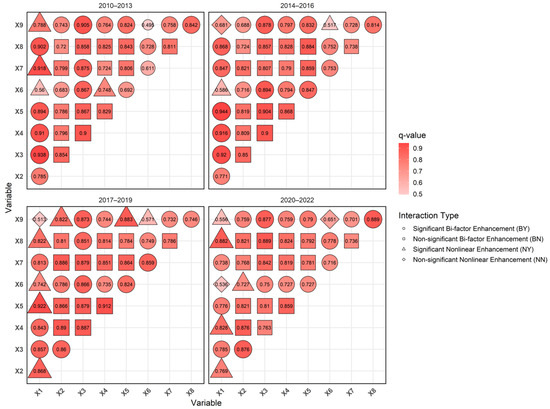
Figure 9.
Interaction effects at different stages of URID in the Xi’an metropolitan area, 2010 to 2022.
From 2017 to 2019, several previously high-intensity interaction pairs, such as X1∩X3, X1∩X4, and X1∩X5, declined in q-value. In contrast, the interaction effects involving the rate of net migration (X6) strengthened significantly. The average interaction q-value of X6 rose from 0.67 (2010 to 2013) to 0.76 (2017 to 2019), underscoring the growing influence of population mobility on URID. From 2020 to 2022, the average interaction q-value of the ecological and socioeconomic dimensions declined overall, whereas that of geographical factors changed little and tended to stabilize. The average interaction q-value of forest coverage rate (X1) decreased from 0.79 (2017 to 2019) to 0.73 (2020 to 2022), and that of the rate of net migration (X6) fell from 0.76 (2017 to 2019) to 0.70 (2020 to 2022). These shifts were closely related to the impact of COVID-19. The pandemic disrupted population migration patterns and labor mobility between urban and rural areas [60], weakening both the channels and the intensity of factor flows. As a result, strong interactions among traditional ecological and economic factors diminished, particularly the coupling between population variables and other indicators.
Overall, (1) geographical factors remained relatively stable across all stages and played a foundational role in supporting URID. Their average interaction q-value with the other two dimensions stayed within 0.779–0.789. (2) Ecological factors exhibited larger fluctuations and an overall downward trend, with average interaction q-value ranging from 0.76 to 0.82. In particular, the interaction q-value of forest coverage rate (X1) with other factors declined continuously. In contrast, output of grain crops (X2) was more stable, and its interaction q-value increased from 0.77 (2010 to 2013) to 0.80 (2020 to 2022), underscoring the steady contribution of food security to URID. (3) Socioeconomic factors recorded the highest average interaction q-value overall (0.81). However, in the post-pandemic era their influence appears to have weakened in the context of economic stagnation and restricted mobility. For example, the interaction q-value of the proportion of built-up area (X3) decreased from 0.88 (2010 to 2013) to 0.82 (2020 to 2022). Therefore, as URID entered a more advanced phase, the marginal effects of single factors or single-dimension interactions diminished. This pattern suggests a structural shift from strongly interaction-dominated dynamics toward broader multi-factor coordination.
4. Discussion
4.1. Influence of Parameter Settings on the OPGD Model and Corresponding Refinement Scheme
Spatial heterogeneity, as one of the core attributes of geographical research, reflects the inherently uneven distribution of geographical elements. Its accurate characterization serves as a fundamental prerequisite for deciphering regional development patterns [52]. Current methodological frameworks for analyzing spatial nonequilibrium primarily include spatial local heterogeneity analysis and spatial stratified heterogeneity (SSH) analysis [53]. Among these, the GD model has become the mainstream tool for SSH analysis. Its central principle is to partition the study area into several strata according to the categories of explanatory variables and to quantify the q-value of each variable for the spatial distribution of the dependent variable by comparing within-stratum and between-stratum variance [52]. However, a major challenge in applying the GD model lies in the appropriate spatial discretization of geographical variables, particularly in determining the optimal break number and selecting suitable discretization methods. Some scholars recommend establishing reasonable ranges for break numbers and determining optimal discretization for each indicator by integrating statistical metrics with geographical characteristics [61,62]. Building upon this idea, the OPGD model enhances analytical accuracy and stability by automatically identifying the parameter combination that yields the highest q-value within predefined ranges of break numbers and discretization methods [53]. It should be noted that both the break number range and discretization methods in the OPGD model require manual initialization. Additionally, each stratum must contain at least two samples for variance estimation [53]. Meanwhile, the resulting q-value varies significantly with changes in both break numbers and stratification methods, underscoring the importance of parameter selection.
To further enhance the precision and robustness of the model results, this study refines the parameter ranges of the OPGD model by jointly considering data volume, variable characteristics, and stratification requirements. On this basis, a stepwise parameter optimization logic of “significance testing followed by threshold verification” is developed (Figure 10). In particular, the growth-rate threshold is set at 5%, following previous research [63,64]. The selection process is as follows:
- (1)
- Construct the discretization matrix. Construct a valid “break number-discretization method” discretization matrix for each indicator.
- (2)
- Screen based on significance. This step sequentially tests three significance levels, starting with p < 0.01, then p < 0.05, and finally the non-significant level. For each break number, test all discretization methods and retain the one with the highest q-value; collect the retained results across break numbers to form the break-number set. If valid results exist, proceed to step (3); otherwise relax the criterion to the next significance level. This step reduces the break number-discretization method matrix to the break-number set.
- (3)
- Verify thresholds. For the break-number set obtained in step (2), progressive verification begins with p < 0.01. Using the smallest break number as the baseline, compare successive break numbers (+1, +2, +3) and compute the q-value growth rate. If all three comparisons (n with n + 1, n with n + 2, n with n + 3) yield growth rates below 5%, the q-value is considered stable and the corresponding parameter combination is identified as optimal. If any comparison exceeds the threshold, promote the next break number to the baseline and repeat the procedure (+1 → +2 → +3) until the upper bound of the predefined range is reached.
- (4)
- Significance-level downgrading and adaptation. If no valid result is obtained under p < 0.01, sequentially relax to p < 0.05 and then to the non-significant level. When an indicator remains non-significant overall, select the parameter combination with the highest q-value as a reference.

Figure 10.
Optimal parameter determination logic of the OPGD model. Note: denotes the q-value matrix of the given indicator, where represents the discretization method {} and indexes the break number in the predefined range. denotes the set of q-value obtained for different break numbers of the indicator, and denotes the final q-value selected as the optimal parameter.
Figure 11 illustrates the variations in the q-value for each explanatory factor under different combinations of break numbers and discretization methods. To clearly depict key transition points, the figure also shows changes in the q-value for the optimal parameter combination and the subsequent three break number levels. Taking the forest coverage rate (X1) as an example, when the break number was four, all methods except the geometric interval method showed a decline in the q-value. Under the geometric interval method, the increases in the q-value as the break number increased from four to five, six, and seven were each below 5%, indicating that the q-value stabilized at four breaks. Consequently, the optimal discretization for X1 was determined to be the quantile method with four breaks. Following the stepwise optimization logic of “significance testing followed by threshold verification” (Figure 10), the optimal discretization schemes for the remaining indicators were determined as follows:
X2: standard deviation method with four breaks; X3: quantile method with six breaks; X4: quantile method with six breaks; X5: natural breaks method with four breaks; X7: quantile method with three breaks; X8: geometric interval method with seven breaks.

Figure 11.
Relationship between break number, discretization method, and q-value in the OPGD model for URID.
It is worth noting that, due to differences in data distributions, some variables required extending the default OPGD model break number range of 3–7. For example, the rate of net migration (X6) showed substantial inter-county variation and achieved its optimum at 13 breaks, while commute time to the core area (X9), which exhibits a clear spatial gradient, was optimal at 9 breaks. These findings demonstrate that the parameter optimization logic introduced in this study offers strong practical applicability within the OPGD model framework. It allows for dynamic adjustment of break number ranges based on variable characteristics, effectively avoiding the loss of explanatory power commonly associated with using default parameters and significantly improving the model’s adaptability to complex spatial datasets.
4.2. Optimization Strategies and Pathways for URID Advancement in the Xi’an Metropolitan Area
URID offers a critical framework for understanding the evolution of urban-rural relationships and represents a key pathway toward promoting urban-rural transformation and high-quality development in China [15]. A growing body of research across provincial [38], metropolitan [14], and county scales [22] has mapped the spatiotemporal characteristics and drivers of URID, shaping an increasingly coherent theoretical framework. A consistent finding is that the center of gravity of URID lies in rural areas, while its driving force originates in urban centers [5]. The central task in advancing URID involves optimizing the structure of the urban-rural system, coordinating rural revitalization with new-type urbanization, and fostering agricultural modernization alongside regional coordinated development [21]. Nevertheless, significant disparities in developmental foundations persist across regions, reflecting variations in locational conditions, resource endowments, and developmental stages. Moreover, fragmented governance and disconnects between management and practice further undermine the depth and quality of URID [33]. It is therefore essential to formulate context-sensitive URID pathways and policy frameworks that align with local socioeconomic conditions, geographical features, and natural environments [28].
According to the Xi’an Metropolitan Area Development Plan, the region aims to establish a modern metropolitan system by 2035, achieve functional integration and urban-rural coordination, significantly narrow development gaps, and advance equal access to basic public services [30]. In line with these findings and the regional context, this study proposes three core pathways and corresponding optimization strategies to promote URID in the Xi’an metropolitan area (Figure 12).
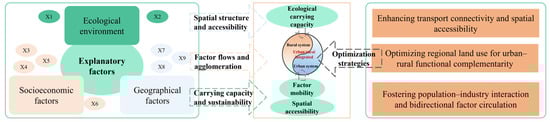
Figure 12.
Framework of URID explanatory dimensions and optimization pathways.
4.2.1. Strengthening Transportation Connectivity and Spatial Accessibility to Consolidate the Foundation for URID
This study shows that geographical and locational conditions act as foundational constraints on URID and consistently exhibit strong q-value across all stages. Previous studies confirm that inadequate transport infrastructure and high travel costs significantly limit the frequency of factor flows and diminish residents’ quality of life [65]. Conversely, transport improvements increase rural access to markets, expand employment opportunities, and accelerate the bidirectional flow of population and industries [26]. The Xi’an metropolitan area serves as the core growth pole of Shaanxi province and supports over 40% of its permanent population. Unlike the predominantly flat metropolitan areas of central China, such as Wuhan and Zhengzhou, the Xi’an metropolitan area exhibits a distinct terrain characterized by mountainous areas in the north and south and a central plain. While the central plains are conducive to socioeconomic agglomeration, the mountainous regions face terrain-induced accessibility constraints and high travel costs, which have become major bottlenecks restricting urban-rural connectivity.
To address this issue, the Xi’an metropolitan area should take coordinated actions from two perspectives: improving the transportation network and reducing mobility costs. First, it should improve the metropolitan transport network by strengthening interconnections among intercity rail, urban-rural bus systems, and arterial highways. Priority should be given to increasing direct services between Xi’an’s main urban area and surrounding jurisdictions such as Yaozhou district, Fuping county, and Qianxian county to enhance space-time accessibility and reduce travel burdens from peripheral areas to the core [65]. Second, in mountainous ecological barrier counties (districts) such as Huazhou district, accessibility should be improved in two complementary ways while maintaining ecological security. Internal feeder roads linking townships, villages, and production bases should be upgraded, and external links to the metropolitan trunk network should be selectively extended. These measures can strengthen both internal and external accessibility, facilitate the circulation of high-quality agricultural and forestry products, and attract capital inflows. Finally, these transport investments should be combined with ecological compensation and targeted fiscal support so that communities bearing conservation responsibilities also share in the economic benefits of improved accessibility.
4.2.2. Optimizing Regional Land Use Structure to Promote Urban-Rural Functional Complementarity and Spatially Coordinated Development
Land serves as a fundamental nexus in URID [28]. Efficient use of built-up land, coordinated with social security and the protection of cultivated and ecological land, forms the institutional basis for balanced urban-rural development [33]. From a functional-division perspective, the core and the periphery display natural complementarity: core zones depend on peripheral areas for ecological services and agricultural products, while peripheral areas rely on capital, technology, and market spillovers from the core [66]. This interdependence is a key potential driver for deeper URID [67]. To leverage this potential, the Xi’an metropolitan area should optimize its land use structure by emphasizing functional complementarity and efficiency gains.
First, in core functional zones such as Yanta district, Beilin district, Weiyang district and Qindu district, urban land use should shift from outward expansion toward a more compact form and more intensive use of existing built-up land [33]. Renewal of old residential quarters, redevelopment of low-efficiency industrial parcels and more compact public facility layouts can raise the development intensity of existing built-up areas. This could improve the output efficiency of limited urban land, while strengthen economic and service spillovers toward surrounding counties in the metropolitan area. Second, in surrounding agricultural counties, such as Fuping county, Jingyang county and Qianxian county, land-use policies should support both cultivated-land protection and moderate expansion of construction land in suitable locations. On the premise of protecting cultivated land, construction land should be moderately concentrated around key towns and industrial nodes. The development priorities for these counties should focus on building large-scale, intensive modern agricultural systems, developing agro-processing parks and cold-chain logistics hubs, and improving the land-use efficiency of county seats and industrial platforms. In this way, peripheral counties can enhance their carrying capacity for industry and employment and better align their land-use functions with those of the core. Third, in the ecological barrier zones within Yaozhou district, Huyi district and Huazhou district, development intensity and new built-up expansion should be strictly controlled. New sustainable land-use models, including forest-based wellness, rural tourism and ecological education, should be promoted. These arrangements can help ecological counties turn ecological assets into stable development momentum while strictly protecting key ecological spaces.
4.2.3. Promoting Positive Population-Industry Interaction to Build a Bidirectional Circulation of Factors
Existing studies widely regard population as a core element in evaluating URID [22,49], and cross-regional migration is often viewed as a key feature of sustainable urban development [68]. This study shows that the rate of net migration (X6) has a relatively low q-value as a single factor, yet its interaction effects with economic and geographical variables are highly significant. More importantly, its influence on URID also displays clear stage heterogeneity. In traditional agricultural counties (districts), surplus labor cannot be absorbed by local industries, which leads to insufficient employment, pressure on public services, and heavier demands on social security [69]. These conditions undermine the overall URID level. The positive effect of net population inflow on URID therefore depends on the strength of the regional economic base and industrial carrying capacity. Only where sufficient jobs and quality public services are available can population agglomeration be transformed into a genuine driver of URID [66].
Compared with mature metropolitan areas in eastern China, such as Shanghai and Guangzhou, the Xi’an metropolitan area still has certain gaps in terms of permanent population size, industrial maturity, and population attractiveness. On the basis of improved transportation connectivity and optimized land use, it is essential to establish a bidirectional circulation system of factors. This system should operate through a chain of industrial upgrading, employment absorption, and population agglomeration.
First, geographical location advantages should be used to develop specialized industrial parks and key industry chains. Core zones such as Yanta district, Beilin district, Weiyang district and Qindu district should further expand high-end manufacturing and modern services and make fuller use of their highly educated workforce. Peripheral counties such as Jingyang county, Fuping county, Huazhou district and Qianxian county should undertake industrial transfer from the core zones and develop supporting industrial parks. By focusing on labor-intensive and processing industries that match local labor endowments, these counties can expand local employment and reduce population outflow. Second, population-related public services should be improved in both receiving and sending areas. In core and sub-core districts that experience sustained population inflows, such as Yanta district and Qindu district, education and healthcare resources should be adjusted in line with the actual number of permanent residents, so that migrant families have access to basic public services. In out-migration counties such as Fuping county and Huazhou district, more emphasis should be placed on vocational training, support for returning migrants and inclusive social security. These measures can help transform temporary, unstable flows into more orderly, long-term circulation and achieve a rational spatial allocation of productivity across urban and rural areas [67]. Finally, in the post-pandemic era, digital transformation can further strengthen factor circulation in the Xi’an metropolitan area [70]. Regional e-commerce platforms for products such as Yaozhou apples and Fuping dairy goats, together with smart-agriculture applications and rural livestream e-commerce, can lower transaction costs, expand market reach, and create new growth poles for URID.
4.3. Limitations and Future Prospects
Compared with previous URID-GD-TOPSIS studies, this research makes two methodological contributions. First, it builds a county-level and continuous time-series URID evaluation framework for a metropolitan area. Second, it refines the OPGD parameter-setting logic to enhance the stability and interpretability of factor detection. Despite these contributions, several limitations remain due to data availability and research scope constraints, which are outlined below. First, the indicator system and data completeness require further refinement. At the county (district)-level, some indicators could not be obtained continuously due to data gaps, inconsistent statistical standards, or confidentiality restrictions. In addition, variations in classification criteria and indicator coverage across provincial and municipal statistical yearbooks in China have affected the consistency and comparability of the dataset to some extent. Second, there is still room for improvement in the factor detection approach. This study refined the OPGD model by adopting a stepwise parameter optimization logic of “significance testing followed by threshold verification.” However, to ensure model consistency and comparability, the maximum break number for explanatory variables was uniformly constrained during parameter setting. Given the differences in distribution characteristics and variability across variables, this constraint may have limited the q-value of certain indicators. Third, the analysis of differentiated explanatory mechanisms could be deepened further. Owing to the spatial extent of the study area, this research focused primarily on metropolitan-scale analysis and targeted discussions of key counties and districts, without conducting comparative assessments across different city types.
To tackle the above limitations, future research can be advanced in the following directions. First, multi-source data integration should be strengthened by incorporating nighttime light data, points-of-interest data and digital-economy statistics to enrich the indicator system across all dimensions. On this basis, infrastructure and governance can be introduced as additional dimensions in the evaluation framework. In addition, field surveys and departmental interviews can also be conducted to supplement missing county (district)-level statistical data, thereby improving the spatiotemporal accuracy of URID assessment. Second, the OPGD model stratification strategy should be optimized. Adaptive stratification approaches that account for variable attributes and distributional characteristics should be developed. The geographic features of the study area should be combined with the semantic properties of indicators to build a dual classification scheme that integrates geographic zoning with attribute hierarchies. This can enhance model stability and explanatory capacity. Third, a zoning-based comparative framework should be established. The metropolitan area should be subdivided by URID level, industrial structure, and locational conditions into core functional zones, suburban industrial transition zones, outer agricultural support zones, and ecological conservation zones. Such refined zoning can support targeted zone-specific policies that promote URID.
5. Conclusions
This study systematically examines the evolutionary patterns and explanatory mechanisms of URID in the Xi’an metropolitan area from 2010 to 2022. Using 26 counties (districts) as the units, the analysis adopts a perspective of urban-rural factor integration and interaction. This research integrates the entropy-weighted TOPSIS method with kernel density estimation and the OPGD model. The main conclusions are as follows:
- (1)
- URID in the Xi’an metropolitan area exhibited a pattern of “overall enhancement, internal divergence, accelerated growth in core areas, and moderated progress in peripheral zones.” Temporally, the average URID level increased from 0.218 in 2010 to 0.323 in 2022. Spatially, high values concentrated in core units such as Yanta district and Qindu district and low values in peripheral agricultural counties such as Fuping and Jingyang. The eight national URID pilot zones improved particularly rapidly after 2020, underscoring the role of targeted policy guidance in narrowing regional gaps.
- (2)
- The explanatory patterns of URID evolved toward stronger multidimensional coupling. Geographical factors provided a stable structural background, whereas socioeconomic factors, especially the proportion of built-up area and GRP, had the strongest association with URID. The effect of net migration was clearly stage-specific: after 2017, industrial upgrading in the metropolitan core coincided with stronger population inflows and a gradually released demographic dividend. With the interaction between forest coverage and economic variables weakening over time, while the role of grain output remained relatively stable. In the post-pandemic period, the marginal influence of single factors has declined, and URID is increasingly shaped by coordinated interactions across multiple dimensions.
- (3)
- Advancing URID in the Xi’an metropolitan area requires building a new type of urban-rural relationship featuring mutual reinforcement between industry and agriculture, functional complementarity and shared development. Policy efforts should focus on three fronts. First, strengthen transport connectivity and spatial accessibility, especially between core cities and peripheral counties, to reduce travel costs and support more frequent factor flows. Second, optimize land-use structures to promote compact, efficient urban development in core districts while supporting productive, ecologically sound land-use patterns in surrounding agricultural and ecological counties. Third, foster positive population-industry interactions by enhancing employment absorption and improving basic public services in both in-migration and out-migration areas, and by using digital tools such as e-commerce and smart agriculture to lower circulation costs and expand market access.
The main contributions of this study lie in both methodology and application. Methodologically, it refines the OPGD model by introducing a stepwise parameter-optimization logic of “significance testing followed by threshold verification,” which enhances the robustness and q-values of factor identification. Empirically, using county (district)-level continuous time-series data, it reveals the gradient differentiation and phased evolution of URID in the Xi’an metropolitan area, and proposes key pathways for promoting URID in the post-pandemic era. These findings enrich the URID research framework and provide reference for optimizing factor allocation and narrowing urban-rural gaps in other less-developed regions.
Author Contributions
Conceptualization, Z.L. and T.Z.; methodology, Z.L.; software, Z.Z. and H.L.; validation, T.Z. and Z.L.; formal analysis, Z.L. and Z.Z.; resources, H.L.; data curation, Z.L. and H.L.; writing—original draft preparation, Z.L.; writing—review and editing, Z.L. and T.Z.; visualization, H.L.; supervision, T.Z.; funding acquisition, T.Z. All authors have read and agreed to the published version of the manuscript.
Funding
This research was funded by the Shaanxi Province Association for Science and Technology Youth Talent Support Program (Grant No. 20230710), the National Natural Science Foundation of China (Grant No. 42571106), the Shaanxi Normal University “Belt and Road” Special Research Project (Grant No. 24YDYLZ010) and the Shaanxi Provincial Social Science Foundation (Grant No. 2025QBR022).
Data Availability Statement
The data presented in this study are available on request from the corresponding author.
Conflicts of Interest
The authors declare no conflicts of interest.
Abbreviations
The following abbreviations are used in this manuscript:
| URID | Urban-rural integrated development |
| GDP | Gross domestic product |
| GRP | Gross regional product |
| NPP | Net primary productivity |
| SSH | Spatial stratified heterogeneity |
| GD | Geographical detector |
| OPGD | Optimal parameters-based geographical detector |
| DEM | Digital Elevation Model |
| VIF | Variance inflation factor |
| A1 | Per capita retail sales of consumer goods of urban and rural residents (CNY/person) |
| A2 | Ratio of per capita disposable income between urban and rural residents (%) |
| A3 | Per capita GDP of urban and rural residents (CNY/person) |
| A4 | Proportion of non-agricultural industrial output value (%) |
| A5 | Ratio of primary industry added value to cultivated land area (CNY/km2) |
| A6 | Number of industrial enterprises above designated size (unit) |
| B1 | Population density (person/km2) |
| B2 | Ratio of primary and secondary school students to permanent population (%) |
| B3 | Number of hospital beds per 10,000 urban and rural residents (unit/10,000 persons) |
| B4 | Primary-school teacher-student ratio of urban and rural residents (%) |
| B5 | Middle-school teacher-student ratio of urban and rural residents (%) |
| C1 | NPP (gC/(m2·a)) |
| C2 | Average PM2.5 concentration (μg/m3) |
| X1 | Forest coverage rate (%) |
| X2 | Output of grain crops (10,000 tons) |
| X3 | Proportion of built-up area (%) |
| X4 | Gross regional product (10,000 CNY) |
| X5 | Per capita fiscal budget revenue (CNY) |
| X6 | Rate of net migration (%) |
| X7 | DEM (m) |
| X8 | Slope (°) |
| X9 | Commute time to the core area (minutes) |
References
- World Urbanization Prospects: The 2018 Revision. Available online: https://population.un.org/wup/ (accessed on 23 August 2025).
- World Cities Report 2022: Envisaging the Future of Cities. Available online: https://unhabitat.org/world-cities-report-2022-envisaging-the-future-of-cities (accessed on 23 August 2025).
- Su, K.; He, D.; Wang, R.; Han, Z.; Deng, X. Assessment of natural resource endowment and urban-rural integration for sustainable development in Xinjiang, China. J. Clean. Prod. 2024, 450, 142046. [Google Scholar] [CrossRef]
- The Sustainable Development Goals Report 2024. Available online: https://unstats.un.org/sdgs/report/2024/ (accessed on 23 August 2025).
- Fang, C. On integrated urban and rural development. J. Geogr. Sci. 2022, 32, 1411–1426. [Google Scholar] [CrossRef]
- Zhan, L.; Wang, S.; Xie, S.; Zhang, Q.; Qu, Y. Spatial path to achieve urban-rural integration development—Analytical framework for coupling the linkage and coordination of urban-rural system functions. Habitat Int. 2023, 142, 102953. [Google Scholar] [CrossRef]
- Yang, Y.; Bao, W.; Wang, Y.; Liu, Y. Measurement of urban-rural integration level and its spatial differentiation in China in the new century. Habitat Int. 2021, 117, 102420. [Google Scholar] [CrossRef]
- Wan, G.; Zhang, X.; Zhao, M. Urbanization can help reduce income inequality. npj Urban Sustain. 2022, 2, 1. [Google Scholar] [CrossRef]
- Liu, Y. Research on the urban-rural integration and rural revitalization in the new era in China. Acta Geogr. Sin. 2018, 73, 637–650. [Google Scholar]
- Fang, C. Theoretical analysis on the mechanism and evolution law of urban-rural integration development. Acta Geogr. Sin. 2022, 77, 759–776. [Google Scholar]
- Zheng, Y.; Long, H. Measurement and spatio-temporal pattern of urban-rural integrated development in China. Acta Geogr. Sin. 2023, 78, 1869–1887. [Google Scholar]
- Chen, K.; Long, H.; Liao, L.; Tu, S.; Li, T. Land use transitions and urban-rural integrated development: Theoretical framework and China’s evidence. Land Use Policy 2020, 92, 104465. [Google Scholar] [CrossRef]
- Duan, K.; Shi, J.; Wu, G.; Hua, W. Driving factors and paths of urban-rural integration development. Chin. J. Popul. Resour. Environ. 2024, 34, 150–161. [Google Scholar]
- Zhang, H.; He, R.; Li, G.; Wang, J. Spatiotemporal evolution of coupling coordination degree of urban-rural integration system in metropolitan area and its influencing factors: Taking the capital region as an example. Econ. Geogr. 2020, 40, 56–67. [Google Scholar]
- Luo, W.; Wang, W.; Lin, Z.; Zhou, W. Spatiotemporal evolution and driving factors of urban-rural integration in China. Prog. Geogr. 2023, 42, 629–643. [Google Scholar] [CrossRef]
- Zhang, C.; Fan, Y.; Fang, C. When will China realize urban-rural integration? A case study of 30 provinces in China. Cities 2024, 153, 105290. [Google Scholar] [CrossRef]
- Liu, S.; Long, T. The theory of urban-rural integration: Stages, characteristics and enlightenment. Econ. Perspect. 2022, 3, 21–34. [Google Scholar]
- Wei, M.; Huang, T. The influence mechanism of county urban-rural integration development on the realization of common prosperity of rural tourism destinations: Take 60 typical counties in the Yangtze River Delta region as examples. J. Nat. Resour. 2024, 39, 1591–1612. [Google Scholar] [CrossRef]
- Liu, Y.; Zang, Y.; Yang, Y. China’s rural revitalization and development: Theory, technology and management. J. Geogr. Sci. 2020, 30, 1923–1942. [Google Scholar] [CrossRef]
- Zhou, D.; Qi, J.; Zhong, W. Review of urban-rural integration evaluation: Connotation identification, theoretical analysis, and system reconstruction. J. Nat. Resour. 2021, 36, 2634–2651. [Google Scholar] [CrossRef]
- Long, H.; Xu, Y.; Zheng, Y.; Chen, K. Urban-rural integrated development at county level under Chinese path to modernization. Econ. Geogr. 2023, 43, 12–19. [Google Scholar]
- Cui, S.; Zhou, G.; Wu, G.; Bi, F. The evaluation of urban-rural integration degree and its driving mechanism in Changsha-Zhuzhou-Xiangtan urban agglomeration from the perspective of spatial interaction. Geogr. Res. 2023, 42, 1029–1049. [Google Scholar]
- Liu, M.; Li, Q.; Bai, Y.; Fang, C. A novel framework to evaluate urban-rural coordinated development: A case study in Shanxi Province, China. Habitat Int. 2024, 144, 103013. [Google Scholar] [CrossRef]
- Zhang, X.; Qiu, F.; Zhu, C. Evolution of urban-rural integration in Huaihai Economic Zone from the perspective of spatio-temporal interaction. J. Nat. Resour. 2020, 35, 1867–1880. [Google Scholar]
- Liu, H.; Lu, G.; Luo, K.; Zong, H. Measurement and spatio-temporal pattern evolution of urban-rural integration development in the Chengdu-Chongqing Economic Circle. Land 2024, 13, 942. [Google Scholar] [CrossRef]
- Pan, W.; Wang, J.; Li, Y.; Chen, S.; Lu, Z. Spatial pattern of urban-rural integration in China and the impact of geography. Geogr. Sustain. 2023, 4, 404–413. [Google Scholar] [CrossRef]
- Feng, W.; Liu, Y.; Qu, L. Effect of land-centered urbanization on rural development: A regional analysis in China. Land Use Policy 2019, 87, 104072. [Google Scholar] [CrossRef]
- Liu, B.; Qi, C.; Xue, B.; Yang, Z. Measuring urban-rural integration through the lenses of sustainability and social equity: Evidence from China. Habitat Int. 2025, 165, 103559. [Google Scholar] [CrossRef]
- Zhao, W.; Pan, W.; Li, Y. Urban-rural integration within the county territory: Theoretical connotation and research progress. Geogr. Res. 2023, 42, 1445–1464. [Google Scholar]
- Xi’an Metropolitan Area Development Plan. Available online: https://www.shaanxi.gov.cn/zfxxgk/fdzdgknr/zcwj/nszfwj/szf/202208/t20220808_2238133.html (accessed on 25 August 2025).
- Wang, X.; Liu, Y.; Shao, Y.; Li, S. Evolution pattern and mechanism of rural areal functions in Xi’an metropolitan area, China. Habitat Int. 2024, 148, 103088. [Google Scholar] [CrossRef]
- Zhu, L.; Zhao, M.; Li, Y.; Fan, Y.; Wang, J. The space-time relationship between the ecosystem service value and the human activity intensity in Xi’an Metropolitan Area. J. Ecol. Rural Environ. 2024, 40, 325–334. [Google Scholar]
- Salem, M.; Ravetz, J.; Sareen, S.; Dong, T.; Haque, M.; Bayoumi, W.; Tsurusaki, N.; Xu, G. Managing the urban-rural transition: A review of approaches and policies for peri-urban land use. J. Urban Manag. 2025, 14, 1115–1129. [Google Scholar] [CrossRef]
- Bezemer, D.; Headey, D. Agriculture, Development, and Urban Bias. World Dev. 2008, 36, 1342–1364. [Google Scholar] [CrossRef]
- Dijkstra, L.; Florczyk, A.J.; Freire, S.; Kemper, T.; Melchiorri, M.; Pesaresi, M.; Schiavina, M. Applying the Degree of Urbanisation to the globe: A new harmonised definition reveals a different picture of global urbanisation. J. Urban Econ. 2021, 125, 103312. [Google Scholar] [CrossRef]
- Zhai, G.; Zhang, M.; Hu, Y.; Chen, Y.; Wu, C.; Lu, Y.; He, T. Nighttime light metrics for analysing urban-rural economic disparities: A case study in 36 Chinese metropolitan areas. Cities 2025, 162, 105930. [Google Scholar] [CrossRef]
- He, Y.; Liu, Y.; Fang, X. How urban-rural interactions promote sustainable rural development: Evidence from the Chang-Zhu-Tan urban agglomeration, China. Geogr. Sustain. 2025, 6, 100338. [Google Scholar] [CrossRef]
- Zhou, J.; Qin, F.; Liu, J.; Zhu, G.; Zou, W. Measurement, spatial-temporal evolution and influencing mechanism of urban-rural integration level in China from a multidimensional perspective. Chin. J. Popul. Resour. Environ. 2019, 29, 166–176. [Google Scholar]
- Yang, T.; Zhou, C.; Xiao, T.; Xu, Q. Coordinated Development of the Digital Economy and Urban–Rural Integration in the Yangtze River Delta and Its Spatial Correlation Structure. Sustainability 2025, 17, 4144. [Google Scholar] [CrossRef]
- Zhu, X.; Yu, F. Evolution characteristics, regional differences and influencing factors of urban-rural integrated development at the county scale: Take 64 counties in Wuling Mountain Area as examples. J. Nat. Resour. 2025, 40, 1386–1411. [Google Scholar] [CrossRef]
- Ge, K.; Wang, Y.; Liu, X.; Ke, S.; Jiang, X.; Lu, X. Impacts and threshold effects of urban-rural integration on the transition of arable land use functions. Ecol. Indic. 2024, 166, 112595. [Google Scholar] [CrossRef]
- Zhou, B.-B.; Aggarwal, R.; Wu, J.; Lv, L. Urbanization-associated farmland loss: A macro-micro comparative study in China. Land Use Policy 2021, 101, 105228. [Google Scholar] [CrossRef]
- Deng, Z.; Zhao, Q.; Bao, H.X.H. The impact of urbanization on farmland productivity: Implications for China’s requisition-compensation balance of farmland policy. Land 2020, 9, 311. [Google Scholar] [CrossRef]
- Liu, Y.; Long, H.; Li, Y. Human geography research based on the new thinking of global rural-urban relationship. Acta Geogr. Sin. 2021, 76, 2869–2884. [Google Scholar]
- Long, H.; Ma, L.; Zhang, Y.; Qu, L. Multifunctional rural development in China: Pattern, process and mechanism. Habitat Int. 2022, 121, 102530. [Google Scholar] [CrossRef]
- Zhou, M.; Lyu, H. Intensifying separation or collaborative prosperity? The impact of the Belt and Road Initiative on China’s urban-rural integration development from a spatial justice lens. Habitat Int. 2025, 156, 103249. [Google Scholar] [CrossRef]
- Zhang, T.; Peng, J.; Cao, X. China’s urban and rural development significantly affects the pattern of human appropriation of net primary production. Land 2023, 12, 1062. [Google Scholar] [CrossRef]
- Arnold, M.; Powell, B.; Shanley, P.; Sunderland, T.C.H. Editorial: Forests, biodiversity and food security. Int. For. Rev. 2011, 13, 259–264. [Google Scholar] [CrossRef]
- Cheng, M.; Yin, Z.; Westlund, H. Counterurbanization in China? A case study of counties in Huang-Huai-Hai area from the perspective of urban-rural relations. J. Rural Stud. 2024, 110, 103386. [Google Scholar] [CrossRef]
- Ai, X.S.; Yu, Y.X.; Liang, Z.M.; Shi, X.Y.; Cao, R.; Zhang, X.K. Multilayer entropy-weighted TOPSIS method and its decision-making in ecological operation during the subsidence period of the Three Gorges Reservoir. Sci. Rep. 2025, 15, 2954. [Google Scholar]
- He, Y.; Huang, X.; Yang, X. Adaptation of land-lost farmers to rapid urbanization in urban fringe: A case study of Xi’an. Geogr. Res. 2017, 36, 226–240. [Google Scholar]
- Wang, J.-F.; Zhang, T.-L.; Fu, B.-J. A measure of spatial stratified heterogeneity. Ecol. Indic. 2016, 67, 250–256. [Google Scholar] [CrossRef]
- Song, Y.Z.; Wang, J.F.; Ge, Y.; Xu, C.D. An optimal parameters-based geographical detector model enhances geographic characteristics of explanatory variables for spatial heterogeneity analysis: Cases with different types of spatial data. GISci. Remote Sens. 2020, 57, 593–610. [Google Scholar] [CrossRef]
- Yang, J.; Huang, X. The 30 m annual land cover dataset and its dynamics in China from 1990 to 2019. Earth Syst. Sci. Data 2021, 13, 3907–3925. [Google Scholar] [CrossRef]
- Li, Y.H.; Westlund, H.; Liu, Y.S. Why some rural areas decline while some others not: An overview of rural evolution in the world. J. Rural Stud. 2019, 68, 135–143. [Google Scholar] [CrossRef]
- Shi, S.Q.; Han, Y.; Yu, W.T.; Cao, Y.Q.; Cai, W.M.; Yang, P.; Wu, W.B.; Yu, Q.Y. Spatio-temporal differences and factors influencing intensive cropland use in the Huang-Huai-Hai Plain. J. Geogr. Sci. 2018, 28, 1626–1640. [Google Scholar] [CrossRef]
- Han, Y. The impact of the COVID-19 pandemic on China’s economic structure: An input-output approach. Struct. Change Econ. Dyn. 2022, 63, 181–195. [Google Scholar] [CrossRef] [PubMed]
- Cao, Z.J.; Li, Z.; Zhou, K.X. Does the inter-provincial floating population affect regional economic development in China? An empirical analysis. Sustainability 2024, 16, 7142. [Google Scholar] [CrossRef]
- Fang, C.L.; Liang, L.W.; Chen, D. Quantitative simulation and verification of urbanization and eco-environment coupling coil in Beijing-Tianjin-Hebei urban agglomeration, China. Sust. Cities Soc. 2022, 83, 103985. [Google Scholar] [CrossRef]
- Zhang, Y.; Guo, X.; Su, Y.; Koura H, Y.H.; Wang, N.; Song, W. Changes in spatiotemporal pattern and network characteristics in population migration of China’s cities before and after COVID-19. Hum. Soc. Sci. Commun. 2023, 10, 673. [Google Scholar] [CrossRef]
- Li, Y.; Luo, P.; Song, Y.Z.; Zhang, L.Q.; Qu, Y.; Hou, Z.Y. A locally explained heterogeneity model for examining wetland disparity. Int. J. Digit. Earth 2023, 16, 4533–4552. [Google Scholar] [CrossRef]
- Guo, J.G.; Wang, J.F.; Xu, C.D.; Song, Y.Z. Modeling of spatial stratified heterogeneity. GISci. Remote Sens. 2022, 59, 1660–1677. [Google Scholar] [CrossRef]
- Luo, P.; Song, Y.Z.; Huang, X.; Ma, H.L.; Liu, J.; Yao, Y.; Meng, L.Q. Identifying determinants of spatio-temporal disparities in soil moisture of the Northern Hemisphere using a geographically optimal zones-based heterogeneity model. ISPRS-J. Photogramm. Remote Sens. 2022, 185, 111–128. [Google Scholar] [CrossRef]
- Song, Y.; Shen, Z.; Wu, P.; Viscarra Rossel, R.A. Wavelet geographically weighted regression for spectroscopic modelling of soil properties. Sci. Rep. 2021, 11, 17503. [Google Scholar] [CrossRef]
- Zhao, P.; Wan, J. Land use and travel burden of residents in urban fringe and rural areas: An evaluation of urban-rural integration initiatives in Beijing. Land Use Policy 2021, 103, 105309. [Google Scholar] [CrossRef]
- Cattaneo, A.; Adukia, A.; Brown, D.L.; Christiaensen, L.; Evans, D.K.; Haakenstad, A.; McMenomy, T.; Partridge, M.; Vaz, S.; Weiss, D.J. Economic and social development along the urban-rural continuum: New opportunities to inform policy. World Dev. 2022, 157, 105941. [Google Scholar] [CrossRef]
- Ma, L.; Liu, S.; Fang, F.; Che, X.; Chen, M. Evaluation of urban-rural difference and integration based on quality of life. Sust. Cities Soc. 2020, 54, 101877. [Google Scholar] [CrossRef]
- Li, L.; Ma, S.; Zheng, Y.; Xiao, X. Integrated regional development: Comparison of urban agglomeration policies in China. Land Use Policy 2022, 114, 105939. [Google Scholar] [CrossRef]
- Pan, M.; Huang, Y.; Qin, Y.; Li, X.; Lang, W. Problems and strategies of allocating public service resources in rural areas in the context of county urbanization. Int. J. Environ. Res. Public Health 2022, 19, 14596. [Google Scholar] [CrossRef]
- He, Z.; Chen, M.; Gu, D. How digital village construction affects to the effectiveness of rural governance?—Research on the NCA and QCA methods. Cities 2025, 156, 105514. [Google Scholar] [CrossRef]
Disclaimer/Publisher’s Note: The statements, opinions and data contained in all publications are solely those of the individual author(s) and contributor(s) and not of MDPI and/or the editor(s). MDPI and/or the editor(s) disclaim responsibility for any injury to people or property resulting from any ideas, methods, instructions or products referred to in the content. |
© 2025 by the authors. Licensee MDPI, Basel, Switzerland. This article is an open access article distributed under the terms and conditions of the Creative Commons Attribution (CC BY) license.