Abstract
As global production networks become increasingly regionalized, diversified, and resilience-oriented, metropolitan areas (MAs) have emerged as important spatial platforms for industrial development. This study examines whether China’s national-level metropolitan area integration policies promote urban industrial structure upgrading and, if so, through which channels. We first develop a set of conceptual mechanisms and hypotheses, and then test them using panel data for 281 prefecture-level cities in China from 2012 to 2022. A staggered difference-in-differences (DID) model, complemented by a series of robustness checks, is employed to identify the policy effects. The baseline estimates indicate that the industrial structure of MA member cities is, on average, about 2.43 percentage points more advanced than that of non-MA cities. Mechanism analysis shows that the policies foster urban industrial upgrading through unified market formation, technological improvement, and optimization of factor endowments. However, the policies have only a very limited impact on breakthroughs in cutting-edge or frontier technologies. Based on these findings, we propose targeted policy recommendations to address the identified shortcomings.
1. Introduction
Over the past decades, a growing body of research has examined how states and regional governance institutions shape industrial upgrading and spatial economic restructuring. Studies on developmental states and regional industrial policy highlight the active role of governments in coordinating investment, infrastructure, and innovation to promote structural transformation [1,2,3,4]. In parallel, spatial planning and economic governance are organized around territorially defined units such as regions, counties, metropolitan areas, and cities, which serve as key platforms for industrial policy and coordination [5]. As cities are the central locations for capital, labor, and information, urban and regional studies have emphasized the importance of metropolitan regions and city regions as key spatial scales where global production networks, innovation systems, and labor markets are reorganized [6].
Within this global discussion, empirical evidence on how metropolitan integration policies influence industrial structure upgrading remains relatively fragmented. A body of research examines how transnational economic integration affects industrial upgrading, with a strong geographic focus on Europe. A previous study finds that CEECs have moved into passenger car production, components, and higher value-added activities [7]. Studies on Asia also point out that Vietnam’s manufacturing firms upgraded product quality in response to ASEAN free-trade arrangements [8]. These studies highlight the role of cross-border integration, but they mainly operate at the international level. Few studies provide systematic evidence on how state-led metropolitan integration policies reshape urban industrial structures within the domestic context.
China provides a particularly revealing case. Compared with other developing economies, a distinctive feature of China’s industrial upgrading is the strong and persistent role of the state at both the central and local levels [9]. In this context, the central government promotes regional integration through a series of top-down regional plans and supporting policies, while local governments engage in various forms of inter-jurisdictional cooperation as a bottom-up response to national strategies and cross-boundary challenges [10]. Metropolitan areas (MAs) have emerged as a key spatial platform for fostering the country’s economic growth. In China, MAs typically evolve within larger urban agglomerations. They represent a form of urbanization centered on megacities, very large cities, or cities with strong economic spillover capacity, usually encompassing areas within approximately a one-hour commuting radius. Existing research indicates that the average economic efficiency of China’s MAs is generally higher than that of urban agglomerations’ broader area [11]. Development plans for MAs that are formally approved by the National Development and Reform Commission of China (NDRC) constitute the top-level design and programmatic blueprint for the construction of national-level MAs. In February 2019, the NDRC issued guiding policy documents on the cultivation and development of modern metropolitan areas. Since then, the construction of modern MAs has accelerated, and the associated incentive mechanisms and institutional arrangements have been progressively refined. By December 2022, seven national-level metropolitan areas (NMAs) had been officially approved: the Nanjing, Fuzhou, Chengdu, Changsha–Zhuzhou–Xiangtan, Xi’an, Chongqing, and Wuhan MAs.
Yet, most empirical studies focus on large-scale urban agglomerations and do not specifically examine the effects of MA integration policies on city-level industrial structure upgrading. MAs are different from urban agglomerations. The core difference lies in the strength and structure of economic ties. Industrial collaboration in MAs far exceeds the relatively loose geographic clustering found in urban agglomerations. Under the current regime of regionalized and localized global value chains, the metropolitan scale is increasingly salient: it places greater emphasis on fostering geographically proximate industrial clusters along specific segments of the value chain, and functions even more explicitly as an “industrial cooperation area” [12]. MAs clearly reflect agglomeration effects, network effects, and governance coordination, making them valuable for research. However, most existing research focuses on industrial collaboration in broader geographical areas, such as the Yangtze River Delta integration [13,14,15,16], the Pearl River Delt area [9], the Beijing–Tianjin–Hebei region [17], and other regional agglomerations [18,19,20].
Therefore, this study is motivated by both theoretical and policy considerations. On the one hand, have China’s MA integration policies promoted the upgrading of urban industrial structure? Theoretically, while the literature on developmental states and regional industrial policy stresses the importance of state intervention, there is still limited empirical evidence on how specific metropolitan integration policies affect industrial structure upgrading at a city level. On the other hand, through which mechanisms do these policies operate? Understanding whether, and through which channels, these policies effectively foster upgrading is crucial for evaluating their effectiveness and for informing future regional development strategies. By combining a staggered DID framework with city-level data for Chinese MAs, this paper aims to construct a sound government–market relationship framework, and to fill the existing gap by providing China-based evidence that speaks to broader debates on the role of government in regional industrial transformation. Specifically, the remainder of the paper is organized as follows: (1) Section 2 defines industrial structure upgrading in a rigorous way, and reviews the relevant literature, thereby providing the theoretical foundation for analysis; (2) Section 3 develops a conceptual framework along the logic of “policy measures → transmission channels → outcome effects” and proposes testable hypotheses; (3) Section 4 presents the empirical design and model specification; (4) Section 5 reports the baseline results, conducts a series of robustness checks, and provides empirical evidence on the proposed mechanisms; (5) Section 6 discusses the limitations and Section 7 concludes the main findings and implications.
This study makes four marginal contributions. First, by identifying the impact of MA integration policies on urban industrial upgrading, it provides timely evidence of the role of key spatial policy tools in industrial upgrading. Second, by analyzing and empirically testing the policy transmission mechanisms, it contributes to the theoretical understanding of how MA interacts with industrial upgrading in a developmental state framework. Third, the analysis helps clarify the functional boundaries and complementarities between government intervention and market forces in the process of structural transformation. Finally, it offers policy-relevant insights for fostering a modern regional industrial system and promoting high-quality regional development within a large developing economy.
2. Concept Definition and Literature Review
2.1. Concept of Industrial Structure Upgrading
From a micro perspective, the global value-chain literature defines upgrading as improving a firm’s position within the chain, which is generally associated with securing more of the value-added through the production process [21]. The most predictable avenue for upgrading includes product upgrading (producing more sophisticated goods with higher unit prices) and process upgrading (improving technology and/or production systems) [9]. Industrial restructuring refers to the reallocation of production factors across economic sectors and industries, as well as changes in their respective proportions [22].
There comes the definition of industrial structure upgrading. The industrial structure upgrading is the process of establishing and realizing a high efficiency industrial structure [17], and is often measured by the high-level index of industrial structure. Its essence is the evolution of the industry along the value chain from low technology and low added value to high technology and high added value. In the framework of this study, urban industrial structure upgrading refers to changes in the proportion of industries, an increase in technological complexity, improvements in labor productivity, and the enhancement of positions within the division of labor, under conditions of regional openness. This can be manifested in the following four aspects: (1) in terms of product processing, there is a shift from industries dominated by primary product manufacturing to those dominated by intermediate and final product manufacturing; (2) in terms of factor composition, it refers to the sequential transformation of industrial structure from being dominated by labor-intensive industries to being dominated by capital or technology-intensive industries; (3) in terms of value-chain position, leading industries shift from low value-added, low-technology sectors to high-value-added, high-technology sectors, such as the phenomenon of industrial servitization; and (4) within traditional industrial sectors, reforms in production methods are implemented, and advances and technological innovation are achieved in the production processes.
2.2. Literature Review
2.2.1. Regional Integration, Governance, and Industrial Upgrading: International Evidence
International research on regional integration policy and industrial upgrading converges on the view that integration regimes are not neutral background conditions; rather, they actively reshape the spatial organization of production, the direction of structural change, and the possibilities for upgrading across territories. A first strand of work emphasizes the agglomeration dynamics triggered by declining trade and coordination costs. Using a model-based assessment of industrial location within the European Community between 1980 and 1990, Brülhart (1996) [23] shows that regional integration, via reduced intra-European trade costs, reinforced the concentration of increasing-returns manufacturing in core regions. The findings suggest that further cost reductions would intensify this pattern, with core areas attracting scale-intensive manufacturing, while peripheral regions specialize in activities with limited economies of scale and in non-manufacturing sectors. Historical evidence from the United States points in a similar direction: deeper economic integration led U.S. regions to become more specialized and industries more localized [24]. As its integration proceeded, regional factor endowments and industrial structures gradually converged, and regional income levels and capital-labor ratios became more similar [25]. Together, these studies indicate that integration policy can first magnify agglomeration and specialization and subsequently foster partial convergence in structures and incomes once markets and factor endowments adjust.
A second body of research takes a more explicitly governance-oriented perspective on integration and structural change. Deepening economic development and European integration have simultaneously increased sectoral specialization and structural similarity across European MAs: large cities tend to “specialize alike” in financial and other knowledge-intensive market services. In other words, integration policies and common regulatory frameworks encourage upgrading towards high-end services, but this upgrading is accompanied by growing similarity in metropolitan structures [26]. Historical work on Sub-Saharan Africa moves beyond high-income contexts and identifies a circular and cumulative relationship between regional integration and industrialization: integration lowers transaction costs and expands markets for nascent industries, suggesting that well-designed integration governance can be an active driver of late industrialization [27].
A third, more recent strand of literature shifts the focus from macro-patterns to the institutional and micro-foundational conditions under which integration-related policies translate into effective industrial and innovation upgrading. A comparative analysis of Brazil, Japan, the Republic of Korea, and the United States, shows that centrally driven high-tech export strategies and highly centralized regional policies can amplify polarization by locking in existing cores, whereas decentralized regional policies, if backed by sufficient early support, can foster new growth poles in peripheral areas and contribute to a flatter and more efficient urban hierarchy [28]. A study of Mexican states further argues that sub-national industrial policy outcomes depend on the interaction of executive leadership, bureaucratic quality, and business cohesion; these factors are necessary but not individually sufficient for generating synergistic, upgrading-oriented industrial policies [29]. Complementing this governance lens, Friedrich (2025) [30] examines regional innovation policy in structurally weak German regions and finds that long-standing EU and national programs have had limited success in reducing inter-regional disparities, partly because economically weaker regions lack the fiscal capacity to design tailored innovation schemes.
Taken together, this literature suggests that integration policies shape industrial upgrading through three intertwined channels: by altering agglomeration and specialization patterns; by providing multilevel governance frameworks that enable (or constrain) metropolitan and regional restructuring; and by interacting with local institutional capacities and firm-level innovation modes. Whether integration promotes upgrading and convergence, or entrenches polarization and structural divergence, depends critically on how integration governance is designed and how it is embedded in regional development, industrial, and innovation policies. This lays a solid logical and theoretical foundation for subsequent mechanism analysis.
2.2.2. Regional Integration Policies and Industrial Upgrading in China
When attention shifts to China’s internal regional integration, the policy instruments and political economy conditions are quite different, and the existing paradigm becomes less directly applicable. In China, regional integration policies that shape industrial upgrading can broadly be divided into regional development policies and regional industrial policies.
The first stream underscores the role of government-led regional development strategies in reallocating resources, reshaping spatial division of labor, and thus changing industrial structure. In China, many regions have sought central endorsement for new regional strategies as a way to accelerate growth and climb the value chain [31]. Empirical studies show that such strategies—through unified infrastructure construction, factor mobility, and coordinated spatial planning—can promote the rationalization and upgrading of member cities’ industrial structures [13,14,18,19,32,33]. Evidence ranges from the Yangtze River Economic Belt [33] and resource-based cities [18] to the Yangtze River Delta and other urban clusters [13,14], as well as the Western Development Strategy [19]. These policies are found to facilitate factor flows, reduce market segmentation, foster technological diffusion, and deepen intra-cluster specialization [34,35]. Methodologically, many of these papers treat major regional policies as quasi-natural experiments and apply the DID model, which provides a clear reference for our empirical strategy.
The second stream focuses on regional industrial policies and reveals more controversy. On the one hand, studies argue that competitive and functional industrial policies can complement market forces, promote innovation and diffusion, raise firms’ total factor productivity (TFP), and support industrial upgrading via instruments such as “informatization-industrialization” integration and increased public spending [36,37]. On the other hand, the growing literature questions the incentives and behavior of local governments under a “promotion tournament” system. Selective industrial policies with strong local discretion may distort factor allocation, as local officials tend to favor capital-intensive sectors with high measured growth [38] or those that imitate “star” industries, leading to policy herding, industrial convergence, and even misallocation [39,40,41]. These studies warn about coordination failures, redundant construction, and a “prisoner’s dilemma” of non-cooperative competition. And they implicitly suggest that more coordinated regional integration frameworks could help align local incentives and guide industrial upgrading in a more efficient way.
Despite these insights, several theoretical and empirical gaps remain. First, the literature still pays more attention to macro-level national policies or large urban agglomerations (e.g., Beijing–Tianjin–Hebei, the Yangtze River Delta, the Pearl River Delta), while the metropolitan area (MA) scale is often neglected. Second, although existing studies touch on local government incentives, selective policy risks, and coordination failures, they rarely analyze how a specific form of MA integration policy—as a meso-level institutional arrangement—reshapes government behavior and urban industrial structure jointly. Third, current evidence seldom addresses the new context in which MAs function as “industrial collaboration circles” along regionalized and localized global value chains, potentially with different mechanisms from traditional city-cluster integration.
Against this background, there is a clear need to examine whether and how MA integration policies influence urban industrial upgrading. By treating MA integration as a quasi-natural experiment, this study identifies its causal impact on industrial restructuring and explores the underlying transmission mechanisms. In doing so, it speaks directly to unresolved debates on local government incentives, selective industrial policy risks, and coordination failures. It provides evidence on whether coordinated planning and shared governance arrangements can effectively overcome the non-cooperative “race to the bottom” dynamics documented in the above-mentioned literature. Meanwhile, promoting the formation of modern regional industrial systems and the high-quality regional development in China.
3. Theoretical Mechanism and Research Hypotheses
Drawing on the practices of representative Chinese NMAs, we examine how government policies shape industrial upgrading in the process of MA integration policies’ implementation, following the logic of “integrated policies and measures → transmission channels → urban industrial upgrading”. As depicted in Figure 1, MA integration policies promote urban industrial upgrading through four distinct types of effects.
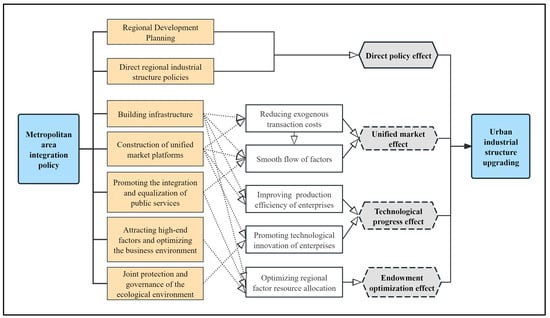
Figure 1.
Mechanism of how MA integration policies influence urban industrial structure upgrading.
3.1. Direct Policy Effects
Hypothesis H1:
Metropolitan area integration policies effectively promote the urban industrial structure upgrading.
The government directly intervenes in the regional industrial structure by formulating regional industrial development plans and industrial structure policies. Functional industrial policies can, to a certain extent, make up for market failures and reflect the positive role of an effective government [42]. The direct policy effects are reflected in the following two aspects.
First, government-led regional development plans shape the spatial distribution of industries. In China, MA development plans almost invariably incorporate regional industrial planning, which guides the spatial allocation of industries, specifies requirements for industrial restructuring, sets industrial transformation targets, and provides corresponding implementation mechanisms. The central objective is to construct a spatial configuration that both aligns with regional industrial development needs and enables a rational inter-city division of labor in production factors. In typical MAs, such plans call for industrial patterns characterized by differentiated specialization, cross-regional integration, and coordinated development of emerging and traditional manufacturing; they also emphasize the upgrading of producer services along value chains and the quality-oriented transformation of consumer services. At the same time, they commonly introduce supporting arrangements such as regularized inter-governmental consultations, policy coordination mechanisms, and dedicated organizational structures within the MA.
Second, directly formulating industrial structure policies to guide the upgrading of urban industries during the MA’s construction process. For instance, establishing industrial cooperation parks co-built by central and member cities, relocating traditional production capacities from central cities, and encouraging non-central cities to upgrade their introduced industrial functions, all of them can drive production toward high-value-added segments. For example, by the end of 2023, the “Agreement on the Co-construction of the Nanjing Metropolitan Area Industrial Chain Development Alliance” was signed. In addition, consciously selecting and encouraging the leading industries can lead industrial structure upgrading. In most publicly released “Metropolitan Area Development Plans” in China, nearly all member cities have listed a catalog of key industries for supporting and encouraging development, and the chosen leading industries are generally high-value-added sectors with broad market prospects and representing advanced technology. Meanwhile, when the government identifies leading industries and implements multiple measures to guide them, it also promotes the simultaneous growth of related industries, thus optimizing the industrial structure.
3.2. Indirect Policy Effects
In addition to policies that directly reshape the spatial distribution of industries, typical government interventions during MA integration—such as infrastructure investment, market unification initiatives, efforts to equalize regional public services, measures to attract high-quality production factors, improvements to the business environment, and ecological protection policies—indirectly influence urban industrial upgrading. These interventions give rise to three main types of indirect effects.
3.2.1. Unified Market Effect
Hypothesis H2:
Metropolitan area integration policies promote urban industrial structure upgrading through the unified market effect.
Metropolitan area integration is an institutional process that reduces spatial and administrative fragmentation between cities, strengthens inter-city economic linkages, and weakens market segmentation. Through planning, regulation, and policy coordination, governments provide stable signals to firms, guide expectations, and progressively align local rules and standards, thereby laying the foundation for a unified market [43]. From the perspective of urban and spatial economics, such integration changes the effective economic distance within the MA. Large-scale investment in different kinds of infrastructures, data platforms, and equaled public services compresses communication and coordination costs; while unified rules and interoperable systems reduce institutional frictions. This jointly lowers both iceberg-type trade costs for goods and services, and search and matching costs for factors. Enabling goods, labor, capital, technology, and data to move more freely across city boundaries. As factor flows become more orderly and markets more open within the MA, the formation of a unified regional market is accelerated.
A more unified market, further, reshapes the industrial structure of member cities. Freer factor mobility and improved connectivity facilitate diversified yet interconnected industrial agglomeration, including the co-location of related sectors and upstream–downstream firms. This generates Jacobs-type externalities through finer specialization, easier matching and search, and stronger knowledge spillovers. The vertical and horizontal extension of value chains within the MA fosters new industries and higher value-added activities, thereby promoting the rationalization and upgrading of the industrial structure in member cities.
3.2.2. Technological Progress Effect
Hypothesis H3:
Metropolitan area integration policies promote urban industrial structure upgrading through the technological progress effect.
First, under MA integration, improvements in the aforementioned infrastructures can significantly enhance the efficiency of logistics and information transmission, reduce transaction costs while increase enterprise productivity [44].
Second, the free flow of goods and services on the demand side will eliminate price discrimination in regional commodity market, stimulate greater market demand, and further promote the economies of scale on the supply side, improving production efficiency. At the same time, a more robust competitive environment will force supply-side enterprises to engage in technological innovation.
Third, during MA integration, technological innovation platforms, industry–university–research matchmaking activities, and the cultivation of a favorable business environment and distinctive innovation culture foster technological innovation and support the growth of high-tech start-ups. Governments typically promote the establishment of MA-wide technology transfer alliances, comprehensive technology trading markets, specialized technology property-rights exchanges, and intellectual property markets to advance the formation of a unified technology market. In many MAs, cross-regional digital platforms are developed to integrate innovation resources, value-chain information, and technology policy, enabling firms to identify and access needed innovation resources quickly and accurately.
Finally, China’s MAs are collaborating to manage and protect their regional ecological environments. These policies essentially encourage businesses in these industries to adopt cleaner, more environmentally friendly production technologies, boosting TFP and driving the green transformation of traditional manufacturing. For example, existing industries like steel and cement are undergoing ultra-low emission upgrades, encouraging manufacturers to achieve energy conservation and carbon reduction through clean production and the use of green building materials. Research supports that the Yangtze River Delta Region integrated development could advance technological progress [15].
How does technological advancement affect urban industrial structure upgrading? The simplified CD production function [45] can illustrate the principle. For the final product production industry j, the output at time t is
where A represents the technological progress. For any two industries j or k, their output or and their related shares in the total economy are directly correlated with technological progress A. Obviously, sectors with faster technological progress growth rates experience higher production efficiency and faster output growth, resulting in a higher share of total output and a more sophisticated industrial structure.
3.2.3. Endowment Optimization Effect
Hypothesis H4:
Metropolitan area integration policies promote urban industrial structure upgrading through endowment optimization effect.
MA integration policies can optimize regional factor endowments by formulating talent attraction measures directly, improving public service levels, building computing infrastructures, such as big data or cloud computing centers, enabling industries that intensively use such abundant factors to gain comparative advantages and shifting regional industrial structures towards a more sophisticated one.
First, MA integration constitutes an important mechanism for optimizing the spatial allocation of human capital within regions. In China’s MAs, development strategies increasingly emphasize the attraction and agglomeration of high-end production factors, particularly skilled labor, so as to provide sustained factor support for industrial upgrading. To this end, MA governments typically coordinate human resource information-sharing platforms and harmonize related service policies across jurisdictions, jointly design and implement talent recruitment programs, and promote the mutual recognition of vocational qualifications and standards. These institutional arrangements help to reduce labor mobility barriers within the metropolitan area and facilitate the more efficient matching of human capital with industrial demand.
At the same time, MA integration policies contribute to the equalization and upgrading of regional public services, thereby further enhancing the quality and configuration of human capital. Livability is a core precondition for the sustainable development of local industrial clusters, and integrated policy frameworks can expand the coverage and improve the efficiency of medical, educational, cultural, and leisure services. By enhancing residents’ life convenience and overall well-being, these policies make metropolitan areas more attractive to highly educated and high-skilled workers. The resulting equalization of public services not only improves the regional human resource structure, but also strengthens the metropolitan area’s capacity to retain and cultivate talent. Empirical evidence from the Yangtze River Delta metropolitan region shows that regional integration policies have significantly enhanced the inflow of scientific and technological personnel, thus confirming the positive effect of MA integration on the optimization of regional human capital allocation [16].
Third, in the era of artificial intelligence (AI), many technology-based firms must process massive volumes of data in real time. Robust computing infrastructure has therefore become essential for supporting advanced digital processing capabilities. MA provides an institutional and spatial platform for strengthening the cross-city allocation and sharing of computing resources. By 2022, several NMA cities—including Wuhu, Chongqing, Chengdu, Wuhan, and Xi’an—had already established large-scale intelligent computing centers or data-center clusters with substantial AI computing capacity. These facilities have been explicitly integrated into MA plans, functioning as shared digital infrastructure that underpins regional AI-related innovation and industrial upgrading.
Overall, according to the Factor Endowment Theory, when the supply of a factor becomes more abundant within a region, the price of goods that intensively utilize that factor decreases. This gives the region a comparative advantage in the production of those goods, and the proportion of those goods in the total output changes. Consequently, the influx of high-end factors, such as talent or data, into a region increases the proportion of high-value-added products in the region’s total output, thereby promoting the upgrading of urban industrial structure.
4. Methodology and Data Collection
4.1. Study Area
We focus on the seven national-level metropolitan areas approved by the end of 2022 (see Figure 2 for details). There are two reasons for selecting them up to the end of 2022. The first one is the limitation of data availability. Because some indicators related original data are updated slowly, data beyond 2023 cannot be obtained. The second one is that, the intensive wave of exogenous policy shocks—namely, the official approval announcements of new NMAs—was concentrated around 2021. Since 2022, the NDRC has largely ceased publicly announcing the establishment of NMAs through formal reply letters, and the process has shifted from a high-profile to a low-profile approach. Consequently, the policy effects are most clearly identifiable for these seven NMAs.
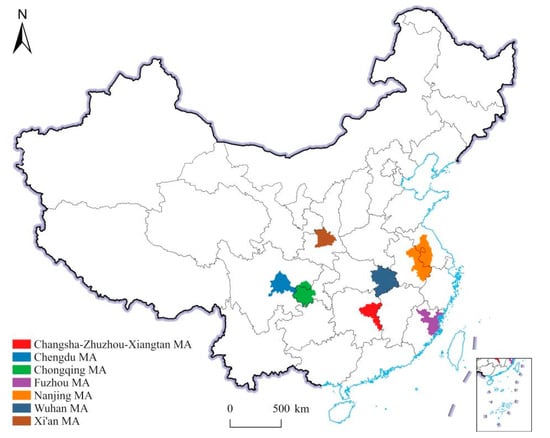
Figure 2.
Geographical diagrams of seven national-level metropolitan areas.
An overview of the regional development of the seven NMAs is shown in Table 1. Overall, in 2022, the economic output of the seven MAs accounted for 15.2% of China’s total GDP, and their population comprised 12.08% of China’s total population. A comparison of them reveals that Nanjing MA has the largest planned area, while Changsha–Zhuzhou–Xiangtan MA has the smallest. These two areas ranked first and second in per capita income. Furthermore, Nanjing MA had the largest economic output, with a regional GDP of approximately 688,646 million USD in 2022. Chongqing MA was second, while Xi’an MA ranks last.

Table 1.
Basic regional development situation of the seven national-level metropolitan areas (NMAs).
4.2. Methodology
To identify the impact of MA integration policies on urban industrial structure upgrading, we adopt a difference-in-differences (DID) approach [46], which is widely used to evaluate policy interventions in observational settings. This framework allows us to compare the changes in outcomes between treated and control cities before and after the implementation of MA integration policies.
The application of the DID model in this study is grounded in both the institutional features of MA integration policies in China and a series of statistical verification procedures. First, the policies are typically designed and approved by central or provincial governments. The timing of approval, geographic scope, and main policy instruments are determined from a “top-level design” perspective, according to national and regional development strategies rather than the short-term industrial structure needs of individual cities. From the viewpoint of a single city, this top-down process provides a degree of exogeneity in the policy shock. Second, the implementation of these policies is staggered and selective. Some cities enter the first batch of nationally approved MAs, while other, otherwise comparable cities do not receive approval at the same time. This staggered adoption generates a clear treatment group (member cities within approved MAs) and control group (non-member but comparable cities), which is precisely the structure required for DID identification. Third, prior to policy implementation, by including year-fixed effects to absorb nationwide shocks and city-fixed effects to control for time-invariant city characteristics, all cities operate within the same national macroeconomic environment.
On this basis, the approval of MA integration plans is treated as an external policy shock that forms a quasi-natural experiment. Conditional on certain controls, the remaining differential evolution in urban industrial upgrading between treated and control cities can be reasonably attributed to MA integration policies under the parallel trends assumption.
4.2.1. Staggered DID Model
Considering that the release time of important policies in various MAs in China varies, the time points at which the experimental groups receive treatment are inconsistent. The model setting adopts the staggered difference-in-difference (Staggered DID) principle. However, we acknowledge that the assignment of MA integration policies is not absolutely strict exogeneity: cities with stronger economic foundations, more urgent upgrading needs, and higher governance capacity are more likely to be selected as national-level MAs. This non-random selection may threaten the strict exogeneity assumption of the DID framework. To mitigate these concerns, we adopt the staggered DID specification with city-fixed effects, year-fixed effects, and a set of time-varying city-level controls, Zit, to absorb unobserved, time-invariant heterogeneity and common shocks. In addition, to assess the validity of the DID design, we will conduct a series of diagnostic tests and robustness checks, such as formal parallel trend tests and sensitivity analyses in Section 5. This proves treated and control cities exhibiting similar pre-policy trajectories and robust post-policy dynamics. The benchmark estimation model is as the follows:
where is the industrial structure upgrading index (high-level index) of city i in period t; is the treatment status of city i in period t, which takes the value of 1 if the city is a member of a NMA in period t, and 0 otherwise; is a series of control variables, which are some control characteristics of city i in period t; and are the control year- and city-fixed effects, respectively; is the random error term; and is the net effect of the MA integration policy on the city’s industrial structure. Our study targets all cities in China at or above the prefecture-level, with the treatment group defined by official approval from the NDRC.
4.2.2. Mechanism Testing Model
In the context of this study, we have previously explained the direct impact of the MA integration policy (D) on the outcome variable (Y), and the impact of three intermediary mechanism channels “unified market effect (M1), technological progress effect (M2), and endowment optimization effect (M3)” on the industrial structure upgrading Y (sophistication). Therefore, after completing the regression and robustness tests of the benchmark model (Equation (1)), the mechanism test focuses on the impact of the MA integration policy D on the channel variable Mk [47]. The specific model is as follows:
In Equation (2), represents the three indirect channel variables, k = 1, 2, and 3 represent the unified market effect, technological progress effect, and endowment optimization effect, respectively. is measured by three sub-variables that reflect the market integration level (See Table 2 for details). represents the technological progress effect and is expressed as the number of patents granted per capita of the sample cities, detailed in Table 2 below. represents endowment optimization effect expressed as the logarithm of the number of college students per 10,000 people in each city per year. is a series of control variables, which are the relevant control characteristics of city i in period t. In addition, when testing , the innovation capacity of each city was controlled by lninnova as a covariate variable. Other variables are similar to those in Equation (1).
Table 2.
Overview of mechanism variables.
4.2.3. Parallel Trend Test Model
Before using the DID model to estimate policy effectiveness, we have to conduct a parallel trend test on the treatment group and the control group to verify that the dependent variables of the two groups have the same trend before the policy events impact. Based on the principle of event study methodology and referencing the commonly used pre-event parallel trend test equation adopted by scholars, the empirical testing of the following model’s coefficients can clarify whether the samples of the two groups satisfy the parallel trend assumption:
In Equation (3), is the group variable, is the time dummy variable for period s, and and represent the differences between the treatment and control groups relative to the baseline in period s before and after the treatment occurs, respectively. If the pre-treatment parallel trends assumption is satisfied, it implies that the estimates of should be insignificant, and then the corresponding null hypothesis that the pre-treatment coefficients are zero cannot be rejected.
4.3. Variable Selection and Data Collection
4.3.1. Variable Selection
Dependent Variables
Previous research literature generally uses the proportion of non-agricultural output value as a measurement index of industrial structure upgrading based on Clark’s classification method (also known as the tertiary industry classification method). For example, taking the ratio of the output value of the tertiary industry to the output value of the secondary industry as an indicator to measure the industrial structure upgrading [48]. Based on Clark’s law, and drawing on the construction ideas of industrial structure hierarchy coefficients commonly used in academia [20,49], two methods are used to calculate the industrial upgrading indicator (high-level index) SHi of city i in a specific period t:
In Equation (4), represents the ratio of the output value of the tertiary industry to the output value of the secondary industry of city i.
In Equation (5), wij represents the proportion of the output value of industry j in the total output value of the city i in the period; since wij is a percentage value, we multiply it by 100 in the Equation to remove the percentage sign, highlight the sequence characteristics, and facilitate further regression. In addition, to ensure the validity and explanatory power of the above measurement indicators, we conducted a correlation analysis between and two kinds of industrial complexity indicators. The partial correlation coefficients are about 0.4 for both, indicating that can represent the industrial complexity as well as industrial structure upgrading (see Appendix A Table A1 for details).
The index and innovation capability index innova of sample cities in 2022 (excluding a few extreme values, e.g., Beijing, Shanghai, and Shenzhen) are shown in Figure 3. These outliers reflect genuine structural differences rather than data errors. As shown in Figure 3, most city observations cluster near the horizontal axis, indicating relatively modest changes in the innovation capacity index. A few outlying points are located well above the main cluster, whose innovation index are above 500; these correspond mainly to first- and second-tier cities in developed regions that already possess highly developed service sectors and advanced manufacturing bases, such as Suzhou, Guangzhou, Xi’an, Wuhan, Nanjing, and Chengdu. As can be seen, these deviation points include both NMA cities (pink points) and non-NMA cities (blue points), with the treatment group and control group evenly distributed.
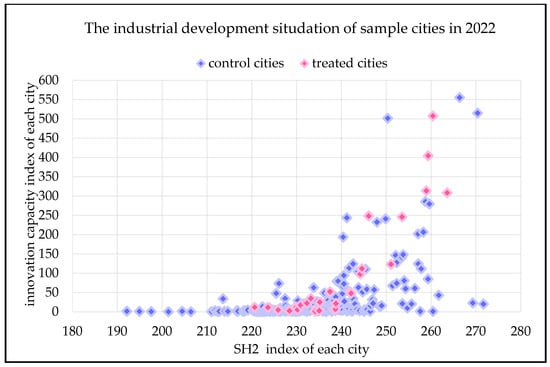
Figure 3.
The industrial development situation of sample cities in 2022.
Independent Variables
Here are some notes on the core variable DIDit. For one reason, in China, local governments typically begin substantive preparatory work before formally submitting their MA plans to the NDRC and often receive advance informal notice of approval through internal channels, generating a time lag between de facto implementation and official approval. In addition, Chinese local government budgets are generally prepared one year in advance, and special-purpose bond quotas for major projects, as well as feasibility studies and environmental impact assessments, are likewise concentrated in the preceding year. For these two reasons, we define the policy implementation year as the previous year for MAs approved in the first half of a given year, and as the approval year itself for MAs approved in the second half.
Therefore, the policy shock time for the Nanjing and Fuzhou MAs is 2020, while for the Chengdu, Changsha–Zhuzhou–Xiangtan, Xi’an, and Chongqing MAs are 2021. Although the Wuhan MA’s approval was announced in the second half of 2022, the Wuhan MA Integration Development Joint Conference was actually established and inaugurated in September 2021. So, Wuhan’s policy timeline is set for 2021. The rationality of time settings will be confirmed in the following subsequent parallel trend test and parallel trend sensitivity test in Section 5. In summary, the policy shock for Nanjing and Fuzhou occurred in 2020, while the shock for the other 5 MAs occurred in the year 2021. Each MA member’s DIDit is set to 1 for the policy shock on or after the shock, and 0 otherwise. The remaining cities that are not affected by the policy shock during the same period serve as a control group.
Next, a note about the control variables . In order to meet the conditional independence assumption (CIA) of the DID model, as shown in Table 3, the control variable , which affects both the sample cities joining the metropolitan area and the changes in industrial structure, are determined from the two aspects of supply and demand. Similarly, the reasonableness of the control variables will be confirmed in the balance test in Section 5.
Table 3.
Calculation method of control variable .
4.3.2. Sample Selection and Data Collection
Sample Selection
The seven MAs mentioned above are included in the treatment group sample, while the remaining Chinese prefecture-level cities serve as the control group. According to data from the National Bureau of Statistics of China, as of 2024, China has a total of 293 prefecture-level cities and 4 municipalities, for a total of 297 cities. Due to data availability and administrative level changes, 6 cities in Tibet province, 2 cities in Qinghai, 1 city in Ningxia, 1 city in Shandong, and 2 cities in Xinjiang Area, forming a total of 12 cities, will be excluded.
In cases where the MA planning scope only includes some counties or districts or parts of a city, rather than the entire city, the following approach is adopted. If the total GDP of counties or districts accounts for more than half of the total GDP of the prefecture-level city that they belong to, the entire city is added in the treatment group (MA). If only a few districts or counties of a city are included in the MA plan, and their economic scale accounts for a very low ratio of the city’s GDP, the city is excluded and neither serves as the control nor the treatment group. This is to avoid interfering with the accuracy of the control group. In this way, there are 4 such discarded cities: Nanping in Fujian, Tongchuan and Weinan in Shanxi, and Changzhou in Jiangsu. Thus, 281 Chinese cities at the prefecture level and above are selected for the study.
Time Window Selection
Since 2012 marked the onset of a “new normal situation” in China’s economic development, characterized by profound changes in the growth model and substantial structural adjustment, we take 2012 as the starting year for this study. Resulting in a panel data of “11 years × 281 cities”, a total of 3091 samples over 11 years is reasonable to capture meaningful upgrading dynamics.
Data Collection
(1) The original data are mainly from the corresponding years of the “China Urban Statistical Yearbook” from 2013 to 2023, with some missing values supplemented by interpolation. (2) Since the yearbook no longer includes indicators such as “actual utilization of foreign capital” after 2020, data for these indicators of the 2020 to 2022 years are manually collected and compiled by the author. The FDI data comes from the statistical yearbook of the city itself. (3) The data used for the mechanism analysis also draw on several additional sources. The unified market index (market_inte) is constructed using the relative price method [50], a commonly employed approach to measuring market integration based on the iceberg trade cost framework. The underlying data are consumer price indices for seven categories of goods—food; tea and beverages; tobacco and alcohol; clothing; housing; transportation and communication; and education, culture, and entertainment—obtained from the statistical yearbooks of the respective cities for the relevant years. (4) The other is the innovation capability index innova in mechanism testing, sourcing from “FIND Report on City and Industrial Innovation in China” [51]. Since a city’s innovation capability is relatively stable over time, and “innova” is a control variable, its 2022 data are estimated by the moving average method.
5. Regression Results
5.1. Balance Test
Following Gentzkow (2006) [52] and Li et al. (2016) [53], we examine the changes in the differences between metropolitan cities and non-metropolitan cities after adding control variables in Table 3. The balance test results for each variable are shown in Table A2.
Firstly, we select cross-sectional data of 2012, the beginning of the window period, to analyze statistical characteristics of the two groups of cities. Columns (1) and (2) in Table A2 are the means of each variable or indicator for the two groups. Columns (1) and (2) reveals that, on average, MA member cities outperformed non-MA cities in five aspects: population density (lnpop), per capita income (lngdppc), foreign direct investment (lnfdi), traffic, and transportation condition (lntrans); meanwhile, the comparison of lngovfin shows that the fiscal deficit scale of MA governments is smaller than that of non-MA cities, indicating members’ relatively healthier government fiscal situation. Cities within MAs are more likely to be the economically developed cities in their respective provinces and are more likely to actively participate in regional coordinated development policies. So, it is necessary to control the series variables.
Furthermore, we choose consumer market size and population mobility to represent urban differences. As can be seen in Table A2, in 2012, the mean of the consumer market size index for MA cities was 6.47, and the mean logarithmic population mobility rate was 3.32, both higher than those for non-MA cities. The unconditional difference results in column (3) also show that there are indeed differences between the two groups of cities in the two urban characteristics. After controlling for , the conditional difference estimation results in column (4) show that there are no longer differences between the two groups of cities in the two characteristics. It is evident that before controlling for member cities, there are significant differences between MA cities and non-MA cities in both two indicators; after adding as control variables, the two urban characteristics no longer show significant differences between the two groups (as shown in column (4)). Therefore, the paper, by selecting appropriate base period characteristic control variables , makes the treatment and control groups more balanced in terms of economic characteristics, which provides support for subsequent empirical analysis.
5.2. Descriptive Statistical Analysis
Table 4 below shows descriptive statistics of the independent and dependent variables. The mean values of the high-level index SH1 and SH2 for the 3091 samples are 1.11 and 231.51, respectively. For SH2, the minimum value of the high-level index is 183.12 in Heihe City, Heilongjiang Province, in 2012, and the maximum one is 283.59 in Beijing, the capital of China, in 2022. For the independent variables, taking lnpop as an example, the minimum lnpop value 1.628 is obtained in Jiuquan City, Gansu Province, in 2012, and the maximum value 8.1 is obtained in Shenzhen City, Guangdong Province, in 2022.
Table 4.
Descriptive statistics of variables.
5.3. Benchmark Regression
The staggered DID model of the impact of China’s MA integration policies on urban industrial structure upgrading, that is, the estimation results of Equation (1) are shown in Table 5. From a national perspective, even if different measurement methods are used, whether it is SH1 or SH2 high-level index, the impact of the exogenous policy shock of MA integration policies on the industrial structure upgrading of MA member cities is significantly positive at the 1% level, and the R2 value is above 0.9. Column (2) shows that the high-level degree of industrial structure of metropolitan area member cities is about 2.43 percentage points higher than that of non-MA cities. In addition, by using “entrepreneurial activity (lnenter_act)” as a substitute dependent variable (outcome variable), which indicates industrial vitality and innovation, column (3) shows that entrepreneurial activity in cities within MAs is 8.28% higher than that in non-MA cities.
Table 5.
Benchmark regression results.
Although the estimated effect of 2.43 may appear small in magnitude, it has clear economic significance for two main reasons. First, the standard deviation of the 3091 observations over the 11-year period is 14.187. On this basis, 2.43 amounts to nearly one-fifth of a standard deviation, implying a nontrivial impact both statistically and economically. Second, SH2 is a structural, weighted indicator with low elasticity and strong inertia, and is therefore inherently less volatile. Even changes at the second decimal place typically reflect several years of cumulative structural adjustment. Structural indicators are “sticky” and difficult to alter in the short run: the shares of the primary, secondary, and tertiary sectors are constrained by existing industrial capacity, capital accumulation, and labor allocation. Unlike GDP growth, SH2 behaves more like a “physical” measure, where even a small shift signals a meaningful reallocation of resources. Moreover, for any given city, a one-percentage-point increase is quite demanding. Once a city’s industrial structure has reached a relatively advanced level of servicification, further improvements require substantial net expansion in high-end services, advanced manufacturing, R&D activities, and headquarters-based functions.
These jointly prove the Hypothesis H1: Metropolitan area integration policies promote the urban industrial structure upgrading.
5.4. Robustness Checks of the Model
5.4.1. Parallel Trend Test Result
The specific estimation coefficients of Equation (3) are shown in Figure 4, where the coefficients of the variables almost equal zero before the treatment, and the current or the post coefficient are not zero, significantly. Meanwhile, by conducting a parallel trend test for the dependent variable , the estimated F-value also shows that the null hypothesis that the pre-treatment coefficients are jointly zero cannot be rejected, indicating that the parallel trend assumption is satisfied.
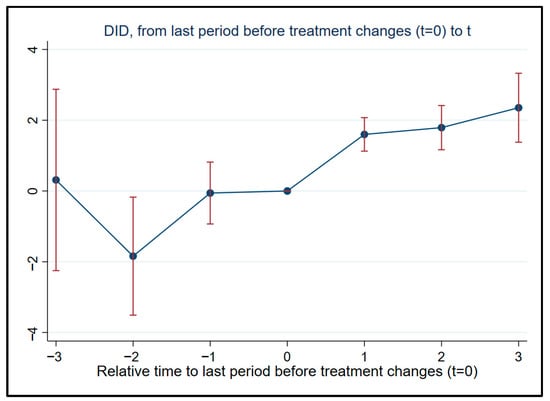
Figure 4.
Parallel trend test results.
5.4.2. Parallel Trend Sensitivity Analysis
It has become common practice to assess the plausibility of the parallel trend assumption by testing for pre-treatment differences in trends (“pre-trends”). Although pre-trend tests are intuitive, recent research has shown that they may suffer from low power. Rambachan and Roth (2023) [54] propose a method to examine the impact of the degree of violation of the parallel trend hypothesis on the event study point and confidence interval. To test the “parallel trend hypothesis”, we should conduct both a “pre-trend test” and a “post common shock test”. Section 5.4.1 has already completed the former, and we should go on conducting a parallel trend sensitivity test to verify the post-treatment parallel trend by adopting this method. By using the concept of relative deviation, sensitivity analyses on the current period 0-year lag, 1-year lag, and 1- and 2-year lags’ average are conducted.
The results of treatment effect are shown in Figure 5 and Figure A1, respectively. In Figure 5a: the leftmost “original” (red vertical line) on the horizontal axis represents the average treatment effect of CSDID (will be fully explained in subsequent robustness tests); the blue lines that follow represent the confidence intervals of the current treatment effect when the parallel trend deviates by 0.01, 0.06, 0.11, and 0.16 times, respectively. From Figure 5a, we can see that even if the parallel trend after treatment deviates by about 0.11 times, the MA policies still have a significantly positive effect on urban industrial structure upgrading at the 95% confidence interval. Similarly, in Figure 5b, the blue line indicates that when the parallel trend deviates by 0.015 times, the average treatment effect over the two periods after treatment is still significantly positive. The parallel trend sensitivity test is passed.
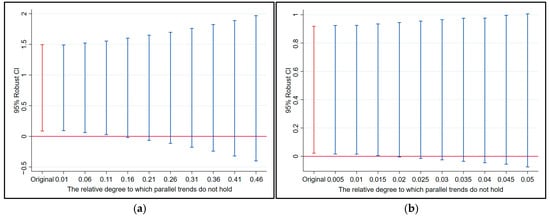
Figure 5.
(a) Result of parallel trend sensitivity analysis for current period (t = 0). (b) Result of parallel trend sensitivity analysis for average treatment effect in post-event 1-year (t = 1) and 2-year lag (t = 2).
5.4.3. Robustness Checks
Heterogeneity Treatment Effect Test
Traditional staggered DID estimation can be taken as a weighted average of multiple treatment effects, where the weights may be negative. However, negative weights can lead to a discrepancy between the average treatment effect and the actual one, resulting in biased estimation. A multi-period dual robust estimator “Callaway and Sant Difference-in-Differences” (CSDID) has been proposed [55]. The core idea of the CSDID method is to divide the sample into different subgroups, estimate the treatment effect of each subgroup separately, and then calculate the average treatment effect (ATT) of different subgroups by using a specific strategy. This method helps to avoid the problem of traditional DID estimation bias.
We employ CSDID as a strategy to enhance the robustness of the results and address concerns about potential bias in the two-way fixed effects estimation (TWFE). The CSDID estimation results for SH2 are as follows: Simple ATT is 0.883, dynamic ATT is 0.934, calendar-time ATT is 0.789, and group ATT is 0.902. All four methods yielding ATTs are significant at the 1% level. The relative results are shown in Figure 6. Similar results are obtained when SH2 is replaced with lnenter_act. This demonstrates the robustness of the above benchmark regression conclusions.
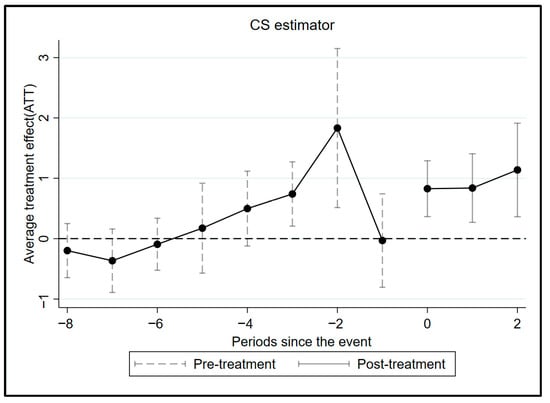
Figure 6.
Result of CSDID estimation.
Placebo Test
Based on the principle of falsification, and using the placebo test method, we further investigate whether the baseline estimation model is confounded by omitted variables or unobservable factors. Using Stata 17 software simulation, individuals are randomly sampled from the sample without replacement to form a “pseudo-treatment group” sample of the same number. Staggered DID estimation is performed, and this process is repeated 500 times. The distribution of the estimated placebo effect coefficients is shown in Figure 7: the baseline regression result of the variable SH2, 2.4285, is an extreme value in the density distribution plot, with a p-value less than 0.01 (see the position of red solid line). The null hypothesis that the treatment effect is zero in the baseline regression is rejected. In addition, by randomly varying the treatment group and using spurious policy shock times to estimate the spurious regression coefficients, the result of probability density distribution is similar. The benchmark regression is robust.
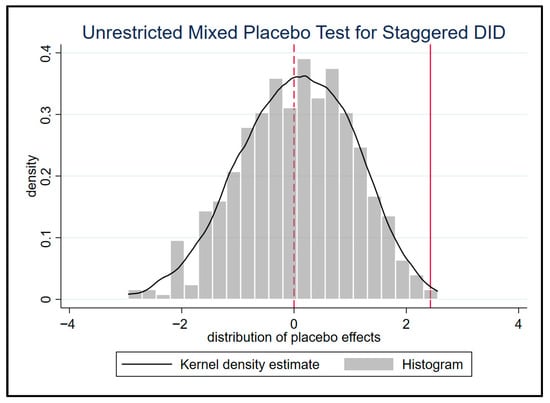
Figure 7.
Spatial placebo test results.
PSM-DID Test
We employ propensity score matching (PSM) to preprocess and match the data, enabling the construction of a well-defined control group and ensuring that the treatment and control groups are comparable in terms of their initial endowments and macroeconomic environment. Thus, ensuring the parallel trend assumption of the DID model holds true as much as possible.
After matching, 759 samples are off-support, 2332 samples are on-support, and the relative probability density distribution can be seen in Figure 8. Using the 2332 on-support samples to estimate Equation (1), the results are as follows: 1.7324 of SH2 (significant at the 1% level), with an R2 value of 0.9578, and 0.053 of SH1 (significant at the 5% level). They are consistent with the benchmark regression results, indicating a relative robustness.

Figure 8.
Probability density distribution after matching.
Truncation Test
To prevent extreme values from interfering with the benchmark estimate, we perform a 5% truncation of the explained variable SH2. By removing samples with extremely small values below the 5th percentile and samples with extremely large values above the 95th percentile, the remaining samples are used to re-estimate Equation (1), resulting in an estimated value of 2.3693 (significant at the 1% level). The truncation results are similar to the benchmark regression, also demonstrating the robustness of the original estimation.
Controlling Time-Trend Term
Finally, we control for the time-trend term in the original model (Equation (1)) to see if the estimated results change, thus eliminating the influence of natural objective time trends on the estimated net policy effect. This eliminates the influence of time trends on the industrial structure upgrading effect of the MA integration policies in member cities. After controlling for the time-trend term, the re-estimated result is 2.3531 (significant at the 1% level), with an R2 of 0.9482, consistent with the baseline estimation.
5.5. Mechanism Test Results
The empirical results of the mechanism (H2-H4) test are shown in Table 6. We should note that mechanism analysis only reflects the association between variables, not the causal relationship. The results show that the MA integration policy promotes industrial structure upgrading through the effects of unified market, technology progress, and endowment optimization. The specific results are as follows:
Table 6.
Mechanism test results of .
(1) Unified market effect . The columns of Table 6 shows that the regression coefficients of the market_inte, lnpflow, and lninfra variables are all positive and pass the significance test. This reveals that the MA integration policies have a positive impact on the upgrading of the industrial structure of member cities through channel . In detail, the policies can reduce transaction costs by promoting factor mobility (lnpflow) as well as infrastructure connectivity (lninfra), and improving the unification level of regional market (market_inte).
(2) Technological progress effect . Table 7 presents the estimation results of the policies’ effect on promoting technological progress. In columns (2), (3), (5), and (6), the footnotes 1 and 2 indicate invention patents and utility model patents, respectively. Controlling for innovation capacity (lninnova), all estimated coefficients are significantly positive at the 1% level, indicating that the MA integration policies significantly promote technological progress for MA cities.
Table 7.
Mechanism test results of .
However, two points are noteworthy. First, the coefficient for green patents (0.6069, column 4) is significantly lower than the coefficient for total patents (3.9205, column 1). Second, no matter at both the total patent or green patent aspects, the regression coefficient for invention patents is smaller than that for utility models: the value in column 2 (1.4884) is much smaller than that in column 3 (4.5669); the comparison results in columns 5 and 6 are similar. These two points reveal that the MA integration policies have a limited effect on technological progress in member cities, and they may only promote general technological advancement, rather than cutting-edge technology.
(3) Endowment optimization effect . The lnhc variable’s coefficient is 0.1315, positive at the 5% significant level. This indicates that the implementation of MA integration policies can attract an influx of high-quality labor. It can be proved that endowment optimization is an effective way for MA integration policies to influence the urban industrial structure upgrading.
6. Discussion
This section interprets the main empirical findings in light of the existing literature, draws out their practical and policy implications, and then outlines the study’s limitations and directions for future research.
6.1. Comparison with Existing Literature and Mechanism Insights
The results show that, relative to non-MA cities, the level of industrial sophistication in MA member cities increases by about 2.43 percentage points following MA integration policies. This provides quantitative evidence that MA integration polices can meaningfully accelerate industrial upgrading within a relatively short time frame. Such findings are broadly consistent with prior studies emphasizing the role of regional integration in facilitating structural transformation through larger markets, improved factor mobility, and enhanced knowledge diffusion in both developed and developing contexts [13,14,18,19,23,24,25,27,32,33,34,35]. At the same time, by focusing on China’s newly established national-level MAs and their “industrial collaboration circles” feature, this study extends the literature by examining a more formalized and institutionally dense type of metropolitan integration.
Beyond the average treatment effect, the mechanism analysis indicates that MA integration policies promote industrial upgrading primarily by fostering a more unified regional market, advancing technological progress in a broad sense, and optimizing factor endowments. These channels resonate with existing work on regional industrial policies [36,37]. However, our study underscores that these channels are actively shaped by coordinated governmental action at the metropolitan scale. In this regard, the evidence highlights the important role of a capable and coordinated government in urban and regional industrial governance.
At the same time, the findings reveal an important nuance: while MA integration policies are effective in promoting “broad” technological progress, their impact on frontier technological upgrading in member cities remains modest. This pattern aligns with concerns in the innovation policy literature that large-scale regional coordination efforts often prioritize infrastructure connectivity, factor mobility, and general industrial collaboration, while providing comparatively weaker, less stable, and less targeted support for high-risk, long-horizon R&D [38,39,40,41]. In addition, substantial differences in research capacity, industrial structure, and fiscal strength among cities within the same MA can hinder the formation of robust collective mechanisms for supporting frontier innovation. Taken together, the results suggest that MA integration, in its current institutional form, is better at facilitating incremental, diffusion- and transformation-type upgrading than at catalyzing breakthroughs at the frontier technological fields.
6.2. Practical and Policy Implications
The empirical results have several implications for the design and implementation of MA integration policies. First, the fact that market integration, broad-based technological progress, and factor endowment optimization emerge as central mechanisms implies that these dimensions should be treated as core objectives in MA policy frameworks. In practical terms, this calls for further dismantling administrative and market segmentations between cities and provinces, improving the interoperability of regulatory systems, and deepening the integration of labor, capital, and other key factor markets within MAs.
Second, the organizational role of MAs as platforms for industrial cooperation and functional specialization should be further utilized. Beyond formal designation, MAs can be used to coordinate the division of labor along industrial chains, the spatial layout of key functional platforms, and the siting of major industrial projects, so as to facilitate the orderly agglomeration and diffusion of high-end manufacturing and modern services within metropolitan regions. This is particularly important in China’s central and western regions and in small or medium-sized urban agglomerations, where selectively fostering a number of MAs with strong diffusion and driving capacities can be an important instrument for promoting coordinated regional development and enhancing these regions’ positions within national value chains.
Third, the limited impact of current MA policies on frontier technologies suggests the need for more targeted arrangements to support high-end innovation. Policymakers in MAs should promote the development of integrated innovation communities built around cross-regional joint laboratories, collaborative innovation centers, and shared industrial technology institutes. Stronger inter-city arrangements for cost- and benefit-sharing are needed, together with more coherent rules for intellectual property protection and technology transfer. In addition, differentiated tax incentives, talent policies, and financial instruments can be designed to guide innovation resources to cluster and circulate more efficiently within MAs, thereby providing more effective support for frontier technologies. Nevertheless, the role of policy in this regard should be understood primarily as enabling and coordinating, rather than directly determining specific technological trajectories. Breakthroughs in frontier technologies ultimately depend on the endogenous innovation incentives of firms and research institutions.
6.3. Limitations and Future Research
Building on the above findings, this study still has several limitations, which also suggest directions for future research.
First, the post-treatment observation window is relatively short. In terms of data structure, the post-treatment period is relatively short, which may not allow sufficient time for industrial structure upgrading to fully materialize. As time passes, the post-treatment window will gradually extend, and newly released data can be used to track and reassess the dynamic impacts of MA integration policies.
Second, the measurement of the outcome variable remains relatively coarse. The construction of the outcome variable yit is somewhat crude. Due to data availability constraints, the study relies on a three-sector classification, which is not sufficiently detailed and limits the economic interpretability of the SH index series. Future research should adopt more disaggregated industrial classification schemes and develop more refined SH-type indicators to capture industrial upgrading at a deeper level.
Third, concerns about policy endogeneity cannot be fully eliminated. As a regional policy instrument, MA integration is not exogenously or randomly assigned. Instead, it is closely linked to local governments’ development strategies, cities’ economic foundations, existing industrial structures, and prior growth paths. Cities with stronger economic bases, more urgent upgrading pressures, and greater governance capacity are more likely to be included in early batches of MA approvals, which may introduce selection bias. This study mitigates endogeneity concerns by incorporating city-fixed effects, year-fixed effects, and a range of city-level control variables, as well as by conducting multiple robustness checks. Nevertheless, the possibility of “selective establishment” of MAs cannot be completely ruled out. Future research should make better use of differentiated pilot designs, exploit more granular policy thresholds, or apply stronger exogenous instrumental variables to improve identification of the quasi-causal effects of MA integration policies.
Fourth, externalities and spatial spillovers are not explicitly examined. The analysis focuses on how MA integration policies affect industrial upgrading within member cities, but it does not directly assess the implications for neighboring non-member cities. In principle, integration policies may generate positive spillovers by enlarging regional markets, accelerating technology diffusion, and facilitating factor mobility, potentially inducing passive or follow-up upgrading in adjacent areas. At the same time, a “siphoning effect” cannot be ruled out: high-end factors and high-quality industries may become more concentrated within MAs, thereby compressing the upgrading space of neighboring non-member cities. Future research should investigate these heterogeneous spillover mechanisms across different types of MAs and city tiers, ideally at a more refined spatial scale. Linking city-level analyses with firm- or plant-level data would also help to evaluate more comprehensively the distributional and welfare consequences of MA integration policies, including their effects on regional equity and overall efficiency.
Finally, despite efforts to explore potential mechanisms, the current design of mechanism variables remains somewhat limited. In particular, the measurement of endowment optimization relies mainly on human capital resource-related indicators, which just capture one important channel highlighted in the existing literature. Other relevant dimensions, such as capital and data resource supplies, are not explicitly modeled due to data constraints. Future research should incorporate a richer set of mechanism variables to provide a more comprehensive test of the theoretical framework.
7. Conclusions
This study makes an innovative contribution by taking China’s newly established national-level metropolitan areas (NMAs)—which began to emerge around 2021 and have since expanded rapidly—as the empirical setting. Exploiting the new institutional feature of “industrial collaboration circles”, we treat MA integration as a quasi-natural experiment and employ a staggered DID framework to estimate the impact of MA integration policies on industrial upgrading in 281 prefecture-level cities. The empirical analysis confirms that MA integration policies significantly enhance industrial sophistication in member cities, thereby enriching the theoretical understanding of regional governance in large developing economies.
The findings can be summarized in three main points. First, MA integration policies lead to a substantial improvement in the industrial sophistication of member cities, with an average increase of about 2.43 percentage points relative to non-MA cities. Second, the analysis suggests that this upgrading effect operates mainly through three channels: the creation of a more unified regional market, the promotion of broad-based technological progress, and the optimization of factor endowments. Third, while MA integration policies are generally effective in promoting structural upgrading, current policy frameworks still provide only limited support for frontier technological innovation.
Overall, the results imply that MA integration policies can serve as an important institutional vehicle for coordinated regional development and urban industrial upgrading, provided that they continue to reduce market segmentation, facilitate technology diffusion, and optimize the allocation structure of high-end production factors, while paying greater attention to sustained and targeted support for frontier innovation.
Author Contributions
Conceptualization, J.D.; methodology, K.L.; software, K.L.; validation, J.D. and K.L.; formal analysis, K.L.; investigation, J.D.; resources, J.D.; data curation, K.L.; writing—original draft preparation, K.L.; writing—review and editing, J.D.; visualization, K.L.; supervision, K.L.; project administration, K.L.; funding acquisition, K.L. All authors have read and agreed to the published version of the manuscript.
Funding
This research is funded by Philosophy and Social Sciences Research Projects in Universities of Jiangsu Province, grant number “2022SJYB2177”. Kan Liu is the Project Leader.
Data Availability Statement
The raw data supporting the conclusions of this article will be made available by the authors on request.
Acknowledgments
We sincerely thank the anonymous reviewers and the editors of this journal for their valuable feedback on improving this study. The authors have reviewed and edited the output and take full responsibility for the content of this publication.
Conflicts of Interest
The authors declare no conflicts of interest.
Appendix A
Table A1.
Partial correlation analysis of SH2 and two urban industrial complexity indicators.
Table A1.
Partial correlation analysis of SH2 and two urban industrial complexity indicators.
| Variable | Partial Corr. | Semipartial Corr. | Significance Value |
|---|---|---|---|
| innova | 0.4130 | 0.3841 | 0.0000 |
| enter_act | 0.3395 | 0.3058 | 0.0000 |
In Table A1, “innova” represents urban innovation capability, and the data source has been explained in Part 2 of Section 4.3.2. The “enter_act” is an indicator of entrepreneurial activity, calculated by the proportion of newly registered enterprises to the resident population in a certain year.
Table A2.
Balance test results of control variables .
Table A2.
Balance test results of control variables .
| Variables and Indicators in 2012 | Treatment Group | Control Group | Unconditional Difference | Conditional Difference |
|---|---|---|---|---|
| (1) | (2) | (3) | (4) | |
| lnpop | 6.3119 | 5.6727 | 0.639 *** | |
| [0.3837] | [0.9342] | (3.58) | ||
| lngdppc | 10.6524 | 10.4926 | 0.160 | |
| [0.4349] | [0.5688] | (1.44) | ||
| lnfdi | 1.7882 | 0.6319 | 1.156 *** | |
| [1.6055] | [2.1364] | (2.78) | ||
| lngovfin | 0.644 | 0.846 | −0.202 ** | |
| [0.4327] | [0.5212] | (−1.98) | ||
| lntrans | 9.4515 | 8.8695 | 0.582 *** | |
| [0.8853] | [0.9816] | (3.00) | ||
| lnmarket | 9.5423 | 9.3529 | 0.189 | |
| [0.6272] | [0.7083] | (1.36) | ||
| govtec | 0.0194 | 0.0143 | 0.005 ** | |
| [0.0144] | [0.0115] | (2.17) | ||
| Total retail sales of consumer goods of the city, logarithm | 6.467 | 6.0032 | 0.464 ** | −0.0272 |
| [0.969] | [0.985] | (2.37) | (0.0720) | |
| Highway passenger volume/registered population, logarithm | 3.3165 | 3.0089 | 0.308 * | 0.0272 |
| [0.4496] | [0.8425] | (1.90) | (0.0720) |
The square brackets report the standard deviation; the parentheses report the standard error; *** p < 0.01, ** p < 0.05, * p < 0.1.

Figure A1.
Result of parallel trend sensitivity analysis for post-event 1-year lag (t = 1).
References
- Wade, R. After the Crisis: Industrial policy and the developmental state in low-income countries. Glob. Policy 2010, 1, 150–161. [Google Scholar] [CrossRef]
- Ovadia, J.S.; Wolf, C. Studying the developmental state: Theory and method in research on industrial policy and state-led development in Africa. In Developmental States Beyond East Asia; Routledge: London, UK, 2020; pp. 24–44. [Google Scholar]
- Wade, R. The role of industrial policy in developing countries. Rethink. Dev. Strateg. After Financ. Crisis 2015, 1, 67–78. [Google Scholar]
- Hauge, J. Industrial policy in the era of global value chains: Towards a developmentalist framework drawing on the industrialisation experiences of South Korea and Taiwan. World Econ. 2020, 43, 2070–2092. [Google Scholar] [CrossRef]
- Friedmann, J.R.P. The Concept of a Planning Region. Land Econ. 1956, 32, 1–13. [Google Scholar] [CrossRef]
- Fang, C.; Yu, D. Urban agglomeration: An evolving concept of an emerging phenomenon. Landsc. Urban Plan. 2017, 162, 126–136. [Google Scholar] [CrossRef]
- Fortwengel, J. Upgrading through Integration? The Case of the Central Eastern European Automotive Industry. Transcience J. 2011, 2, 1–25. [Google Scholar]
- Tien, D.N. Regional Integration and Product Quality Upgrading: The Case of Vietnam’s Manufacturing Industries. J. Int. Trade Econ. Dev. 2021, 31, 511–536. [Google Scholar] [CrossRef]
- Zhao, W. From Industrial Policy to Upgrading Strategy: Dilemma of Local Developmental State in China’s Pearl River Delta. China Econ. Policy Rev. 2014, 3, 1450006. [Google Scholar] [CrossRef]
- Wu, J.; Sun, W. Regional Integration and Sustainable Development in the Yangtze River Delta, China: Towards a Conceptual Framework and Research Agenda. Land 2023, 12, 470. [Google Scholar] [CrossRef]
- Wang, H.H. Coordinated Development, Operation Mechanism and Growth Pole Effect of Metropolitan Areas; Southwestern University of Finance and Economics: Chengdu, China, 2024; p. 93. [Google Scholar]
- Shi, M.J.; Sun, Y.W. Analysis of Industrial Division and Functional Coordination in Chinese Metropolitan Areas. Acta Geogr. Sin. 2024, 79, 2495–2510. [Google Scholar]
- Zhang, W.; Ma, W.; Chen, Q. Does Regional Development Policy Promote Industrial Structure Upgrading? Evidence from the Yangtze River Delta in China. Sustainability 2022, 14, 8127. [Google Scholar] [CrossRef]
- Zhen, Y.; Shi, D.; Lu, Y. The Impact of Regional Integration Strategies on the Formation of City Regions and Its Agglomeration Shadow: Evidence from the Yangtze River Delta, China. Land 2023, 12, 1053. [Google Scholar] [CrossRef]
- Zhang, J.; Chen, Z.; Hu, B.; Zhu, D. Do Regional Integration Policies Promote Integrated Urban-Rural Development? Evidence from the Yangtze River Delta Region, China. Land 2024, 13, 1501. [Google Scholar] [CrossRef]
- Liu, M.J.; Li, W.P.; Yang, S.J.; Huang, Y.Q. The Effect of Regional Integration Policy on Scientific Mobility: Evidence from the Yangtze River Delta. Stud. Sci. Sci. 2024, 42, 733–745+862. [Google Scholar]
- Gu, R.; Li, C.; Li, D.; Yang, Y.; Gu, S. The Impact of Rationalization and Upgrading of Industrial Structure on Carbon Emissions in the Beijing-Tianjin-Hebei Urban Agglomeration. Int. J. Environ. Res. Public Health 2022, 19, 7997. [Google Scholar] [CrossRef] [PubMed]
- Guo, Y.; Zeng, G.; Wei, W.; Wan, Y.; Wang, S. Impact of Regional Integration on the Industrial Structure Upgrading in Resource-based Cities. Econ. Geogr. 2023, 3, 131–139. [Google Scholar]
- Lu, Z.; Deng, X. Regional Policy and Regional Development: A Case Study of China’s Western Development Strategy. Ann. Univ. Apulensis Ser. Oeconomica 2013, 15, 250–264. [Google Scholar] [CrossRef]
- Fang, H.; Zhao, S. Has the belt and road initiative promoted the upgrading of China’s industrial structure? A difference-in-differences test based on 285 cities of China. Econ. Res 2021, 1, 29–42. [Google Scholar]
- Cattaneo, O.; Gereffi, G.; Miroudot, S.; Taglioni, D. Joining, upgrading and being competitive in global value chains: A strategic framework. World Bank Policy Res. Work. Pap. 2013, 6406. [Google Scholar] [CrossRef]
- Kuznets, S. Quantitative Aspects of the Economic Growth of Nations: II. Industrial Distribution of National Product and Labor Force. Econ. Dev. Cult. Change 1957, 5, 1–111. [Google Scholar] [CrossRef]
- Brülhart, M.; Torstensson, J. Regional integration, scale economies and industry location in the European Union. CEPR Discuss. Pap. 1996, 142, 1435. [Google Scholar]
- Kim, S. Expansion of Markets and the Geographic Distribution of Economic Activities: The Trends in US Regional Manufacturing Structure, 1860–1987. Q. J. Econ. 1995, 110, 881–908. [Google Scholar] [CrossRef]
- Kim, S. Economic integration and convergence: US regions, 1840–1987. J. Econ. Hist. 1998, 58, 659–683. [Google Scholar] [CrossRef]
- Longhi, C.; Musolesi, A.; Baumont, C. Modeling structural change in the European metropolitan areas during the process of economic integration. Econ. Model. 2014, 37, 395–407. [Google Scholar] [CrossRef]
- Rekiso, Z.S. Rethinking regional economic integration in Africa as if industrialization mattered. Struct. Change Econ. Dyn. 2017, 43, 87–98. [Google Scholar] [CrossRef]
- Markusen, A. Interaction between regional and industrial policies: Evidence from four countries. Int. Reg. Sci. Rev. 1996, 19, 49–77. [Google Scholar] [CrossRef]
- Rangel-Padilla, M. Decoding upgrading in middle-income countries: The political economy of IT industrial policy in two Mexican states. Bus. Politics 2025, 1–24. [Google Scholar] [CrossRef]
- Friedrich, C.; Sternberg, R. Regional Innovation Policies in favor of Doing-Using Interacting (DUI) innovations in lagging regions: What about the perceptions of local SMEs? Reg. Sci. Policy Pract. 2025, 18, 100254. [Google Scholar] [CrossRef]
- Yu, H. Chinese Regions in Change: Industrial Upgrading and Regional Development Strategies, 1st ed.; Routledge: London, UK, 2015. [Google Scholar]
- Han, J. Integration and Regional Industrial Development: Theoretical Frameworks and Literature Reviews. J. China Int. Relat. 2018, 6, 1–28. [Google Scholar]
- Dai, S.; Zhang, W.; Wang, Y.; Wang, G. Examining the Impact of Regional Development Policy on Industrial Structure Upgrading: Quasi-Experimental Evidence from China. Int. J. Environ. Res. Public Health 2022, 19, 5042. [Google Scholar] [CrossRef]
- Wang, Y.X.; Zhang, H.F.; He, X.; Li, R. Can Urban Agglomeration Policy Promote Enterprise Specialization? Evidence from Chinese Listed Companies. J. Financ. Econ. 2023, 49, 19–33. [Google Scholar]
- Huang, D.; Chen, G.; Han, Y. Regional Integration Policy, Industrial Chain and Corporate Total Factor Productivity: An Econometric Empirical Analysis from China. Front. Environ. Sci. 2022, 10, 976203. [Google Scholar] [CrossRef]
- Pavitt, K.; Walker, W. Government Policies Towards Industrial Innovation: A Review. Res. Policy 1976, 5, 11–97. [Google Scholar] [CrossRef]
- Zhang, P.; Wang, J.; Li, M.; Xiao, F. Research on the Mechanism of Information Infrastructure Affecting Industrial Structure Upgrading. Sci. Rep. 2022, 12, 19962. [Google Scholar] [CrossRef]
- Jie, Y.; Zhou, L.; Shen, T. Competing for Innovation: Political Tournaments and High-tech Industries-related Land Transfer. Habitat Int. 2025, 166, 103575. [Google Scholar] [CrossRef]
- Gong, M.; He, W.; Zhang, N. Political Promotion Incentives and Local Employment. Econ. Anal. Policy 2021, 69, 492–502. [Google Scholar] [CrossRef]
- Chen, D.; Lu, X.; Zhang, C.; Zhang, Y.; Liao, D.; Li, J. Measuring and Enhancing the Effectiveness of Regional Integration Policies for Resource and Environmental Carrying Capacity. Humanit. Soc. Sci. Commun. 2025, 12, 1102. [Google Scholar] [CrossRef]
- Chen, Y.; Yeh, A.G.O.; Zhang, Y. Political Tournament and Regional Cooperation in China: A Game Theory Approach. Ann. Reg. Sci. 2017, 58, 597–622. [Google Scholar] [CrossRef]
- Ye, G.L.; Cheng, L.; Zhang, H. Impacts of Strengthening Competition Policy and Industrial Policy Transformation on Market Efficiency: The Analysis of the Efficient Market and Effective Government. China Ind. Econ. 2022, 1, 74–92. [Google Scholar]
- Lin, J.Y. New Structural Economics: A framework of Studying Government and Economics. J. Gov. Econ. 2021, 2, 100014. [Google Scholar] [CrossRef]
- Wu, C.Q. Principles of Regional Economics; Wuhan University Press: Wuhan, China, 2008. [Google Scholar]
- Mas-Colell, A.; Whinston, M.D.; Green, J.R. Microeconomic Theory; Oxford University Press: Oxford, UK, 1995. [Google Scholar]
- Bertrand, M.; Duflo, E.; Mullainathan, S. How much should we trust differences-in-differences estimates? Q. J. Econ. 2004, 119, 249–275. [Google Scholar] [CrossRef]
- Jiang, T. Mediation and Moderation Effects in Empirical Causal Inference. China Ind. Econ. 2022, 5, 100–120. [Google Scholar]
- Gan, C.; Zheng, R.; Yu, D. An Empirical Study on the Effects of Industrial Structure on Economic Growth and Fluctuations in China. Econ. Res. J. 2011, 5, 4–16+31. [Google Scholar]
- Amighini, A.; Sanfilippo, M. Impact of South–South FDI and trade on the export upgrading of African economies. World Dev. 2014, 64, 1–17. [Google Scholar] [CrossRef]
- Parsley, D.C.; Wei, S.J. How Big and Heterogeneous Are the Effects of Currency Arrangements on Market Integration? A Price Based Approach; Vanderbilt University Financial Markets Research Center Working Paper No. 0113; 2003; Available online: https://ssrn.com/abstract=450680 (accessed on 14 January 2026).
- Kou, Z.L.; Liu, X.Y. FIND Report on City and Industrial Innovation in China (2001–2021); Fudan Institute of Industrial Development, School of Economics, Fudan University: Shanghai, China, 2024. [Google Scholar]
- Gentzkow, M. Television and Voter Turnout. Q. J. Econ. 2006, 121, 931–972. [Google Scholar] [CrossRef]
- Li, P.; Lu, Y.; Wang, J. Does Flattening Government Improve Economic Performance? Evidence from China. J. Dev. Econ. 2016, 123, 18–37. [Google Scholar] [CrossRef]
- Rambachan, A.; Roth, J. A more credible approach to parallel trends. Rev. Econ. Stud. 2023, 90, 2555–2591. [Google Scholar] [CrossRef]
- Callaway, B.; Sant’Anna, P.H. Difference-in-differences with multiple time periods. J. Econom. 2021, 225, 200–230. [Google Scholar] [CrossRef]
Disclaimer/Publisher’s Note: The statements, opinions and data contained in all publications are solely those of the individual author(s) and contributor(s) and not of MDPI and/or the editor(s). MDPI and/or the editor(s) disclaim responsibility for any injury to people or property resulting from any ideas, methods, instructions or products referred to in the content. |
© 2026 by the authors. Licensee MDPI, Basel, Switzerland. This article is an open access article distributed under the terms and conditions of the Creative Commons Attribution (CC BY) license.