Abstract
Rapid urbanization has driven land-use transitions, leading to the continuous replacement of land-use types with high carbon storage capacity by those with lower capacity. A deeper analysis of the drivers behind these changes and predictions of their future development is essential for optimizing land-use patterns and enhancing regional carbon sink functions. This study takes the Guanzhong Plain Urban Agglomeration (GPUA) as a case study. It employs the PLUS and InVEST models to simulate land use and land cover (LULC) dynamics from 2000 to 2020 and to project the LULC and associated spatial clustering characteristics of carbon storage in 2030. The results show that: (1) From 2000 to 2020, LULC changes in the region were dominated by the conversion of cropland to built-up land, primarily concentrated in urban areas and along the Wei River corridor. By 2030, built-up land is expected to continue expanding along transportation corridors and urban peripheries, further reducing the area of cropland. (2) Changes in carbon storage were mainly driven by LULC transitions, with an overall declining trend observed from 2000 to 2020 (decreasing from 2754.69 Mt to 2741.79 Mt) despite the buffering effect of ecological restoration, and a projected continued decrease to 2734.28 Mt by 2030. (3) The spatial distribution of carbon storage was characterized by a strengthening polarization. The proportion of hotspot areas increased from 30.38% to 32.33% over the 2000–2020 period, with a concentration in ecological function zones such as the Qinling Mountains, Ziwuling, and Huanglongshan. Concurrently, coldspot areas also expanded. Future efforts should prioritize the protection of high-carbon-sink mountainous zones, strictly control the outward expansion of built-up land, and enhance carbon storage capacity in agricultural areas to support low-carbon development and spatial optimization in the GPUA.
1. Introduction
Global climate change remains one of the most pressing challenges confronting human societies, with the land sector now recognized as a central pillar of both mitigation and adaptation strategies [1]. Terrestrial ecosystems store vast quantities of carbon and act as a natural buffer against anthropogenic CO2 emissions, but this function is increasingly undermined by land-use and land-cover change (LUCC). Rapid urbanization has emerged as a major driver of LUCC, ranking second only to fossil fuel combustion in its contribution to CO2 emissions [2,3]. This process drives carbon loss by replacing high-carbon ecosystems—such as forests, grasslands, and wetlands—with low-carbon built-up land and infrastructure.
At the global scale, recent work has reframed land degradation, climate change, and biodiversity loss as interconnected crises that must be addressed jointly. Maestre et al. (2025) [4] argue that achieving the targets of the Rio Conventions requires “bending the curve” of land degradation, i.e., halting the expansion of degraded land while actively restoring large areas, so that land systems simultaneously support climate regulation, food security, and biodiversity conservation. This framing highlights not only total changes in land carbon stocks, but also where degradation and restoration are spatially concentrated, and how these patterns intersect with human settlements.
China provides a prominent example of land-based climate action at the national scale. Since the late 1990s, large-scale ecological restoration programs, such as the Grain for Green Program and the Natural Forest Conservation Program, have reshaped land systems, particularly in ecologically fragile regions like the Loess Plateau and the upper and middle reaches of the Yellow River. National ecosystem assessments show that investments in natural capital have substantially improved multiple ecosystem services, including carbon sequestration [5]. More recently, Yue et al. (2024) [6] quantified the contributions of ecological restoration policies to China’s land carbon balance, demonstrating that these policies have significantly enhanced the terrestrial carbon sink, partly offsetting emissions from energy and land-use change.
However, there is still a limited understanding of how these national-scale restoration efforts interact with intensive urbanization at the meso-scale of urban agglomerations. Urban agglomerations concentrate population, economic activity, and infrastructure, and are expected to be the primary loci of new urban land by 2030 [3]. In such regions, the loss of cropland, settlement expansion, and ecological restoration often co-occur, creating a complex “push–pull” dynamic in land carbon storage. The key question is whether aggressive ecological restoration in surrounding mountains and ecological function zones is sufficient to bend the carbon storage curve at the meso-scale of urban agglomerations, which serve as the primary loci of population and carbon emissions.
Methodologically, considerable progress has been made in coupling land-use simulation with ecosystem service models to evaluate the impacts of LUCC on carbon storage. Classical models, such as CLUE-S, CA-Markov, and FLUS, can reproduce the spatial dynamics of land systems under multiple scenarios [7,8,9]. Yet they have limitations in representing competitive transitions among multiple land-use classes and in capturing the patch structure of emerging landscapes. The Patch-generating Land Use Simulation (PLUS) model addresses these limitations by combining a Land Expansion Analysis Strategy with a Cellular Automata framework based on multiple random seeds, improving its capacity to represent complex, multi-class land transitions [10]. Parallel advances in ecosystem service modeling, particularly the InVEST carbon module, enable the simultaneous estimation of aboveground, belowground, soil, and dead organic matter carbon pools using harmonized land-use data and carbon-density parameters [11]. When coupled, PLUS–InVEST frameworks have been widely used to assess multi-scenario carbon storage trajectories in Chinese urban agglomerations, such as the Chengdu–Chongqing region and the Yangtze River Delta, as well as other rapidly urbanizing basins [12,13,14,15].
Despite this growing body of work, critical gaps persist that obscure our ability to manage carbon dynamics in rapidly developing regions effectively. First, a significant blind spot remains regarding the spatial polarization of carbon storage. Most existing studies focus on the aggregate carbon balance, failing to capture how “hotspots” of sequestration and “coldspots” of depletion spatially segregate [14,15]. This oversight limits our understanding of how ecological function zones and urban frontiers interact spatially to shape the regional carbon landscape. Second, there is an urgent need to examine these dynamics in ecologically fragile transition zones. While coastal urban agglomerations have been well-studied, semi-arid basins—where water constraints, land degradation risks, and restoration imperatives converge—face a more intense conflict between development and conservation. Third, the effectiveness of national restoration policies at the meso-scale of urban agglomerations remains unverified. While national assessments indicate a net carbon gain, it is crucial to determine whether specific urban agglomerations embedded in these programs are actually “bending the curve” of carbon loss [5,6], or if urban expansion continues to offset local restoration gains. Addressing these uncertainties is crucial for tailoring “Dual Carbon” strategies to inland grain-producing and ecologically sensitive regions.
The Guanzhong Plain Urban Agglomeration (GPUA) in the middle reaches of the Yellow River is a representative socio-ecological “testbed” for these issues. It is simultaneously a national grain production base, a core area of the Western Development Strategy, and a significant ecological security barrier linking the Loess Plateau, the Qinling–Bashan Mountains, and the Yellow River corridor [16,17]. Over the past two decades, the GPUA has undergone rapid urbanization, with extensive conversion of cropland to construction land, while also benefiting from large-scale ecological restoration in adjacent mountain and hilly regions. Previous work has quantified historical carbon storage changes in the GPUA using the InVEST model [18]. Still, it has not explicitly examined how concurrent urban expansion and ecological restoration reshape the spatial clustering of carbon storage, nor how these patterns might evolve under future land-use trajectories.
In this study, we conceptualize the GPUA as a “natural experiment” where intense urbanization and large-scale ecological restoration unfold over the same period. Using an integrated PLUS–InVEST framework and Getis–Ord Gi* hotspot analysis, we address three interrelated questions: (1) how LUCC associated with simultaneous urban growth and ecological restoration has reshaped the spatiotemporal dynamics of carbon storage in the GPUA from 2000 to 2020; (2) whether these dynamics exhibit a pronounced spatial polarization, with carbon hotspots concentrating in mountainous ecological function zones and carbon coldspots clustering in urban plains; and (3) how projected land-use patterns for 2030 influence the “carbon retention efficiency” of the urban agglomeration, and what this implies for land-use optimization under China’s “Dual Carbon” and land-degradation “bending the curve” agendas. By situating a typical inland urban agglomeration within both national and global discussions on land-based climate mitigation, this work aims to provide a spatially explicit evidence base to support differentiated, carbon-oriented land-use planning in grain-producing and ecologically fragile regions.
2. Materials and Methods
2.1. Research Area
GPUA is situated in the hinterland of Northwest China, covering a total area of approximately 107,100 km2. The region features a complex and diverse topography, bounded by the Qinling-Bashan Mountains to the south, adjacent to the Loess Plateau to the north, stretching across the mainstream of the Yellow River to the east, and extending to the Longzhong Hills in the west, as shown in Figure 1. The region experiences a temperate semi-humid monsoon climate, characterized by an average annual temperature of 6–13 °C and precipitation ranging from 500 to 900 mm, which exhibits significant spatiotemporal variation. This climatic regime has given rise to a river network dominated by the Wei River, with the Jing and Fen Rivers as major tributaries, collectively shaping the agricultural landscape of the alluvial plain. The GPUA encompasses five prefecture-level cities in Shaanxi Province—Xi’an, Baoji, Xianyang, Tongchuan, and Weinan—as well as the city of Yangling. It also extends to Shangluo City (Shaanxi), Yuncheng and Linfen Cities (Shanxi), as well as parts of Tianshui, Pingliang, and Qingyang Cities in Gansu Province. However, rapid urbanization, driven by the Western Development Strategy and regional integration, has led to large-scale land-use conversion, subsequently giving rise to a series of environmental challenges [17].
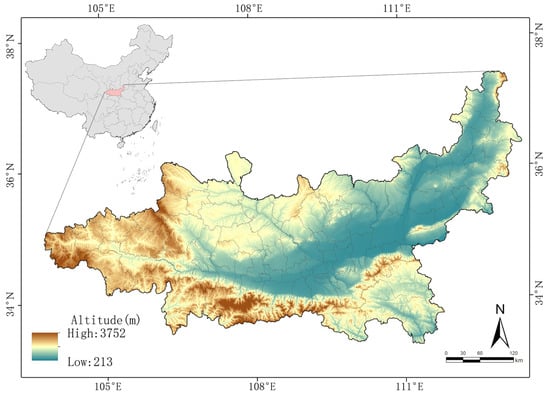
Figure 1.
Map of Guanzhong Plain Urban Agglomeration (GPUA).
2.2. Data Collecting and Processing
The data utilized in this study are as follows: Table 1: ① Land Use and Land Cover (LULC) data for the GPUA for the years 2000 and 2020 were obtained from the Annual China Land Cover Dataset with a spatial resolution of 30 m. To meet the research objectives, the original data were reclassified into six categories: cropland, forestland, grassland, water bodies, unused land, and construction land. ② The driving factors selected for land use change simulation encompassed both natural and socio-economic dimensions. Natural driving factors included elevation, slope, mean annual precipitation, and mean annual temperature. Socioeconomic driving factors included population density, Gross Domestic Product (GDP), and distances to the nearest roads and rivers. The topographic data were derived from the NASA SRTM1 v3.0; climate data (representing the 2000–2020 average) were obtained from the China Meteorological Data Service Center; population density and GDP data were sourced from the National Tibetan Plateau/Third Pole Environment Data Center and the Geographic Data Sharing Infrastructure, global resources data cloud; while road and river network data were acquired from the National Platform for Common Geospatial Information Services (NGCC). To ensure spatial consistency with the land use data, all driving factors underwent spatial interpolation, normalization, and rasterization, and were standardized to a 30-m resolution. ③ Carbon density parameters for the carbon storage simulation using the InVEST model were assigned in accordance with the official user‘s guidebook and supplemented by peer-reviewed studies from similar latitudinal zones [18,19,20].

Table 1.
Data collection.
2.3. Research Methods
This study first employed the PLUS model, using land-use data from 2000 and 2010, to simulate the LULC pattern in 2020. The simulated results were then validated against the actual 2020 data, confirming the rationality of the selected driving factors (Kappa coefficient ≥ 0.75). Subsequently, based on the land-use data from 2010 and 2020, the LULC pattern for 2030 was predicted. The InVEST-Carbon model was then applied to estimate regional carbon storage, and hotspot analysis was conducted to explore its spatial distribution characteristics, as shown in Figure 2.
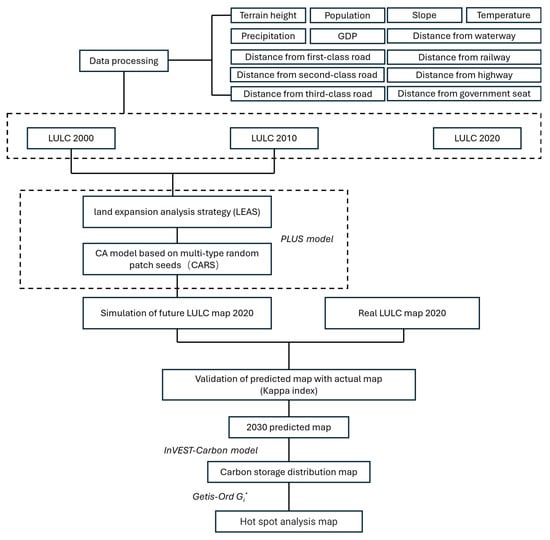
Figure 2.
Research framework.
2.3.1. LULC Projection Simulation
This study employed the PLUS model to project the spatial distribution of land use for the year 2020, utilizing observed data from 2000 and 2010 for the Guanzhong Plain Urban Agglomeration. The predictive accuracy of the model was subsequently validated. The PLUS model is a simulation model for land use changes, integrating both the Land Expansion Analysis Strategy (LEAS) and the CA based on multiple Random patch Seeds (CARS) modules, which are designed to simulate land transition probability and spatial expansion dynamics, respectively [10]. Based on a careful consideration of land change characteristics and data availability, a total of 13 driving factors were selected from both the natural environment and socio-economic dimensions. In terms of the natural environment, mean annual temperature and precipitation were chosen as they influence the hydrothermal conditions for vegetation. Additionally, topographic and resource factors, including elevation (DEM), slope, and distance to water bodies, were included as they determine the suitability and spatial distribution of specific land-use types [22]. Regarding socio-economic dimensions, population density, GDP, and distance to county/city administrative centers were selected to reflect the intensity of human activity and economic radiation [23]. Finally, accessibility factors, specifically the distance to railways, highways, and Class I, II, and III roads, were incorporated, as proximity to transportation networks significantly influences land use patterns and urban expansion. First, the LULC change for 2020 was projected using data from 2000 and 2010. The raster-format land use data were standardized into the required input format for the PLUS model. Subsequently, land use expansion during this period was extracted and, together with multiple spatial driving factors, was input into the LEAS module [24]. Through machine learning-based regression analysis, spatial development probability maps were generated for each land type, along with a ranking of the contribution of corresponding driving factors, enabling an assessment of the succession potential of all land categories. Subsequently, the Markov chain model was used to calculate the areal demand for each land use category in 2020. Finally, the 2010 land use map and the probability maps generated by the LEAS module were input into the CARS module to simulate the 2020 land use pattern. The simulation result was validated against the actual 2020 land use data. An accuracy rate of the Kappa coefficient greater than 0.75 confirmed the validity of the simulation [25], demonstrating that the model achieves high consistency and reliability in replicating the spatial distribution and patch structure of land use, and can accurately reconstruct the regional land use change process. After confirming the accuracy, the simulation was used to predict the LULC for 2030, utilizing actual LULC maps from 2010 and 2020.
2.3.2. LULC Transition Analysis
The land use transition matrix (M) illustrates the direction and magnitude of changes in all land categories within a study area over time, enabling the analysis of impacts from both natural and human factors on these categories during the study period. Its formulation is presented below (Equation (1)):
In the equation, Sij represents the area converted from land-use type i to type j during the study period, and n denotes the total number of land-use categories.
2.3.3. Carbon Storage Assessment Using the InVEST Model
This study applied the InVEST (Integrated Valuation of Ecosystem Services and Trade-offs) model to estimate regional carbon storage for both past and future scenarios [26]. The carbon storage module, developed by Stanford’s Natural Capital Project [11], quantifies total carbon stocks (Ctotal) based on LULC data. Specifically, this module integrates four key carbon pools: aboveground biomass (Ci-above), belowground biomass (Ci-below), soil organic matter (Ci-soil), and dead organic matter (Ci-dead). Each pool’s density is defined as its average carbon mass per unit area. Its formulation is presented below (Equation (2)):
where the total carbon storage, Ctotal (Mg), is calculated as the sum of the products of the total carbon density Ci (Mg/ha) and the area Si (ha) for each land use type i, across n land classes, The total carbon density Ci integrates four specific pools: aboveground biomass Ci-above, belowground biomass Ci-below, soil organic carbon Ci-soil, and dead organic matter.
Given the challenge of acquiring comprehensive field monitoring data for all vegetation types within the study area, carbon density parameters were derived from peer-reviewed literature in similar latitudinal zones and bioclimatic regions [18,20,27]. These values were synthesized with the reference tables from the official InVEST User’s Guide to determine the final coefficients [11].
2.3.4. Spatial Clustering Analysis of Carbon Storage
Hotspot analysis, employing the Getis-Ord Gi* statistic, was conducted to examine the spatial clustering characteristics of carbon storage [28]. Implemented through the ArcGIS 10.8 platform, this method identifies statistically significant Hotspots—defined as areas exhibiting high carbon density surrounded by other high-value locations—and cold spots, representing spatial clusters of low carbon density. The analysis elucidates distinct spatial heterogeneity patterns in regional carbon storage distribution, providing critical insights into the spatial organization of carbon sequestration potential. Its formulation is presented below (Equation (3)):
where Wij is the spatial weight matrix between patch i and patch j, xj is the attribute value of patch j, and n is the total number of sample points.
3. Results
3.1. Spatiotemporal Changes in Land Use/Land Cover (2000–2030)
From 2000 to 2020, cropland and forestland remained the dominant land-use types in the Guanzhong Plain Urban Agglomeration (GPUA), together accounting for more than 80% of the total area throughout the study period, as shown in Figure 3. Cropland, however, showed a steady contraction: its areal share declined from 49.83% in 2000 to 46.46% in 2020, corresponding to a net loss of approximately 5417.48 km2, primarily concentrated in the central plain and the northwestern Loess Plateau. In contrast, forestland expanded from 32.39% to 36.27%, with an area increase of 4200.03 km2, mainly on the northern slopes of the Qinling Mountains and in the Ziwuling and Huanglong Mountain ranges, reflecting the cumulative effects of large-scale ecological restoration policies in these upland areas (e.g., returning cropland to forest and grassland). The grassland area declined from 13.51% to 10.09%, representing a reduction of approximately 3682.69 km2, primarily in the middle and upper reaches of the Wei River. Over the same period, construction land increased from 3.43% to 6.20%, expanding by 2977.20 km2 in concentric patterns around major metropolitan areas and along transportation corridors, while water bodies and unused land experienced relatively minor area changes, as shown in Figure 3a–c.
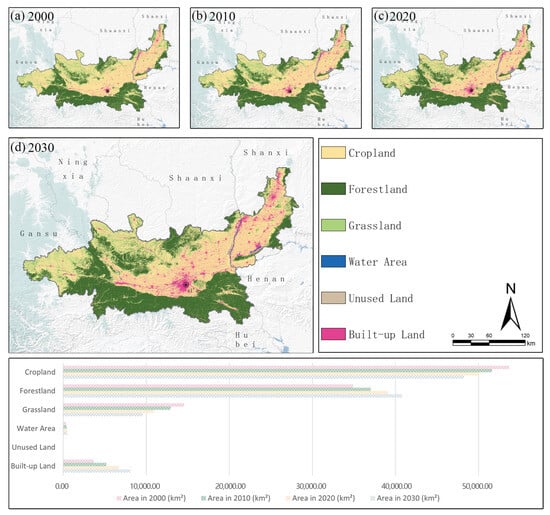
Figure 3.
Spatial distribution of LULC (2000, 2010, 2020) and projected LULC (2030).
Model projections for 2030 suggest that these trends will persist but partially reconfigure, as shown in Figure 3d. Built-up land is expected to continue expanding along the eastern and western development corridors and into peri-urban zones, primarily at the expense of cropland, which is projected to lose an additional 1807.65 km2 relative to 2020. Forestland is projected to increase by 1709.16 km2, mainly in the Qinling Mountains and the Weibei Plateau. Still, this gain is partly offset by a reduction of 1312.50 km2 in grassland and continued shrinkage of unused land. Overall, the 2030 landscape is characterized by further intensification of the “mountain–plain” contrast, with more consolidated forest in the southern and northern uplands and more extensive construction land and fragmented cropland in the central alluvial plains.
3.2. Land-Use Transformation Pathways from 2000 to 2030
The land-use transition matrix and its chord representation reveal that cropland experienced the most substantial gross outflow between 2000 and 2030 Figure 4. Over the 20 years, a total of 83,374.07 km2 of cropland was converted to other land types, primarily to grassland (32,376.84 km2), construction land (29,476.05 km2), and forestland (17,967.11 km2). Simultaneously, 45,199.31 km2 was converted from other land types back into cropland, resulting in a net cropland loss of 38,174.76 km2. These bidirectional flows indicate that cropland has functioned as both a donor and recipient class, mediating trade-offs between food production, ecological restoration, and urban expansion.
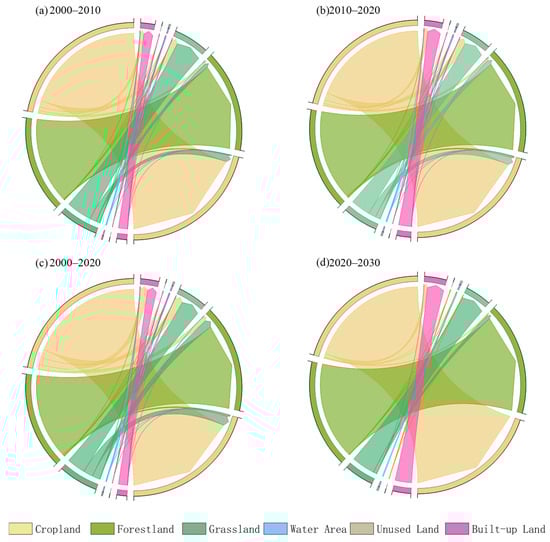
Figure 4.
Chord diagram of transfer and flow ratio between different land types from 2000 to 2030.
Construction land shows a markedly unidirectional trajectory driven almost exclusively by the conversion of cropland (Figure 4). The net increase in construction land over 2000–2030 is 29,772.06 km2, of which 29,476.05 km2 (98.97%) originates from cropland, underscoring the dominant role of agricultural land conversion in supporting urban expansion. Only a small fraction of the cropland converted to construction land was offset by reverse transitions, highlighting the limited scope for “re-agrarianization” once land is urbanized.
Forest and grassland transitions jointly reflect the spatial imprint of ecological restoration and development policies. Forestland gains are predominantly sourced from cropland and grassland, contributing 17,967.11 km2 and 31,305.47 km2, respectively, mainly in the Qinling Mountains, Ziwuling, and Huanglong mountainous areas (Figure 4). Conversely, grassland is intensely dynamic: while substantial areas of grassland are converted to cropland (38,064.25 km2) and forest, other patches emerge along the margins of cropland and unused land, particularly in the northern Loess Plateau. These bidirectional conversions suggest that restoration and development interventions have repeatedly shifted land among the categories of cropland, grassland, and forest over the past 20 years.
3.3. Carbon Storage Dynamics (2000–2030)
3.3.1. Temporal Evolution of Ecosystem Carbon Storage
Ecosystem carbon storage, estimated using the InVEST model, shows a modest but persistent decline over the study period Figure 5. Total carbon storage in the GPUA decreased from 2754.69 Mt in 2000 to 2741.79 Mt in 2020, corresponding to a net reduction of 12.90 Mt and an overall decline of 0.46% relative to the 2000 baseline. Model outputs indicate that the decline was not monotonic: carbon storage decreased slightly between 2000 and 2010 and again between 2010 and 2020, reflecting the combined effects of cropland loss, forest expansion, and grassland shrinkage. Specifically, the carbon dynamics varied significantly among land use types, as shown in Table 2. Forestland acted as the primary carbon sink, with its storage increasing by 145.66 Mt (+12.04%), effectively offsetting a large portion of the regional carbon loss. In contrast, Grassland and Cropland were the dominant sources of carbon reduction, decreasing by 88.72 Mt (−25.31%) and 79.69 Mt (−6.74%), respectively. This substantial decline in grassland and cropland carbon stocks outweighed the gains from forest recovery. Meanwhile, although Built-up Land constituted a small fraction of the total area, its carbon storage nearly doubled, increasing by 9.85 Mt (+80.50%), which further highlights the intensity of urban expansion during the study period. Projections for 2030 suggest a continued decrease to 2734.28 Mt, implying that ongoing land-use transitions will further erode the regional carbon stock if current trends persist, as shown in Figure 5a–d. When normalized by net urban expansion, the 2000–2020 carbon loss corresponds to an average reduction of approximately 4332.93 t C per km2 of net construction land increase. This “urban expansion–carbon loss elasticity” encapsulates the net impact of expanding built-up land after accounting for partial compensation from forest restoration and other land-use changes.
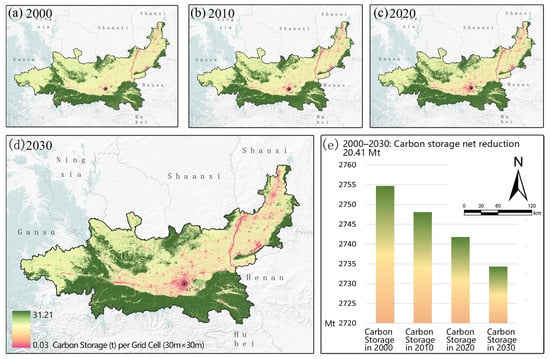
Figure 5.
Distribution of past carbon stocks and future carbon stocks.
Table 2.
Carbon storage and its changes across different land use types in the GPUA from 2000 to 2020.
3.3.2. Spatial Patterns and Evolution of Carbon Hotspots
The spatial distribution of carbon storage exhibits a clear “low-in-the-center, high-on-the-periphery” pattern throughout 2000–2030, as shown in Figure 5. distribution of past carbon stocks and future carbon stocks. High-value areas (carbon hotspots) are predominantly concentrated in the Qinling Mountains to the south and the Loess Plateau to the north, where continuous forest and mixed forest–grassland mosaics provide large aboveground and soil carbon stocks. In contrast, low-value areas (carbon coldspots) are concentrated in the central alluvial plain, particularly around the Xi’an–Xianyang–Weinan metropolitan corridor, where intensive cropland use and rapid urbanization have led to a reduction in biomass and soil carbon density. This mountain–plain polarization is a typical signature of urbanizing basins where upland ecological protection coexists with lowland development pressure.
Getis–Ord Gi* hotspot analysis further quantifies the evolution of carbon storage clustering, as shown in Figure 6; Table 3. At the 90% confidence level, the hotspot area increased from 2069.10 km2 (1.93% of the region) in 2000 to 2623.86 km2 (2.45%) in 2020 and is projected to reach 2827.89 km2 (2.64%) by 2030. When all hotspot confidence levels (90%, 95%, and 99%) are combined, the total hotspot area rises from 30.38% in 2000 to 32.33% in 2020 and is expected to further expand to 35.64% by 2030, as shown in Table 3. These increases are mainly located in the Qinling Mountains, Ziwuling, and the hilly areas along the Taihang Mountains, where large-scale ecological restoration and strict protection policies have maintained or enhanced carbon density. In contrast, several high-confidence hotspot patches in peri-urban areas around Xi’an, Xianyang, Yangling, and Yuncheng show contraction or downgrading in significance, reflecting local carbon losses associated with intensive urban expansion and infrastructure development, as shown in Figure 6.
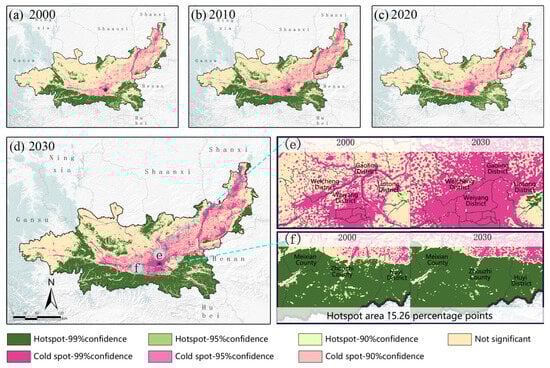
Figure 6.
Spatial and Temporal Distribution of Carbon Hotspots and Coldspots (2000–2030). (a) 2000, (b) 2010, (c) 2020, (d) 2030 (e,f) Hotspot area ↑5.26 percentage points.
Table 3.
Statistics of hotspot areas in 2000, 2010, 2020, and 2030.
Spatially, coldspots show the opposite evolution. Persistent and emerging coldspots are concentrated in rapidly urbanizing districts such as Gaoling, Weicheng, Lintong, and Weiyang, as well as in parts of the central Wei River corridor. The expansion of coldspot clusters toward newly developed urban fringes indicates that carbon storage loss closely tracks the outward progression of built-up land. Together, these hotspot–coldspot dynamics reveal an increasingly polarized carbon landscape, where mountain ecological red-line regions are progressively consolidating as carbon-rich refugia. At the same time, the urbanizing plains continue to evolve into carbon-poor mosaics.
4. Discussion
4.1. The Trade-Off Mechanism Between Urbanization and Ecological Restoration
At first glance, the GPUA’s carbon trajectory appears relatively “stable”: total ecosystem carbon storage declines by less than 1% from 2000 to 2030, despite rapid urban expansion. However, this small net change masks an intense tug-of-war between urbanization and ecological restoration. Conversely, cropland conversion to construction land is highly concentrated and largely irreversible; In contrast, extensive afforestation and grassland restoration in the Qinling Mountains and northern hilly areas continually facilitate carbon sequestration and accumulation in the ecosystem. The resulting net signal, i.e., a slight decline at the urban-agglomeration scale, emerges from the balance between these opposing flows rather than from weak drivers.
At the national scale, China’s portfolio of ecological restoration policies has clearly enhanced the terrestrial carbon sink. Ref. [5] showed that investments in natural capital during 2000–2010 significantly improved multiple ecosystem services, including carbon sequestration, while ref. [6] used counterfactual “no-policy” scenarios to demonstrate that ecological restoration has measurably increased China’s land carbon balance relative to a baseline without such interventions. Against this backdrop, the GPUA’s slight carbon loss suggests that urban agglomerations embedded in national restoration programs do not automatically “enjoy” the national-scale carbon sink gains. Instead, they may still operate near a local balance point. Mechanistically, this can be understood as a conflict between opposing driving forces: the ‘exogenous’ force of national ecological policies (which drives restoration in the mountains) and the ‘endogenous’ force of local economic development (which drives urban expansion in the plains).
Our estimate of an average loss of roughly 4332.93 t C per km2 of net construction land expansion (after accounting for concurrent forest gains) provides a compact measure of the “urban expansion–carbon loss elasticity” of the GPUA. This value lies toward the lower end of the range reported for other Chinese urban agglomerations, where FLUS/PLUS-InVEST studies often find more substantial net carbon losses per unit of urban expansion [14,29,30]. The relatively modest elasticity in the GPUA indicates that large-scale restoration in surrounding mountain and hilly zones is already compensating for part of the carbon cost of urban growth. Yet the fact that total carbon storage still declines, rather than stabilizing or increasing, implies that U > R at the urban-agglomeration scale. In other words, current levels of ecological restoration and forest protection are sufficient to slow but not reverse the carbon losses associated with continued urban expansion.
A qualitative counterfactual, informed by national-scale modeling, reinforces this interpretation. Yue et al. (2024) [6] demonstrated that, without significant restoration policies, China’s land carbon sink would be significantly weaker, resulting in larger cumulative carbon losses under continued land-use change. By analogy, the GPUA without large-scale reforestation and ecological projects in the Qinling and northern hills would likely have experienced a more pronounced decline in carbon storage, as substantial gains in forest areas would not have offset the losses of cropland and grassland to construction land. In this sense, the mountain carbon hotspots we identify should be interpreted as a regional manifestation of national restoration policies rather than as purely “natural” processes.
4.2. Spatial Polarization of Carbon Storage in a Mountain–Plain System
A second key finding is the clear and strengthening spatial polarization of carbon storage. Throughout 2000–2030, carbon hotspots cluster in mountainous and hilly ecological function zones, whereas coldspots follow the urban expansion frontier in the central plains. This pattern is consistent with global projections suggesting that future urban expansion will preferentially occur on high-productivity, high-carbon lands in lowland areas, leading to substantial losses in biomass and soil carbon pools [3].
In the GPUA, the “mountain ecological redline–plain grain belt–urban core” triad is already visible in the carbon maps. Afforested and conserved forest–grass mosaics in the Qinling Mountains, Ziwuling, and Huanglong regions have consolidated into persistent or newly emerging hotspots, with the hotspot area increasing from 30.38% to 35.64% of the region between 2000 and 2030. At the same time, coldspots (areas of significantly low carbon storage) expand and coalesce around Xi’an, Xianyang, Yangling, Yuncheng, and other rapidly urbanizing nodes. This dual movement indicates that restoration and protection policies are effectively “locking in” carbon in upland ecological function zones, while urbanization continues to erode carbon stocks in the plains.
Compared with other urban agglomerations, the GPUA’s polarization is shaped by its pronounced mountain–plain geomorphology and its role as both a grain-producing zone and ecological security barrier. In the Chengdu–Chongqing urban agglomeration, for example, Shao et al. (2023) [14] found that carbon hotspots were maintained mainly in mountainous areas; however, multi-scenario simulations were necessary to identify pathways that limited coldspot expansion in the basin. Similarly, in the Chang-Zhu-Tan metropolitan region, Sun et al. (2023) [29] showed that “ecological development priority” scenarios preserved carbon-rich patches more effectively than “urban development priority” pathways. Although our study only implements a business-as-usual (BAU) continuation of observed trends, the observed hotspot–coldspot dynamics suggest that the GPUA is on a trajectory similar to these regions: mountain hotspots are being strengthened, but coldspot expansion in the plains has not yet been arrested.
From a mechanism perspective, the spatial pattern of net carbon change reflects the relative magnitude and spatial targeting of U and R. In mountain and hilly regions, R dominates: ecological restoration, reforestation, and strict land-use controls have increased or maintained high carbon densities. In the central plains, U dominates: dense road networks, development corridors, and peri-urban sprawl drive sustained conversion of cropland and grassland to construction land. In transitional zones, such as the northern Wei River terraces and piedmont belts, U and R interact more directly, with some former hotspots experiencing degradation and others gradually improving. This spatial heterogeneity underscores the need for spatially differentiated strategies that consider not only the total carbon balance but also the locations of losses and gains.
4.3. Implications for Carbon-Oriented Land-Use Planning in Grain-Producing and Ecologically Fragile Regions
By treating the GPUA as a “natural experiment” where intense urbanization and large-scale restoration co-occur, this study yields several insights for carbon-oriented land-use planning in similar mountain–plain urban agglomerations. First, the analysis shows that mountain-focused restoration alone is insufficient to bend the carbon storage curve at the urban-agglomeration scale. Even with substantial afforestation and protection in upland areas, the net carbon balance remains slightly negative because conversions from cropland to construction in the plains continue to erode carbon stocks. This suggests that, in addition to maintaining and enhancing mountain ecological redlines, planning must explicitly address the form, intensity, and spatial distribution of urban expansion. Compact, brownfield-oriented development and transit-oriented corridors rather than dispersed, low-density expansion are more likely to reduce the carbon loss elasticity associated with each additional unit of construction land, a conclusion broadly consistent with scenario-based assessments in other Chinese urban clusters [14,29,30].
Second, the results highlight the importance of integrating cropland carbon management into “Dual Carbon” and food security agendas. In the GPUA, nearly all new construction land from 2000 to 2030 originates from cropland, and a significant portion of the remaining cropland is located in or near carbon coldspots. While cropland typically has lower carbon density than mature forest, soil organic carbon stores in long-used agricultural lands are non-trivial, and their loss can contribute significantly to regional carbon emissions [31]. By promoting conservation tillage, residue retention, agroforestry, and soil organic carbon enhancement in the remaining cropland, planners can slow the decline of carbon storage in the plains even when some expansion of construction land is unavoidable.
Third, the “mountain ecological redline–plain grain belt–urban core” configuration observed in the GPUA suggests a more general conceptual framework for inland mountain–plain systems. In such systems, three interacting subsystems jointly shape the carbon landscape: (1) upland ecological redline zones that function as carbon anchors; (2) mid-altitude and lowland grain belts that provide both food security and substantial soil carbon; and (3) urban cores and corridors that concentrate population and infrastructure. If restoration in uplands is strong enough and urban expansion is sufficiently compact and corridor-focused, it may be possible to maintain or even increase the area of carbon hotspots while preventing further expansion of coldspots, effectively bending the carbon curve at the urban-agglomeration scale. At present, the GPUA appears to be in a transitional stage toward such an ideal configuration: mountain hotspots are stabilizing and expanding, but plains coldspots continue to grow. This transitional status serves as a cautionary reference for other regions with similar geomorphology and development pressures, such as the middle reaches of the Yellow River, the Chengdu–Chongqing basin, and other inland urban agglomerations situated within ecological security zones [14,27,29].
4.4. Limitations and Future Research
Several limitations of this study should be acknowledged when interpreting the findings and considering future research directions. First, the land-use projection relies on a single business-as-usual scenario that extrapolates 2010–2020 transition probabilities and macro-drivers to 2030. This trend-extension approach is suitable for exploring likely near-term trajectories under current policies. Still, it does not capture the full range of plausible futures associated with alternative policy choices, such as ecological-prioritization or high-density urban development scenarios. Multi-scenario designs, as implemented in recent FLUS/PLUS–InVEST applications [14,29], would enable a more explicit evaluation of trade-offs between carbon storage, urban expansion, and cropland protection, and could reveal planning pathways that more closely align with bending the urban-agglomeration carbon curve.
Second, the InVEST carbon model is implemented with static carbon density values for each LULC class, implying that all changes in carbon storage arise from land-use conversion rather than from within-class dynamics such as forest growth, stand age, degradation, or soil carbon accumulation. This simplifying assumption, common in regional InVEST applications, may underestimate the long-term impacts of land-use change, especially for young plantations, recovering grasslands, and soils with slow carbon turnover [12,30]. Future work could combine PLUS–InVEST with process-based vegetation or soil carbon models, or apply sensitivity and Monte Carlo analyses to propagate uncertainty in carbon density parameters through to regional carbon storage estimates.
Third, we used a single land-use simulation model (PLUS) and a single set of driving factors. Although the model passed standard validation tests and has been successfully applied to other Chinese urban agglomerations [10,17], structural uncertainty remains. Different model structures (e.g., FLUS, CLUE-S) or alternative specifications of socio-economic and policy drivers could yield different spatial patterns of land-use change, and thus, different patterns of carbon storage. Model intercomparison and ensemble approaches would be valuable for assessing the robustness of hotspot–coldspot patterns and elasticity estimates, particularly for policy applications.
Despite these limitations, this study demonstrates that even under strong national ecological restoration policies, urban agglomerations such as the GPUA face a delicate balance between urban growth and ecosystem carbon conservation. By making the spatial structure of carbon gains and losses explicit and situating a representative inland urban agglomeration within national and global discussions on land-based climate mitigation, the work provides a foundation for more nuanced, spatially differentiated strategies to enhance the carbon retention efficiency of urbanizing landscapes.
5. Conclusions
This study combined the PLUS land-use model, the InVEST carbon module, and Gi* hotspot analysis to investigate the impact of concurrent urban expansion and ecological restoration on ecosystem carbon storage in the Guanzhong Plain Urban Agglomeration (GPUA) from 2000 to 2020, as well as under a 2030 business-as-usual scenario. At the agglomeration scale, total carbon storage exhibits a modest but persistent decline: mountain and hilly restoration slows, but does not offset, the carbon losses resulting from the conversion of cropland to construction land. The GPUA, as a typical inland grain-producing and rapidly urbanizing region, has therefore not yet “bent” its carbon storage curve in the way national-scale assessments suggest for China as a whole.
More compact, infill- and corridor-based urban growth (specifically, strictly enforcing Urban Growth Boundaries around the Xi’an–Xianyang metropolitan core), stricter control of cropland-to-construction conversion, and targeted enhancement of cropland and grassland soil carbon (e.g., promoting conservation tillage in the Wei River grain belt) are all needed to improve the carbon retention efficiency of future urbanization. Furthermore, the conservation of mountain hotspots should prioritize quality by strictly implementing the Qinling Ecological Protection Ordinance to limit human interference in high-altitude zones.
These patterns imply that mountain-focused restoration, although essential, is insufficient to stabilize or increase carbon storage at the urban-agglomeration scale. Together, these measures underscore the importance of coordinated urban form control and ecosystem-based land management, stricter control over conversions from cropland to construction, and targeted enhancement of soil carbon in cropland and grassland, all of which are necessary to improve the carbon retention efficiency of future urbanization. For inland mountain–plain systems in the middle reaches of the Yellow River and similar basins, the GPUA experience highlights the importance of jointly designing urban form, ecological restoration, and cropland management. This implies that the strategies proposed here have broader applicability to other regions facing similar ‘development–conservation’ conflicts, such as the Chengdu–Chongqing Economic Circle (a typical basin system), the Fenwei Plain, and the Central Plains Urban Agglomeration. By addressing these common challenges, urbanization can proceed without further deepening spatial carbon inequalities.
Author Contributions
Z.Z., Data curation, Conceptualization, Visualization, Investigation, Writing—original draft, Software, Resources, and Project administration. Y.Y., Visualization and Investigation. Y.Z., Visualization and Investigation. L.Q., writing—review and editing, formal analysis, and funding acquisition. T.G., writing—review and editing and funding acquisition. All authors have read and agreed to the published version of the manuscript.
Funding
This research was funded by the National Natural Science Foundation of China [grant number 32572139, 32572141] and the Science and Technology Innovation Program of Shaanxi Academy of Forestry [grant number SXLK2023–02–18].
Data Availability Statement
All data can be found in Section 2.2.
Acknowledgments
The authors thank the anonymous reviewers for the helpful comments that improved this manuscript.
Conflicts of Interest
The authors declare no conflicts of interest.
References
- Pörtner, H.-O.; Roberts, D.C.; Tignor, M.M.B.; Poloczanska, E.S.; Mintenbeck, K.; Alegría, A.; Craig, M.; Langsdorf, S.; Löschke, S.; Möller, V.; et al. (Eds.) Climate Change 2022: Impacts, Adaptation and Vulnerability. In Contribution of Working Group II to the Sixth Assessment Report of the Intergovernmental Panel on Climate Change; IPCC: Geneva, Switzerland, 2022. [Google Scholar]
- Pongratz, J.; Schwingshackl, C.; Bultan, S.; Obermeier, W.; Havermann, F.; Guo, S. Land Use Effects on Climate: Current State, Recent Progress, and Emerging Topics. Curr. Clim. Change Rep. 2021, 7, 99–120. [Google Scholar] [CrossRef]
- Seto, K.C.; Güneralp, B.; Hutyra, L.R. Global Forecasts of Urban Expansion to 2030 and Direct Impacts on Biodiversity and Carbon Pools. Proc. Natl. Acad. Sci. USA 2012, 109, 16083–16088. [Google Scholar] [CrossRef]
- Maestre, F.T.; Guirado, E.; Armenteras, D.; Beck, H.E.; AlShalan, M.S.; Al-Saud, N.T.; Chami, R.; Fu, B.; Gichenje, H.; Huber-Sannwald, E. Bending the Curve of Land Degradation to Achieve Global Environmental Goals. Nature 2025, 644, 347–355. [Google Scholar] [CrossRef]
- Ouyang, Z.; Zheng, H.; Xiao, Y.; Polasky, S.; Liu, J.; Xu, W.; Wang, Q.; Zhang, L.; Xiao, Y.; Rao, E.; et al. Improvements in Ecosystem Services from Investments in Natural Capital. Science 2016, 352, 1455–1459. [Google Scholar] [CrossRef]
- Yue, C.; Xu, M.; Ciais, P.; Tao, S.; Shen, H.; Chang, J.; Li, W.; Deng, L.; He, J.; Leng, Y.; et al. Contributions of Ecological Restoration Policies to China’s Land Carbon Balance. Nat. Commun. 2024, 15, 9708. [Google Scholar] [CrossRef]
- Liu, X.; Liang, X.; Li, X.; Xu, X.; Ou, J.; Chen, Y.; Li, S.; Wang, S.; Pei, F. A Future Land Use Simulation Model (FLUS) for Simulating Multiple Land Use Scenarios by Coupling Human and Natural Effects. Landsc. Urban. Plan. 2017, 168, 94–116. [Google Scholar] [CrossRef]
- Verburg, P.H.; Soepboer, W.; Veldkamp, A.; Limpiada, R.; Espaldon, V.; Mastura, S.S.A. Modeling the Spatial Dynamics of Regional Land Use: The CLUE-S Model. Environ. Manag. 2002, 30, 391–405. [Google Scholar] [CrossRef]
- Zhao, M.; He, Z.; Du, J.; Chen, L.; Lin, P.; Fang, S. Assessing the Effects of Ecological Engineering on Carbon Storage by Linking the CA-Markov and InVEST Models. Ecol. Indic. 2019, 98, 29–38. [Google Scholar] [CrossRef]
- Liang, X.; Guan, Q.; Clarke, K.C.; Liu, S.; Wang, B.; Yao, Y. Understanding the Drivers of Sustainable Land Expansion Using a Patch-Generating Land Use Simulation (PLUS) Model: A Case Study in Wuhan, China. Comput. Environ. Urban. Syst. 2021, 85, 101569. [Google Scholar] [CrossRef]
- InVEST|Natural Capital Project. Available online: https://naturalcapitalproject.stanford.edu/software/invest (accessed on 14 September 2025).
- He, C.; Zhang, D.; Huang, Q.; Zhao, Y. Assessing the Potential Impacts of Urban Expansion on Regional Carbon Storage by Linking the LUSD-Urban and InVEST Models. Environ. Model. Softw. 2016, 75, 44–58. [Google Scholar] [CrossRef]
- Jiang, W.; Deng, Y.; Tang, Z.; Lei, X.; Chen, Z. Modelling the Potential Impacts of Urban Ecosystem Changes on Carbon Storage under Different Scenarios by Linking the CLUE-S and the InVEST Models. Ecol. Model. 2017, 345, 30–40. [Google Scholar] [CrossRef]
- Shao, Z.; Chen, C.; Liu, Y.; Cao, J.; Liao, G.; Lin, Z. Impact of Land Use Change on Carbon Storage Based on FLUS-InVEST Model: A Case Study of Chengdu–Chongqing Urban Agglomeration, China. Land 2023, 12, 1531. [Google Scholar] [CrossRef]
- Zhou, J.; Johnson, V.C.; Shi, J.; Tan, M.L.; Zhang, F. Multi-Scenario Land Use Change Simulation and Spatial-Temporal Evolution of Carbon Storage in the Yangtze River Delta Region Based on the PLUS-InVEST Model. PLoS ONE 2025, 20, e0316255. [Google Scholar] [CrossRef]
- Fang, C.L.; Wang, Z.B.; Ma, H.T. The Theoretical Cognition of the Development Law of China’s Urban Agglomeration and Academic Contribution. Acta Geogr. Sin. 2018, 73, 651–665. [Google Scholar]
- Wang, Y.; Lin, N.; Gao, J.; Zou, C.; Xu, D. Impacts of China’s Western Development and Protection Strategy: An Ecosystem Services Perspective of Western China. Diversity 2022, 14, 863. [Google Scholar] [CrossRef]
- Wen, R.; Gao, Y.; Wu, Z.; Qian, H. Effects of Land Use Change on the Temporal and Spatial Pattern of Carbon Storage in Guanzhong Plain Urban Agglomeration. Chin. J. Eco-Agric. 2024, 32, 592–604. [Google Scholar] [CrossRef]
- Wang, R.; Wang, J.; Yan, J.; Jia, Y.; Gao, C.; Zhang, Q. Multi-Scenario Simulation of Landscape Ecological Vulnerability in the Yellow River Basin Based on GA-PLUS Model. Acta Ecol. Sin. 2025, 1–19. [Google Scholar] [CrossRef]
- Zhao, S.-H.; Zhou, D.-M.; Wang, D.-M.; Chen, J.-K.; Gao, Y.-J.; Zhang, J.; Jiang, J. Ecosystem Carbon Storage Assessment and Multi-Scenario Prediction in the Weihe River Basin Based on PLUS-InVEST Model. Ying Yong Sheng Tai Xue Bao J. Appl. Ecol. 2024, 35, 2044–2054. [Google Scholar]
- Yang, J.; Huang, X. The 30 m Annual Land Cover Dataset and Its Dynamics in China from 1990 to 2019. Earth Syst. Sci. Data 2021, 13, 3907–3925. [Google Scholar] [CrossRef]
- Changjun, G.; Yili, Z.; Linshan, L.; Bo, W.; Bohao, C.; Dianqing, G. Grassland Greenness Change and Its Response to Climate Change in Three River Headwater Region in 2000–2020. Geogr. Sci. 2025, 45, 214–226. [Google Scholar]
- Tian, R.; Zhao, Z.-Q.; Song, D.-Y. Identification of Ecological Restoration of Territorial Space Based on Ecosystem Degradation Risk and Ecological Security Pattern: A Case Study of the Chang-Zhu-Tan Metropolitan Area. Huan Jing Ke Xue Huanjing Kexue 2025, 46, 1608–1620. [Google Scholar] [PubMed]
- Zhang, D.C.; Liu, X.P.; Yao, Y.; Zhang, J.B. Simulating Spatiotemporal Change of Multiple Land Use Types in Dongguan by Using Random Forest Based on Cellular Automata. Geogr. Geo-Inf. Sci. 2016, 32, 29–36. [Google Scholar]
- Eastman, J.R. IDRISI Kilimanjaro: Guide to GIS and Image Processing; Clark Labs, Clark University Worcester: Worcester, MA, USA, 2003; Volume 328. [Google Scholar]
- Hu, W.; Li, G.; Gao, Z.; Jia, G.; Wang, Z.; Li, Y. Assessment of the Impact of the Poplar Ecological Retreat Project on Water Conservation in the Dongting Lake Wetland Region Using the InVEST Model. Sci. Total Environ. 2020, 733, 139423. [Google Scholar] [CrossRef]
- Wang, C.; Guo, X.; Guo, L.; Bai, L.; Xia, L.; Wang, C.; Li, T. Land Use Change and Its Impact on Carbon Storage in Northwest China Based on FLUS-Invest: A Case Study of Hu-Bao-Er-Yu Urban Agglomeration. Ecol. Environ. 2022, 31, 1667. [Google Scholar]
- Ran, Y.; Lei, D.; Liu, L.; Gao, L. Impact of Land Use Change on Ecosystem Service Value in Urban Agglomeration of Central Yunnan Province during 2000–2020. Bull. Soil Water Conserv. 2021, 41, 310–322. [Google Scholar]
- Sun, X.; Wang, S.; Xue, J.; Dong, L. Assessment and Simulation of Ecosystem Carbon Storage in Rapidly Urbanizing Areas Based on Land Use Cover: A Case Study of the Southern Jiangsu Urban Agglomeration, China. Front. Ecol. Evol. 2023, 11, 1197548. [Google Scholar] [CrossRef]
- Wu, W.; Xu, L.; Zheng, H.; Zhang, X. How Much Carbon Storage Will the Ecological Space Leave in a Rapid Urbanization Area? Scenario Analysis from Beijing-Tianjin-Hebei Urban Agglomeration. Resour. Conserv. Recycl. 2023, 189, 106774. [Google Scholar] [CrossRef]
- Legg, S. IPCC, 2021: Climate Change 2021—The Physical Science Basis; IPCC: Geneva, Switzerland, 2021. [Google Scholar]
Disclaimer/Publisher’s Note: The statements, opinions and data contained in all publications are solely those of the individual author(s) and contributor(s) and not of MDPI and/or the editor(s). MDPI and/or the editor(s) disclaim responsibility for any injury to people or property resulting from any ideas, methods, instructions or products referred to in the content. |
© 2026 by the authors. Licensee MDPI, Basel, Switzerland. This article is an open access article distributed under the terms and conditions of the Creative Commons Attribution (CC BY) license.