Abstract
To reveal the driving mechanisms of oxidative carbon components in urban forest soils in highly urbanized areas, this study collected 126 soil samples from the 0–30 cm layer of typical urban forests in Shenzhen, China. Soil organic carbon (SOC) was classified into four fractions based on oxidation stability: highly oxidizable organic carbon (VAC), moderately oxidizable organic carbon (AC), poorly oxidizable organic carbon (PAC), and inert oxidizable organic carbon (IAC). Integrating multi-source data on climate, topography, vegetation, soil, and urbanization, we adopted a synergistic multi-model approach to screen key drivers, identify nonlinear thresholds, and quantify pathway contributions, thereby systematically exploring the dominant characteristics and driving mechanisms of soil carbon components under urbanization. The results showed that (1) urban forest soils in Shenzhen were dominated by reactive carbon, with VAC accounting for the highest proportion of SOC, and the proportion of reactive organic carbon was significantly higher than that of recalcitrant organic carbon; (2) SOC and total nitrogen (TN) were the core driving factors of carbon fractions, and the number of regulatory factors increased with the enhancement of carbon fraction oxidation stability; (3) soil factors directly affected carbon fractions, while urbanization indirectly acted on inert carbon by altering vegetation characteristics. Based on the research results, urban soil and forest managers can implement zonal management for carbon fractions with different oxidation stabilities, which is expected to effectively enhance the carbon sink capacity and stability of urban forest soil carbon pools, providing practical support for ecological sustainable development.
1. Introduction
Urbanization has emerged as a key feature of global development since the 20th century. By 2050, the global urban population is projected to increase by 2.5 billion, with the spatial extent of urban areas expected to triple [1]. As core components of urban ecosystems, urban forests play crucial roles in regulating regional carbon cycles, mitigating heat island effects, and maintaining ecological stability [2]. Among these, soil organic carbon (SOC) is a vital component of the terrestrial carbon pool in urban forests. Its dynamic changes directly influence ecosystem services, including nutrient cycling and soil fertility [3,4]. In contrast to natural forests, urban forest soils are subject to intense human disturbance. The dual effects of urban processes (e.g., building material inputs [5], litter removal [6], and nitrogen deposition [7]) and unique urban microclimates substantially alter the composition and stability of soil carbon pools [8,9]. An important but inadequately investigated area in contemporary research is the differentiation mechanism of oxidizable organic carbon fractions, highly oxidizable organic carbon (VAC), moderately oxidizable organic carbon (AC), poorly oxidizable organic carbon (PAC), and inert oxidizable carbon (IAC), all of which differ in decomposition rates and ecological functions. Reactive organic carbon (ROC), composed of VAC and AC, drives short-term soil biogeochemical processes, whereas inert organic carbon (RDOC), comprising PAC and IAC, determines long-term carbon sequestration capacity [10,11]. Therefore, elucidating the spatial patterns and driving mechanisms of these components in highly urbanized regions is essential to optimize urban carbon management and enhance ecosystem resilience.
Existing research on soil carbon in urban ecosystems has made substantial progress; however, notable gaps remain. First, most studies have focused on total organic carbon or inorganic carbon, overlooking the differentiation of oxidized carbon fractions. Research has identified the impact of urbanization on SOC reserves in U.S. cities; however, it has not analyzed differences in carbon fraction stability [12]. The convergence of urban soil carbon content fails to account for the functional differences between active and inert components [13]. This limits our understanding of the unique characteristics of urban carbon cycles. Different oxidized components respond distinctly to environmental changes. For instance, the active carbon fraction is more sensitive to environmental changes than total organic carbon. In addition, particulate organic carbon decreases substantially under warming conditions, whereas it increases markedly with rising CO2 concentrations [14]. Second, traditional analytical methods (e.g., linear regression) are inadequate for capturing nonlinear relationships and threshold effects between driving factors and carbon components. Although machine learning tools, such as random forest (RF), have been employed for key factor screening [15,16], limited studies have combined RF with generalized additive models (GAMs) or partial least squares structural equation modeling (PLS-SEM) to quantify threshold effects or analyze direct and indirect driving pathways, respectively [17]. Moreover, recent studies highlight the influence of urbanization on soil carbon dynamics and predominantly focus on macro-level factors, such as gross domestic product [12], population density [18], and nighttime light indices [5,13], while neglecting its indirect effects on inert carbon through altered vegetation characteristics. Litter removal affects SOC dynamics; however, it does not link anthropogenic activities to vegetation-mediated changes in carbon fractions [6]. Currently, research on subtropical urban forests is limited. The high-temperature and high-humidity conditions in these regions accelerate carbon decomposition [19], and the unique mechanisms governing their oxidized carbon fractions remain unexplored.
In this study, we examined the influencing factors and driving mechanisms of oxidized carbon components in urban forest soils in Shenzhen. Specifically, we aimed to answer three core scientific questions: (1) Which carbon component oxidation state accounts for the highest proportion of SOC in Shenzhen’s urban forest soils? What is the relationship between the proportions of ROC and RDOC? (2) What are the key drivers of carbon fractions across different oxidation states? Do the number and importance of drivers vary with the increasing oxidation stability of carbon fractions? (3) What is the interaction between direct and indirect driving pathways for soil oxidized carbon fractions? Based on the research objectives, we propose three verifiable hypotheses: H1: Urban forest soils in subtropical regions are dominated by reactive carbon, and the higher the oxidation stability of carbon fractions, the more complex the number of regulatory factors; the spatial variability of recalcitrant carbon is significantly higher than that of reactive carbon. H2: The driving effects of SOC and TN on highly reactive carbon fractions exhibit nonlinear threshold effects, while their driving effects on recalcitrant carbon fractions are synergistically regulated by urbanization factors and vegetation factors. H3: Urbanization does not directly affect soil carbon fractions but indirectly acts on recalcitrant carbon by altering vegetation coverage and net primary productivity, and this pathway plays a more significant role in deep soil. To address these questions, we collected 126 soil samples (0–10 cm and 10–30 cm) and integrated multi-source data (e.g., climatic, topographic, vegetation, soil, and urbanization factors). We employed a multi-model approach: RF-recursive feature elimination (RF-RFE) for screening key drivers; GAMs for identifying nonlinear thresholds; and PLS-SEM for analyzing direct and indirect pathways. This approach is expected to reveal the synergistic interactions among climate, topography, vegetation, soil, and urbanization factors in the spatial variations in oxidized carbon components, thereby offering novel insights and establishing a methodological foundation for the precise management of urban forest soil carbon.
2. Materials and Methods
2.1. Study Area
Shenzhen City is located on the southern coast of Guangdong Province, south of the Tropic of Cancer (114°37′21″ E, 22°26′59″ N). This region is among the most developed and urbanized in China. The study area had a typical subtropical maritime climate, characterized by an annual average temperature of 23.2 °C and abundant rainfall, with annual precipitation averaging 1932.9 mm. Its topography was diverse and dominated by low mountains and hills, succeeded by terraces and coastal plains. The highest peak within the region, Wutong Mountain, reached an elevation of 944 m. The soil profile consisted of 10 major soil types and 15 subtypes, including lateritic, yellow, red, and coastal sandy soils. The primary parent materials for soil formation were granite and sandy shale. Osmanthus soil was distributed in hilly and sloping areas at elevations below 300 m. Red soil predominantly occupied the middle to upper sections of mountains ranging from 300 to 600 m in elevation, while yellow soil primarily occurred in the middle to upper reaches of low mountains exceeding 600 m in elevation. The zonal vegetation consisted of coastal subtropical monsoon evergreen broad-leaved forests (Figure 1).
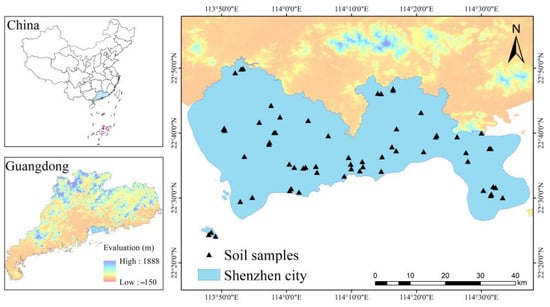
Figure 1.
Sample distribution and elevation maps of the study area.
2.2. Soil Sample Collection and Laboratory Analysis
Based on topographic maps and vegetation distribution patterns, the study area was systematically subdivided, and 126 soil samples were collected in the field. Global positioning system (GPS) coordinates, elevation, vegetation type, and additional data were recorded for each sampling point. In situ air-dried soil samples were crushed and sieved through a 1 mm mesh to assess soil pH and electrical conductivity (EC). This was followed by sieving through a 0.25 mm mesh to evaluate soil SOC and TN. Soil pH was measured using a composite electrode (PE-10, Sartorius, Göttingen, Germany) [20] at a soil-to-liquid volume ratio of 1:2.5. Soil EC was measured using a conductivity meter (DDS-11A, Shanghai Laixi Xinjing Instrument Co., Ltd., Shanghai, China) with a soil-to-distilled water suspension ratio of 1:5. SOC content was determined using the concentrated sulfuric acid-potassium dichromate method [21]. Following sulfuric acid digestion, soil total nitrogen (TN) was quantified using the semi-micro Kjeldahl method [21]. The aggregate particle size distribution was determined using the dry sieve method [21]. For each determination, 250 g of air-dried soil was weighed and placed on the top layer of the sieve set. Sieves with apertures of 10, 5, 3, 2, 1, 0.5, and 0.25 mm were sequentially placed. The sieve set was placed on a vibrating screen and shaken for 10 min, after which the soil retained on each sieve was weighed. Given that overly fine initial classification might obscure key ecological correlations, soil aggregates were ultimately grouped into three functional categories (>1 mm, 0.25–1 mm, and <0.25 mm) based on Pearson correlation analyses of each particle size fraction with SOC, TN, and carbon-to-nitrogen (C/N) ratio. The mean weight diameter (MWD) and geometric weight diameter (GWD) were calculated from aggregate masses obtained through dry sieving. SOC content was determined using Chan’s modified method [10]. Briefly, 0.2–0.5 g soil samples were placed in 250 mL conical flasks. Subsequently, 10 mL of 0.167 mol/L K2Cr2O7 and 5, 10, or 20 mL concentrated sulfuric acid were added to achieve final acidities of 6, 9, or 12 mol/L. Following the reaction, samples were titrated with 1.0 mol/L FeSO4 to obtain four fractions with progressively decreasing oxidizability:
- VAC = 6 mol/L H2SO4 oxidizable organic carbon;
- AC = 9 mol/L H2SO4 oxidizable organic carbon—6 mol/L H2SO4 oxidizable organic carbon;
- PAC = 12 mol/L H2SO4 oxidizable organic carbon—9 mol/L H2SO4 oxidizable organic carbon;
- IAC = SOC—12 mol/L H2SO4 oxidizable organic carbon;
- ROC = VAC + AC;
- RDOC = PAC + IAC.
2.3. Acquisition of Data on Potential Driving Factors
Data were collected to investigate the key variables that account for spatial variations in oxidized carbon components (VAC, AC, PAC, and IAC) across various soil depths in Shenzhen’s urban forest. These data encompassed climate (annual mean temperature and annual mean precipitation), vegetation (normalized vegetation index, net primary productivity, and vegetation cover), and urbanization (nighttime light index, gross domestic product, population density, and distance from city center) factors. For specific details, please refer to Table A1.
2.4. Data Analysis
Microsoft Excel 2021 was used for data processing, while SPSS software (version 27.0) was employed for statistical analysis. Modeling was performed using R (version 4.4.3). The “Randomforest” and “caret” packages were employed to implement RF recursive feature elimination [22]; the “plspm” package [23] was used to construct PLS-SEMs; the “mgcv” package [24] was employed to build GAMs.
2.4.1. Random Forest-Recursive Feature Elimination
The key drivers controlling spatial variation in soil oxidized organic carbon components were investigated. When screening features, a correlation coefficient of ≥0.9 was established to eliminate highly correlated independent variables [25]. The five-fold cross-validation method was repeated ten times using root mean square error (RMSE) as the criterion to identify the most important variables associated with the lowest RMSE. This approach successfully reduced dimensionality for factors contributing to spatial variation in oxidized organic carbon components across various soil depths, thereby identifying the characteristic variables influencing these components.
2.4.2. Generalized Additive Models
GAMs are nonparametric statistical analysis methods based on generalized linear and additive model principles. This model can objectively express both linear and nonlinear relationships between explanatory and response variables [26]. For each carbon fraction, the key factors identified by RF-RFE were used as predictors. Model fitting goodness was evaluated by adjusted R2, and threshold points were determined by identifying inflection points in the smooth curves.
2.4.3. Partial Least Squares Structural Equation Modeling
PLS-SEM effectively identifies complex relationships among factors, conducts factor analysis within the model to explain the relationships between latent and observed variables, and screens out the primary drivers of changes in soil oxidized carbon components. This model employs path diagrams in the structural model to illustrate the relationships among latent variables. After multiple fitting analyses and debugging, we constructed a PLS-SEM that included the following variables: climate, vegetation, topography, urbanization, and soil factors. Model accuracy was assessed using goodness-of-fit indices (GoF), loadings (Loading), and p-values. A GoF ≥ 0.36 indicated a strong fit [17], with a loading threshold of 0.7. Statistical significance was set at p < 0.05 [27].
3. Results
3.1. Distribution Characteristics of Oxidative Carbon Components in Urban Forest Soils
Urban forest soil in Shenzhen exhibits an overall spatial pattern dominated by active carbon, as reflected in SOC and its oxidation-stable fractions (VAC, AC, PAC, and IAC). Analyzing carbon fraction composition across soil layers (Table 1 and Table 2), the 0–10 cm topsoil contained an average SOC of 18.32 g·kg−1 (range: 3.18–33.81 g·kg−1). Within this, VAC was the largest fraction, accounting for 52.84% of total SOC (average: 9.33 g·kg−1). The average proportion of ROC was 74.23% (13.25 g·kg−1), significantly higher than the 24.06% (4.31 g·kg−1) of RDOC. The order of component abundance was as follows: VAC > AC > IAC > PAC. SOC content in the 10–30 cm soil layer decreased significantly, averaging merely 8.98 g·kg−1. However, the dominance of active carbon persisted, with VAC remaining the largest component (50.62% of SOC, averaging 4.66 g·kg−1). ROC accounted for 72.81% (6.69 g·kg−1), substantially higher than RDOC at 26.62% (2.18 g·kg−1). Vertically, all carbon fractions exhibited a decreasing trend with increasing soil depth, with reductions ranging from 40% to 52%. VAC showed the largest decrease. This reflects a clear “carbon enrichment effect” in the topsoil layer due to processes, such as litter input and root exudate accumulation, making it the core layer for carbon storage in urban forest soils. Regarding spatial variability, all carbon fractions exhibited moderate to high variability (CV > 30%), with differing depth and stability patterns. In the 0–10 cm layer, IAC had the highest CV (57.89%), indicating greater susceptibility of surface inert carbon to local disturbances (e.g., human activities and vegetation cover variations). In the 10–30 cm deep soil layer, AC had the highest CV (57.14%), suggesting that deep-soil AC is more sensitive to regional heterogeneity. Overall, the high proportion of active carbon indicated that Shenzhen’s urban forest soil carbon pool predominantly consisted of readily decomposable and rapidly cycling forms of carbon. While these provide readily available carbon sources for vegetation growth, they also reduce carbon pool stability. Conversely, the high variability in inert carbon reflects substantial spatial differences in long-term carbon sequestration regulation by the local environment.

Table 1.
Descriptive Statistics of Oxidative Carbon Components in Urban Forest Soils.
Table 2.
Percentage of Each Component of Easily Oxidizable Organic Carbon in Total Organic Carbon.
3.2. Screening and Prioritization of Key Driving Factors
To ensure model accuracy and efficiency, the number of independent variables was selected based on the criterion of achieving the lowest RMSE. After screening (Figure 2), the final feature variable counts used for modeling VAC, AC, PAC, and IAC in the 0–10 cm soil layer were 2, 2, 2, and 5, respectively. To model VAC, AC, PAC, and IAC in the 10–30 cm soil layer, the feature variable counts were 2, 3, 5, and 5, respectively. These results show that core soil properties have significant correlation with carbon fractions, which lays a foundation for further verifying their causal roles through subsequent PLS-SEM analysis.
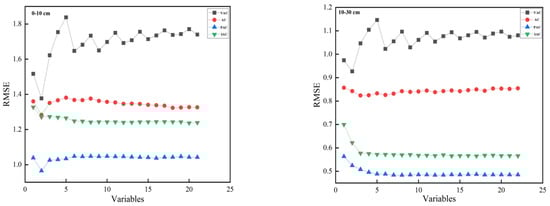
Figure 2.
Feature Variable Screening Results.
Analysis of the 0–10 cm surface soil layer (Figure 3) revealed highly consistent key drivers for VAC, AC, and PAC, all relying solely on SOC and TN. The importance ranking consistently showed that SOC > TN, indicating that the dynamics of easily oxidizable carbon fractions are primarily associated with the immediate supply of soil carbon and nitrogen pools. These fractions exhibit rapid turnover and respond directly to environmental changes. In contrast, the key drivers for the difficult-to-oxidize IAC fraction expanded to five factors (SOC, TN, EC, C/N, and NPP), with SOC and TN still dominating. This indicates that IAC accumulation shows associations not only on carbon and nitrogen pools but also on salinity conditions (EC), C/N balance, and vegetation carbon input (NPP). This highlights the high sensitivity of refractory carbon components to environmental heterogeneity. In the 10–30 cm soil layer (Figure 4), the dominance of core factors remained unchanged; however, the regulatory network became more complex with increasing depth. For VAC, SOC and TN continued as the key factors that maintained the regulatory characteristics of highly active carbon in the surface layer. For AC, a new key factor, “distance from city center (DM),”—emerged, indicating that AC in deeper layers also shows an association with urbanization gradients. The key factors for PAC were expanded to five [TN, SOC, population density (POP), nighttime lighting index (NL), and FVC], with the importance ranking shifting to TN > SOC. This indicates that in regulating low-activity carbon in deeper layers, the role of nitrogen accumulation surpasses that of the carbon pool itself, while simultaneously incorporating the synergistic effects of urbanization disturbance and vegetation cover. The key drivers for IAC include TN, SOC, elevation (ELE), FVC, and POP, further demonstrating that refractory carbon in deep soils simultaneously responds to the combined effects of topography, vegetation, and urbanization. Overall, regardless of soil depth, SOC and TN remained the core drivers for all carbon fractions, which is consistent with the fundamental nature of urban forest soil carbon cycling being “grounded in soil properties.” As the carbon fraction oxidation stability increased from VAC to IAC, the number of key drivers increased from two or three to five, progressively incorporating urbanization factors (POP, NL, and DM), vegetation factors (FVC and NPP), and topography factors (ELE). Stable accumulation of refractory carbon fractions requires the synergistic action of multiple processes, including physical protection, chemical transformation, and vegetation input. Consequently, the more complex logic of regulatory factors highlights the stronger coupling of natural and anthropogenic disturbances affecting deep-soil carbon fractions.
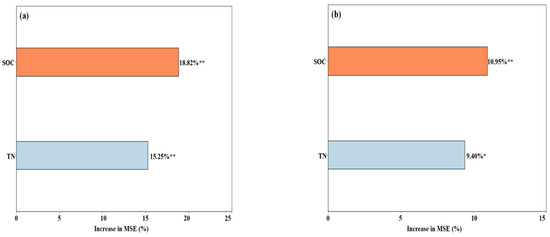
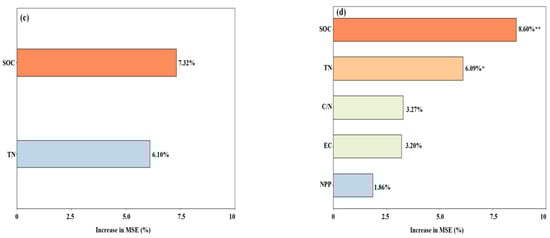
Figure 3.
Relative Importance of Environmental Factors in the 0–10 cm Soil Layer. Note: Panels (a–d) represent the relative importance of environmental factors on VAC, AC, PAC, and IAC, respectively, in the 0–10 cm soil layer. p-values are: * p < 0.05; ** p < 0.01.
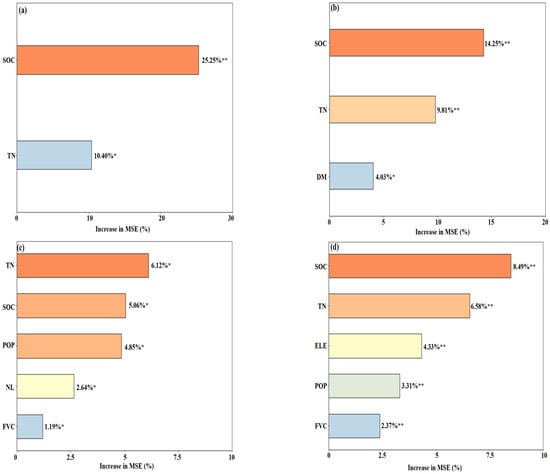
Figure 4.
Relative Importance of Environmental Factors in the 10–30 cm Soil Layer. Note: Panels (a–d) represent the relative importance of environmental factors on VAC, AC, PAC, and IAC, respectively, in the 10–30 cm soil layer. p-values are: * p < 0.05; ** p < 0.01.
3.3. Analysis of Environmental Factor Threshold Effects and Urbanization Responses Based on GAMs
Further analysis using GAMs revealed nonlinear relationships and threshold effects between soil carbon components at varying depths, oxidative stability in Shenzhen’s urban forests, and environmental factors. For the 0–10 cm topsoil layer (Figure 5), the influence of the core soil factors exhibited significant nonlinear characteristics. SOC showed a “saturation threshold” association with VAC: when SOC was below 29 g·kg−1, VAC increased with rising SOC; once this threshold was exceeded, VAC sharply declined. This indicates that after the physical protection sites in the active carbon pool are depleted, additional carbon accelerates VAC mineralization through an excitation effect. In contrast, TN exhibited fluctuating associations with VAC, reflecting the complex interactions of nitrogen with acidification and microbial activity in urban environments. For the less active PAC and difficult-to-activate IAC, SOC and TN primarily influenced these components linearly. However, IAC was additionally regulated by thresholds for EC and NPP: when EC = 0.1 dS/cm, IAC decreased significantly due to enhanced microbial activity and aggregate disintegration; NPP reached the peak IAC value at 683.71 and dropped to its lowest at 991.81, demonstrating the critical role of balancing vegetation carbon input and microbial decomposition in inert carbon accumulation. In the 10–30 cm deep soil layer (Figure 6), factor effect patterns aligned more closely with the coupling characteristics between urbanization gradients and deep carbon cycling. SOC and TN exhibited linear relationships with VAC and AC, with SOC exerting stronger driving effects on both, thereby indicating that the dynamics of easily oxidizable carbon components in deeper layers depend more on the fundamental supply of soil carbon and nitrogen pools. The threshold effects of urbanization-related factors became prominent: DM reached its minimum at 29,530 m, where AC dropped to its lowest value, reflecting stronger consumption of AC in deeper layers in suburban areas. NL exhibited alternating peaks and troughs in its influence on PAC, peaking at 30.11 and bottoming out at 52.59, illustrating how urbanization intensity disrupted the physical protection of low-activity carbon. Additionally, FVC demonstrated divergent effects: it linearly promoted PAC but showed a “peak threshold” for IAC. IAC peaked at FVC = 82.58% and declined thereafter. This indicates that moderate vegetation cover promotes inert carbon accumulation by lowering the soil temperature and enhancing aggregate protection; however, excessive cover may diminish this effect owing to root exudate-induced decomposition.
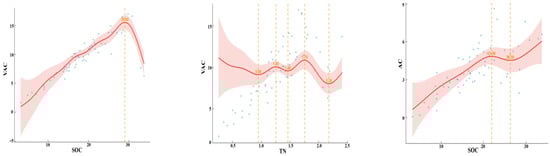
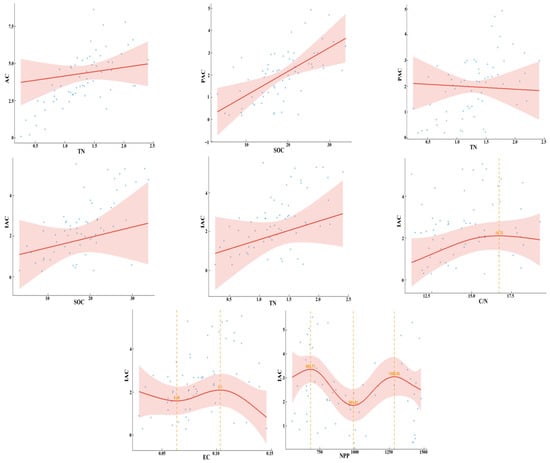
Figure 5.
Fit of soil oxidized carbon components in the 0–10 cm soil layer with environmental factors. Note: The x-axis represents key driving factors, and the y-axis represents carbon fraction content; the shaded area denotes the 95% confidence interval, characterizing the statistical reliability of model fitting.
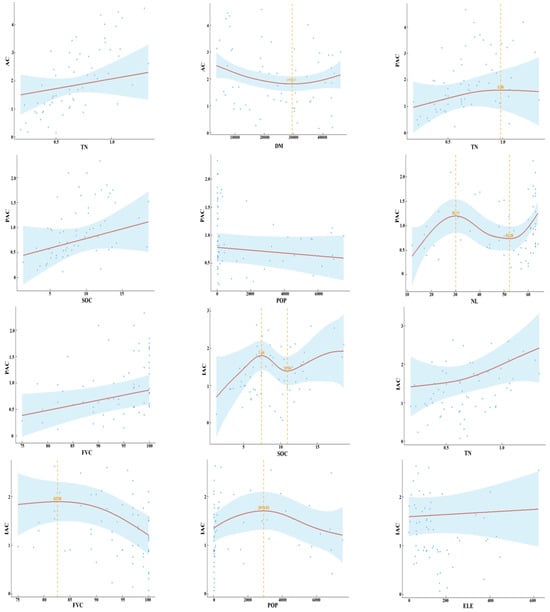
Figure 6.
Fit of oxidized carbon components in the 10–30 cm soil layer with environmental factors. Note: The x-axis represents key driving factors, and the y-axis represents carbon fraction content; the shaded area denotes the 95% confidence interval, characterizing the statistical reliability of model fitting.
3.4. Analysis of Driving Pathways for Oxidative Carbon Components in Urban Forest Soils Based on PLS-SEM
We used PLS-SEM to separate and decouple the indirect and direct effects of factors influencing oxidized carbon components in urban forest soils. As illustrated in Figure 7, the soil factors exerted the strongest direct influence on the oxidized carbon components in both soil layers, with all path coefficients being positive. At the 0–10 cm soil depth, topography exerted a significant direct negative effect on the VAC fraction. Precipitation and topography indirectly influenced soil carbon fractions by affecting soil SOC and TN content. Urbanization directly affected vegetation cover and productivity, although surface vegetation had no significant effect on carbon fractions. At 10–30 cm soil depth, human activity and vegetation factors directly influenced PAC, whereas topography directly impacted VAC, both with positive effects. Vegetation factors exerted a direct negative influence on IAC. The strong direct positive effect of soil factors on carbon fractions means that urban green space management should prioritize maintaining the balance of soil carbon and nitrogen supply, laying the foundation for labile carbon accumulation and recalcitrant carbon sequestration. Urbanization indirectly inhibits recalcitrant carbon accumulation by altering vegetation characteristics, suggesting that it is necessary to reasonably control urbanization intensity and protect vegetation coverage and productivity to maintain long-term stability of soil carbon pools. Topography indirectly affects carbon fractions by regulating hydrothermal conditions, providing practical basis for utilizing topographic optimization to enhance carbon sink potential in urban green space planning. Overall, soil factors were the dominant drivers of oxidized carbon components in urban forest soils. Human factors indirectly influenced carbon components by affecting net primary productivity and vegetation cover. Topography indirectly influenced the soil carbon components by affecting vegetation and soil properties.
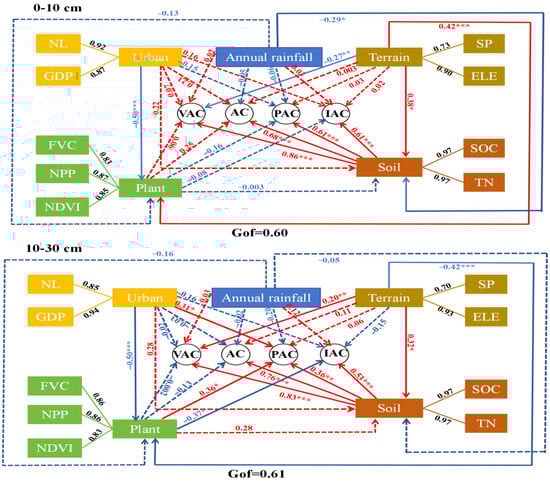
Figure 7.
Relationships between environmental, urbanization, vegetation, topographic, and soil factors and soil oxidized carbon components in urban forest soils based on partial least squares structural equation modeling. Numbers on arrows are for effect sizes; a solid line indicates a significant effect, a dashed line indicates no significant effect; red indicates a positive effect, blue indicates a negative effect. p-values are: * p < 0.05; ** p < 0.01; *** p < 0.001.
4. Discussion
4.1. Key Features and Ecological Significance of Oxidative Carbon Components in Urban Forest Soils
SOC components were classified into four groups based on their oxidation susceptibility. These components reflect the compositional characteristics and state of SOC, essential for understanding its storage and dynamic changes [28]. This study revealed the significant active dominance of oxidized carbon components in the highly urbanized forest soils in the southern subtropics. In the 0–10 and 10–30 cm soil horizons, VAC constituted 52.84% and 50.62% of total organic carbon, respectively, while active organic carbon accounted for 72.81% and 74.23%, significantly exceeding the 24.06% and 26.62% attributed to RDOC, respectively. This suggests that the urban forest soil carbon pool is dominated by readily decomposable and rapidly cycling active carbon. Surface soils exhibit pronounced carbon enrichment resulting from carbon inputs (e.g., litterfall and root exudates) and cumulative effects [21]. Vertically, the content of each component decreased by 40–52% with increasing soil depth, thereby reinforcing the central role of surface soils in carbon cycling. The high proportion of active carbon serves as the primary energy and nutrient source for microorganisms [29], thereby enhancing biological activity in the soil and providing readily available carbon for vegetation growth. However, this also implies reduced carbon pool stability, rendering it susceptible to human disturbances and climate change impacts. As a potential substrate for methane emissions, high VAC concentrations may enhance the greenhouse gas emission potential of urban forest soils, warranting targeted attention in carbon management. In contrast, although inert carbon components constitute a smaller proportion, they consist of humified organic matter [10], which serves as the core carrier of long-term carbon sequestration. Their spatial distributions and regulatory mechanisms are crucial for maintaining the long-term stability of urban carbon pools. The divergence between our findings and those of natural ecosystems highlights the uniqueness of urban environments. Compared with agroforestry or wetland ecosystems, Shenzhen’s extensive urbanization has substantially altered the carbon fraction balance through anthropogenic disturbances. Metal ions (e.g., Fe and Al) precipitate upon binding with PAC, potentially promoting its conversion to a more stable IAC [30]. Meanwhile, the high temperature and humidity of subtropical climates accelerate organic carbon decomposition, thereby further reinforcing the dominance of active carbon. The high coefficient of variation (38.05–48.50%) for VAC and its nonlinear relationship with SOC indicate that VAC can serve as a sensitive indicator of soil carbon quality variation in urban forests. This supports the conclusion that “VAC can monitor SOC quality in agricultural systems” [19]; RDOC demonstrates higher temperature sensitivity than active organic carbon. The subtropical monsoon climate of Shenzhen features high temperatures and humidity levels. Elevated temperatures accelerate SOC decomposition, forming unstable organic carbon fractions [31]. This leads to a higher proportion of oxidizable organic carbon relative to that of RDOC.
4.2. Nonlinear Mechanism of Soil Oxidized Carbon Components Influenced by Multiple Synergistic Factors
We employed a multimethod approach to reveal the nonlinear mechanism of the synergistic regulation by multiple factors on the oxidized carbon fraction in urban forest soils. The stability of soil carbon fractions is influenced by both individual factors and the synergistic balance of multiple factors across various spatial scales and processes, thereby providing new insights into carbon pool dynamics in urban environments. The characteristics of core drivers indicate that highly oxidizable carbon fractions (VAC and AC) are primarily regulated by two to three key factors, whereas the IAC fraction is influenced by five factors. The observed difference arises from the dynamics of easily oxidizable components, which are primarily influenced by the immediate supply from soil carbon and nitrogen pools. These components exhibit shorter turnover cycles and more direct responses to environmental changes. In contrast, the accumulation of difficult-to-oxidize components requires the synergistic action of multiple processes, including physical protection, chemical transformation, and vegetation input, to withstand frequent disturbances in urban environments, thereby necessitating the involvement of additional regulatory factors [32]. Vegetation factors greatly influence the vertical distribution of organic carbon [33,34], and RF analysis indicates that vegetation cover, as a vegetation factor, influences the inert carbon fraction in the 10–30 cm soil profile. Vegetation cover reduces soil temperature via canopy shading, which subsequently inhibits deep microbial decomposition [35]. The GAMs further revealed the nonlinear threshold effect of factor interactions, which is a key characteristic of multi-factor synergism in urban environments. The influence of SOC on VAC exhibited a “saturation effect”: in the 0–10 cm soil layer, VAC increased with rising SOC but declined sharply when SOC reached 29 g·kg−1. Consistent with carbon saturation theory [36], once the physical protection sites within the active carbon pool are exhausted, the newly added carbon cannot be stably stored. Instead, it accelerates VAC mineralization via an excitation effect, facilitating its conversion into inert components. The multi-peak response pattern of TN to VAC reflects the compound pressures exerted by the urban environment. Nitrogen serves as the primary limiting factor in natural terrestrial ecosystems [37]. Under low TN conditions, microorganisms accelerate VAC decomposition through the “nitrogen mining” mechanism to obtain nitrogen sources [38]. However, when TN is between 1.75 and 2.18 g·kg−1, nitrification decreases soil pH and inhibits microbial activity, thereby intensifying respiratory consumption of VAC. This demonstrates the synergistic effects of nitrogen and urban environmental factors, including acidification. Nitrogen addition reduces carbon output, inhibits carbon decomposition, and promotes stable soil carbon accumulation [39]. Fitting curves reveal that increased total nitrogen content correlates with higher inert carbon fractions [40]. The nonlinear effect of EC on IAC reflects dual salt regulation: at low salinity, enhanced microbial activity and aggregate disintegration expose and decompose IAC; moderate EC promotes physical protection by enhancing clay-organic matter complex formation, which contributes to IAC accumulation; and high salinity induces sodium ion disruption of aggregate stability, resulting in renewed IAC loss [41]. Overall, the nonlinear threshold effects revealed by the GAMs represent a core characteristic governing the regulation of soil carbon components in urban forests. On the one hand, the influence of key soil factors shifts from nonlinear saturation to a linear drive as the carbon component activity decreases, reflecting the relationship between carbon stability and factor action patterns. On the other hand, the threshold effects of urbanization and vegetation factors highlight the varying impacts of urban environmental gradients on carbon components. The observed patterns elucidate the correlation between higher oxidation stability of carbon components and the complexity of regulatory factors, while also establishing quantitative foundations for future precision carbon management.
PLS-SEM clarified the direct and indirect pathways influencing the factors. Soil factors (SOC and TN) had significant direct effects on all oxidized carbon components, serving as core regulators. Precipitation influenced carbon components by regulating soil SOC and TN content. Shenzhen, characterized by a subtropical monsoon climate with abundant rainfall, experiences high-intensity precipitation that reduces soil SOC and TN reserves through two pathways: physical erosion-leaching and aggregate destruction. Rainfall runoff causes particulate organic carbon loss, whereas dissolved organic carbon migrates to deeper soil layers. Short-term flooding induces anaerobic conditions that reduce carbon mineralization while promoting denitrification, resulting in TN loss [6]. Furthermore, rainfall decreases the proportion of large soil aggregates, reducing their protective function for organic carbon and consequently decreasing soil carbon and nitrogen contents [42]. Although rainfall decreases soil carbon and nitrogen contents, SOC increases extracellular enzyme activity, thereby accelerating the transformation of active carbon fractions. TN increases microbial biomass carbon by reducing the soil C/N ratio [43]. Urbanization factors indirectly affect inert carbon fractions by altering vegetation characteristics; increased urbanization intensity reduces the physical protection of PAC by disrupting the aggregate structure. Elevation [44] and slope [45] indirectly influence SOC and TN accumulation by regulating local hydrothermal conditions, thereby affecting the carbon fractions. This “direct soil-driven–indirect human-regulated” pathway reflects the deep coupling between natural processes and human disturbances in urban ecosystems [13]. The findings of this study not only align with the fundamental principles governing carbon fraction regulation in natural ecosystems but also highlight the unique characteristics of urban environments. The soil VAC fraction can serve as an indicator of SOC quality in agricultural systems [29]. This study indicates that the high coefficient of variation (38.05–48.50%) of VAC in urban forests, along with its nonlinear relationship with SOC, renders it a sensitive indicator of urban soil carbon quality variation, thereby broadening the application scenarios of the VAC fraction. Furthermore, in contrast to natural ecosystems, anthropogenic inputs, such as salts and pollutants, in urban environments increase regulatory complexity. This introduces urban-specific factors into the driving network of highly stable components, aligning with the conclusion that “urban soil carbon cycling is dominated by human disturbance [9].”
4.3. Theoretical Implications and Limitations of Urban Forest Soil Carbon Management
The multi-factor synergistic driving mechanism of soil carbon components in urban forests, revealed in this study, provides critical scientific support for integrating urban green space systems into cross-sectoral decarbonization and sustainable development strategies. As core hotspots of global carbon emissions, cities must rely on comprehensive solutions combining sectoral emission reductions (e.g., energy transition, transportation electrification) and ecosystem carbon sequestration to achieve carbon neutrality [46]. This research confirms that urban forest soils—particularly the recalcitrant carbon fractions—serve as manageable terrestrial carbon sinks. Through targeted management (e.g., regulating SOC and TN supply for reactive carbon, and protecting soil aggregates with optimized vegetation cover for inert carbon), these sinks can become a core component of urban nature-based solutions [47], complementing industrial emission reduction efforts.
The strategic significance of urban soil carbon sink management lies in dual values: first, compared with technological emission reduction, natural carbon sinks offer higher cost-effectiveness and broader co-benefits—maintaining appropriate fractional vegetation cover not only promotes inert carbon accumulation but also mitigates urban heat islands and enhances human well-being; second, soil carbon pools exhibit long-term sequestration potential, which can offset unavoidable emissions from infrastructure and certain industrial processes, providing buffer time and flexibility for cities to achieve net-zero goals. This necessitates incorporating soil carbon sink functions as explicit assessment and protection indicators in policies such as green space planning and ecological redline management.
Drawing on the cross-sectoral decarbonization portfolio framework, we propose a zoned-classified-collaborative management framework for Shenzhen and similar cities, to be integrated into urban climate action plans: (1) Zoned management: Formulate differentiated soil carbon goals based on urbanization gradients, prioritize protecting high-carbon soils during urban renewal, and adopt carbon-friendly green space standards in new developments. (2) Classified measures: Focus on nutrient cycle management in reactive carbon-dominated areas, and emphasize soil structure protection and disturbance minimization in inert carbon key areas. (3) Collaborative advancement: Link soil carbon management with existing initiatives such as sponge city development and park city construction, to achieve multiple objectives of enhanced carbon sequestration, improved climate resilience, and optimized ecosystem services.
Additionally, the generalizability of this study’s conclusions is constrained by Shenzhen-specific contexts—including 100% urbanization-driven high-intensity disturbances, red soils derived from granite parent material, and the southern subtropical climate—precluding direct extension to non-subtropical or low-urbanization regions. However, the constructed multi-model integrated analysis framework, oxidation stability-based carbon fraction classification, and standardized observation methods are transferable to similar subtropical megacities (e.g., Guangzhou, Bangkok), with broader generalizability to be further enhanced through future cross-regional validation.
5. Conclusions
In this study, we investigated the spatial patterns and driving mechanisms of carbon components with varying oxidation states in urban forest soils in Shenzhen City using a multi-model approach. The key findings are as follows:
(1) Urban forest soils in Shenzhen exhibit pronounced active carbon dominance. In both the 0–10 and 10–30 cm soil layers, VAC constituted the largest proportion of SOC, while ROC accounted for a higher proportion than RDOC. The contents of all carbon fractions exhibited a vertical decline with increasing soil depth and exhibited moderate to high spatial variability.
(2) Soil factors (SOC and TN) were the core drivers of carbon fractions with varying oxidation states. The number of regulatory factors significantly increased as the oxidation stability of the carbon fractions increased. Highly reactive components (VAC and AC) are primarily regulated by two to three factors, whereas refractory components (PAC and IAC) are influenced by three to five factors. The factor importance ranking reveals that SOC and TN are dominant across all components, with variations in factor significance across the different soil horizons.
(3) PLS-SEM indicates that soil factors directly influence carbon fractions, whereas urbanization factors indirectly influence inert carbon fractions by altering vegetation characteristics due to human disturbance. Topography indirectly affects carbon fractions by regulating vegetation and soil properties, illustrating the deep coupling between natural processes and human disturbances.
(4) This study clarifies the functional differentiation of urban forest soil carbon fractions and their multi-scale driving mechanisms, providing a scientific basis for urban soil carbon management and ecological conservation policy formulation. To achieve effective management and sustained carbon sequestration of urban soil carbon pools, collaborative participation of institutions, policymakers, and citizens is required to build a pattern of joint construction, governance, and shared benefits. Research and management institutions establish long-term soil carbon monitoring networks to provide data and technological support; policymakers integrate carbon management goals into urban green space planning, ecological redline control, and other policies; citizens contribute to maintenance through voluntary actions such as community greening care and reducing soil compaction. In the short term, it is necessary to launch zonal management pilots in typical areas with different urbanization gradients in Shenzhen to optimize and form replicable models; in the long term, it is necessary to build a dynamic management framework and inter-departmental information sharing platform, and promote successful experiences to the Guangdong–Hong Kong–Macao Greater Bay Area to enhance regional ecological resilience and carbon sequestration capacity.
Future studies should extend sampling to deeper soil layers to uncover the stability mechanisms of deep soil carbon pools. There is also a need to collect specific data on management practices (e.g., litter removal frequency, fertilization intensity) to quantify the direct effects of human activities. Furthermore, comparative studies across regions with different climatic zones and urbanization gradients in China (e.g., temperate, cold-temperate zones) are necessary to verify and improve the generalizability of the driving mechanisms governing soil carbon fractions, thereby offering broader scientific insights for the sustainable management of global urban ecosystems. In summary, this study elucidates the functional differentiation of urban forest soil carbon components and their multiscale driving mechanisms, providing a scientific basis for urban soil carbon management and ecological conservation policy formulation.
Author Contributions
Conceptualization, Z.S. and H.X.; methodology, Z.D.; software, Z.D.; validation, Z.D., Z.S. and H.X.; formal analysis, Z.D.; investigation, Z.D., W.Z., S.F. and S.P.; resources, Z.S. and H.X.; data curation, Z.D.; writing—original draft preparation, Z.D.; writing—review and editing, Z.S. and H.X.; visualization, Z.D.; supervision, Z.S. and H.X.; project administration, Z.S.; funding acquisition, Z.S. All authors have read and agreed to the published version of the manuscript.
Funding
This work was funded by the Shenzhen Science and Technology Program (KCXST20221021111211025).
Data Availability Statement
The raw data supporting the conclusions of this article will be made available by the authors on request.
Acknowledgments
All of the authors especially appreciate Qinghai Normal University and Fairylake Botanical Garden. We thank the editors and anonymous reviewers for their valuable comments.
Conflicts of Interest
The authors declare no conflicts of interest.
Abbreviations
The following abbreviations are used in this manuscript:
| AC | Moderately Oxidizable Organic Carbon |
| C/N | Carbon-to-Nitrogen Ratio |
| DM | Distance from City Center |
| EC | Electrical Conductivity |
| ELE | Elevation |
| FVC | Fractional Vegetation Cover |
| GAMs | Generalized Additive Models |
| GoF | Goodness of Fit |
| GWD | Geometric Weight Diameter |
| IAC | Inert Oxidizable Organic Carbon |
| MWD | Mean Weight Diameter |
| NDVI | Normalized Difference Vegetation Index |
| NL | Nighttime Light Index |
| NPP | Net Primary Productivity |
| PAC | Poorly Oxidizable Organic Carbon |
| PLS-SEM | Partial Least Squares Structural Equation Modeling |
| POP | Population Density |
| RDOC | Resistant/Recalcitrant Organic Carbon (PAC + IAC) |
| RF-RFE | Random Forest–Recursive Feature Elimination |
| ROC | Reactive Organic Carbon (VAC + AC) |
| SOC | Soil Organic Carbon |
| TN | Total Nitrogen |
| VAC | Highly Oxidizable Organic Carbon |
Appendix A
Data on annual mean temperature and precipitation were sourced from the National Center for Earth System Science Data (https://www.geodata.cn); normalized difference vegetation index (NDVI), net primary productivity (NPP), and fractional vegetation cover (FVC) data were sourced from the Resource and Environment Science Data Center (https://www.resdc.cn); nighttime light index data were derived from the Resource and Environment Science Data Center (https://www.resdc.cn); Gross domestic product data were obtained from the National Qinghai–Tibet Plateau Data Center (https://data.tpdc.ac.cn); population density data was sourced from the Oak Ridge National Laboratory (https://www.ornl.gov); and distance from city center data was acquired from the National Basic Geographic Information Center (https://www.ngcc.cn).
Table A1.
Driving Factor Data and Variable Abbreviations.
Table A1.
Driving Factor Data and Variable Abbreviations.
| Factors (Abbreviation) | Units | Resolution (Time/Space) | Data Sources | |
|---|---|---|---|---|
| Climatic | Average annual temperature (AT) | °C | 2000–2020/1 km | National Earth System Science Data Center |
| Average annual rainfall (AP) | mm | 2000–2020/1 km | National Earth System Science Data Center | |
| Geomorphologic | Elevation (ELE) | m | / | Real-time data |
| Slope (SP) | ° | / | Real-time data | |
| Plant | Normalized difference vegetation index (NDVI) | / | 2000–2020/1 km | Resource and Environmental Sciences Data Center |
| Fractional vegetation cover (FVC) | % | 2000–2020/250 m | Resource and Environmental Sciences Data Center | |
| Net primary productivity (NPP) | g/(m2·a) | 2000–2020/1 km | Resource and Environmental Sciences Data Center | |
| Crown density (CD) | / | / | Real-time data | |
| Average tree height (ATH) | m | / | Real-time data | |
| Urban | Gross domestic product (GDP) | CNY·km−2 | 2000–2020/1 km | National Tibetan Plateau Data Center |
| Population density (POP) | persons·km−2 | 2000–2020/1 km | Oak Ridge National Laboratory, USA | |
| Nighttime lighting index (NL) | / | 2000–2020/1 km | Resource and Environmental Sciences Data Center | |
| Distance to city hall (DM) | m | 2000–2020/1 km | National Center for Basic Geographic Information | |
| Soil | Organic carbon (SOC) | g·kg−1 | / | Real-time data |
| Total Nitrogen (TN) | g·kg−1 | / | Real-time data | |
| Electrical conductivity (EC) | dS/cm | / | Real-time data | |
| Bulk density (BD) | g/cm3 | / | Real-time data | |
| pH | / | / | Real-time data | |
| C/N | / | / | Real-time data | |
| Aggregates >1 mm (X1) | mm | / | Real-time data | |
| Aggregates 1–0.25 mm (X2) | mm | / | Real-time data | |
| Aggregates <0.25 mm (X3) | mm | / | Real-time data | |
| Geometric mean diameter (GMD) | mm | / | Real-time data | |
| Mean weight diameter (MWD) | mm | / | Real-time data |
References
- Seto, K.C.; Giineralp, B.; Hutyra, L.R. Global forecasts of urban expansion to 2030 and direct impacts on biodiversity and carbon pools. Proc. Natl. Acad. Sci. USA 2012, 109, 16083–16088. [Google Scholar] [CrossRef] [PubMed]
- Hoffland, E.; Kuyper, T.W.; Comans, R.N.J.; Creamer, R.E. Eco-functionality of organic matter in soils. Plant Soil 2020, 455, 1–22. [Google Scholar] [CrossRef]
- Georgiou, K.; Jackson, R.B.; Vindušková, O.; Abramoff, R.Z.; Ahlström, A.; Feng, W.; Harden, J.W.; Pellegrini, A.F.A.; Polley, H.W.; Soong, J.L.; et al. Global stocks and capacity of mineral-associated soil organic carbon. Nat. Commun. 2022, 13, 3797. [Google Scholar] [CrossRef] [PubMed]
- Heckman, K.; Hicks Pries, C.E.; Lawrence, C.R.; Rasmussen, C.; Crow, S.E.; Hoyt, A.M.; von Fromm, S.F.; Shi, Z.; Stoner, S.; McGrath, C. Beyond bulk: Density fractions explain heterogeneity in global soil carbon abundance and persistence. Glob. Change Biol. 2022, 28, 1178–1196. [Google Scholar] [CrossRef]
- Kaushal, S.S.; Wood, K.L.; Galella, J.G.; Gion, A.M.; Haq, S.; Goodling, P.J.; Haviland, K.A.; Reimer, J.E.; Morel, C.J.; Wessel, B.; et al. Making ‘chemical cocktails’—Evolution of urban geochemical processes across the periodic table of elements. Appl. Geochem. 2020, 119, 104631–104632. [Google Scholar] [CrossRef]
- Hao, Z.; Li, P.; Le, Q.; He, J.; Ma, J. Litter and Root Removal Modulates Soil Organic Carbon and Labile Carbon Dynamics in Larch Plantation Ecosystems. Forests 2024, 15, 1958. [Google Scholar] [CrossRef]
- Wang, Y.; Tang, Y.; Xia, N.; Terrer, C.; Guo, H.; Du, E. Urban CO2 imprints on carbon isotope and growth of Chinese pine in the Beijing metropolitan region. Sci. Total Environ. 2023, 866, 161389. [Google Scholar] [CrossRef]
- Shurpali, N.J. Urbanization associated changes in biogeochemical cycles. Glob. Change Biol. 2023, 29, 3237–3239. [Google Scholar] [CrossRef]
- Vasenev, V.; Kuzyakov, Y. Urban soils as hot spots of anthropogenic carbon accumulation: Review of stocks, mechanisms and driving factors. Land Degrad. Dev. 2018, 29, 1607–1622. [Google Scholar] [CrossRef]
- Chan, K.; Bowman, A.; Oates, A. Oxidizible organic carbon fractions and soil quality changes in an oxic paleustalf under different pasture leys. Soil Sci. 2001, 166, 61–67. [Google Scholar] [CrossRef]
- Barreto, P.A.; Gama-Rodrigues, E.F.; Gama-Rodrigues, A.; Fontes, A.G.; Polidoro, J.C.; Moço, M.K.S.; Machado, R.C.; Baligar, V. Distribution of oxidizable organic C fractions in soils under cacao agroforestry systems in Southern Bahia, Brazil. Agrofor. Syst. 2011, 81, 213–220. [Google Scholar] [CrossRef]
- Saud, P.; Chhetri, S.G.; Pelkki, M. Not population density, but city size and per capita income influence the urban forest carbon sequestration: A case of growing cities in Arkansas, USA. Environ. Chall. 2024, 16, 101000. [Google Scholar] [CrossRef]
- Herrmann, D.L.; Schifman, L.A.; Shuster, W.D. Urbanization drives convergence in soil profile texture and carbon content. Environ. Res. Lett. 2020, 15, 114001. [Google Scholar] [CrossRef] [PubMed]
- Eglinton, T.I.; Galy, V.V.; Hemingway, J.D.; Feng, X.; Bao, H.; Blattmann, T.M.; Dickens, A.F.; Gies, H.; Giosan, L.; Haghipour, N. Climate control on terrestrial biospheric carbon turnover. Proc. Natl. Acad. Sci. USA 2021, 118, e2011585118. [Google Scholar] [CrossRef]
- Zhang, S.; Zhou, X.; Chen, Y.; Du, F.; Zhu, B. Soil organic carbon fractions in China: Spatial distribution, drivers, and future changes. Sci. Total Environ. 2024, 919, 170890. [Google Scholar] [CrossRef]
- Wu, T.; Wang, D.; Mu, C.; Zhang, W.; Zhu, X.; Zhao, L.; Li, R.; Hu, G.; Zou, D.; Chen, J. Storage, patterns, and environmental controls of soil organic carbon stocks in the permafrost regions of the Northern Hemisphere. Sci. Total Environ. 2022, 828, 154464. [Google Scholar] [CrossRef]
- Gu, Z.; Chen, X.; Ruan, W.; Zheng, M.; Gen, K.; Li, X.; Deng, H.; Chen, Y.; Liu, M. Quantifying the direct and indirect effects of terrain, climate and human activity on the spatial pattern of kNDVI-based vegetation growth: A case study from the Minjiang River Basin, Southeast China. Ecol. Inform. 2024, 80, 102493. [Google Scholar] [CrossRef]
- Du, E.; Xia, N.; Guo, Y. Ecological effects of nitrogen deposition on urban forests: An overview. Front. Agric. Sci. Eng. 2022, 9, 445–456. [Google Scholar] [CrossRef]
- Fierer, N.; Colman, B.P.; Schimel, J.P.; Jackson, R.B. Predicting the temperature dependence of microbial respiration in soil: A continental-scale analysis. Glob. Biogeochem. Cycles 2006, 20, GB3026. [Google Scholar] [CrossRef]
- Wang, T.; Xu, Q.; Gao, D.; Zhang, B.; Zuo, H.; Jiang, J. Effects of thinning and understory removal on the soil water-holding capacity in Pinus massoniana plantations. Sci. Rep. 2021, 11, 13029. [Google Scholar] [CrossRef]
- Benbi, D.; Brar, K.; Toor, A.; Singh, P.; Singh, H. Soil carbon pools under poplar-based agroforestry, rice-wheat, and maize-wheat cropping systems in semi-arid India. Nutr. Cycl. Agroecosyst. 2012, 92, 107–118. [Google Scholar] [CrossRef]
- Darst, B.F.; Malecki, K.C.; Engelman, C.D. Using recursive feature elimination in random forest to account for correlated variables in high dimensional data. BMC Genet. 2018, 19, 65. [Google Scholar] [CrossRef] [PubMed]
- Min-Suk, K.; Sang-Hwan, L.; Jeong-Gyu, K. Evaluation of factors affecting arsenic uptake by Brassica juncea in alkali soil after biochar application using partial least squares path modeling (PLS-PM). Chemosphere 2021, 275, 130095. [Google Scholar] [CrossRef] [PubMed]
- Wood, S.N. Stable and efficient multiple smoothing parameter estimation for generalized additive models. J. Am. Stat. Assoc. 2004, 99, 673–686. [Google Scholar] [CrossRef]
- Ai, H.; Wu, X.; Zhang, L.; Qi, M.; Zhao, Y.; Zhao, Q.; Zhao, J.; Liu, H. QSAR modelling study of the bioconcentration factor and toxicity of organic compounds to aquatic organisms using machine learning and ensemble methods. Ecotoxicol. Environ. Saf. 2019, 179, 71–78. [Google Scholar] [CrossRef]
- Galloway, J.; Ezzati, G.; Hawtree, D.; Richards, K.; Lynch, B.; Burgess, E.; Zurovec, O.; O’Neill, M.; Mellander, P.-E. Using generalized additive models to investigate drivers and controls on stream water nitrate concentrations in four agricultural catchments. Agric. Water Manag. 2025, 315, 109552. [Google Scholar] [CrossRef]
- Adeyeye, O.A.; Hassaan, A.M.; Song, Z.; Xie, D.; Zhang, L. Disentangling the main factors influencing spring algal blooms in the Three Gorges Reservoir using partial least square structural equation modelling. Chemosphere 2024, 368, 143680. [Google Scholar] [CrossRef]
- Sun, C.; Xue, S.; Chai, Z.; Zhang, C.; Liu, G. Effects of land-use types on the vertical distribution of fractions of oxidizable organic carbon on the Loess Plateau, China. J. Arid Land 2016, 8, 221–231. [Google Scholar] [CrossRef]
- Majumder, B.; Mandal, B.; Bandyopadhyay, P.; Chaudhury, J. Soil organic carbon pools and productivity relationships for a 34 year old rice–wheat–jute agroecosystem under different fertilizer treatments. Plant Soil 2007, 297, 53–67. [Google Scholar] [CrossRef]
- Yu, M.; Wang, Y.; Jiang, J.; Wang, C.; Zhou, G.; Yan, J. Soil organic carbon stabilization in the three subtropical forests: Importance of clay and metal oxides. J. Geophys. Res. Biogeosci. 2019, 124, 2976–2990. [Google Scholar] [CrossRef]
- Janzen, H.H. Beyond carbon sequestration: Soil as conduit of solar energy. Eur. J. Soil Sci. 2015, 66, 19–32. [Google Scholar] [CrossRef]
- Wan, S.-Z.; Chen, F.-S.; Hu, X.-F.; Zhang, Y.; Fang, X.-M. Urbanization aggravates imbalances in the active C, N and P pools of terrestrial ecosystems. Glob. Ecol. Conserv. 2020, 21, e00831. [Google Scholar] [CrossRef]
- Díaz-Pinés, E.; Rubio, A.; Van Miegroet, H.; Montes, F.; Benito, M. Does tree species composition control soil organic carbon pools in Mediterranean mountain forests? For. Ecol. Manag. 2011, 262, 1895–1904. [Google Scholar] [CrossRef]
- Deng, L.; Wang, K.-B.; Chen, M.-L.; Shangguan, Z.-P.; Sweeney, S. Soil organic carbon storage capacity positively related to forest succession on the Loess Plateau, China. Catena 2013, 110, 1–7. [Google Scholar] [CrossRef]
- Wan, Q.; Zhu, G.; Guo, H.; Zhang, Y.; Pan, H.; Yong, L.; Ma, H. Influence of vegetation coverage and climate environment on soil organic carbon in the Qilian Mountains. Sci. Rep. 2019, 9, 17623. [Google Scholar] [CrossRef]
- Six, J.; Conant, R.T.; Paul, E.A.; Paustian, K. Stabilization mechanisms of soil organic matter: Implications for C-saturation of soils. Plant Soil 2002, 241, 155–176. [Google Scholar] [CrossRef]
- Du, E.; Terrer, C.; Pellegrini, A.F.; Ahlström, A.; van Lissa, C.J.; Zhao, X.; Xia, N.; Wu, X.; Jackson, R.B. Global patterns of terrestrial nitrogen and phosphorus limitation. Nat. Geosci. 2020, 13, 221–226. [Google Scholar] [CrossRef]
- Craine, J.M.; Morrow, C.; Fierer, N. Microbial nitrogen limitation increases decomposition. Ecology 2007, 88, 2105–2113. [Google Scholar] [CrossRef]
- Sillen, W.; Dieleman, W. Effects of elevated CO 2 and N fertilization on plant and soil carbon pools of managed grasslands: A meta-analysis. Biogeosciences 2012, 9, 2247–2258. [Google Scholar] [CrossRef]
- Tang, B.; Rocci, K.S.; Lehmann, A.; Rillig, M.C. Nitrogen increases soil organic carbon accrual and alters its functionality. Glob. Change Biol. 2023, 29, 1971–1983. [Google Scholar] [CrossRef]
- Wong, V.N.L.; Greene, R.S.B.; Dalal, R.C.; Murphy, B.W. Soil carbon dynamics in saline and sodic soils: A review. Soil Use Manag. 2010, 26, 2–11. [Google Scholar] [CrossRef]
- Su, X.; Su, X.; Zhou, G.; Du, Z.; Yang, S.; Ni, M.; Qin, H.; Huang, Z.; Zhou, X.; Deng, J. Drought accelerated recalcitrant carbon loss by changing soil aggregation and microbial communities in a subtropical forest. Soil Biol. Biochem. 2020, 148, 107898. [Google Scholar] [CrossRef]
- Cotrufo, M.F.; Wallenstein, M.D.; Boot, C.M.; Denef, K.; Paul, E. The M icrobial E fficiency-M atrix S tabilization (MEMS) framework integrates plant litter decomposition with soil organic matter stabilization: Do labile plant inputs form stable soil organic matter? Glob. Change Biol. 2013, 19, 988–995. [Google Scholar] [CrossRef] [PubMed]
- Prichard, S.J.; Peterson, D.L.; Hammer, R.D. Carbon Distribution in Subalpine Forests and Meadows of the Olympic Mountains, Washington. Soil Sci. Soc. Am. J. 2000, 64, 1834–1845. [Google Scholar] [CrossRef]
- Yimer, F.; Ledin, S.; Abdelkadir, A. Soil organic carbon and total nitrogen stocks as affected by topographic aspect and vegetation in the Bale Mountains, Ethiopia. Geoderma 2006, 135, 335–344. [Google Scholar] [CrossRef]
- Seto, K.C.; Davis, S.J.; Mitchell, R.B.; Stokes, E.C.; Unruh, G.; Ürge-Vorsatz, D. Carbon lock-in: Types, causes, and policy implications. Annu. Rev. Environ. Resour. 2016, 41, 425–452. [Google Scholar] [CrossRef]
- Seddon, N.; Chausson, A.; Berry, P.; Girardin, C.A.; Smith, A.; Turner, B. Understanding the value and limits of nature-based solutions to climate change and other global challenges. Philos. Trans. R. Soc. B 2020, 375, 20190120. [Google Scholar] [CrossRef]
Disclaimer/Publisher’s Note: The statements, opinions and data contained in all publications are solely those of the individual author(s) and contributor(s) and not of MDPI and/or the editor(s). MDPI and/or the editor(s) disclaim responsibility for any injury to people or property resulting from any ideas, methods, instructions or products referred to in the content. |
© 2026 by the authors. Licensee MDPI, Basel, Switzerland. This article is an open access article distributed under the terms and conditions of the Creative Commons Attribution (CC BY) license.