Abstract
China’s urbanization has undergone decades of extensive development, resulting in significant imbalances between urban land conversion and population growth, with a variety of environmental consequences. This study examines the temporal and spatial characteristics of land conversion and population growth in 286 Chinese cities from 1986 to 2010, as well as the possible threats to food security associated with land urbanization at this time. We found that, in China, the rate of urban land conversion far outpaces that of urban population growth, with this imbalance being more prominent in the Yangtze River Basin and cities in the eastern coastal provinces than that in other areas. Although the rate of land urbanization has been higher than that of population urbanization for many years, many cities still have a relatively low construction land area per capita (<50 m2/person), and they are mainly concentrated in the Yangtze River Basin. Although large areas of high-quality farmland have been converted to “new cities” without enough immigrants to utilize the developed infrastructure, the impact of this loss of arable land on food production has been insignificant. However, the waste of land caused by blind land expansion without considering population growth is still a cause for concern.
1. Introduction
Urbanization is the process by which formerly rural areas are transformed into cities, characterized by rapid growth in building and population densities. Urbanization can offer people and local economies many advantages; however, unplanned and haphazard urbanization can have unforeseen consequences for food production and environmental security [1,2]. Such potential for insecurity is especially true for the People’s Republic of China (China), which is challenged in using its limited farmland to feed more than 1.4 billion people [3,4]. Since implementing the Reform and Opening-Up Policy in 1978, China has experienced rapid urbanization and dramatic land-use changes [5]. Accompanying this unprecedented urbanization, China has transformed from a closed and traditional agricultural society to an open and industrial country [6]. Studies have shown that China lost 14.5 million ha of farmland between 1979 and 1995 and another 8.32 million ha between 1996 and 2008 [7,8]. Rapid urbanization and the loss of scarce arable land relative to food security have been a concern of the Chinese government since 1990 [9]. A series of farmland policies, including the Dynamic Balance of Total Farmland Area and the Prime Farmland Preservation Policies, were implemented to maintain the total area of farmland at the provincial level [10]. These policies have led to the conversion of forest, grassland, and marginal lands to new farmland. However, the increase in low-quality farmland has generally not compensated for the high-quality farmland lost to urban expansion [11]. In addition, because environmental protection policies have not been able to ameliorate the detrimental effects of rapid urbanization, there have also been extensive environmental and social impacts across China, including declines in biodiversity and the degradation of air and water quality, putting public health at risk [4]. To tackle existing and potential problems caused by rapid urbanization, the Chinese government released the National New-Type Urbanization Plan (2014–2020), which aimed to foster healthy and sustainable urbanization.
The proportion of the world’s population living in urban areas is predicted to increase to 68.4% by 2050, with China contributing the second largest number of urban dwellers (255 million) [12]. The emergence of megacities and urban agglomerations is expected to generate more agglomerated economies and increasingly concentrate people in highly urbanized areas [13]. An areal increase in developed land is required to increase the average amount of living space per person desired by urban dwellers; thus, the global growth rate of urban development (80%) has been much higher than the human population growth rate in urban areas (52%) over the past 40 years [14]. China is experiencing a similar imbalance between the rate of the conversion from rural and suburban lands to urban infrastructure and the rate of urban population growth. This imbalance has led to underused urban infrastructure, such as empty apartment buildings and magnificent squares in “ghost cities,” all at an immense cost [15].
Many cities across some parts of Europe and North America are experiencing declining populations. In China, researchers have identified 180 cities with a shrinking population, including one provincial capital city [16]. Urbanization is mainly a consequence of rural-to-urban migration. Thus, the combined effect of an aging population and declining fertility in China will, eventually, reduce the rate of migration from rural to urban areas, which will further exacerbate the imbalance between available urban land and urban population growth in China [15,17]. Against this backdrop, we reviewed the urbanization process in China over the past several decades in order to evaluate the spatial–temporal dynamics of land loss and population growth relative to urban expansion. Our goals were to determine where the imbalances occur and what impacts they might have on food security.
To date, research on the two key dimensions of urbanization (the conversion of land to urban infrastructure and urban population growth) has focused on measuring scheduled coupling, spatial heterogeneity and causal relationships, and factors and control strategies influencing land conversion and population growth [17]. To fully explore the negative social and environmental problems caused by imbalances between supply and demand for urban resources, as well as to provide suggestions for solving problems related to these imbalances, our first step was to understand and quantify the characteristics responsible for such imbalances. Understanding how these two dimensions of urbanization coevolve over time will provide us with a more sophisticated understanding of how the scale and process of urbanization are related to sustainable development.
Many previous studies have investigated the characteristics of urban expansion in China from the perspective of land urbanization at multiple scales (the entire country, megaregion, provincial level, and city) [18,19,20]. However, few studies have considered the imbalances between land conversion and population growth at a national scale over the past few decades. To explore the widespread temporal–spatial characteristics of these imbalances, we need to include, as much as possible, all cities across China.
Achieving sustainable urbanization requires considerable effort from multiple perspectives. Here, we present a study that maps and quantifies multiscale characteristics of urban expansion, including trends over time of the imbalances between land conversion and population growth and the spatial heterogeneity of such imbalances for 286 cities in China. The specific objectives of this study were to (1) dynamically map the spatial extent of urban land cover and population density, (2) analyze the spatial and temporal patterns relative to the ratio between land conversion and population growth, and (3) analyze the relationship between urban expansion and crop production over time across China. The results of this study should enhance our understanding of the spatiotemporal characteristics of urban sprawl and provide important insights that can be used to inform public policy focused on urban growth management and planning.
2. Methods
2.1. Study Area
China’s administrative units are currently based on a three-tier system. The country is first divided into provinces, autonomous regions and municipalities under the direct administration of the central government. Then, each province (autonomous region) is subdivided into autonomous prefectures, counties, autonomous counties, or prefecture-level cities. Municipalities are directly under the administration of the central government. Large cities are further divided into districts (each with relatively high levels of urbanization) and their surrounding counties. Our study included 286 cities, including the 4 major municipalities of Beijing, Tianjin, Shanghai, and Chongqing, and most large cities. We focused on the core areas (including all districts) of these cities (Figure 1). We excluded Hong Kong, Macau, and cities in Taiwan because population data were not available to assess population urbanization rates. In this study, we identified the boundary of the core area of each city using the latest administrative map published by the Ministry of Civil Affairs and the Ministry of Natural Resources of China.
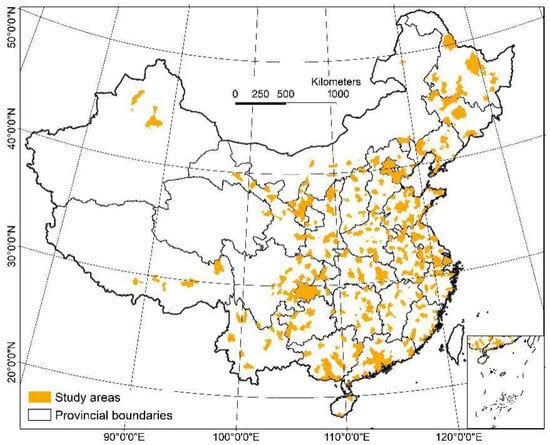
Figure 1.
The location and administrative divisions of the 286 cities in China.
With the rapid development of China’s economy, its administrative divisions have undergone many spatial adjustments over the past 30 years. For example, by the end of 2017, Beijing had a population of 21.7 million and an urbanization rate of 96.5%. In the past three decades, Beijing’s population has nearly tripled, and its built-up (developed) area has increased nearly eight-fold. As a result, the administrative borders of Beijing were adjusted many times during this period. In 1985, there were 10 districts and 9 counties. In 1986, Yanshan District and Fangshan County were merged into Fangshan District. In 2010, Chongwen District and Xuanwu District were incorporated into Dongcheng District and Xicheng District, respectively. By 2015, all 9 counties had been converted to districts, and then, the Beijing Metropolitan Area had 16 districts. Although administrative borders have often been adjusted in cities such as Beijing, it was not difficult to collect population data for the core areas of such cities because each adjustment was based on an entire district or county. When an adjustment was made by dividing a county into two parts, with one part joining an adjacent district, we merged the whole county into the core area of the city. For example, when part of the villages and towns of Zhengding County were incorporated into Yuhua District of Shijiazhuang City in 2001, the entire population of Zhengding County was added to the core area of Shijiazhuang City for the entire study period. Meanwhile, the boundary of the core area of Shijiazhuang was then adjusted to reflect the above-mentioned administrative map. The information used to adjust the administrative divisions of every city can be obtained at a website outlining administrative divisions in China (http://www.xzqh.org/html/, accessed on 15 May 2023).
2.2. Land Conversion
Urbanization causes in widespread changes in land surfaces over time. Urbanized land cover is heterogeneous and characterized by a large areal proportion of impervious surfaces (impervious to the percolation of rainfall), which includes roofs, paved surfaces, hardened grounds, and major road surfaces [21]. Gong et al. released a 40 years continuous and consistent impervious surface distribution data map for China covering the period of 1978–2017, using reliable impervious surface mapping algorithms and the Google Earth Engine platform [22]. The 1985–2017 data were provided at a 30 m resolution. The spatial accuracies of these data were evaluated by manually interpreting long-term NDVI time series, local views of Landsat images, and high-resolution Google Earth Images. The overall accuracies reached more than 90% [22]. In this study, we applied impervious data for the 1986–2010 period to assess changes in the developed land area during this period. Similarly, impervious surface data were divided into five time frames; thus, the annual land conversion rate (ALCR) of each city was calculated for five periods from 1986 to 2010 using Equation (1):
where is the urbanized land area at the initial time point, is the urbanized land area at the end time point, and d is the time span for each period in years (d = 1–5).
2.3. Population Growth
Population data were obtained from the National Demographic Statistics Database for the Counties and Cities of China, released by the Ministry of Public Security of China. This release provided data for the period of 1986 to 2012. In this study, we focused on the period from 1986 to 2010, which we split into one 5 year and two 10 year time periods. Although a certain percentage of the populations was still dependent on agriculture in many core areas of the cities that we examined, especially in areas that had been recently converted from a county to a district, we defined the urbanized population as the total population and did not exclude the non-agricultural population living in the core area. That is, the total population of the core area of the study cities was utilized to assess the population growth rate. We calculated the annual population growth rate (APGR) of each city between each of the five consecutive time periods (1986 to 2010) using the following equation [23]:
where is the population of the urban area at the initial time point, is the population of the urban area at the end time point, and d is the time span for each period in years (d = 1–5).
2.4. Coordination Degree Index
There is a general imbalance between land and population urbanization. Such an imbalance should not have a negative impact on economic development or the sustainability of social structures. In this study, we introduce a widely used index to assess the spatial-temporal heterogeneity of the relationship between land and population urbanization. This index is the coordination index, which is calculated using following formula:
where is the coordination degree index, which ranges from −1.414 to 1.414. According to previous studies, the values of this index are divided into four categories: −1.414 < ≤ 1.30, which indicates that land and population urbanization are in an uncoordinated state; 1.30 < ≤ 1.35, which indicates that they are in a relatively uncoordinated state; 1.35 < ≤ 1.40, which indicates that they are in a relatively coordinated state; while 1.40 < ≤ 1.414, which indicates that they are in a coordinated state.
2.5. Crop Production Loss
To estimate the loss of land devoted to crop production (the loss of arable land) due to urban expansion during the 1986–2010 period, we identified potential farmland yield at the end of each 5 year interval: 1970, 1980, 1990, 2000, and 2010. The potential farmland yield was obtained from the Data Registration and Publishing System of the Resource and Environmental Science Data Center of the Chinese Academy of Sciences [24]. The dataset was produced using the Global Agro-Ecological Zones (GAEZ) model [25]. This model provides a standard framework for characterizing the impact of climate, soil, and topographic conditions on agricultural production. There are five main steps used to calculate the potential farmland yield: (1) an analysis of climate data to compile general agroclimatic indicators, including the growing season length, number of biologically effective degree days, number of frost days, number of summer days, warm spell duration index, and number of tropical nights; (2) assessments of crop-specific agroclimatic and yield calculations; (3) assessments of yield reductions due to agroclimatic constraints; (4) assessments of soils to account for yield reductions due to soil and terrain constraints; and (5) the integration of the above results into a crop-specific grid cell database. Liu et al. showed that potential crop yield declined in China by approximately 34.90 million tons due to urban expansion during the 1990–2010 period [26]. This decline in crop yield accounted for 6.52% of China’s total production in that period [26]. By analyzing global maps of spatiotemporal changes in urbanization, Liu et al. found that China’s land conversion rate (80%) was considerably higher than its population growth rate (52%) during the 1985–2015 period [14]. The discrepancy between land and population urbanization rates was even more imbalanced in specific Chinese cities. In this study, we developed three scenarios describing urbanization rates related to the growth of urban areas and an increasing number of urban residents. In the first scenario, urban land conversion rates do not exceed the urban population growth rate (ALCR/APGR ≤ 1), whereas the second and third scenarios assume that the land conversion rate is at most 1.5 and 2.0 times the population growth rate, respectively (i.e., ALCR/APGR ≤ 1.5 and ALCR/APGR ≤ 2.0). By establishing these three scenarios a priori, we predicted how much crop yields could be increased under the various ALCR/APGR scenarios.
2.6. Statistics Analysis
We conducted statistical analyses in Origin 2018 to examine the regional and temporal differences in target indices (ALCR, APGR, ALCR/APGR and loss in crop production), with the significance level set to p < 0.05. Paired sample t-tests were used to compare these indices between paired groups (e.g., between the eastern coastal/Yangtze River Basin region and other regions), while one-way ANOVA with Tukey’s test assessed their significant variations across multiple periods.
3. Results
3.1. Relationship Between Land Conversion and Population Growth
3.1.1. Magnitude, Rates, and Spatial Patterns of Land Conversion and Population Growth
During the period from 1986 to 2010, China saw an unprecedented rate of urban land conversion. In the 286 cities that we examined, impervious surfaces expanded from 12,456.27 km2 in 1986 to 45,955.98 km2 in 2010, with nearly 33,500 km2 of land becoming urbanized during this 25 year period. The average ALCR from 1986 to 2010 showed a pronounced increase in the 286 cities. The lowest average ALCR was recorded in Jincheng City, where the urban developed land area expanded from 49.38 km2 to 62.15 km2, with an ALCR of 0.96. In contrast, the highest average ALCR was recorded in Liupanshui City, with a value of 20.93 over the 25 year period. Most cities also experienced dramatic changes in size. Among the 286 cities, only 15 (5.15%) had an ALCR < 2.00 in any of the three time periods examined, whereas as many as 85 (29.21%) had an ALCR > 8.00 (Figure 2a).
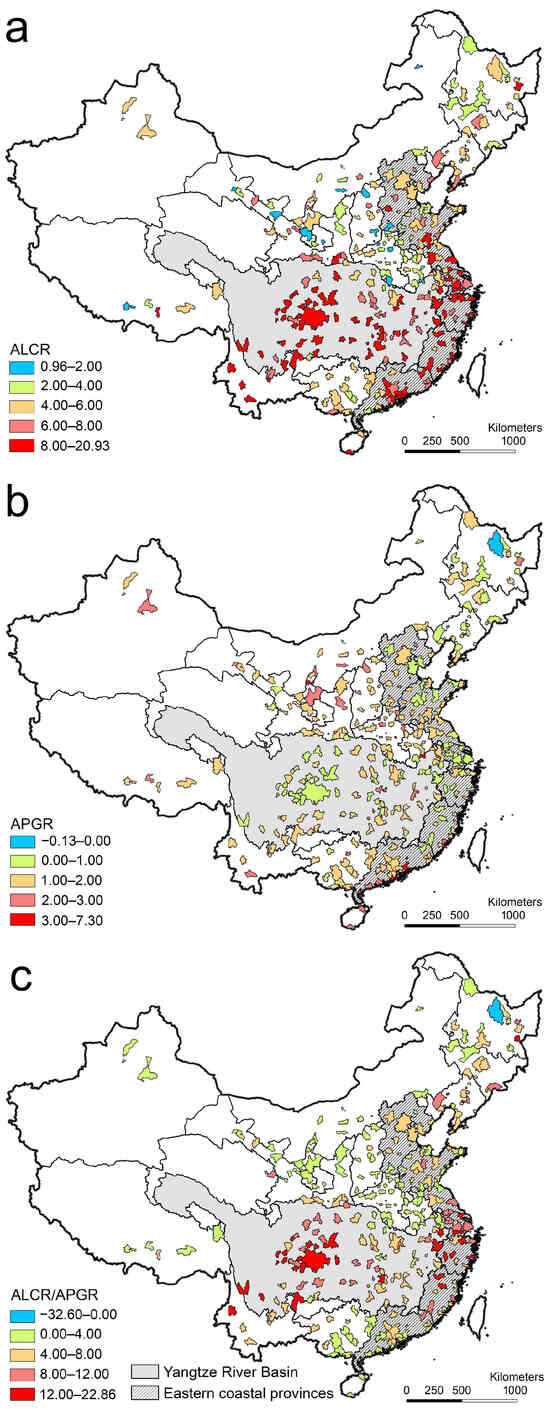
Figure 2.
The spatial pattern of urbanization for the 286 selected cities in China from 1985 to 2010: (a) annual land conversion rate (ALCR), (b) annual population growth rate (APGR), and (c) ALCR/APGR ratio.
We divided the country into two regions: one comprised the eastern coastal provinces and Yangtze River Basin, and the other comprised all other parts of China. The first region contains the five largest urban agglomerations in China. The ALCRs of all 286 cities were first reclassified (and color-coded) into five groups with an ALCR increment of 2.00 (Figure 3a). These five increments of the average ALCRs were associated with 15, 52, 88, 47, and 84 cities (from least to most intense). Notably, most of the 84 cities (92.86%) with an ALCR > 8.00 were located in the eastern coastal provinces/Yangtze River Basin regions; only 2 cities (Handan and Hefei) in this region were in the lowest ALCR category (ALCR < 2). The mean value of the ALCRs of the cities in the eastern coastal/Yangtze Basin region (ALCR = 7.93) was significantly higher (p < 0.001) than that of the cities outside that region (ALCR = 4.71) (Figure 3a).
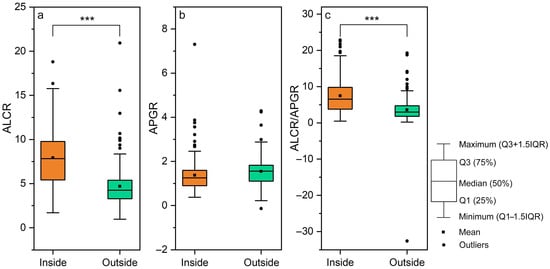
Figure 3.
Variations in urban development for cities in China inside and outside the eastern coastal province/Yangtze River Basin: (a) annual land conversion rate (ALCR), (b) annual population growth rate (APGR), and (c) ALCR/APGR ratio. *** indicate significant differences between inside and outside regions (p < 0.001).
Figure 2b depicts the average urban population growth rate from 1986 to 2010. Among the 286 cities with complete population data, only Yichun City in the northeastern part of the country showed a decline in its urban population over the 25 years. Shenzhen City had the highest urbanization population growth rate (APGR = 7.30), which was 1.74 times that of the city with the second highest APGR. There was no significant difference in the APGR values between regions (i.e., between cities inside and outside the eastern coastal provinces and the Yangtze River Basin) (Figure 3b).
The ALCR/APGR ratio indicates an imbalance between land conversion and population growth. Figure 2c shows the spatial variations in ALCR/APGR values. Except for Yichun City, where the ratio was negative, due to negative population growth, 11 cities had a land conversion rate that was lower than the population growth rate. The vast majority of cities (95.8%) had increasingly higher land conversion rates than population growth rates over time. In fact, 45 cities had an ALCR/APGR ratio higher than 10.00. These cities with high ALCR/APGR ratios were more concentrated in the eastern coastal provinces and the Yangtze River Basin. In fact, there was a significant difference (p < 0.001) in the ALCR/APGR ratios of the cities in this region and those outside this region (Figure 3c).
3.1.2. The Time Trend Variations for ALCR, APGR, and ALCR/APGR Ratio
In the earliest time period (1986–1990) studied, most cities in China experienced very high rates of construction and expansion of city boundaries (Figure 4). During this period, 129 cities had ALCRs > 10.00, and 13 cities had ALCRs > 50.00. The land conversion rate dropped precipitously in the subsequent time period (1991–2000), where there were only 12 cities with ALCRs > 10.00 and no city with an ALCR > 15.00. In the next time period (2001–2010), China experienced another rapid land conversion rate. The ALCRs of three cities exceeded 20.00 during this period (Figure 4a). In these three time periods, the 286 Chinese cities first experienced a high rate of urban population increase in the 1986–1990 period, followed by a continuous decline in population increase over the next two time periods (1991–2000 and 2001–2010). By comparing these two periods, it was found that 12 more cities saw a greater loss of urban populations in this 2001–2010 period than in the prior 15 years (Figure 4b). For these three years, the ALCR first declined and then increased slightly, whereas the APGR declined continuously. As a consequence, the ALCR/APGR ratio declined and then increased significantly. Thus, both the mean and median values of the ALCR/APGR ratio were higher during the 2001–2010 period than during the previous two time periods (15 y) (Figure 4c).
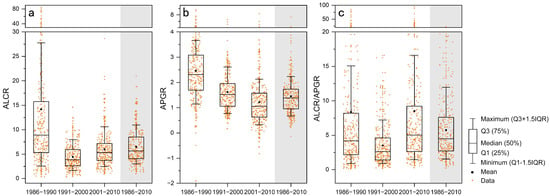
Figure 4.
Variation in urban development over time (1986–2010) for cities across China: (a) annual land conversion rates (ALCR), (b) annual population growth rate (APGR), and (c) ALCR/APGR ratio.
3.1.3. Coordination Degree Between Land Conversion and Population Growth
The coordination degree model shows that during the period from 1986 to 2010, as many as 90.21% of cities showed non-coordination between land urbanization and population urbanization (including uncoordinated and relatively uncoordinated), of which the proportion of uncoordinated cities was 86.01%. Of the 28 coordinated cities, only Shenzhen is in this zone (the Yangtze River Basin and the eastern coastal provinces) (Figure 5).
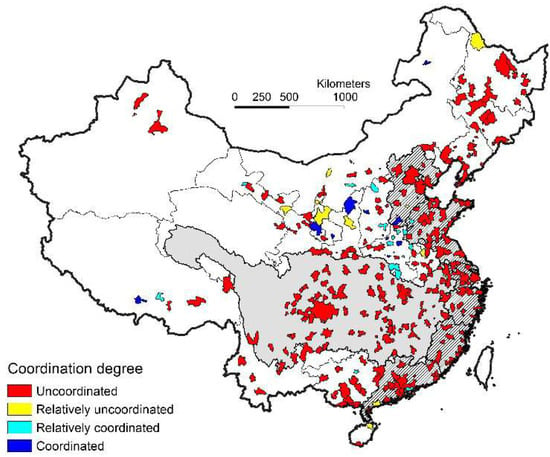
Figure 5.
Spatial heterogeneity of coordination degree between land expansion and population growth during the 1986–2010 period.
3.2. Change in per Capita Construction Land Area
When comparing the changes in per capita urban construction land area from 1986 to 2010, an increase was found in 96.18% of cities, of which 70.14% had an increase rate of more than 100%, and 60 cities had an increase rate of 500%. Most cities experienced an the increase in per capita construction area, indicating that the population density decreased in different degrees in the process of urban development. However, the change in urban built-up area per capita showed strong heterogeneity across the country. The per capita urban construction area of most cities in the eastern coastal provinces reached more than 100 m2/person, while in the Yangtze River Basin, although the per capita urban construction land area also increased significantly, most cities still had a relatively low level (<50 m2/person) (Figure 6).
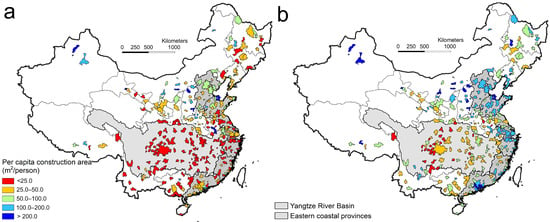
Figure 6.
The spatial patterns of per capita construction land area in 1986 (a) and 2010 (b).
3.3. Reduction in Crop Production in Selected Cities
Where the ratio of land conversion to population growth was <1.0, <1.5, and <2.0, arable land protected from urbanization was estimated to have produced 70.86 × 10⁸ kg, 61.24 × 10⁸ kg, and 52.78 × 10⁸ kg of crops, respectively, during the 1986–2010 period. The spatial patterns of potential crop production losses were roughly similar under the three ALCR/APGR scenarios that we examined. The cities with the largest yield losses were mainly distributed throughout the Yangtze River Basin and the northern half of the eastern coastal provinces (north of the Yangtze River Delta), particularly in the core cities of three urban agglomerations (the Jing-Jin-Ji, Yangtze River Delta, and Pearl River Delta agglomerations) (Figure 7). For cities inside and outside the eastern coastal provinces/Yangtze River Basin region, the crop production losses that were avoided under the three ALCR/APGR scenarios were 7.72 × 10⁸ kg (13.04 × 10⁸ kg), 51.30 × 10⁸ kg (9.85 × 10⁸ kg) and 45.16 × 10⁸ kg (7.55 × 10⁸ kg), respectively. Crop production losses were significantly higher in the Yangtze River Basin/eastern coastal provinces region than in areas outside this region.
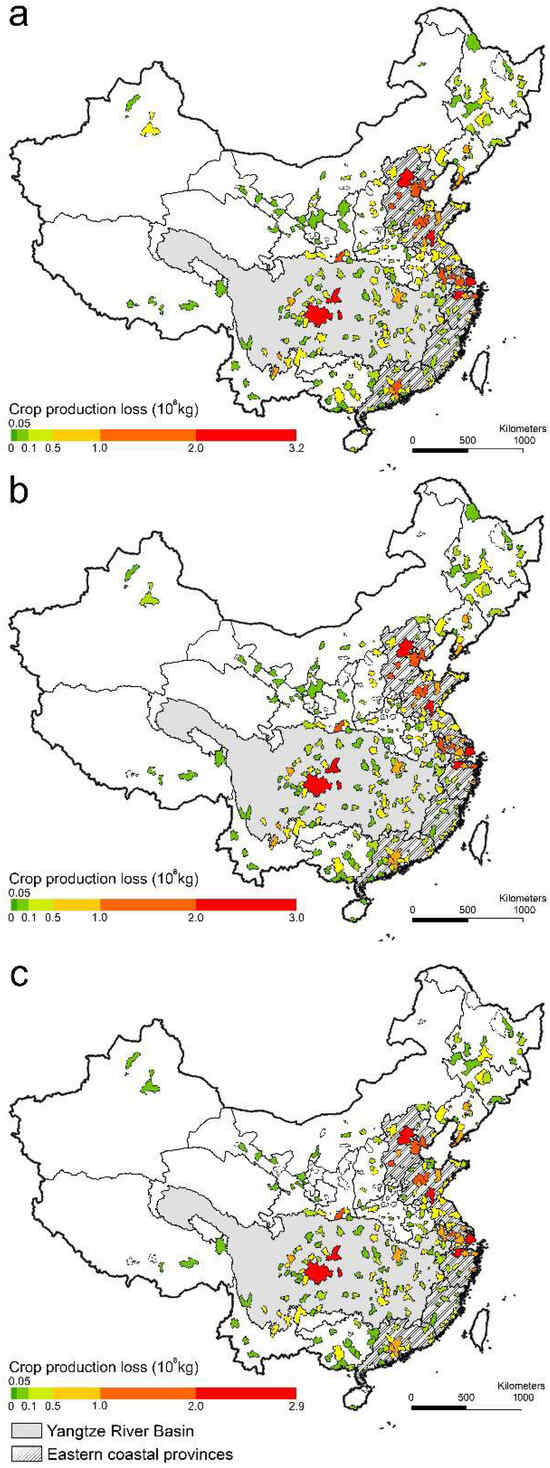
Figure 7.
Crop production loss in selected Chinese cities under three annual land conversion rate/annual population growth rate (ALCR/APGR) scenarios: (a) Scenario 1, (b) Scenario 2, and (c) Scenario 3.
Although the land conversion rate in the 2001–2010 period was significantly lower than in the 1986–1990 period, the population growth rate also declined during the same period (1986–1990). Declines in both ratios resulted in a higher average and median ALCR/APGR ratios for this time period (2001–2010) than for the prior two time periods (Figure 4c). Therefore, the higher ALCR/APGR ratio during this time period was associated with the highest loss in crop productivity over the study period, which was due to the high disparity between the available urban infrastructure and the urban population size that could utilize the infrastructure (Figure 8). The potential loss in crop production during this period (2001–2010) accounted for about 64% of the crop yield lost over the entire study period (1986–2010).
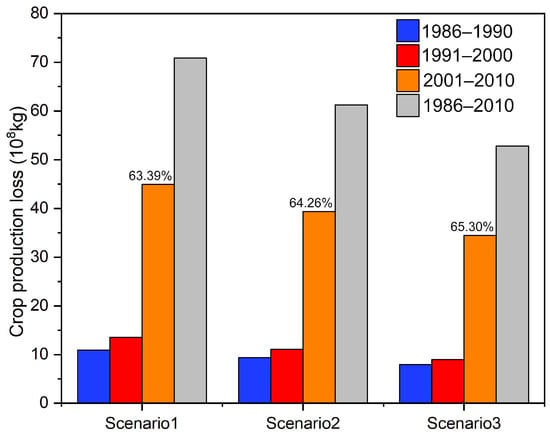
Figure 8.
Crop yield losses under three annual land conversion rate/annual population growth rate (ALCR/APGR) scenarios in the examined time periods.
4. Discussion
4.1. Imbalance Between Land Urbanization and Population Growth
Although land conversion and population growth are two important dimensions of urbanization, land conversion generally precedes population urbanization in China. From 1985 to 2015, the global urban land and population growth rates were 80% and 52%, respectively [14]. China experienced rapid urbanization in the decades following the Reform and Opening-Up period, particularly with respect to land urbanization/development. Gong et al. showed that the area of impervious surfaces area increased throughout China from 1978 to 2017 [22]. In our study, we defined urban land as the impervious surface area within city jurisdictional boundaries. Between 1986 and 2010, the imperious surface area in 286 major cities in China increased by 268.94%, from 16,293.71 km2 to 60,113.18 km2. During that same period, the urban population increased by 35.71%, from 369.78 million to 501.81 million people. The population growth rate may have been underestimated to some extent because the population data that we collected were obtained from household population data released by the public security department. However, many urban residents do not have local household registrations; thus, they are not included in the data used to estimate population growth [27].
Both the ALCR and APGR were significantly higher in the 1986–1990 period than in the following two periods (1991–2000 and 2001–2010) (Figure 4). Before the Reform and Opening-Up Policy was implemented, human migration was highly restricted between urban and rural areas; thus, increases in urban populations were primarily a result of natural population growth. Immediately after the economic reforms were initiated (after 1978) [28], rapid economic development stimulated rapid urbanization, which included rapid urban development and a rapid increase in urban populations. During this rapid development phase, the ALCR was >30% in 23 cities. In the following 10 y period, both ALCR and APGR decreased significantly, followed by an increase in the ALCR during the next 10 y (2001–2010) period. This secondary expansion may have been driven by rapid economic growth after China joined the World Trade Organization (WTO) in 2001. Relative to the 1991–2000 period, the ALCR increased and the APGR decreased from 2001 to 2010, resulting in a higher ALCR/APGR ratio during this period.
The land conversion rate and the ratio between the land conversion and population growth rates showed obvious spatial heterogeneity across China, which have been stated by many previous studies [17,28,29]. In this study, we divided China into two regions: (1) the Yangtze River Basin and eastern coastal provinces region, and (2) other areas outside this region. The land urbanization rate in the Yangtze River Basin and the eastern coastal provinces was significantly higher than in other areas of the country, and this region is where China’s five major urban agglomerations are located, namely Beijing–Tianjin–Hebei, the Yangtze River Delta, the Guangdong–Hong Kong–Macao Greater Bay Area, the middle reaches of the Yangtze River, and the Chengdu–Chongqing urban agglomeration. The formation of these five urban agglomerations showed an obvious trend in the process of land urbanization from 1986 to 2010. The cities in these five urban agglomerations (distributed in the Yangtze River Basin and the eastern coastal provinces) had a significantly higher land urbanization rate than those outside the region. The per capita construction land area of the first three urban agglomerations has reached more than 100 m2/person in 2010, but that of the other two urban agglomerations, especially the Chengdu–Chongqing urban agglomerations, remained at a relatively low level (<50 m2/person). This may lead to ongoing rapid land urbanization in these two urban agglomerations’ cities in the following period of time.
Due to the lack of detailed demographic data, our study did not include small cities, but development in smaller cities is also an important part of China’s urbanization process. Since 1949, the Chinese central government has emphasized the importance of developing small and medium-sized cities. For example, in 1980, the government put forward the development policy of “controlling large cities, rationally developing medium-sized cities, and actively developing small cities.” This policy was supposed to help reduce regional development imbalances. However, for the 286 cities that we selected, a development imbalance between regions occurred nonetheless in the 25 years since the Reform and Opening-Up Policy was enacted, and the formation of urban agglomerations further exacerbated this imbalance [30].
4.2. Crop Production Lost Due to Excessive Urban Sprawl
The amount of available agricultural land is crucial for preserving China’s food security because China has a large population and few agricultural resources. China had 0.09 ha of agricultural land per person in 2015, which was roughly 47% of the global average and less than 20% of the United States [31]. Agricultural land protection and rational land use have always been key issues in China for ensuring food security, social stability, and sustainable development [9]. However, the present study suggested that excessive urban development has led to an insignificant loss in crop production. Song et al. concluded that the centralized urban expansion of megacities such as Beijing has contributed more to the loss of high-quality agricultural land than decentralized development by city groups [4]. Although the outward expansion of cities is mostly at the expense of agricultural land, most researchers are not pessimistic about the loss of agricultural land caused by urbanization. After comparing how different cities of different sizes develop and how that development affects food production, Hu et al. concluded that even though large cities require more land when expanding, their development should still be prioritized because economic output efficiency is significantly higher in large cities than in small-to-medium-sized cities [11]. Zhang et al. found that active agricultural lands in China declined by only 3.8% from 2000 to 2020, which implies that a significant increase in foreign food imports is not anticipated due to agricultural land loss [32].
Megacities and urban agglomerations have proliferated worldwide with burgeoning human populations, especially in China. China’s urbanization has been markedly spatially heterogeneous over the past few decades, with five urban agglomerations developing in the Yangtze River Basin and eastern coastline provinces, all of which have consistently experienced higher rates of land conversion than other Chinese cities. The continued development and differentiation of the economy will lead to further heterogeneity in the rate of urbanization. There are currently several cities (especially those in northeastern China, such as Liaoyuan, Tonghua, and Baishan, etc.) whose populations are declining. In contrast, we expect that the larger cities will continue to expand outward. As lands adjacent to nearly all cities in China were being increasingly urbanized from 1985 to 2010, city managers should have been more realistic in predicting the demand for urban infrastructure. Over-development drained fiscal resources, and the footprint of “ghost towns” (created by insufficient immigration) reduced arable land that could have been used to produce food.
China’s urbanization process has been under way for less than 50 years (since 1978), and the intense urbanization that occurred during these decades has certainly been accompanied by various problems. However, it also provides the government with lessons and ideas for future urbanization. The government should balance all aspects of urbanization and gradually promote a “people-oriented” urbanization process so as to solve various problems in this process in a timely manner.
5. Conclusions
This study systematically analyzed the relationship between land conversion and population growth, along with their implications for crop production, across 286 Chinese cities over the period from 1986 to 2010. The key conclusions are as follows:
First, an unprecedented rate of urban land conversion occurred during the study period, with the average land conversion rate (ALCR) showing substantial spatial heterogeneity: cities with an ALCR > 8.00 were mostly concentrated in the eastern coastal provinces and the Yangtze River Basin, where the mean ALCR was significantly higher than that of other regions (4.71, p < 0.001). In contrast, the average population growth rate (APGR) had no significant regional differences.
Second, the ALCR/APGR ratio was widespread and temporally dynamic: over 95.8% of cities had a land conversion rate that was higher than the population growth rate (mostly in the eastern coastal and Yangtze River Basin region), and the ratio decreased in 1986–1990 before increasing in 1991–2000 and 2001–2010.
Third, the imbalance between land conversion and population growth was associated with changes in per capita construction land area and regional crop production losses. The per capita area of most eastern coastal cities was >100 m2/person, while that of most Yangtze River Basin cities remained as <50 m2/person. Regarding crop production, losses were significantly higher in the eastern coastal/Yangtze River Basin region than in other areas. Notably, although the ALCR was lower in 2001–2010 than in 1986–1990, the period’s higher ALCR/APGR ratio led to the highest crop yield losses, accounting for ~64% of the total losses over 1986–2010.
This study is limited to the 1986–2010 period, which prevents it from capturing the latest dynamics of land conversion and population growth. Thus, future research should first incorporate updated post-2010 data to address this temporal gap. Future research should also conduct micro-scale analyses with high-resolution data, and integrate agricultural technology and policy factors into crop loss assessments to enhance the study’s depth and practical relevance.
Author Contributions
Conceptualization, H.Z. and Z.W.; methodology, Z.W.; software, H.Z. and Z.W.; validation, X.J., J.H. and Z.W.; formal analysis, H.Z.; investigation, X.J.; resources, Z.W. and J.H.; data curation, H.Z.; writing—original draft preparation, H.Z.; writing—review and editing, Z.W.; visualization, H.Z. and Z.W.; supervision, Z.W.; project administration, H.Z.; funding acquisition, H.Z. All authors have read and agreed to the published version of the manuscript.
Funding
This study was supported by the Zhejiang Provincial Natural Science Foundation of China (grant number LTGS24D010001) and the Nanxun Scholars Program for Young Scholars of ZJWEU (grant number RC2024021420).
Data Availability Statement
The original contributions presented in this study are included in the article. Further inquiries can be directed to the corresponding author.
Conflicts of Interest
The authors declare no conflict of interest.
Correction Statement
This article has been republished with a minor correction to the Data Availability Statement. This change does not affect the scientific content of the article.
References
- La Rosa, D.; Privitera, R.; Barbarossa, L.; La Greca, P. Assessing spatial benefits of urban regeneration programs in a highly vulnerable urban context: A case study in Catania, Italy. Landsc. Urban Plan. 2017, 157, 180–192. [Google Scholar] [CrossRef]
- Montgomery, M.R. The Urban Transformation of the Developing World. Science 2008, 319, 761–764. [Google Scholar] [CrossRef] [PubMed]
- Liu, G.; Yang, Z.; Chen, B.; Ulgiati, S. Monitoring trends of urban development and environmental impact of Beijing, 1999–2006. Sci. Total Environ. 2011, 409, 3295–3308. [Google Scholar] [CrossRef]
- Song, W.; Pijanowski, B.C.; Tayyebi, A. Urban expansion and its consumption of high-quality farmland in Beijing, China. Ecol. Indic. 2015, 54, 60–70. [Google Scholar] [CrossRef]
- Huang, Z.; He, C.; Zhu, S. Do China’s economic development zones improve land use efficiency? The effects of selection, factor accumulation and agglomeration. Landsc. Urban Plan. 2017, 162, 145–156. [Google Scholar] [CrossRef]
- Li, Y.; Jia, L.; Wu, W.; Yan, J.; Liu, Y. Urbanization for rural sustainability—Rethinking China’s urbanization strategy. J. Clean. Prod. 2018, 178, 580–586. [Google Scholar] [CrossRef]
- Cheng, L.; Jiang, P.; Chen, W.; Li, M.; Wang, L.; Gong, Y.; Pian, Y.; Xia, N.; Duan, Y.; Huang, Q. Farmland protection policies and rapid urbanization in China: A case study for Changzhou City. Land Use Policy 2015, 48, 552–566. [Google Scholar] [CrossRef]
- Lichtenberg, E.; Ding, C. Assessing farmland protection policy in China. Land Use Policy 2008, 25, 59–68. [Google Scholar] [CrossRef]
- Zhou, Y.; Li, X.; Liu, Y. Cultivated land protection and rational use in China. Land Use Policy 2021, 106, 105454. [Google Scholar] [CrossRef]
- Xin, L.; Li, X. China should not massively reclaim new farmland. Land Use Policy 2018, 72, 12–15. [Google Scholar] [CrossRef]
- Hu, G.; Li, X.; Zhou, B.B.; Ma, Q.; Meng, X.; Liu, Y.; Chen, Y.; Liu, X. How to minimize the impacts of urban expansion on farmland loss: Developing a few large or many small cities? Landsc. Ecol. 2020, 35, 2487–2499. [Google Scholar] [CrossRef]
- United Nations. World Urbanization Prospects: The 2018 Revision, Methodology; Department of Economic and Social Affairs, Population Division (UNDESA): New York, NY, USA, 2018. [Google Scholar] [CrossRef]
- Fang, C.; Yu, D. Urban agglomeration: An evolving concept of an emerging phenomenon. Landsc. Urban Plan. 2017, 162, 126–136. [Google Scholar] [CrossRef]
- Liu, X.; Huang, Y.; Xu, X.; Li, X.; Li, X.; Ciais, P.; Lin, P.; Gong, K.; Ziegler, A.D.; Chen, A.; et al. High-spatiotemporal-resolution mapping of global urban change from 1985 to 2015. Nat. Sustain. 2020, 3, 564–570. [Google Scholar] [CrossRef]
- Shi, L.; Wurm, M.; Huang, X.; Zhong, T.; Leichtle, T.; Taubenböck, H. Urbanization that hides in the dark—Spotting China’s “ghost neighborhoods” from space. Landsc. Urban Plan. 2020, 200, 103822. [Google Scholar] [CrossRef]
- Long, Y.; Wu, K. Shrinking cities in a rapidly urbanizing China. Environ. Plan. A Econ. Space 2016, 48, 220–222. [Google Scholar] [CrossRef]
- Li, Y.; Kong, X.; Zhu, Z. Multiscale analysis of the correlation patterns between the urban population and construction land in China. Sustain. Cities Soc. 2020, 61, 102326. [Google Scholar] [CrossRef]
- Liu, Z.; He, C.; Zhang, Q.; Huang, Q.; Yang, Y. Extracting the dynamics of urban expansion in China using DMSP-OLS nighttime light data from 1992 to 2008. Landsc. Urban Plan. 2012, 106, 62–72. [Google Scholar] [CrossRef]
- Sun, Y.; Zhao, S. Spatiotemporal dynamics of urban expansion in 13 cities across the Jing-Jin-Ji Urban Agglomeration from 1978 to 2015. Ecol. Indic. 2018, 87, 302–313. [Google Scholar] [CrossRef]
- Zhao, S.; Zhou, D.; Zhu, C.; Sun, Y.; Wu, W.; Liu, S. Spatial and Temporal Dimensions of Urban Expansion in China. Environ. Sci. Technol. 2015, 49, 9600–9609. [Google Scholar] [CrossRef]
- Hamilton, B.; Coops, N.C.; Lokman, K. Time series monitoring of impervious surfaces and runoff impacts in Metro Vancouver. Sci. Total Environ. 2021, 760, 143873. [Google Scholar] [CrossRef] [PubMed]
- Gong, P.; Li, X.; Zhang, W. 40-Year (1978–2017) human settlement changes in China reflected by impervious surfaces from satellite remote sensing. Sci. Bull. 2019, 64, 756–763. [Google Scholar] [CrossRef] [PubMed]
- Zhao, S.; Zhou, D.; Zhu, C.; Qu, W.; Zhao, J.; Sun, Y.; Huang, D.; Wu, W.; Liu, S. Rates and patterns of urban expansion in China’s 32 major cities over the past three decades. Landsc. Ecol. 2015, 30, 1541–1559. [Google Scholar] [CrossRef]
- Xu, X.; Liu, L. Dataset of Potential Crop Yield in China; Data Registration and Publishing System of the Resource and Environmental Science Data Center of the Chinese Academy of Sciences: Beijing, China, 2017; Available online: https://www.resdc.cn/DOI/DOI.aspx?DOIID=43 (accessed on 1 May 2023).
- Fischer, G.; Nachtergaele, F.O.; Prieler, S.; Teixeira, E.; Tóth, G.; Velthuizen, H.V.; Verelst, L.; Wiberg, D. Global Agro-Ecological Zones (GAEZ v3.0)-Model Documentation. 2012. Available online: https://iiasa.ac.at/models-tools-data/gaez (accessed on 10 May 2023).
- Liu, L.; Xu, X.; Chen, X. Assessing the impact of urban expansion on potential crop yield in China during 1990–2010. Food Secur. 2015, 7, 33–43. [Google Scholar] [CrossRef]
- Lu, J.; Jiang, M.; Li, L.; Hesketh, T. Relaxation in the Chinese Hukou System: Effects on Psychosocial Wellbeing of Children Affected by Migration. Int. J. Environ. Res. Public Health 2019, 16, 3744. [Google Scholar] [CrossRef]
- Chen, M.; Liu, W.; Lu, D. Challenges and the way forward in China’s new-type urbanization. Land Use Policy 2016, 55, 334–339. [Google Scholar] [CrossRef]
- Li, Z.; Luan, W.; Zhang, Z.; Su, M. Relationship between urban construction land expansion and population/economic growth in Liaoning Province, China. Land Use Policy 2020, 99, 105022. [Google Scholar] [CrossRef]
- Ruan, L.; He, T.; Xiao, W.; Chen, W.; Lu, D.; Liu, S. Measuring the coupling of built-up land intensity and use efficiency: An example of the Yangtze River Delta urban agglomeration. Sustain. Cities Soc. 2022, 87, 104224. [Google Scholar] [CrossRef]
- Jiang, L.; Guo, S.; Wang, G.; Kan, S.; Jiang, H. Changes in agricultural land requirements for food provision in China 2003–2011: A comparison between urban and rural residents. Sci. Total Environ. 2020, 725, 138293. [Google Scholar] [CrossRef]
- Zhang, X.; Brandt, M.; Tong, X.; Ciais, P.; Yue, Y.; Xiao, X.; Zhang, W.; Wang, K.; Fensholt, R. A large but transient carbon sink from urbanization and rural depopulation in China. Nat. Sustain. 2022, 5, 321–328. [Google Scholar] [CrossRef]
Disclaimer/Publisher’s Note: The statements, opinions and data contained in all publications are solely those of the individual author(s) and contributor(s) and not of MDPI and/or the editor(s). MDPI and/or the editor(s) disclaim responsibility for any injury to people or property resulting from any ideas, methods, instructions or products referred to in the content. |
© 2025 by the authors. Licensee MDPI, Basel, Switzerland. This article is an open access article distributed under the terms and conditions of the Creative Commons Attribution (CC BY) license (https://creativecommons.org/licenses/by/4.0/).