Abstract
Cultural ecosystem services (CES) represent the non-material relationships between people and nature, yet their intangible nature poses challenges for spatial planning and policy integration. This study examines CES in Gauja National Park, Latvia, focusing on symbolic, sacred, educational, and cultural heritage values—types often underrepresented in CES assessments. Using a Participatory Geographic Information Systems (PGIS) approach, a map-based public survey was conducted via ArcGIS Survey123, enabling respondents to mark and describe places of personal significance. While widely applied internationally, PGIS remains rarely used in Latvia, especially in planning and municipal decision-making. This study explores the use of the PGIS method for the assessment of CES, serving as a pilot application to test its suitability and potential for integration into spatial planning. Points of value were successfully georeferenced and reflect diverse associations. While well-known heritage sites were commonly mentioned, respondents also identified personally meaningful locations, sometimes situated outside the park’s formal boundaries. The findings highlight both the strengths and limitations of digital participatory methods, including issues related to response rates, accessibility, and digital literacy. The study demonstrates that mapping CES with PGIS can offer valuable insights for inclusive landscape governance and supports the incorporation of local perspectives into spatial planning.
1. Introduction
Ecosystem services (ES) are acknowledged in numerous international documents, including the European Green Deal [1], the European Union’s (EU) Biodiversity Strategy for 2030 [2], and the EU Green Infrastructure Strategy [3]. However, a gap remains between acknowledging the ES and the practical application of ES assessment in decision-making [4]. Cultural ecosystem services (CES) have been increasingly recognised as a vital component in human well-being and mental health, encompassing non-material benefits such as landscape aesthetics, recreation, identity, spirituality, heritage, and educational experiences [4,5,6,7]. These landscape values are hard to encompass, quantify, or express in monetary terms, and for this reason, they are rarely used as a tool for decision-making [4,8,9,10]. Often, CES are overlooked due to their perceived subjectivity and methodological challenges [8,11,12,13]; however, the under-representation of these service groups can lead to non-objective assessments of the landscape.
One of the biggest challenges in ES assessment is collecting data that accurately reflects the values held by society. Many researchers rely on expert methods, secondary sources, or biophysical indicators [8,14], but these data sources do not capture how people value and interact with their surrounding landscapes. Participatory methods are usually time- and resource-consuming [14,15] and less standardised, but can offer deeper insights into communities’ cultural values on a landscape scale.
A wide range of participatory methods have been employed in the CES assessment, reflecting the diversity of methods and the varied interpretations of the results. To gather qualitative data on CES values, the most often used method is surveys or questionnaires [16,17,18,19,20]. In addition to various survey methods, researchers employ face-to-face interviews [4,21,22], Q Methodology [23], pictures with different landscapes or scenarios [24,25], the workshop method [26,27], and the community voice method [21,22], which captures respondents’ answers in video format. Other studies have used online mapping surveys, leveraging platforms such as Maptionnaire [4,20,23,24], which enable outreach and structured value mapping.
A widely used approach is Participatory Geographic Information Systems (PGIS), which allows stakeholders and society to express spatial preferences and meaningful locations on digital maps [23,24]. While this method is well established in international research and applied in various planning contexts worldwide, in Latvia it remains an underutilised tool—particularly within municipal decision-making processes and official planning practice [28]. The integration of PGIS into local governance structures is still limited, and its potential to capture place-based cultural knowledge is largely untapped. PGIS methods often use interactive mapping sessions, workshops or online platforms. Even though these methods are beneficial for gathering large-scale georeferenced data, their reliance on digital infrastructure can pose several challenges in terms of access and inclusivity, particularly for older or less digitally literate populations [25]. In situations where data collection for CES assessment is required for decision-making or spatial planning purposes by municipalities, rational and resource-efficient solutions are vital. Such methods can offer a valuable and cost-effective way to engage communities and capture place-based knowledge.
CES vary significantly according to geographical, cultural, and historical context. Several scholars have emphasised the importance of recognising regional differences in CES perception, particularly when developing context-sensitive planning strategies [6,9,12,13,29]. For instance, Bogdan et al. [9] show how symbolic and heritage values in the Romanian Carpathians are deeply influenced by local traditions and community memory, while Csurgó and Smith [27] highlight how rural landscapes in Hungary embody culturally embedded services that are not easily transferable or generalisable to other contexts.
Despite this contextual richness, Eastern European landscapes remain underrepresented in CES research, especially when compared to Central or Western European countries. The region’s socio-political history, including collectivisation, land reform, and shifting settlement patterns, has shaped how people relate to nature and landscape, creating unique cultural layers that are rarely captured in existing CES assessment frameworks [9,27,29]. In Latvia, cultural ties to the landscape are strongly present in oral traditions, symbolic sites, and sacred natural features. However, these values are often invisible in planning documents and poorly reflected in decision-making processes.
Within this broader context, protected areas—particularly national parks—offer a significant setting for CES assessment. These territories often encompass diverse landforms and cultural heritage elements, including sacred sites, historical ruins, educational trails, and emblematic landscapes. However, the focus of planning documents and previous assessments is mostly on natural values and the protection of specific objects. As Tengberg et al. [30] and Ma et al. [31] note, national parks are not only ecological reserves but also landscapes of memory, identity, and knowledge transmission. They function as collective reference points, offering a sense of continuity and belonging while also accommodating individual attachments and symbolic interpretations. Assessing CES in these areas can provide crucial insight into how local and visiting communities understand and value nature—not only as a biophysical space but as a cultural and emotional environment.
Moreover, national parks are ideal sites for participatory landscape research due to their visibility, accessibility, and perceived legitimacy as public spaces. However, even in these areas, formal planning processes often fail to integrate cultural values systematically. In many cases, management focuses on ecological indicators or visitor infrastructure, without fully considering how people experience the landscape symbolically or spiritually. This disconnect may lead to missed opportunities for building stronger connections between governance institutions and the communities they serve [27,32].
This study explores the use of the PGIS method for the assessment of CES, serving as a pilot application to test its suitability and potential for integration into spatial planning. In particular, it applies a fully online version of PGIS using ArcGIS Survey123 Connect, version 3.22, which does not require face-to-face facilitation, offering a resource-efficient approach especially suitable for under-resourced municipalities. Rather than providing a final evaluation, the study offers insights into the method’s practical implementation and highlights considerations for its further development. This study uses the Gauja National Park in Latvia as a testing ground for the PGIS methodology in assessing other nationally significant landscape areas, thereby supporting informed decision-making. Three research questions guide this research:
- Do participants using PGIS tend to identify sites that are already widely recognised and socially accepted as valuable, or do they also mark locally known, not commonly known, places and values?
- Do participants tend to agree on the cultural significance of well-known places, or do perceptions of value vary significantly between individuals or groups?
- Is online PGIS an appropriate tool for all age groups, or is it more accessible to younger generations? To what extent can georeferenced data be effectively collected through online platforms without prior training or technical assistance?
Although Gauja National Park is managed centrally by the Nature Conservation Agency, its territory spans several municipalities, each with its own planning responsibilities and priorities. This fragmented governance structure often results in disjointed implementation and limited integration of community perspectives. While Latvian planning legislation formally includes public consultation processes in different planning levels, including nature protection plans [33,34,35,36,37]; in practice, these are often perceived as procedural and insufficiently participatory. Local voices are often invited but rarely deeply integrated into decision-making processes. In this context, the participatory mapping approach adopted in this study offers a complementary bottom-up method, aiming to document and visualise how people experience and value landscapes beyond what is typically captured in formal planning documents.
2. Materials and Methods
The classification of CES in this study followed the Common International Classification of Ecosystem Services (CICES version 5.2) [26]. Aesthetic appreciation and recreational use were excluded from the analysis, as these two ES classes are commonly addressed in separate studies [19,27,29,38], often at the expense of other cultural ecosystem services. Instead, the focus was placed on less frequently assessed services such as symbolic, cultural heritage, educational, and spiritual (sacred) value.
Regarding the terminology used throughout this research, we refer to landscape values rather than the CES class division, as it could be complicated and misleading for respondents to understand the ES concept without prior explanation. Several CES classes are combined under a single value to avoid an overly complicated structure of the PGIS form. For the division between values, including their simple descriptions and CES classes (CICES v5.2), see Table 1.

Table 1.
Classification of selected cultural values and associated CICES v5.2 service categories.
2.1. Study Area
Gauja National Park was chosen for this study due to its unique character, diverse landscapes, and, according to the Latvian Landscape Atlas [43], it has been identified as one of the 18 landscapes of national importance. The territory is also planned to become the first bio-region of Latvia, with various sustainable resource management goals, including environmental education and the sustainable use of cultural and natural heritage, as well as tourism based on inner harmony and authentic experiences, and active community and youth engagement [44].
The park was created in 1973, and it is the oldest and largest National park in Latvia, covering an area of 91,786 hectares, and is divided into five functional zones: strict nature reserve zone; nature restricted area; landscape protection zone; cultural and historical zone; and neutral zone [45]. Several areas of high biological value have been designated as reserve zones: Nurmiži Ravine, Roči Forest, Inciems Fossil Valley, and Sudas Mire. The main aim of the park is to protect the unique natural values of the Gauja River valley and its surrounding landscape, while ensuring both recreational and nature conservation functions within the territory. Within Gauja National Park, strict nature reserves are designated zones where all forms of economic activity and human presence are prohibited. Although these areas comprise only a small portion of the park, they are of exceptional ecological and conservation value and remain inaccessible to the public. In the remainder of the park, land use and management practices are allowed only insofar as they do not significantly transform the historically evolved landscape structure. The territory of Gauja National Park encompasses more than 500 cultural and historical heritage sites, including hillforts, stone castles, churches, manors, watermills, windmills, and various other archaeological, architectural, and artistic monuments. The main character of the park is the Gauja River valley, featuring rich Devonian sandstone formations—cliffs, caves and springs—that support high biodiversity [46].
In addition, every ten years, a Nature Protection Plan for Gauja National Park is developed [47]. This document defines zoning, protection, and management measures based on the latest evaluations and data regarding the territory. The plan includes 35 annexes, covering various aspects of the area’s assessment, including visitor flow analysis.
Visitor numbers vary significantly throughout the year, across weeks, and even within a single day. Depending on the object, the number of visitors can range from fewer than ten people to over one hundred, especially during good weather conditions, weekends, and at easily accessible sites. It is important to note that the most recent visitor count analyses were conducted in 2019 and 2020, when COVID-19 restrictions affected people’s mobility. The data were collected using automated counting devices.
Latvia, in general, has a very flat landscape compared to mountainous regions. For this reason, the Gauja River valley is considered one of the most distinctive landforms in Latvia and is renowned for its many far-reaching and iconic views across the landscape (see Figure 1).
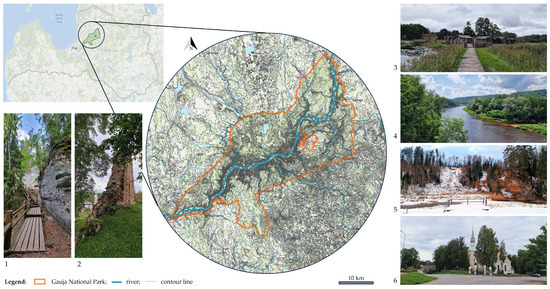
Figure 1.
Gauja National Park location in the context of Latvia and the landscape character: (1) Sietiņiezis rock; (2) Rauna castle ruins and church; (3) Āraiši Lake Fortress; (4) Gauja River valley view at Sigulda; (5) Zvārtes rock; (6) Evangelical Lutheran Church of Rauna (created by authors using ArcGIS Online, version June 2025).
2.2. Method
This method used a PGIS approach to assess CES using ArcGIS Survey123 Connect, version 3.22, which was the latest release during March–April 2025 when the data collection took place. Although PGIS has been widely applied across various research contexts, its use in assessing cultural ecosystem services still presents notable limitations—particularly regarding the depth of value interpretation and respondent engagement [12]. Fully online PGIS approaches, without complementary face-to-face assessments, remain relatively rare and often struggle to capture the nuanced and place-based meanings embedded in cultural values. This tool supports the creation of advanced, logic-driven and spatially enabled surveys through the XLSForm standard. The regular Survey123 tool does not allow multiple georeferenced point marking; therefore, the Survey123 Connect tool was chosen. This platform enabled georeferenced data collection tied to user-identified landscape values in Gauja National Park.
The survey structure is defined in an Excel workbook following the XLSForm specification, which consists of multiple interconnected sheets. The survey sheet contains the main survey content, with each row corresponding to a specific question, note, or group of questions. Question types include text, select_one, note, and geopoint, among others. The form design incorporates HTML-formatted labels for visual clarity and guidance, as well as grouping elements (begin group, end group) to structure the survey thematically. The choices sheet stores predefined answer options for multiple-choice questions, using list_name references to link them to corresponding questions. The settings sheet defines global parameters, including the form title, unique ID, and submission configurations necessary for deploying the survey within the ArcGIS environment. OpenStreetMap [48] was used as the base map for geospatial referencing and visualisation within the survey platform. The survey incorporates various logic and interface features:
- -
- Required questions and readonly fields to control data input;
- -
- Explanatory notes and guidance hints to assist participants;
- -
- Default values and constraint logic to ensure consistency and data quality.
A core component of the methodology was the integration of spatial data collection via georeferenced questions. This allowed respondents to mark specific locations within the landscape that they associate with particular cultural values (e.g., symbolic, cultural–historical, educational, spiritual). The ability to collect georeferenced points directly from respondents is a distinctive feature of Survey123 Connect, transforming the survey into a PGIS tool. This spatial dimension is crucial for identifying the distribution and perception of cultural ecosystem services across the study area.
2.3. Survey
The survey was conducted in the Latvian language and was available to respondents from 30 April to 30 June 2025. A complete list of the survey questions translated into the English language is provided in Supplementary Materials, Table S1. It begins with a question about the frequency of visits to Gauja National Park, with answers ranging from “every day” to “first-time visitor.” If the response “I am here for the first time” is selected, a follow-up question asks whether the survey is being completed before or after the visit. If after is chosen, the respondent continues with the full questionnaire. However, if before the visit is selected, the survey redirects to a single open-ended question about the motivation for visiting the park and then skips directly to the demographic section. This logic was implemented intentionally to ensure that respondents with no prior experience of the landscape do not provide inaccurate or speculative responses regarding the perceived values or characteristics of specific places in the park. To ensure data validity and thematic reliability, the survey limited detailed mapping and value assessment questions to respondents with at least some personal experience of the area. This was particularly important in the context of participatory GIS, where spatial references are expected to reflect actual perceptions.
The online survey is structured as follows: After an initial question about the frequency of visits to Gauja National Park, participants are presented with a multiple-choice question asking them to identify which types of cultural ecosystem service values—beyond recreational opportunities—they perceive in the park. Based on the selected values, participants are then shown a corresponding set of follow-up questions for each value category. Each value-specific section includes the following components:
- -
- A brief explanatory note introducing the particular type of value (e.g., symbolic, cultural historical, educational, sacred);
- -
- A georeferenced question, allowing the participant to mark one or multiple georeferenced locations on the map;
- -
- An openended descriptive question, asking either to describe the selected point(s), or, if mapping was not possible, to describe the related landscape elements more precisely;
- -
- An optional prompt to upload a photo representing the identified value or location.
All questions within these thematic blocks are non-mandatory in order to accommodate participants with varying levels of digital literacy and to ensure that the form remains accessible even for those less familiar with map-based tools or mobile technology.
The last part of the survey consists of demographic questions, which include age, gender, living location, as well as an additional question asking if the participant is employed in the field of landscape planning, architecture, nature research or similar fields.
To ensure broad participation and representation, the survey was distributed using a combination of targeted outreach and public engagement strategies. Direct contact was established with various institutions associated with Gauja National Park, including local municipalities, tourism information centres, and relevant stakeholder networks. These contacts were approached primarily via email. Additionally, the survey was shared through social media platforms, including both interest-based community groups and personal accounts, to reach a diverse range of users. Individual invitations were also sent to selected participants who were considered relevant due to their familiarity with the park or professional background. To further increase visibility, physical posters containing QR codes linking to the online survey were displayed in popular visitor locations throughout Gauja National Park.
2.4. GIS Data Processing
Next steps included data processing and analysis in the ArcGIS software. As the Survey123 Connect platform is integrated with ArcGIS, all the data was available immediately for data processing. The PGIS survey allowed respondents to mark points of value on their own using geolocations or describe the points of value using open-ended questions. Locations provided in the survey in text form have to be manually geocoded to create corresponding points on the map. Each location mentioned in the text form was represented as an individual point, regardless of whether multiple respondents mentioned the same place. Manually marked points were added to the database together with the points marked by respondents, creating a data pool for this research.
Each mapped point in the dataset was enriched with a set of attribute fields derived from the survey structure. These included the type of cultural ecosystem service value (e.g., symbolic, cultural–historical, educational, or sacred), the respondent’s descriptive comment, and, when available, a photo attachment. In cases where respondents provided multiple points for the same value type, each point was assigned a unique identifier and linked to its corresponding textual description. The dataset also included fields such as the respondent ID, the value category, and a point name or title, if provided. This structured format enabled both spatial and thematic analysis, allowing for the identification of spatial clusters, value-specific patterns, and individual narratives associated with each location. Additionally, manually geocoded points from open-ended text responses were integrated using the same attribute schema to ensure consistency across the dataset.
3. Results
The following section presents the key findings of the PGIS conducted in Gauja National Park. Respondents were asked to mark the locations they associate with specific CES values.
The results below give an overview of the spatial distribution and frequency of identified CES values (symbolic, cultural heritage, educational, and sacred). Many studies in CES assessment tend to focus primarily on natural landscape elements, mainly due to the emphasis on the aesthetic and recreational values of the landscape [4,6,19,29,39]. In contrast, the value types for this study often relate more closely to built or historically altered elements within the landscape, such as buildings, ruins, or interpretive sites. However, natural features are also frequently represented.
3.1. Respondent Description
At the end of the survey process, 54 valid surveys were collected. Respondents’ frequency of visits to Gauja National Park (GNP) varied significantly (see Figure 2). The sample included frequent visitors, as well as occasional and first-time visitors, with four participants visiting the park for the first time. Among these first-time visitors, three were unable to identify any specific landscape values. Notably, two distinct groups emerged: 13 respondents reported visiting GNP daily, while 17 visited less than once a month. Across all visit frequency categories, at least one respondent identified recreational opportunities as the only perceived value, while others marked a wide range of both iconic and lesser-known values.
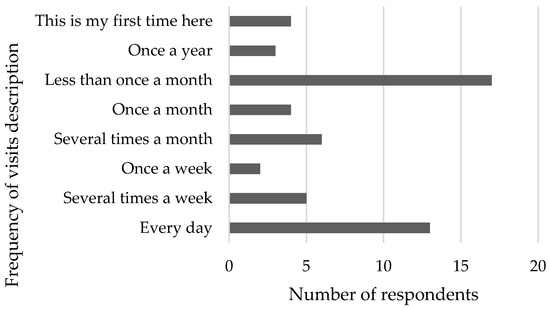
Figure 2.
Frequency of visits to the Gauja National Park.
The data does not indicate a clear link between visit frequency and the type or number of values identified (see Table 2). Similarly, the number of marked objects does not relate to how often respondents visit the park.
Table 2.
Relationship between visit frequency and the number of cultural landscape values identified.
While the mapping tool does not enable full societal representation—since individuals without access to digital technology are excluded—it still demonstrates engagement across a broad social spectrum, involving respondents of different ages, backgrounds, and degrees of connection to the territory.
Among the respondents, 37 identified as women, 15 as men, and two chose not to indicate their gender. Regarding age distribution, no participants were under 18 years of age. The age categories were represented as follows: two respondents were aged 18–24, thirteen were aged 25–34, fifteen were aged 35–44, nine were aged 45–54, eight were aged 55–64, and six were aged 65 or older.
Only eight respondents reported having a professional background related to landscape planning, architecture, nature research, or a related field. In terms of place of residence, 12 respondents indicated that they live within the Gauja National Park, 18 within a 10 km radius, and 7 within a 30 km radius. Seventeen respondents live more than 30 km away, including two who reside abroad.
3.2. Spatial Distribution of Values
The points identified by respondents were marked on the map (see Figure 3). However, in several cases, locations were described only in written text within the survey, requiring interpretation to locate them spatially. Generally, the spatially marked points aligned well with the accompanying textual comments. Most locations were accurately identified; in a few instances, specific objects (e.g., ruins or a church) were not marked directly on the structure itself but instead on the correct side of the nearby settlement. Respondents marked between 0 and 10 spatial points in their survey responses.
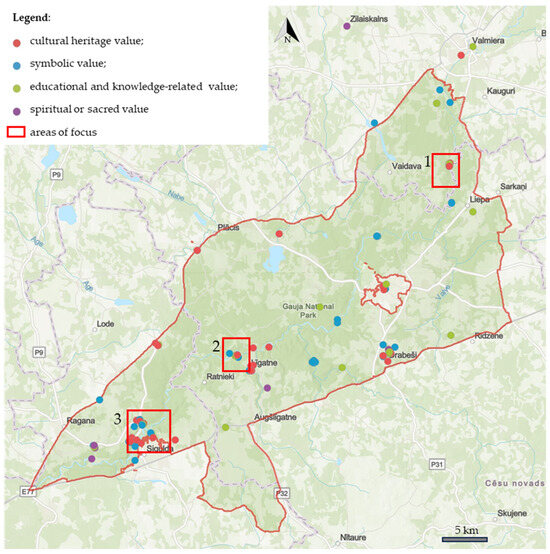
Figure 3.
Points representing CES value and areas of focus (described further in the paper): 1. The Sietiņiezis rock, 2. Līgatne Nature Trails, 3. Turaida and the Gauja River near Sigulda (created by the authors using ArcGIS Online, version June 2025 (Esri, OpenStreetMap) [48]).
Respondents identified a total of 71 points, distributed as follows: 21 points of symbolic value, 23 points of cultural heritage value, 17 points of educational and knowledge-related value, and 3 points of spiritual or sacred value. The accompanying textual comments were clear and interpretable, allowing all written descriptions to be spatially located and digitised. The number of written (but not spatially drawn) points ranged from 0 to 19 per respondent. When these additional locations were manually interpreted and digitised in ArcGIS, they contributed a further 64 points: 27 symbolic, 29 cultural heritage, 7 educational and knowledge-related, and 8 spiritual or sacred value points. In total, 135 distinct points were identified: 48 symbolic, 52 cultural heritage, 24 educational and knowledge-related, and 11 spiritual or sacred.
In addition, several respondents emphasised the Gauja River and its valley as the most symbolically significant element of the landscape. Rather than marking a single location, they described the entire river corridor as a continuous, identity-forming landscape feature. One respondent wrote, “The Gauja River and its valley are the main contributors to the park’s recognisability, especially at points where long views open up over the flowing river, from bridges and hillsides”. Another noted, “It is the Gauja Valley—the very foundation upon which this unique ecosystem complex has developed”. These comments reflect the perception of the Gauja not as an isolated feature but as a structuring axis of both natural and cultural meaning. Several participants described specific viewpoints or landmarks associated with the river—such as the pedestrian bridge in Sigulda, Zvārtes Rock, and Ērgļu Cliffs—as vantage points from which the symbolic landscape can be experienced as a whole. These responses suggest that some symbolic landscape values are not tied to discrete locations but rather associated with broader linear or areal features such as the river valley itself, which participants perceive as a continuous cultural and natural landscape.
3.3. Value Overlap Examples
While some values overlapped geographically, many locations were linked to multiple value types, reflecting the fact that different respondents often assigned different meanings and values to the same place. Three such examples are illustrated below.
The zoomed-in map in Figure 4 displays the area surrounding Sietiņiezis rock, one of Latvia’s most iconic natural landmarks—a renowned and popular tourist destination closely connected to local legends and national identity. It is a protected geological and geomorphological natural monument, composed of striking white sandstone formations from the Devonian period [49].

Figure 4.
The Sietiņiezis rock (created by the authors using ArcGIS Online, version June 2025 (Esri, OpenStreetMap) [48]).
Based on survey responses, the site is mainly regarded as highly symbolically significant, though respondents also recognised its cultural heritage, along with its educational and knowledge-related importance. In their written comments, respondents emphasised not only the uniqueness of the sandstone formation but also the scenic views over the Gauja River valley, both of which enhance the site’s experiential and symbolic value.
Figure 5 shows the zoomed-in results around Līgatne Nature Trails, a network of walking paths within the traditional forest landscapes of Gauja National Park, which offers visitors opportunities to observe and learn about wild animals in their natural habitat [50]. Most respondents marked the entrance area of the trail system on the map. The primary value associated with this site is educational and knowledge-related, although responses also noted cultural heritage and symbolic values.
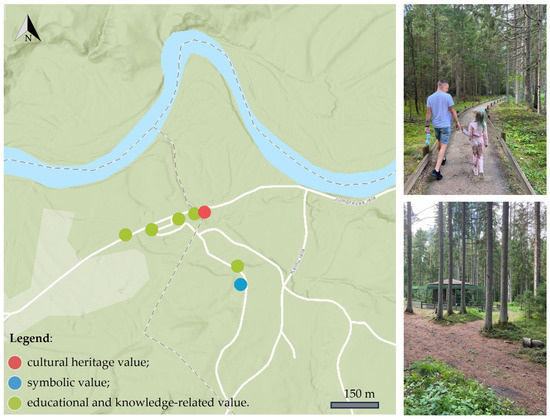
Figure 5.
Līgatne Nature Trails (created by the authors using ArcGIS Online, version June 2025 (Esri, OpenStreetMap) [48]).
Additionally, several respondents noted that caves and ruins throughout the park hold cultural or symbolic significance. However, these features were not individually marked on the map, as the park’s vast area makes it difficult to represent all of such elements spatially.
Figure 6 shows a zoomed-in section that highlights several significant sites within Gauja National Park, including the Turaida Museum Reserve, Gūtmaņa Cave, the bridge over the Gauja River, and a nearby scenic viewpoint. Gūtmaņa Cave, the largest cave in Latvia by volume, is one of many Devonian sandstone formations in the region and was identified by respondents as holding cultural heritage value [51]. The Turaida Museum Reserve is a protected complex of cultural monuments, recognised for its historical, scientific, and cultural significance [52]. Respondents acknowledged the full range of surveyed cultural ecosystem values at this site, individually indicating which specific value was most relevant in their perception.
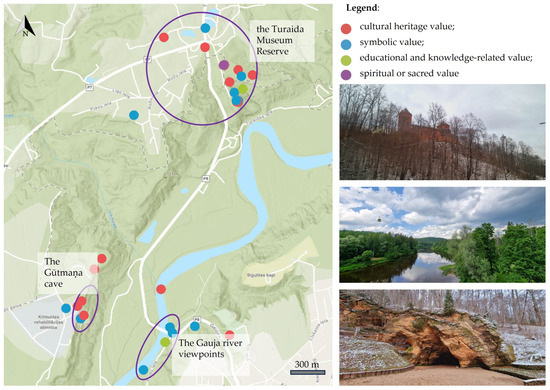
Figure 6.
Turaida and the Gauja River near Sigulda (created by the authors using ArcGIS Online, version June 2025 (Esri, OpenStreetMap) [48]).
While most of the georeferenced points corresponded to recognised cultural or natural features, a few responses revealed deeply personal connections to specific locations. One such example is a comment referring simply to “Ah, this good old countryside house”, suggesting a place of private emotional significance. Although the location itself is not a well-known landscape element, the act of marking it demonstrates how individuals may assign symbolic value to personally meaningful sites, even if they are not of general cultural relevance. However, these highly individual cases were rare, and most of the symbolic points still referred to places of broader communal or historical recognition.
More frequently, participants added personal narratives to widely recognised landmarks, offering layered interpretations of familiar places. For instance, one respondent wrote about the Gauja Valley near Sigulda, recalling, “When I was little, we often went to the hot air balloon festivals. We sat in the Sigulda valley, and my parents told me what a hot air balloon is, how it works, and what balloon piloting means. That memory has stayed with me and seemed very educational”. Another participant mentioned that “Every corner of the landscape near Āraiši feels special, because I live nearby”, even noting places like a meadow next to a guesthouse and a windmill. These responses enrich the spatial data by adding qualitative depth, showing that even commonly known places can carry highly individual meanings, shaped by memory, routine, and attachment.
Although the survey explicitly asked respondents to identify locations within Gauja National Park, several marked points were situated outside the park’s official boundaries. Notable examples include the church in Rubene and the town of Valmiera in the north, as well as Zilaiskalns, which lies at a considerable distance from the park. Similarly, Cēsis—while technically outside the designated park area—was also frequently mentioned. These results suggest that participants’ perceptions of landscape identity extend beyond administrative borders, indicating that some sites are understood as functionally or visually connected to the park. The proximity of these places and their scenic, symbolic, or historical associations may contribute to their inclusion in the respondents’ mental maps of the park.
4. Discussion
The assessment of CES through participatory GIS revealed a diverse set of landscape values. At the same time, it highlighted broader structural and societal factors that influence how these values are perceived and communicated.
4.1. Respondent Motivations and Engagement Barriers
While the survey was distributed via digital platforms and required basic technological literacy (e.g., navigating maps, uploading content), the results suggest that this did not necessarily increase participation among younger age groups. Instead, the most active respondents were primarily in the 25–54 age range, which may reflect a higher level of engagement with landscape-related topics and community values in these life stages, rather than technological ease alone. This indicates that digital tools do not inherently favour younger participants, and that motivation, interest, and relevance of the topic are likely more decisive factors in participatory engagement.
A significant issue is the willingness or reluctance of individuals to participate in such mapping exercises. While digital tools like Survey123 offer efficiency and scalability, they still rely on participants actively choosing to engage. As previous research has shown, people may avoid sharing their perceptions for several reasons: unfamiliarity with digital platforms, uncertainty about how their input will be used, or even discomfort in articulating the deeply personal or symbolic meanings associated with a place [10,53]. In this study, it was not possible to determine how many individuals opened the survey but chose not to complete it. This lack of metadata represents a missed opportunity to understand whether survey complexity, digital barriers, or emotional hesitation could cause dropouts. Including such analytics would allow researchers to adjust the survey structure and reduce participation barriers in future iterations. This highlights the importance of developing more inclusive methods, particularly when the aim is to inform spatial planning and land management.
An additional layer of complexity is the heterogeneity of user groups. While this study did not reveal strong patterns based on age, profession, or distance from residence, the literature suggests that perceptions of CES often vary between long-term residents, newcomers, and tourists [9,17]. These groups may prioritise different services or attach distinct meanings to the same landscape elements. Understanding such divergence is essential for equitable and context-sensitive planning.
CES are often perceived as subjective or non-essential, and their integration into policy remains limited, partially due to challenges in data collection and interpretation [26,32]. However, participatory methods, such as the one used in this study, reveal how local and cultural meanings can be made visible and spatially explicit. When communities are invited to define what they value in the landscape, the resulting data can serve not only ecological but also social and cultural planning objectives.
Interestingly, no clear patterns emerged between professional background and the type or richness of responses. Participants with expertise in landscape or environmental fields did not systematically provide more georeferenced points, different value types, or more detailed descriptions than non-professionals. Similarly, it might be expected that residents would highlight more hidden or lesser-known places due to their familiarity with the area. However, this was not evident in the data. Landscape values were recognised equally by both local inhabitants and visiting participants, suggesting that the experience and appreciation of CES is not limited to those with professional or geographic proximity but is accessible and interpretable by a broad range of users.
4.2. Perceptions Beyond Boundaries: Interpreting Spatial Patterns
A key insight from this research is the fluidity of how people perceive space. Several marked locations were situated outside the official boundaries of Gauja National Park. This suggests that for many respondents, the park is not a fixed administrative area, but rather a mental and emotional landscape that extends into nearby towns, symbolic landmarks, and personal histories. These “soft edges” are often overlooked in conventional GIS-based planning, which tends to prioritise clear-cut zoning boundaries. Recognising mental geographies can thus enrich planning approaches and enhance the legitimacy of place-based approaches [29,40].
4.3. Overlapping Values and Planning Implications
From a governance perspective, municipalities and protected area managers could benefit from using such participatory tools to gain a deeper understanding of the lived experiences of residents and visitors. CES mapping not only provides insights into perceived cultural value but also helps identify tensions, such as areas of symbolic importance that are not formally recognised in planning, or the absence of meaningful sites in zones designated for tourism. Integrating CES into planning processes could improve policy acceptance and foster stronger community stewardship, particularly in rural and protected areas [27,32].
However, applying these insights in practice requires institutional readiness. Data derived from participatory mapping must be interpreted in ways that respect the diversity of cultural perspectives, while also being compatible with decision-making frameworks. This calls for better tools, training, and interdisciplinary collaboration across planners, ecologists, sociologists, and IT specialists. Moreover, as several studies have suggested, integrating CES into policy frameworks can help bridge the gap between those who culturally value ecosystems and those who hold administrative power [32].
4.4. Methodological Reflections: Advantages and Limitations
The use of Survey123 Connect proved advantageous for this research, particularly due to its integration with the ArcGIS environment and its support for spatially explicit data collection. One of the key strengths of this method lies in the ability to include geopoint questions, allowing respondents to directly mark specific locations associated with cultural values within the landscape. This functionality is essential for implementing a PGIS approach, in which the spatial dimension of public perception plays a central role in identifying and analysing landscape values. Furthermore, the platform supports offline data collection, which is particularly important in fieldwork settings where internet connectivity is limited or unavailable. Survey123 Connect uses the XLSForm format, which offers a structured and transparent way of developing complex surveys. This format supports a wide range of question types, conditional logic, grouping, and constraints, facilitating version control and iterative testing during the survey development process. The use of HTML tags in question labels allowed for the inclusion of styled explanatory texts, improving user guidance and survey readability (text colouring, centred text, etc., formatting features). In combination, these features enabled the creation of a comprehensive and logically structured survey capable of capturing both qualitative responses and spatial data.
However, several limitations and technical challenges were also encountered during the development and implementation of the survey. The initial complexity is high, as preparing the XLSForm file requires in-depth familiarity with the XLSForm specification, including field types, syntax, and dependencies. For example, nested logic, such as showing specific follow-up questions based on multiple selections in a prior question, had to be carefully scripted using conditional expressions (e.g., selected(${question}, ‘option1’) and selected(${question}, ‘option2’)). This created a steep learning curve for non-programmers. For this reason, assistance from an AI-based language model (ChatGPT, July 2025 version by OpenAI) was used during this step to support the design and logic formulation of the XLSForm structure. In cases where a question allows multiple answers, it is not straightforward to trigger follow-up questions for each selection. Instead, all potential conditions must be manually defined in the XLSForm logic, which becomes increasingly complex and prone to errors in surveys with many branching paths. While Survey123 supports a range of question appearances, customisation of the visual interface (e.g., formatting, responsiveness, layout) is limited compared to complete web-based survey tools. This can impact user experience, especially on mobile devices.
Despite these limitations, Survey123 Connect was selected for its unique ability to combine survey data collection with geospatial accuracy, making it highly suitable for participatory mapping of landscape values. Careful planning, iterative testing, and structured design mitigated many of the inherent challenges in form development.
5. Conclusions
The findings of this study allow for reflection on the initial research questions concerning the types of places identified, the diversity of value perceptions, and the applicability of PGIS across user groups. Overall, participants predominantly marked well-known and socially recognised sites—such as Līgatne, Turaida, Āraiši, and Sigulda—as holding CES values. This confirms that iconic places act as focal points of shared meaning and identity. However, in some cases, participants also pointed to less visible or personally meaningful locations, including private properties or natural elements without formal recognition. These responses, though fewer, demonstrate that PGIS is capable of capturing both collective and individual perspectives on landscape values.
In addressing the second research question, which explored whether cultural significance is perceived consistently across users or varies individually, the data suggest a nuanced picture. While specific locations were repeatedly marked, the types of values attributed to them varied: the same place might be viewed as symbolic, educational, or spiritual, depending on the respondent. Personal narratives attached to common landmarks reveal the layered character of landscape meaning, where public and private interpretations coexist. This underlines the importance of open-ended questions in complementing geospatial data, as they reveal how the same landscape element may carry very different connotations.
Lastly, the study explored the suitability of online PGIS tools for a diverse participant base, particularly across different age groups. Contrary to expectations that younger people would be more actively engaged, the most responsive age groups were 25–54 (that includes age groups 25–34, 35–44, 45–54), with relatively few participants under 25. Moreover, respondents aged 55 and above also engaged meaningfully with the survey. This suggests that technological familiarity is not the sole determinant of participation; rather, interest in the topic and connection to the place play a stronger role. The successful use of geolocation functions and the ability to provide meaningful qualitative input without prior training support the notion that PGIS can serve as an effective method for participatory CES assessment across diverse user profiles.
Looking forward, this research will continue through a multi-method approach. In-depth interviews with stakeholders from different sectors—such as tourism, heritage conservation, education, and local governance—will be conducted to contextualise and expand upon the spatial data collected. These interviews will help reveal motivations, conflicts, and shared narratives that may not be captured through survey methods alone. Furthermore, the mapped CES values will be compared with existing geospatial data layers, including zoning plans, heritage inventories, and ecological indicators. This comparison will help identify mismatches or blind spots in current planning frameworks and support the development of more integrative strategies for sustainable landscape management.
Supplementary Materials
The following supporting information can be downloaded at: https://www.mdpi.com/article/10.3390/land14091822/s1, Table S1: Survey Question Summary.
Author Contributions
Conceptualisation, A.S. and M.M.; methodology, A.S.; software, A.S.; formal analysis, A.S. and M.M.; investigation, A.S.; resources, A.S. and M.M.; data curation, M.M.; writing—original draft preparation, A.S.; writing—review and editing, A.S. and M.M.; visualisation, M.M. All authors have read and agreed to the published version of the manuscript.
Funding
This research was funded by the European Regional Development Fund (ERDF) project “LBTU Doctoral Support and Development Initiative”, project No. 1.1.1.8/1/24/I/002.
Data Availability Statement
The raw data supporting the conclusions of this article will be made available by the authors on request.
Conflicts of Interest
The authors declare no conflicts of interest.
References
- European Commission. The European Green Deal, COM(2019) 640 Final; European Commission: Brussels, Belgium, 2019. [Google Scholar]
- European Commission. EU Biodiversity Strategy for 2030: Bringing Nature Back into Our Lives, COM(2020) 380 Final; European Commission: Brussels, Belgium, 2020. [Google Scholar]
- European Commission. Green Infrastructure (GI)—Enhancing Europe’s Natural Capital, COM(2013) 249 Final; European Commission: Brussels, Belgium, 2013. [Google Scholar]
- Müller, S.M.; Peisker, J.; Bieling, C.; Linnemann, K.; Reidl, K.; Schmieder, K. The Importance of Cultural Ecosystem Services and Biodiversity for Landscape Visitors in the Biosphere Reserve Swabian Alb (Germany). Sustainability 2019, 11, 2650. [Google Scholar] [CrossRef]
- Costanza, R.; d’Arge, R.; de Groot, R.; Farber, S.; Grasso, M.; Hannon, B.; Limburg, K.; Naeem, S.; O’Neill, R.V.; Paruelo, J.; et al. The Value of the World’s Ecosystem Services and Natural Capital. Ecol. Econ. 1998, 25, 3–15. [Google Scholar] [CrossRef]
- Milcu, A.I.; Hanspach, J.; Abson, D.; Fischer, J. Cultural Ecosystem Services: A Literature Review and Prospects for Future Research. Ecol. Soc. 2013, 18, 44. [Google Scholar] [CrossRef]
- Spage, A. Landscape Quality Evaluation Using Cultural Ecosystem Service Assessment Methods. In Proceedings of the Research for Rural Development 2023, Jelgava, Latvia, 17–18 May 2023; Latvia University of Life Sciences and Technologies: Jelgava, Latvia, 2023; pp. 229–234. [Google Scholar]
- Balázsi, Á.; Dänhardt, J.; Collins, S.; Schweiger, O.; Settele, J.; Hartel, T. Understanding Cultural Ecosystem Services Related to Farmlands: Expert Survey in Europe. Land Use Policy 2021, 100, 104900. [Google Scholar] [CrossRef]
- Bogdan, S.M.; Stupariu, I.; Andra-Topârceanu, A.; Năstase, I.I. Mapping Social Values for Cultural Ecosystem Services in a Mountain Landscape in the Romanian Carpathians. Carpathian J. Earth Environ. Sci. 2019, 14, 199–208. [Google Scholar] [CrossRef]
- Fish, R.; Church, A.; Winter, M. Conceptualising Cultural Ecosystem Services: A Novel Framework for Research and Critical Engagement. Ecosyst. Serv. 2016, 21, 208–217. [Google Scholar] [CrossRef]
- Millennium Ecosystem Assessment. Ecosystems and Human Well-Being: Synthesis; Island Press: Washington, DC, USA, 2005; p. 137. ISBN 1-59726-040-1. [Google Scholar]
- Valánszki, I.; Kristensen, L.S.; Jombach, S.; Ladányi, M.; Filepné Kovács, K.; Fekete, A. Assessing Relations between Cultural Ecosystem Services, Physical Landscape Features and Accessibility in Central-Eastern Europe: A PPGIS Empirical Study from Hungary. Sustainability 2022, 14, 754. [Google Scholar] [CrossRef]
- Valánszki, I.; Ladányi, M.; Jombach, S.; Kristensen, L.S.; Filep-Kovács, K. Personal and Spatial Contexts of CES Perception—Discovering Relationship between Place and People in Central-Eastern-European Peri-Urban Areas. Cities 2025, 161, 105926. [Google Scholar] [CrossRef]
- Egarter Vigl, L.; Marsoner, T.; Giombini, V.; Pecher, C.; Simion, H.; Stemle, E.; Tasser, E.; Depellegrin, D. Harnessing Artificial Intelligence Technology and Social Media Data to Support Cultural Ecosystem Service Assessments. People Nat. 2021, 3, 673–685. [Google Scholar] [CrossRef]
- Mouttaki, I.; Bagdanavičiūtė, I.; Maanan, M.; Erraiss, M.; Rhinane, H.; Maanan, M. Classifying and Mapping Cultural Ecosystem Services Using Artificial Intelligence and Social Media Data. Wetlands 2022, 42, 86. [Google Scholar] [CrossRef]
- Van Well, L.; Isayeva, A.; Axel Olsson, P.; Hollander, J. Public Perceptions of Cultural Ecosystem Services Provided by Beach Nourishment and Eelgrass Restoration in Southern Sweden. Nord. J. Bot. 2023, 2023, e03654. [Google Scholar] [CrossRef]
- Ram, Y.; Kay Smith, M. An Assessment of Visited Landscapes Using a Cultural Ecosystem Services Framework. Tour. Geogr. 2022, 24, 523–548. [Google Scholar] [CrossRef]
- Rodríguez-Morales, B.; Roces-Díaz, J.V.; Kelemen, E.; Pataki, G.; Díaz-Varela, E. Perception of Ecosystem Services and Disservices on a Peri-Urban Communal Forest: Are Landowners’ and Visitors’ Perspectives Dissimilar? Ecosyst. Serv. 2020, 43, 101089. [Google Scholar] [CrossRef]
- Pueyo-Ros, J.; Ribas, A.; Fraguell, R.M. A Cultural Approach to Wetlands Restoration to Assess Its Public Acceptance. Restor. Ecol. 2019, 27, 626–637. [Google Scholar] [CrossRef]
- Gottwald, S.; Albert, C.; Fagerholm, N. Combining Sense of Place Theory with the Ecosystem Services Concept: Empirical Insights and Reflections from a Participatory Mapping Study. Landsc. Ecol. 2022, 37, 633–655. [Google Scholar] [CrossRef]
- Ainsworth, G.B.; Kenter, J.O.; O’Connor, S.; Daunt, F.; Young, J.C. A Fulfilled Human Life: Eliciting Sense of Place and Cultural Identity in Two UK Marine Environments Through the Community Voice Method. Ecosyst. Serv. 2019, 39, 100992. [Google Scholar] [CrossRef]
- Acott, T.G.; Willis, C.; Ranger, S.; Cumming, G.; Richardson, P.; O’Neill, R.; Ford, A. Coastal Transformations and Connections: Revealing Values Through the Community Voice Method. People Nat. 2023, 5, 403–414. [Google Scholar] [CrossRef]
- Brown, G.; Fagerholm, N. Empirical PPGIS/PGIS Mapping of Ecosystem Services: A Review and Evaluation. Ecosyst. Serv. 2015, 13, 119–133. [Google Scholar] [CrossRef]
- Schirpke, U.; Tasser, E.; Ebner, M.; Tappeiner, U. What Can Geotagged Photographs Tell Us About Cultural Ecosystem Services of Lakes? Ecosyst. Serv. 2021, 51, 101354. [Google Scholar] [CrossRef]
- Pleasant, M.M.; Gray, S.A.; Lepczyk, C.; Fernandes, A.; Hunter, N.; Ford, D. Managing Cultural Ecosystem Services. Ecosyst. Serv. 2014, 8, 141–147. [Google Scholar] [CrossRef]
- Haines-Young, R. Common International Classification of Ecosystem Services (CICES) V5.2 Guidance on the Application of the Revised Structure; European Environment Agency (EEA): Copenhagen, Denmark, 2023. [Google Scholar]
- Csurgó, B.; Smith, M.K. The Value of Cultural Ecosystem Services in a Rural Landscape Context. J. Rural. Stud. 2021, 86, 76–86. [Google Scholar] [CrossRef]
- Kizika, V.; Akmentiņa, L. Broadening Public Engagement in Spatial Planning Through Digital Participatory Mapping: Experiences from Latvia. Archit. Urban Plan. 2022, 18, 30–42. [Google Scholar] [CrossRef]
- Plieninger, T.; Dijks, S.; Oteros-Rozas, E.; Bieling, C. Assessing, Mapping and Quantifying Cultural Ecosystem Services at Community Level. Land Use Policy 2013, 33, 118–129. [Google Scholar] [CrossRef]
- Tengberg, A.; Fredholm, S.; Eliasson, I.; Knez, I.; Saltzman, K.; Wetterberg, O. Cultural Ecosystem Services Provided by Landscapes: Assessment of Heritage Values and Identity. Ecosyst. Serv. 2012, 2, 14–26. [Google Scholar] [CrossRef]
- Ma, J.; Tam, C.; Li, T.; Yu, G.; Hu, G.; Yang, F.; Wu, R. Sacred Natural Sites Classification Framework Based on Ecosystem Services and Implications for Conservation. Conserv. Sci. Pract. 2022, 4, e12638. [Google Scholar] [CrossRef]
- García-Díez, V.; García-Llorente, M.; Gonzélez, J.A. Participatory Mapping of Cultural Ecosystem Services in Madrid: Insights for Landscape Planning. Land 2020, 9, 244. [Google Scholar] [CrossRef]
- United Nations Economic Commission for Europe. Aarhus Convention on Access to Information, Public Participation in Decision-Making and Access to Justice in Environmental Matter; United Nations Economic Commission for Europe: Aarhus, Denmark, 1998. [Google Scholar]
- Saeima of the Republic of Latvia. Specially Protected Nature Territories Law (Par Īpaši Aizsargājamām Dabas Teritorijām); Saeima of the Republic of Latvia: Riga, Latvia, 1993. [Google Scholar]
- Cleere, H. Council of Europe Framework Convention on the Value of Cultural Heritage for Society (2005). In Encyclopedia of Global Archaeology; Smith, C., Ed.; Springer International Publishing: Cham, Switzerland, 2020; pp. 2720–2722. ISBN 978-3-030-30018-0. [Google Scholar]
- Saeima of the Republic of Latvia. Law on Environmental Protection (Vides Aizsardzības Likums); Saeima of the Republic of Latvia: Riga, Latvia, 2006. [Google Scholar]
- Saeima of the Republic of Latvia. Law on the Development Planning System (Attīstības Plānošanas Sistēmas Likums); Saeima of the Republic of Latvia: Riga, Latvia, 2008. [Google Scholar]
- Spage, A. Using the Ecosystem Services Approach to Assess Landscape Quality. In Proceedings of the Research for Rural Development 2022, Jelgava, Latvia, 18 May 2022; Latvia University of Life Sciences and Technologies: Jelgava, Latvia, 2022; Volume 37, pp. 293–299. [Google Scholar]
- Schirpke, U.; Meisch, C.; Tappeiner, U. Symbolic Species as a Cultural Ecosystem Service in the European Alps: Insights and Open Issues. Landsc. Ecol. 2018, 33, 711–730. [Google Scholar] [CrossRef]
- Katsuda, K.; Saeki, I.; Shoyama, K.; Kamijo, T. Local Perception of Ecosystem Services Provided by Symbolic Wild Cherry Blossoms: Toward Community-Based Management of Traditional Forest Landscapes in Japan. Ecosyst. People 2022, 18, 275–288. [Google Scholar] [CrossRef]
- Mocior, E.; Kruse, M. Educational Values and Services of Ecosystems and Landscapes—An Overview. Ecol. Indic. 2016, 60, 137–151. [Google Scholar] [CrossRef]
- Cebrián-Piqueras, M.A.; Filyushkina, A.; Johnson, D.N.; Lo, V.B.; López-Rodríguez, M.D.; March, H.; Plieninger, T. Scientific and Local Ecological Knowledge, Shaping Perceptions Towards Protected Areas and Related Ecosystem Services. Landsc. Ecol. 2020, 35, 2549–2567. [Google Scholar] [CrossRef]
- Esri. Ainavekoloģiskais Novērtējums: Nacionālās Ainavas. Available online: https://experience.arcgis.com/experience/6c0b5c1cfaaa4bffb3c44b79158cd93c/page/Ainavekolo%C4%A3iskais-nov%C4%93rt%C4%93jums?views=Nacion%C4%81l%C4%81s-ainavas (accessed on 7 July 2025).
- Labas Gribas Memorands. Available online: https://bioregions.lv/bioregions/labas-gribas-memorands/ (accessed on 7 July 2025).
- Saeima of the Republic of Latvia. Gauja National Park Law (Gaujas Nacionālā Parka Likums); Saeima of the Republic of Latvia: Riga, Latvia, 2009. [Google Scholar]
- Nature Conservation Agency of Latvia. Gauja National Park. Available online: https://www.daba.gov.lv/lv/gaujas-nacionalais-parks (accessed on 7 July 2025).
- Cabinet of Ministers of Latvia. Regulations on the Protection and Use of Gauja National Park (Gaujas Nacionālā Parka Individuālie Aizsardzības un Izmantošanas Noteikumi) Regulation No. 317; Cabinet of Ministers of Latvia: Riga, Latvia, 2012. [Google Scholar]
- OpenStreetMap Contributors. OpenStreetMap Base Map. Available online: https://www.openstreetmap.org (accessed on 4 May 2025).
- Nature Conservation Agency of Latvia. Sietiņiezis. Available online: https://www.daba.gov.lv/lv/sietiniezis (accessed on 7 July 2025).
- Gaujas Nacionālā Parka Līgatnes Dabas Takas. Available online: https://www.ligatnesdabastakas.lv/par-mums/ (accessed on 7 July 2025).
- Nature Conservation Agency of Latvia. Gutmana Ala. Available online: https://www.daba.gov.lv/lv/gutmana-ala (accessed on 7 July 2025).
- History of Turaida Museum Reserve. Available online: https://turaida-muzejs.lv/en/history-of-turaida-museum-reserve/ (accessed on 7 July 2025).
- Scholte, S.S.K.; van Teeffelen, A.J.A.; Verburg, P.H. Integrating Socio-Cultural Perspectives into Ecosystem Service Valuation: A Review of Concepts and Methods. Ecol. Econ. 2015, 114, 67–78. [Google Scholar] [CrossRef]
Disclaimer/Publisher’s Note: The statements, opinions and data contained in all publications are solely those of the individual author(s) and contributor(s) and not of MDPI and/or the editor(s). MDPI and/or the editor(s) disclaim responsibility for any injury to people or property resulting from any ideas, methods, instructions or products referred to in the content. |
© 2025 by the authors. Licensee MDPI, Basel, Switzerland. This article is an open access article distributed under the terms and conditions of the Creative Commons Attribution (CC BY) license (https://creativecommons.org/licenses/by/4.0/).