Abstract
Seed-sown wildflower meadows are becoming increasingly important in our cities. One of the best methods is to design low-maintenance green spaces with an ecological approach. They can be used either to create perennial beds or to enrich and replace larger areas of regularly mown grass. Seeded surfaces are closer to a functioning ecosystem. The seed mixtures available in Hungary include seeds of native and non-native species, but due to a lack of time or resources, they have not been tested and have been in the field almost immediately. With our research, launched in autumn 2023, we tried to fill this gap and established seed-sown perennial beds in Budapest (Hungary), in ten plots in different media, using a seed mix of native species (96 taxa). Our experiment is an attempt to answer the question of what makes a seed-sown herbaceous plantation successful in the long term in an urban environment. Which species will emerge first, in which medium and which will persist in the long term? What will be the cover, diversity of the plots, the phenology of each species at different times of the year and to what extent does this depend on the medium and the frequency of irrigation? Which taxa will appear in each growing medium, and will there be taxa that can only develop in certain media? The study reports on the first experiences of the long-term study, according to which there were dynamically developing stands, but we observed a basically negative correlation between rapidly developing media and diversity. The most diverse species set was provided by the andesite aggregate medium, followed by green roof substrate, then demolition rubble with sand and sand.
1. Introduction
1.1. Herbaceous Vegetation in Nature Worldwide
Grasslands, which are treeless, herbaceous-dominated habitats, are found almost everywhere in the world. They account for 24% of the Earth’s vegetation and thus constitute the largest biome [1]. These habitats are known as steppes in Eurasia, prairies in North America, pampas in South America, and grassveld in South Africa [2]. In the Palearctic, grassland formation may be related to limiting factors that prevent woody plant growth, such as cold temperatures, drought and various disturbances (e.g., fire, mowing, and grazing) [3]. Four categories can be distinguished on this basis: (a) zonal steppes form, where conditions are too dry for forests to grow; (b) high mountain grasslands form at higher elevations where conditions are too cold for forests to grow; (c) azonal or extrazonal grasslands form where local tree growth is inhibited by hydrological, topographical or soil conditions, or by natural disturbances within forest biomes; (d) secondary grasslands form where human land use replaces natural forests [4,5].
The semi-natural meadows of the lower areas have been important sites for traditional agriculture for thousands of years, primarily through grazing and mowing. These flower-rich habitats were part of people’s everyday lives, but suffered increasing losses as the intensity of agriculture increased. The advent of mechanization in the 18th century made it easier to plow natural grasslands, and this process was completed in the 19th century with the invention and widespread use of fertilizers and, in the 20th century, with the invention and widespread use of herbicides. Flowering grasslands have been cultivated all over the world, but the extent of the loss is particularly drastic in economically developed Western Europe and the United States. A significant part of the American prairies has been transformed into monocultural agricultural areas, with only patches of the original vegetation remaining in the central-western regions of the country [6]. Over the last 30 years, increasing urbanization has reduced the extent of grassland vegetation all over the world. These natural or semi-natural habitats and agricultural areas are being converted into urban and suburban areas at a faster rate than the population of urban areas is growing [7]. However, the losses are not only due to the territorial expansion of cities, but also to their construction and land use to meet the needs of the urban population [8]. As a result of the above reasons, the area of species-rich grasslands in Europe has decreased significantly, in some countries to a particularly drastic extent. In Ukraine, approximately 3% of the steppes remain [9], while in Wales, approximately 90% of the area of semi-natural grasslands has disappeared [10]
Hungary is also rich in treeless communities, a significant part of which has been taken over by agriculture, and their area has decreased by nearly 60% since the beginning of the 20th century [10]. The presence of hayfields and tall grass meadows created by the clearing of former fresh or mesophilic forests is linked to higher groundwater levels. Limited water availability and various edaphic factors play a role in the formation of different types of pioneer and dry grasslands (loess grasslands, sandy grasslands, rocky grasslands, slope steppes). Salty steppes and meadows can form under specific conditions, where the groundwater is rich in salts and very close to the soil surface [11].
1.2. Application of Herbaceous Plants in Urban Areas
Natural plant communities have been a source of inspiration for planting design to varying degrees throughout different periods of garden history. An ecological approach dominates contemporary plant use, so natural plant communities are an important basis for design, not only from an ecological but also from an aesthetic point of view. Landscape patterns that are recognizable to humans, landscape archetypes, are capable of evoking different emotional responses and bringing back memories and thoughts. The meadow, as an archetype, has recently inspired numerous landscape architects and has become a reference point for urban design projects. This is largely due to the ability of grasslands, with their expansive and unconfined nature, to evoke powerful emotional reactions, instilling a feeling of openness and freedom that is increasingly sought after in the densely constructed, confined, and crowded urban settings [5]. In urban green spaces, this role has traditionally been fulfilled by mowed lawns. These regularly mowed (10–16 times a year) low-cut lawns are typical in areas designated for recreation and active use, primarily in parks and sports fields, but they also often dominate green spaces in institutional and private gardens [12]. In the Swedish cities surveyed, the proportion of lawn areas is estimated at 22.5%, which has approximately doubled over the past 50 years [13], with similar data available for cities in the United Kingdom (25%) [12] and studies in the United States (23%) [13].
Given the effects of climate change and the increasing scarcity of resources for maintaining urban green spaces, the use of high-maintenance, intensive lawns is undesirable over large areas, especially if their use is not justified. Although maintenance can be easily mechanized and follows protocols that require little expertise, the longer growing season and increased irrigation and nutrient requirements resulting from global warming mean higher costs [12]. Maximizing ecosystem services and promoting biodiversity have also become important considerations in recent decades, which also discourages the creation of amenity grasslands. Instead, it is necessary to find methods of plant application that can be used to create, in a cost-effective manner, large areas of vegetation that are capable of fulfilling aesthetic and ecological functions in the long term and at low maintenance costs. Suitable models could be semi-natural grasslands, which are among the most diverse habitats in Europe [10]. Wildflower meadows sown from seed can create a uniform effect on a large scale, similar to intensive lawns, but on a small scale they offer amazing diversity and complexity, providing opportunities for complex flora and fauna to settle. Several studies have examined the positive correlation between biodiversity and ecosystem functions and services [14,15,16,17,18]. It is well known that plant diversity has a beneficial effect on soil life, as it increases the diversity of soil bacteria, for example [19].
These herbaceous vegetation types provide a number of ecosystem services to city dwellers, such as protection against soil erosion and deflation, water retention, protection of soil and groundwater resources through pollutant absorption, a reduction in particulate matter and protection of air quality, a reduction in allergenic pollen load, and carbon sequestration through organic matter and litter formation, regulation of nutrient cycling, and promotion of soil regeneration. In addition, it is worth highlighting the provision of habitat as a basic function that contributes to the maintenance of biodiversity, as well as a range of cultural ecosystems that have a significant positive impact on the mental well-being of city dwellers [10,20,21,22].
Nowadays, herbaceous plantings are very popular in urban environments. On smaller areas, these are created primarily by planting pre-grown seedlings, thus achieving spectacular results more quickly. However, on large areas, when creating flowering meadows, sowing seeds seems to be the most effective method, as its creation and maintenance are less costly than planting seedlings. Another major advantage of this method is that the species richness, individual density and complexity of natural grasslands per unit area can only be approximated by sowing seeds. The vegetation created in this way leaves fewer niches for weeds [6]. By creating urban flowering meadows, once the vegetation has stabilized, weeding, nutrient replenishment, and watering can be avoided, and the frequency of mowing can be reduced [20]. The method can be used on green roofs, roadside strips, parks, institutional gardens that do not require intensive lawn use, slopes, etc. There are more and more good examples in major cities around the world, even in city centers, such as the Parco Biblioteca degli Alberi area in front of the Bosco Verticale in Milan [20] or around the Tower, one of London’s most visited tourist attractions, based on Nigel Dunnett’s planting design [23].
1.3. Urban Substrates
It is well known that urban soils, which have been significantly damaged and transformed by human activity, do not provide ideal conditions for plants, especially trees [24]. In these substrates, the natural soil profile cannot be identified, as they are characterized by artificial stratification. Due to the construction debris and other materials they contain, they have a coarse structure and exhibit high spatial heterogeneity. Soil compaction deteriorates the structure and reduces porosity, leading to airless conditions and drainage problems. All this significantly impairs the root functions of plants. Lime-containing construction waste raises the pH of the soil, which also affects micronutrient and phosphorus deficiencies. The organic matter content is very low, as is the nitrogen and phosphorus supply. Urban soils have poor nutrient storage capacity, but can contain numerous contaminants (e.g., heavy metal contamination) [25]. Furthermore, urban substrate are characterized by reduced soil life, and the species composition and diversity of microorganisms and fungi also differ from those found in natural soils [26,27,28]. In such a degraded environment, herbaceous vegetation is the most likely to survive and, through its presence, can bring about improvements in the urban environment.
Greening urban areas using traditional methods would require the extraction and use of large amounts of fertile soil, which is a non-renewable resource. For this reason, numerous studies are investigating whether the large amounts of waste and by-products generated in cities can be used to create a suitable planting medium for plants as a substitute for natural soil resources [29]. The urban substrate created in this way, in which crushed, broken bricks are used as an additive to increase water retention, may be suitable for the creation of flowering meadows [30]. Concrete and other demolition rubble are similar to stones in natural soils or structural soils used in tree planting, but bricks cannot be considered structural elements due to their fragility. They have little effect on the chemical properties of the medium, but they raise the pH of the soil. In an experiment conducted by Rokia et al. (2014) eleven types of waste materials were tested, of which the three materials mentioned above showed the highest pH values (brick: 9.1; concrete: 10.1; demolition debris: 10.3) [29]. In the case of bricks, this means that a pH value of around 10 increases the pH value of the soil to 7–9 [31,32]. The clay content of bricks increases the surface area for nutrient exchange. Nehls et al. (2012) concluded that bricks provide plants with more potassium (K), magnesium (Mg), calcium (Ca), and sulfur (S) than sandy soil. Thanks to their high water retention capacity, nutrient storage, low contamination status, and the ability of roots to penetrate their pore system, bricks can be good components in the creation of new soils or even in the improvement of sandy soils [33].
Green roof growing medium is an artificial soil that contains various natural and synthetic materials. In addition to optimal physical properties (lightweight, resistant to compaction, good drainage), it must be suitable for plant growth. Beyond physically supporting them, it must also provide moisture and nutrients [34]. The medium is mostly mineral-based, accounting for 80–100% of the volume, with 0–20% consisting of organic matter and slow-release fertilizer [35]. In their experiment, Nagase and Dunnett (2011) found that a 10% organic matter content was ideal for several plants [36].
In the traditional approach, when creating new green spaces, we create “ideal” conditions for plants by spreading high-quality topsoil, which can mean a thickness of 20–30 cm for herbaceous taxa. This medium has a crumbly structure, good air and water management, is rich in organic matter, and has a pH between 5.5 and 7.5, creating conditions for intensive soil life. However, complete soil replacement does not really comply with the principle of sustainability in urban projects and, in addition, it favors the establishment and spread of competitor species, weeds, and woody species [37].
In contrast, sand and various mineral aggregates are well-drained media with low nutrient content. Sand has the smallest particle size, which gives it excellent root permeability, allowing plants to develop extensive, well-developed root systems in it [38,39]. Sand can heat up significantly, and daily temperature fluctuations on its surface can be quite considerable. Gravel is also a commonly used medium or mulch for stress-tolerant plantings. It is often used in countries with an Atlantic climate when planting drought-tolerant or Mediterranean plants, such as in Beth Chatto’s Gravel Garden in England or Sissinghurst’s Delos Garden [40,41]. Volcanic rhyolite tuff aggregate is used as an additive in roofing mixtures and for soil improvement. Its porous structure has a positive effect on water retention and the absorption of micro- and macronutrients, thus promoting plant growth [42]. Andesite also helps water retention as an additive, but to a lesser extent than rhyolite tuff, due to its different mineral composition and lower porosity of the interstitial particles [43]. Due to its dark color, the surface formed from it heats up significantly.
1.4. Composition of Urban Herbaceous Plantations and Seed Mixes
Seed-sowing as a planting method has a longer history in grassland restoration outside cities than in urban green spaces, so long-term experience is primarily available from projects of this type. Most of the domestic research relevant to the topic also deals with the monitoring and reconstruction of natural grasslands, but there are some urban-scale experiments that have been running for a long time, such as the Veszprém climate-adaptive grassland management project [44]. However, it is important to emphasize that the urban circumstances represent a very distinct context, with different environmental conditions, available space, visual character, usage, and thus divergent priorities and aesthetic expectations for urban flowering meadows. Among the seed mixes available on the market, also recommended for urban use, there are seeds of both native and non-native species, but due to a lack of time or resources, there was no previous example of testing them, and they appeared in public areas almost immediately.
The composition of seed mixtures is primarily determined by the scale of the area, the purpose of planting, and the material and time constraints. If the seed mixture consists of many species, the collection and handling of seeds that ripen at different times makes production more difficult and costly. Thus, in domestic grassland restoration experiments, low-diversity, grass-dominated seed mixtures have been found to be faster, cheaper, and more effective. These seed mixtures are primarily used on large areas to quickly control weed growth or erosion [45,46,47,48]. High-diversity seed mixes can be suitable for creating permanent cover even in varied environmental conditions, as it is more likely that at least some of the species will be able to establish themselves in the given conditions. It is good if the seed mix contains both short-lived and annual species. With their rapid establishment in the first year, the short-lived species, and later the perennial species, can suppress weeds by providing continuous cover [47,48,49,50]. In their experiment conducted in vineyards, Miglécz and his colleagues (2013) found that mixtures of native taxa had better long-term weed suppression capabilities [49]. For an association to be resistant to invasion, it must be composed of many different functional groups [51]. In their experiment, Kiss et al. (2022) [50] found that forbs achieved lower coverage and diversity when grasses were sown either before or at the same time. Greater competition was observed between grasses and forbs than between forbs alone [46]. Grasses can easily become dominant, as they can inhibit the growth of their competitors in a number of ways, either through allelopathic phytochemicals during the germination stage, or through their significant underground spread, efficient resource utilization, and, in many cases, vegetative propagation [46,52,53,54,55,56].
Seed mixes can be produced from seeds collected from the habitat, which does not involve significant costs in the case of smaller, urban green spaces. The advantage is that seeds collected from the target area consist of native species that are well adapted to the existing environmental conditions [44,47]. There is also a different point of view, which says that local populations do not have enough genetic diversity for the communities created from them to adapt well enough to global changes. At the same time, the use of seeds from distant origins can also be risky (e.g., invasion and intolerance to the local climate), so it is recommended to mix seeds collected from several populations in the region corresponding to the target site [57]. The advantage of this method, which has already been tested in Germany, is that it increases adaptability while reducing unwanted effects on wildlife [58]. While customized seed mixes are mostly used in grassland reconstruction, standardized products and pre-made seed mixtures are more common in urban green spaces. In the US and Western Europe, especially in Great Britain and Germany, there have long been countless manufacturers and products available, with mixtures targeting different habitats and aesthetic characteristics. Seed mixes characteristic of high-diversity grassland habitats developed in the dry, continental climate of Eastern and Central Europe are increasingly coming to the attention of Western European planting designers and plant propagators, as they believe that the taxa found here will be very useful due to climate change. In Hungary, despite the fact that the herbaceous flora of the Pannonian vegetation is extremely rich and diverse [59]—for a long time, mainly foreign products, primarily from Western Europe, were available, which originate from habitats with significantly different characteristics [47]. In Budapest, a Swiss seed mix was first tested by FŐKERT (Budapest Public Utilities Ltd., an organization which is responsible for the green infrastructure in Budapest), and then a roof garden seed mix also of Swiss origin was used on the roof of an office building in Budapest, which did not bring the expected positive results [60,61]. In recent years, however, more and more seed mixes of Hungarian origin have appeared on the market. The FŐKERT novelty is the “Budapest Seed Mix”, which is available in three different compositions: for dry sandy areas (Pest), for moist habitats (areas along the Danube), and for hillside habitats (Buda). The seed mixtures consist of 53 native perennials and annuals [62]. There are also district or city initiatives that produce seed mixes for local residents to encourage public use. For example, the “Budavár Wildflower” seed mix, which consists of 56 native species and was prepared for the residents of District I., using herbaceous species found in the Buda hills. In recent years, Roof-tech Pannónia Mix for extensive green roofs has appeared on domestic commercial markets, while Greentech Pannónia Mix, which can also be sown on intensive green roofs or on ground-level soil, has been introduced [63].
1.5. Research Questions
At present, there is limited comprehensive, systematic research in Hungary conducted in urban environments that not only address ecological aspects but also compile practical insights regarding ornamental value and maintenance, which are critical considerations for urban applications. Furthermore, there is a lack of studies on different media that would demonstrate which material choices are beneficial both in terms of plant health and sustainability when designing substrates for urban plant beds. In our current research, by testing a domestically produced seed mixture consisting of 96 taxa according to the product description, we seek the answer to what makes an urban seed-sown perennial plantation successful in the long term. In our work, we investigate how the different substrates, time, and distinct management methods influence the (1) species composition and diversity, (2) weed encroachment, (3) cover and the height of the plantations, and (4) dominant species and their dynamics.
2. Materials and Methods
2.1. Characteristics of the Study Area
The study area is located in Budapest (Hungary), which is characterized by very extreme climate data within the country. The climate data of the Central Statistical Office (KSH), which applies to the beginning of the experiment (2023) and the following year (2024), are presented in Table 1. Here, the average annual temperature, the number of heat days (the number of days when the daily maximum temperature was 30 °C or higher), the number of days affected by heat waves (the number of days when the daily mean temperature can reach values of 25 °C for at least 3 days) and the amount of annual precipitation are shown [64]. In a monthly breakdown, it is clear how much the temperature and precipitation values have changed compared to the long-term averages (Figure 1a,b [65]).

Table 1.
Climate data of Budapest based on KSH [64].
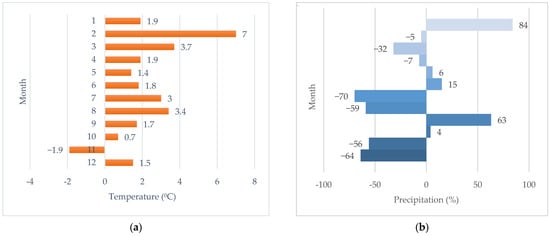
Figure 1.
In the first year of the experiment (2024), the national monthly temperature (a) and precipitation (b) data are expressed as a percentage of the multi-year (1991–2020) average (based on interpolated data) [65].
The research area is bordered by roads exposed to environmental loads, partly by high-traffic roads (Hungária Road from the SW side, M3 motorway exit from the SE side), and on the other hand, there is a significant green area (Városliget, Budapest, Hungary) nearby. The air quality values, as part of the National Air Pollution Monitoring Network, from the data of the automatic measuring station operating closest to the sample area in the period 2009–2013, indicate that the area is often saturated, with high NO2 and PM10 concentrations [66], thus the experimental area reflects well on urban green spaces created in a busy environment.
2.2. Study Area
The experimental plots were placed in an unused open area on the southern side of the Biodome, in the territory of the Budapest Zoo and Botanical Garden, which is located in the city center of Budapest (Figure 2). A total of ten 2 × 1 m beds were created, which were divided into two 1 × 1 m quadrats (“a”, “b”), in order to differentiate the frequency of irrigation in the individual media from the second year onwards. The beds were raised 10 cm above the soil surface, in a frame made of black-locust timber, and filled with different substrates (Figure 3).
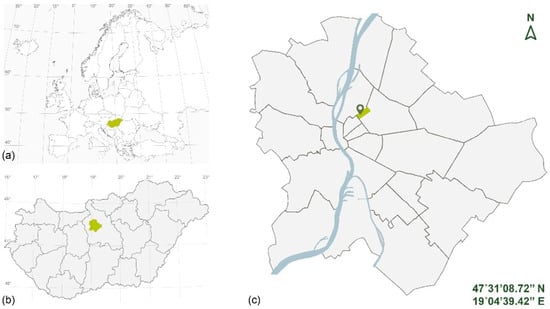
Figure 2.
Location of the study area: (a) Hungary’s location in Europe; (b) Budapest’s location is Hungary; (c) study area location in Budapest.
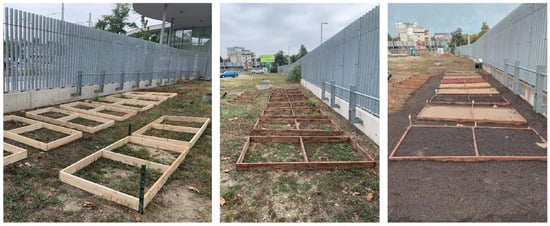
Figure 3.
Arrangement of the plots in the study area.
The quadrats were placed in an area exposed to sunlight, with no significant shadow effect. Irrigation was limited to hot days and recording times. The soil in the area was highly degraded, as it was characterized by intensive construction activity before the experiment.
2.3. Applied Substrates
We chose media for the experiment that are present either as substrate or as mulch in Hungarian and foreign landscape architecture practice (Table 2, Figure 4). Due to sustainability principles, it was important to examine how the seed-sowing works if we do not use soil replacement (original soil) in an urban environment, and if we have to sow seeds on or using soil of particularly poor quality, full of construction wastes. We modeled the latter situation with a mixture of demolition rubble and sand. In Hungary, topsoil or green roof substrate are most often used for the implementation of new projects, and gravel and andesite crushed stone are often found as mineral mulch. Rhyolite tuff is most often found in green roof growing media, but it can also be imagined as mulch. Sand is an increasingly frequently used planting medium in contemporary plant application, perhaps the most well-known example of this is the garden of gardener and nurseryman Peter Korn at Klinta Trädgård [39].

Table 2.
Types of substrates, (a) regularly irrigated from the 2nd year (b) without irrigation.
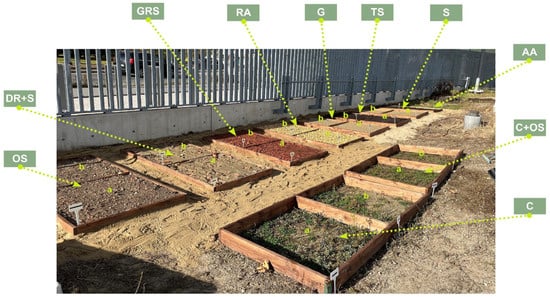
Figure 4.
Types of substrates. For abbreviations of the plots, see Table 2.
2.4. Applied Seed Mix
Seed sowing was carried out on 30 October 2023 with Greentech Pannónia Mix [63], a seed mixture of 96 native perennial (in officially) species produced and marketed in Hungary. Six grams of seeds were spread in each plot mixed with sand, except for the control bed, where no seeding was performed. The official species list of the product contains the list of taxa making up the seed mixture and their percentage distribution, which ranges between 0.2–5%. The highest percentages (3–5%) are Dianthus pontederae (5%), Festuca rupicola (5%), Salvia nemorosa (5%), Anthyllis vulneraria (3%), Medicago lupulina (3%), Salvia pratensis (3%), and Sanguisorba minor (3%). For verification purposes, the composition of the seed mix was controlled by a seed expert.
2.5. Vegetation Monitoring
During the sampling, we recorded the identifiable taxa in each quadrat, indicating the vegetative and generative states separately, and we determined the average height and the maximum height of the plantation (tallest taxon). In the first year, there were some plants that did not develop to a state where they could be identified at the species level. There were some that we could identify at the genus level, and these were included in our data. The few individuals that could not even be identified at the genus level were also recorded, but they were not included in the data set to be evaluated. If they are still present and identifiable in the second year, they will be included in the data set for the second year.
The vegetation cover of the soil surface was assessed using the Canopeo application.
The Canopeo program is an image analysis tool that analyzes and classifies all pixels in an image using the red-green-blue (RGB) color system. The result is a binary image where the green pixels recognized by the program—which in this case represent vegetation cover—appear as white pixels, and everything else appears as black [67]. The Canopeo application provides the percentage of white pixels. The method is used in several similar studies to assess cover, such as Pomatto et al. (2023), who examined the ground cover and weed suppression ability of various ornamental plants between 2019 and 2021 [68]. For the data obtained in this way to be as close to reality as possible and comparable, post-processing of the images is required before using the application, as the program does not consider flowers to be green (if they are not green), and in our case, the withered leaves and plant structures appearing in the squares would also distort the result. The difference can be very significant during mass flowering (Figure 5).
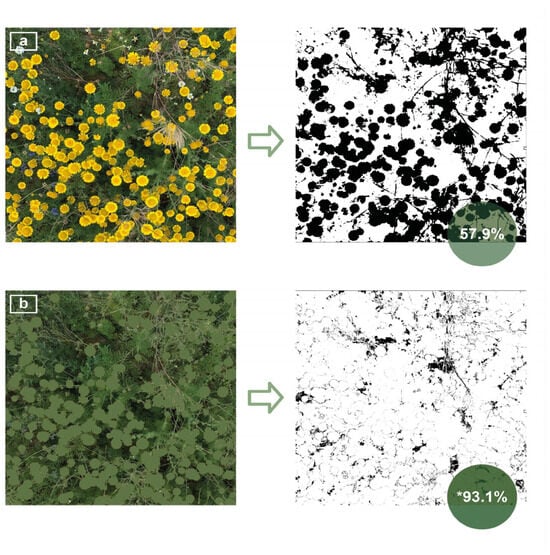
Figure 5.
The input and output of the mobile device application Canopeo to obtain the percentages of green coverage: (a) original photo; (b) modified photo, after covering the flowers with green; * corrected data.
During the assessment of canopy cover, the visual estimate and the Canopeo data can be compared, checked, and, if necessary, corrected. The photographic documentation, especially the evaluation of the top-view images, was also of great help in that we were often able to retrospectively identify plants that were not yet recognizable in earlier stages based on the location of the plants. The results of the first year included several taxa that became identifiable during the second year’s surveys, in their generative phase. There were also a few individuals that could not be determined at the species level by the time of writing this article.
In November 2023, a few weeks after sowing, the first seedlings appeared in the plots, but their identification was not possible until April, so on 10 October 2023, and 11 March 2024, we recorded the species of the existing plant population only in the two control beds. In 2024, the surveys took place on 11 April, 1 May, 4 June, 7 July, 1 September, 30 October and 12 December.
2.6. Data Analysis
2.6.1. Preliminary Assessment of the Plant Species of the Seed Mix
The PADAPT database, which is the Pannonian Database of Plant Traits, was used to analyze the official species list of the seed mix from an ecological perspective [69]. The examination criteria are included in Appendix A, where we used the Borhidi index numbers from the ecological indicator values. Attila Borhidi, based on the Heinz Ellenberg system, developed the ecological index numbers for more than 2500 Hungarian taxa in 1993. These values do not characterize the demands of species against environmental factors, but show in which range individuals of a given species are most likely to occur concerning a certain ecological factor [70].
2.6.2. Multivariate Analyses
To reveal the possible differences or similarities in the data structure, cluster analysis (hierarchical clustering) and PCoA (Principal Coordinates Analysis) helped to organize the properties of the plots. We used binary (species presence or absence in the plot) data in the analysis (87 species × 20 plots matrix). In cluster analysis we used group average (UPGMA) method and Euclidean distance as coefficient. In PCoA, the distance matrix of objects was searched for a coordinate system where the original distances could be preserved, so the first few axes usually gave a reasonably good representation of the distances. For data processing, the Euclidean distance resemblance matrix offered the proper way. For computation, we used the SYN-TAX 2000 program package [71].
3. Results
3.1. Revision of the Plant Composition of the Seed Mix
We compared the official species list with the plant list made by the seed expert. The two species lists were largely identical at the genus level, with only nine genera listed in the seed definition that are not in the official species list. At the species level, the difference is even greater, with a total of 26 identical species. The difference may be due to the different composition of the seed mix and possible inaccuracies in the seed identification. The taxa in question can be further specified after their appearance in the plots and their identification.
3.2. Existing Vegetation Around the Plots
The area is covered with spontaneous vegetation, mainly consisting of weed species. The taxa most abundant in the immediate vicinity of the quadrats are: Lactuca serrulata, Centaurea cyanus, Papver orientale, Medicago lupulina, Melilotus officinalis, Senecio vernalis, Conyza canadensis, Holosteum umbellatum, Cerastium brachypetalum, Stellaria media, Arabis auriculata, Setaria pumila, Arenaria serpyllifolia, Hordeum murinum, Crepis spp., Chenopodium spp., Bromus spp., Ambrosia artemisifolia, Cirsium spp., Tragopogon spp., Dactylis glomerata, Achillea millefolium, Consolida regalis, Onopordum acathium, Convolvulus arvensis, Polygonum spp., and Trifolium spp.
3.3. Evaluation of Plant Inventory (Seed Mixture and First-Year-Appearing Taxa) Based on the PADAPT
The species in the official seed list of the seed mixture (96 species) were from 32 families in terms of their taxonomic classification. Of these, the most represented families, i.e., with 14 species, were Fabaceae and Asteraceae. Also significant were Apiaceae (5), Brassicaceae (5), Caryophyllaceae (10), Lamiaceae (11), and Poaceae (7). In the first year, species from 27 families appeared in the studied area, of which Asteraceae (17 taxa) stood out (Figure 6). Despite the fact that the seed mix is present on the market as a product consisting of native species, only 77 species are native, 11 are alien, 5 are cryptogenic species and 3 taxa are unknown according to the PADAPT database (Figure 7). Regarding the Raunkiær life form, the majority of the taxa in the official seed list belong to perennials, namely hemicryptophytes (56 species), and annuals (therophytes) only 6. In contrast, annual taxa (35) appear in a much larger number of species among the plants that appeared in the first year (Figure 8). Regarding social behavior types (Borhidi’s type), it can be said that the majority of the seed mixture is composed of species with broad tolerance, good stress tolerance and tolerance to natural or human disturbance (Figure 9a,b). The plants of the seed mixture belong to a total of 15 flora elements, most of them to the Eurasian and continental flora elements, but sub-Mediterranean elements are also significantly represented, which supports the adaptability of the seed mixture to climate change (Figure 10).
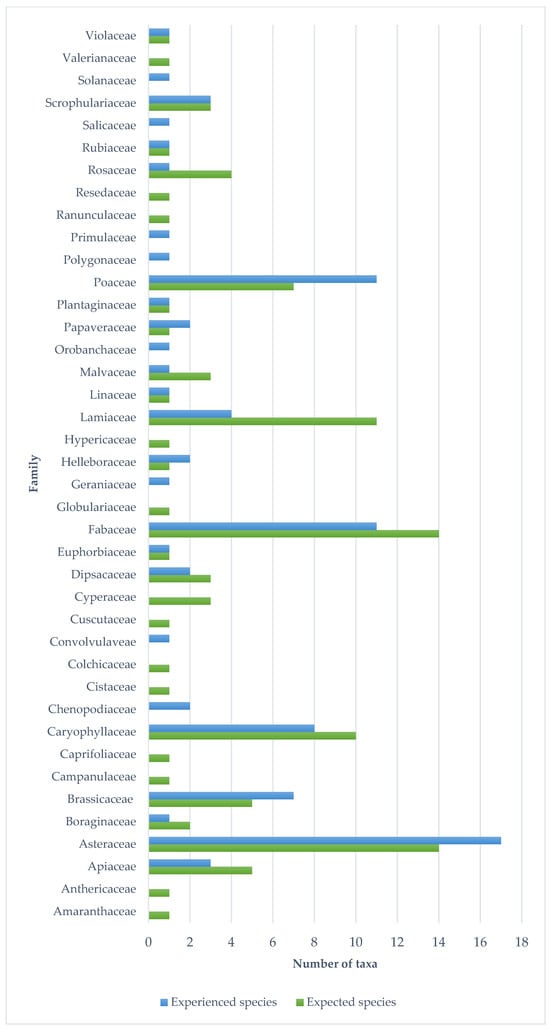
Figure 6.
Representation of plant families in the expected species list (the official seed list) and in the experienced species list (species occuring in the first year).
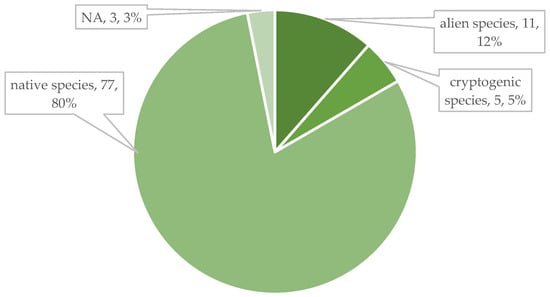
Figure 7.
Nativeness among taxa of the seed mixture based on the PADAPT [69].
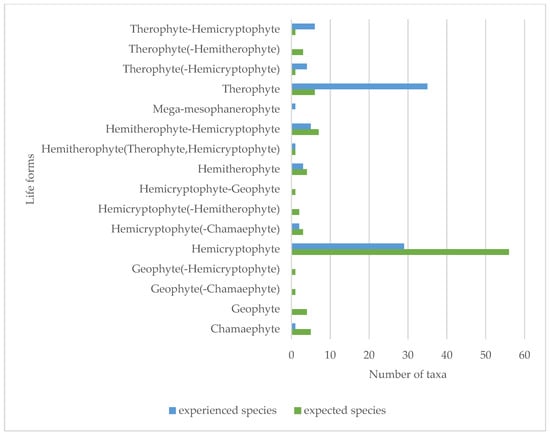
Figure 8.
Representation of Raunkiær life forms in the official seed list (expected species) and in species occurring in the first year (experienced species) based on the PADAPT [69].
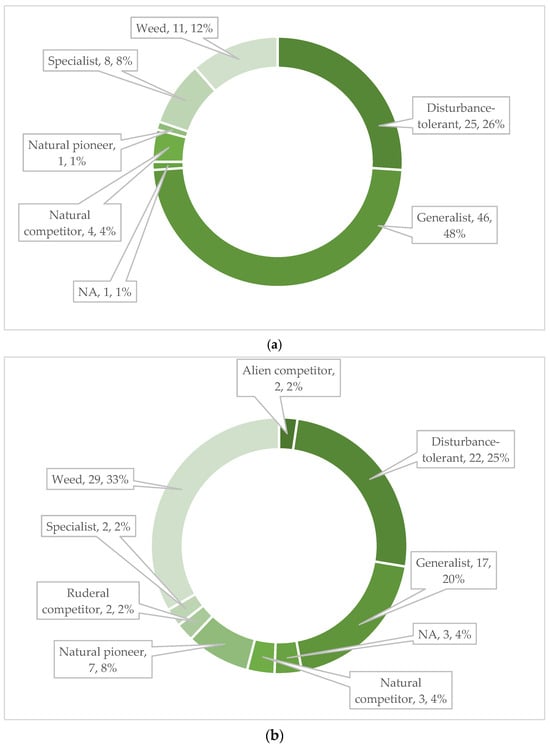
Figure 9.
Representation of social behavior type in the official seed list, expected species (a), and in species occurring in the first year, experienced species (b), based on the PADAPT [69].
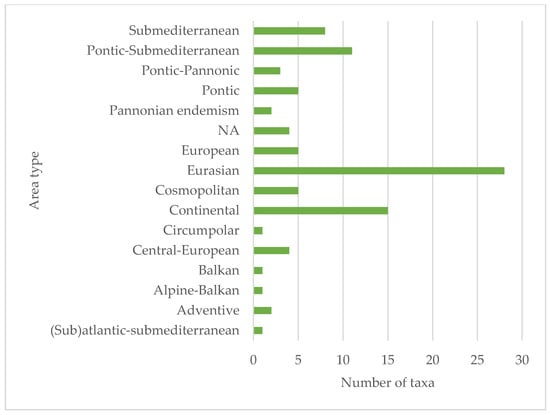
Figure 10.
Representation of area type in the official seed list based on the PADAPT [69].
By examining the Borhidi’s relative ecological indicator values, we can also conclude about the application possibilities of the seed mixture. Regarding the relative heat requirement, it can be said that the significant majority of the species occur naturally in areas with higher thermal climates. The largest number (32%) represents a thermal climate corresponding to the belt of thermophilic forests and forest-steppes (Figure 11a).
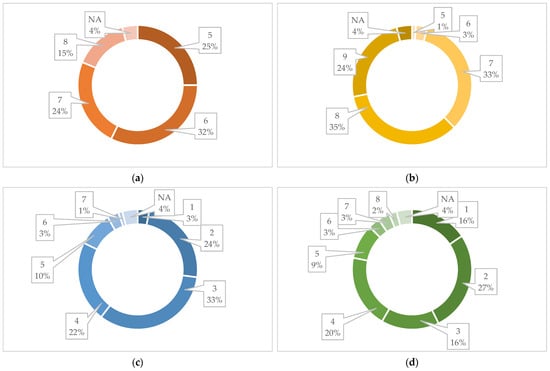
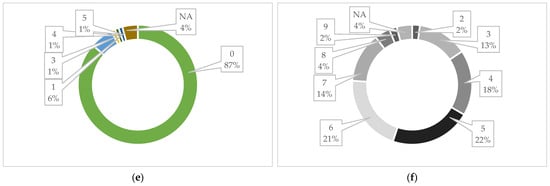
Figure 11.
Borhidi’s relative ecological indicator values: (a) relative heat requirement, (b) light requirement, (c) relative groundwater and soil moisture indicator, (d) nutrient content of the soil, (e) salt tolerance categories, and (f) continentality [69,72].
In terms of light requirement, the vast majority of the plants are sun-loving (59%), i.e., highly light-demanding or full-light-demanding plants, as well as semi-shade species that mostly live in full sun, but are also shade tolerant (Figure 11b).
Based on the relative groundwater and soil moisture indicator numbers, only a small part of the plants in the seed mixture belong to the extreme drought-tolerant (3%) and to the taxa occurring in mesic semi-humid habitats (plants of usually wet soils or semi-humid habitats of mesic conditions) (13%). The largest part (79%) of them is drought tolerant, which occasionally occurs in fresher growing places, i.e., xero indicator, xero tolerant or plants of extremely dry habitats. Surprisingly, the seed mixture also contains some moisture indicator (moist but well-aerated soils) (7%) plants (Figure 11c).
Regarding the nutrient content of the soil, it can be said that the seed mixture is represented in a large proportion (43%) by species that live on nutrient-free bedrock, plants of extremely or severely nutrient-poor growing places. Among the species, nutrient-rich categories (moderately rich—3%, rich—3%) also appear in a small proportion and N-indicator plants of fertilized soils also occur (7%). The largest part of the species pool of the seed mixture is made up of plants of severely nutrient-poor growing places, which is advantageous because urban degraded soils also have a similar character (Figure 11d).
If we look at the salt tolerance categories of the species of the seed mixture among the ecological indicators, then a significant part of the plants (87%) belong to the salt-avoiding species, which do not occur on salty or saline soils. A small percentage of them (6%) can also be given the label “weakly salt tolerant”, which means that they mainly occur on salt-poor or salt-free soils, occasionally on slightly saline soils (Figure 11e).
And finally, in terms of values for continentality, extreme climate effects, and tolerance to climate extremes, it can be said that the species of the seed mixture are predominantly plants of light-rich, high-temperature, nutrient-poor growing areas, which have good drought tolerance. This presumably makes the product suitable for use in urban environments, where such environmental conditions are found (Figure 11f).
3.4. Vegetation and Species Level Assessment in the Plots After the First Year
3.4.1. Analysis of Vegetation Development in Different Substrates
The development of the plants started at different rates in the different media. During the March survey, TS and DR+S were already green, while the vegetation was barely noticeable on AA. After the intensive spring growth phase, by June, the differences in the height of the plant mass significantly decreased, but the differences in the cover remained noticeable between the individual plots. From mid-summer, due to the high heat and lack of precipitation, most of the vegetation entered a dormant state, and then from mid-autumn the quadrats greened up again (Figure 12).
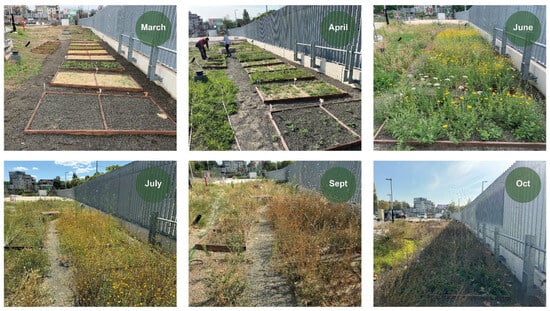
Figure 12.
Vegetation development in the first year.
Figure 13 shows the slowest and fastest growing plots at each sampling time. On AA plants started to develop a little later than on the other mediums, but this resulted in a later and lower cover. This lower cover allowed more seeds to reach light, resulting in greater diversity and more plants reaching flowering. On the TS medium, on the other hand, germination processes started very quickly, especially in the case of Anthemis taxa, which quickly provided cover, thus preventing the germination of certain seeds.
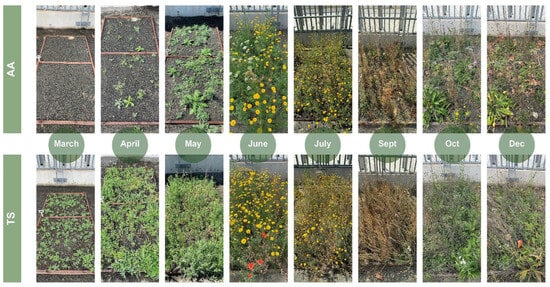
Figure 13.
Comparison of vegetation development in AA and TS in the first year. For abbreviations of the plots, see Table 2.
In the spring, the height of the vegetation in the C, C+OS plots was 15–20 cm, in the slower growing (OS, RA, G, S, AA) media it was 10–25 cm, while in the faster growing (DR+S, GRS, TS) it was approx. 40 cm. By mid-summer, only the C plot remained lower (40 cm), the height of the other beds was quite uniform, 50–70 cm high. Cephalaria transsylvanica emerged from these, reaching a height of 180–200 cm in the RA, OS, G, TS and AA media, growing to 150 cm in the S medium, and reaching 120 cm in the GRS medium.
In the first year, the dominant floral display was provided by Anthemis taxa, especially Anthemis tinctoria, which bloomed steadily and in large numbers from early summer to autumn in all sown plots. In spring and early summer, Agrostemma githago, Achillea spp., Berteroa incana, Cephalaria transsylvanica, Consolida taxa, Centaurea cyanus, Orlaya grandiflora, Papaver rhoeas, and Sisymbrium orientale provided a floral display. Among the legumes, Vicia pannonica flowered in the TS and RA plots, and Onobrychis arenaria in S and AA media. There were also sown species of which only one individual reached flowering, such as Cichorium intybus, Centaurea jacea, and Daucus carota in AA, and Anthyllis vulneraria in G media.
3.4.2. Total Species Richness in Different Substrates
In the first year, a total of 87 taxa were detected in all plots of all media. The frequency of species occurrence varied (Section 3.4.3). We observed a variety of diversity between plots and media. GRS and TS led with 38 taxa, followed by 35 taxa in the DR+S media. Slightly fewer, 34 taxa, were recorded in the S and AA media. The least diverse were the C plots (Figure 14). However, more interesting data than the total species richness are when we look at how many species emerged from the official seed list. From this point of view, AA clearly leads (33 taxa), followed by DR+S (31 taxa), S (28 taxa), then RA, G, TS. In the AA media, only one taxon occurred (Centaurea cyanus), which was already present in the area.
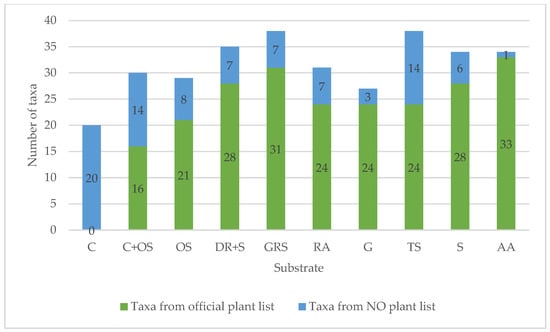
Figure 14.
Total species richness in different substrates. For abbreviations of the plots, see Table 2.
3.4.3. Frequency of Occurrence
Of the 87 taxa detected, 52 emerged from the sown seeds (from official and identified plant lists, and 35 taxa that were on site or arrived with the media (e.g., in the TS). The species Medicago lupulina was recorded in all media and in all 20 plots. Anthemis tinctoria, Apera spica-venti, Centaurea jacea, Cephalaria transsylvanica, and Sanguisorba minor were the frequently occurring taxa that were absent from up to two media, typically AA, RA and C+OS, and of course C, in which no seed were sown (Table 3). The dominant taxon of the first year was Anthemis tinctoria, which appeared in large numbers in the media and flowered in large masses for a long time and spectacularly. On the other hand, there were species that, although they appeared in most media, only reached flowering in one plot, such as Anthyllis vulneraria (G), or Centaurea jacea (AA). Achillea spp. was represented in larger numbers, Orlaya grandiflora, Papaver rhoeas, and Cephalaria transsylvanica were represented in some plots, but they also flowered, while, for example, Gallium verum, Dianthus pontederae and Sanguisorba minor did not flower anywhere in the first year.

Table 3.
Species that appeared in most substrates and plots in the first year. For abbreviations of the plots, see Table 2.
Among the taxa of the seed mix, Astragalus cicer (AA), Centaurea sadleriana (GRS), Dactylis glomerata (S), Euphorbia spp. (TS), Lotus corniculatus (C+OS), Salvia aethiopis (AA), and Thymus spp. (GRS) appeared in only one substrate. The rarest species (among the taxa of the seed mixture) appeared in the AA medium, which occurred in at most one other medium in addition to AA, such as Astragalus cicer, Malva spp., Salvia aethiopis, Scabiosa ochroleuca, and Seseli spp. Of these, the silvery rosette of Salvia aethiopis developed greatly but did not reach the generative phase.
3.4.4. Green Coverage in Different Substrates
Regarding green areas, Table 4 shows the quantification of the amount of photosynthetic green area based on the Canopeo application. Flowering and withered plant parts necessitated image correction, Table 5 shows a comparison of the original and corrected data in June and December. It can be observed that in June the intensive flowering of Anthemis individuals shifted the values, so for example, the DR+S medium shows only 63.5%, although with the corrected value (93.9%) the coverage with green is the highest here. In December dry plant parts distort the percentages (although to a much smaller extent), in this period, the RA medium gave the highest value both before and after correction.

Table 4.
Green coverage data generated by Canopeo without correction. For abbreviations of the plots, see Table 2.

Table 5.
Green coverage data correction in June and December. For abbreviations of the plots, see Table 2.
The data show that the most dynamically developing media, such as DR+S, GRS and TS, were already taken over in April and exceeded the cover of the control (C) plots with original vegetation, while OS, RA, G and S remained below it at that time and AA showed the lowest coverage. The differences decreased by summer, and C was the least green plot. The low cover values lasted from July to September, but by the second half of autumn the vegetation greened up again. From autumn, RA showed the highest, and OS the lowest values, which were not far behind the green ratio of C. GRS and TS also had high green cover, followed by C+OS, DR+S, G, S and AA with smaller values. It is clearly observed that AA, which produced the lowest green coverage in spring, and DR+S, which showed one of the fastest development, reached almost identical values from autumn. During the entire observation period, GRS and TS substrates were always characterized by a high green ratio, while RA reached similar values by autumn. A spectacular regression can be observed in the case of OS media, which showed the lowest value from autumn, characterized by a significant exposed soil surface.
In the figures below (Figure 15), we compared the green cover in the “a” half of each medium, i.e., the half irrigated from the second year, at three recording times. In April, the highest value was observed in the GRS (77.9%), and the lowest coverage was observed in the AA medium (12.7%). In the July survey—where necessary, we have shown the corrected values—it is clearly noticeable that the plots show a more uniform picture compared to the previous one, with smaller differences between the individual media. While in April the difference between the two extreme values is 65.2%, in June, it is 44.4%, and in the case of the sown media it is only 13.6%. The greenest medium at this time was the DR+S (93.1%), while the least green was the C (48.7%). The vegetation picture in December exceeded expectations in terms of green cover. After the necessary correction, TS (86.3%) showed the highest values and OS (16.5%) the lowest, with the difference again more significant at 69.8%.
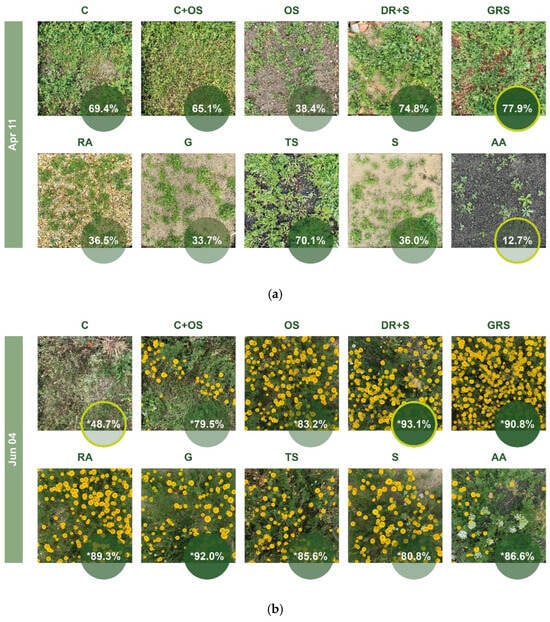
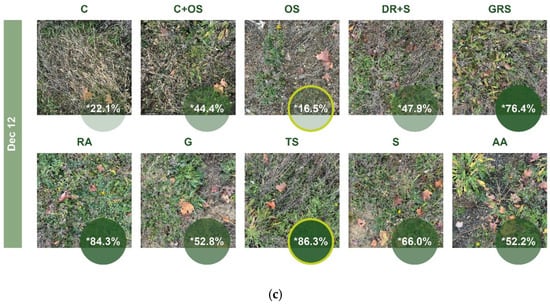
Figure 15.
Green coverage ratio in “a” part of different plots generated by Canopeo; (a) April, (b) June, and (c) December. * Corrected data. The % value in the yellow circle on a dark green background indicates the highest value, and the % value in the yellow circle on a light green background indicates the lowest value. For abbreviations of the plots, see Table 2.
3.4.5. Comparing the Species Composition of the Plots
Based on multivariate analysis, a dendrogram is a tree diagram used in hierarchical clustering to visualize the relationships between data points and how they are grouped together. It is a helpful tool for understanding the structure of your data and identifying appropriate cluster groupings. The analysis resulted in the following 5 (I–V) groups (Figure 16):
I. (1–2) = ‘C’ and ‘C+OS’;
II. (3–4–5) = ‘OS’, ‘DR+S’ and ‘GRS’;
III. (7–9–10) = ‘G’, ‘S’ and ‘AA’;
IV. (6) = ‘RA’
V. (8) = ‘TS’.
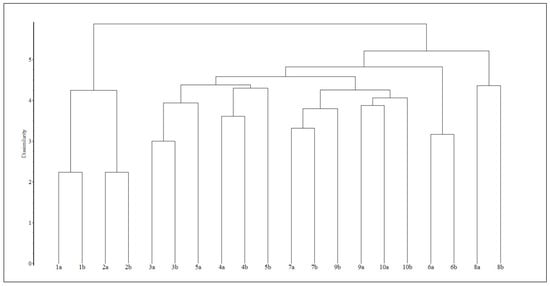
Figure 16.
Hierarchical clustering of the plots. For abbreviations of the plots, see Table 2.
Ordinations and partitions may be compared graphically by superimposing the clusters as convex polygons on an ordination scattergram. On the ordination plane each cluster is represented by the smallest convex polygon that can be drawn around the members of that cluster. These polygons are shown in different colors. Figure 17 shows the results of our analysis on the connection between the plots. The partition (hierarchical clustering) superimposed on the PCoA ordination shows clear differences between I (1–2 plots or C and C+OS)–IV (6 that is RA)–V (8 that is TS) groups, which clearly indicate differences in species composition. The results show that these three groups are relatively distinct, but the others (II–III) are quite similar, the groups are overlapping (plots 4 and 5 are DR+S and GRS, and 9 is S).
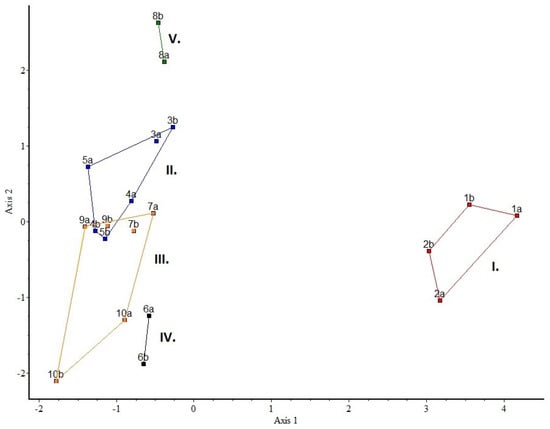
Figure 17.
Partition (hierarchical clustering) superimposed on ordination (PCoA) for the plots as object data. Numbers indicate plots 1–10. Eigenvalues of the 1st and 2nd axes were 26% and 11%, respectively. For abbreviations of the plots, see Table 2.
4. Discussion
4.1. Evaluation of Seed Mixture and Sowing
Among the herbaceous surfaces in urban environments, seeded beds are closer to a functioning ecosystem. Large areas can be created more cost-effectively by broadcasting seeds than beds created with pre-grown, planted perennials, while at the same time having a strong visual character and higher diversity. Several studies support the fact that a good seed mix contains both short-lived and annual species, which, with their rapid establishment, help to suppress weed growth in the first year, and later, the continuous cover of perennial species reduces the spread of weeds [47,48,49,50]. Supporting this, annual taxa (35 taxa) were present in a much higher number of species in our seed mixture in the first year than perennials (29 taxa). Despite the fact that in the original list the number of purely perennials is 56, while annuals are only 6 taxa, disregarding the transitional life forms (Figure 8). In the first period, the medium effect (seeds arriving with media) is also stronger, which may be a consequence of the high number of annual species.
A good seed mix contains varying percentages of graminoids (grasses and sedges), legumes, and other forbs. Additional groups can also be defined based on plant traits such as habit or life form [73,74,75]. Several studies have shown that over time, the proportion and coverage of sown species increases, while their number decreases [76]. Valkó et al. (2010) observed in a seed mixture of low-diversity grass species that the number of species and diversity decreased from the second and third years as the weed species that dominated the first year gradually disappeared. Competing grasses (Festuca spp., Bromus spp.) provided a homogeneous cover, and in the absence of open patches, new species could not establish themselves [47]. The proportion of grasses in the seed mixture we used is much lower, e.g., Carex taxa did not germinate at all and Festuca species showed little development in most of the plots. The exception to this is the GRS plot, where significant cover was achieved and Festuca species appeared in larger numbers compared to the other plots. At the same time, Apera spica-venti, which was only included in the specific list, and Bromus taxa, which were not included in either list, appeared in almost all the plots. Regarding grasses, it may be interesting to see how the diversity develops in the quadrats in the following years.
Several studies have found a positive correlation between seed mass and cover values indicating establishment success [46,77]. In natural communities, small-seeded species can compete by producing more seeds, but in the case of a given seed mixture, this is left to the producer [78,79,80]. In addition, the number of dormant seeds is higher in small-seeded species, which may also explain the lower germination rate [46,81,82]. Based on our evaluation so far, we cannot support the above, as in the first year there were also small-seeded species (seed mass category is 1 ≤ 0.2 g) that appeared in large numbers in almost all media, such as Achillea, Anthyllis species (seed mass category is 1–2 = 0.21 g–0.5 g), and large-seeded species, such as Sanguisorba minor (seed mass category is 6 = 4.01 g–10 g). Medicago lupulina, which appeared on all media, belongs to seed mass category 4 (1.01 g–2 g) based on 1000 seed mass. Some literature on the design of plots draws attention to the framing effect when delimiting environments [68], but so far this has not been felt at any level in our area. Some species from the seed list appeared outside the plots, which was presumably due to the transmission of wind and birds during seed dispersal or later, but these individuals were not included in the analyses.
4.2. Evaluation of Green Coverage
Despite the inaccuracy of the method, the correlation between the individual media and the coverage can be perceived. In the C and C+OS media, the existing plant population only initially provided some advantage, which was not enough for C+OS to be at the forefront in terms of coverage. It can be assumed that the existing plant population hindered the germination of the sown seeds through shading. The media with better organic matter (GRS, TS) developed the most dynamically and these showed high individual density and high coverage throughout. In the media with low nutrient content but good drainage, we could observe several dynamics. RA showed a significant increase in coverage, which was caused by the heavily bushy Securigera varia individuals in autumn, which appeared in such large numbers and sizes only in this medium. Although the AA medium developed more slowly and fewer individuals, they were able to grow larger than in denser stands. Based on the uncorrected values, the AA medium was the greenest in June, which is due to the lower presence and flowering intensity of Anthemis in this medium, which distorted the values less compared to the others. G and S showed similar values throughout and an open surface remained in the bed in all periods. Relatively few individuals appeared, but in many cases they were able to grow to large sizes (Anthyllis vulneraria, Centaurea jacea, Sanguisorba minor). DR+S initially behaved similarly to the rapidly developing medium, later we got a green cover similar to the G and especially S, but unlike them, no large open patches formed here.
Several studies draw attention to the inaccuracy of the device when using Canopeo, for example, that different devices do not give the same results from the same area [83]. With this information in mind, we primarily used the values obtained with the program for comparison (different plots with each other, or each quadrat at different times), so any possible inaccuracies were less significant. However, due to the time required and ‘inaccuracy’ of the large mass of yellow flowers and other post-processing when evaluating the results, it is worth considering the use of the program in this research in the future.
4.3. Evaluation of Species Composition in Different Substrates and Plots
When highlighting the functional groups, among the Fabaceae species that appeared in the first year, those that play a prominent role in improving the media by fixing atmospheric N [84], Medicago lupulina appeared in all media, while Lotus germanicus appeared in 4 (GRS, AA, S, TS) and Vicia pannonica in 2 (TS, RA) media. However, the distribution of Brassicaceae (4 species) and Poaceae (4 species), which play a greater role in the retention of fixed N, was slightly different among media. Arabis auriculata and Berteroa incana appeared in 7 media, Capsella bursa-pastoris in 3, and Descurainia sophia in only 2 media. Among the grasses, Apera spica-venti appeared in 9, Bromus and Festuca species in 6 each, and Setaria pumila in 7 media.
The results obtained by multivariate analysis support our results obtained by other methods. When interpreting the main results (obtained groups), the similarity of the pure species sets of the C and C+OS media may be relevant due to the existing species and the areas occupied by them, e.g., Cerastium brachypetalum, Crepis foetida subsp. rhoeadifolia, Erodium cicutarium, Holosteum umbellatum, Melilotus officinalis, Veronica polita or Viola arvensis, which only occurred in these media. Most of the 20 species appearing in the C media also appeared in the C+OS media. In addition, 16 taxa were identified from the seed mixture, of which Linum perenne was represented by a very large number of individuals, and Echium vulgare only germinated successfully on another medium, DR+S. The further similarities are probably formed by the similar physical properties of the media that influence the plants. Thus, the different mineral origin grains, such as G, S, and AA, were grouped together, while RA differs slightly from them, probably due to its better water storage capacity [42,43]. The number of species is slightly less than in the other three media. Several taxa that only appeared in a few media occurred here, such as Fumaria schleicheri (even in G), Lamium amplexicaule (only here), and Vicia pannonica (even in TS), which also flowered. At the same time, several taxa that occur in many media did not appear here, such as Anthemis ruthenica, Berteroa incana, and Orlaya grandiflora, and the grasses were very underrepresented—neither Bromus nor Festuca taxa appeared. The similarity of GRS and DR+S can perhaps be traced back to the clay-containing components, and since the original soil also contains a lot of construction debris, the similarity of OS is also understandable. At the same time, this latter medium differs significantly from the other two in terms of cover and species number. The difference of TS can be explained by the fact that a lot of taxa arrived with the agricultural soil that did not occur in other media, e.g., Convolvulus spp., Datura stramonium, Lysimachia arvensis, and Rhinanthus minor, and there were quite a few taxa that occurred in only one medium other than the TS medium, e.g., Ambrosia artemisiifolia, Descurainia sophia, Polygonum aviculare, Veronica hederifolia, and Vicia pannonica. Species-rich plantings can be established on low-productivity soils. These media, due to their low nutrient content and water storage capacity, are effective in preventing weed growth [6]. If we use a medium that is at least 7.5 cm thick, it will significantly suppress the development of weeds from the original soil seed bank [6]. Sand has proven to be particularly effective in several experiments and projects [6]. In our present experiment, the 10 cm medium thickness is sufficient to keep the original soil weed seed bank inactive, but at the same time seeds from surrounding areas can enter the medium. In their experiment, Hitchmough and colleagues (2003) found sand to be a more effective medium than a mixture of sand and brick dust as a medium for stress-tolerant species. Despite the higher N content of brick dust, seedling growth was still faster on sand, which they explain by the fact that brick dust limits root growth more and higher pH reduces mineralization [38]. In contrast, in our experiment, in the first year, a stand formed faster and taller, providing greater coverage on the DR+S medium than on the S medium (Figure 18).
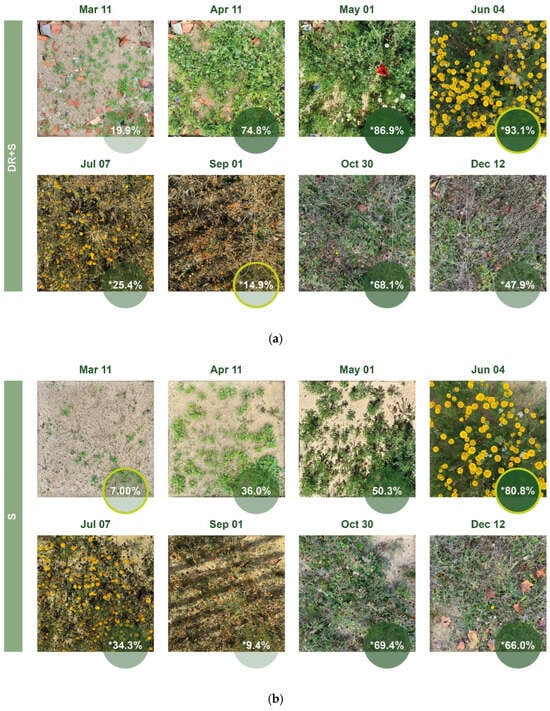
Figure 18.
Comparison of green coverage ratio in “a” part of the DR+S and S plots generated by Canopeo; (a) DR+S (b) S; * corrected data; The % value in the yellow circle on a dark green background indicates the highest value, and the % value in the yellow circle on a light green background indicates the lowest value.
Already in the first year, some kind of characteristic emerged in most of the media based on the picture of the stands formed on them. OS became the barrenest plot, GRS was characterized by the dominant presence of grasses, especially Festuca, in RA the Fabaceae family, especially large individuals of Securigera varia, in G the pronounced presence of Anthyllis vulneraria can be observed, while in TS there are many alien species, and in AA the media where taxa with rarer appearances were also able to develop and reach larger sizes or even flowering.
Our aim is a long-term (minimum 5 years) monitoring of seed-sown beds. In the future, we will therefore monitor to what extent the results and trends described in this article remain or change, especially with the introduction of differentiated irrigation from the second year.
Author Contributions
Conceptualization, K.S., Á.S. and J.D.-T.; methodology, K.S. and J.D.-T.; software, A.G.; validation, J.D.-T., A.G. and K.S.; formal analysis, J.D.-T., A.G. and K.S.; investigation, J.D.-T. and K.S.; resources, J.D.-T. and K.S.; data curation, J.D.-T. and K.S.; writing—original draft preparation, J.D.-T. and K.S.; writing—review and editing, K.S. and J.D.-T.; visualization, J.D.-T. and K.S.; supervision, K.S.; project administration, J.D.-T. All authors have read and agreed to the published version of the manuscript.
Funding
Supported by the EKÖP-MATE/2024/25/D New National Excellence Program of the Ministry for Culture and Innovation from the source of the National Research, Development And Innovation Fund.
Data Availability Statement
The original contributions presented in this study are included in the article. Further inquiries can be directed to the corresponding author.
Acknowledgments
During the preparation of this manuscript/study, the author(s) used the Budapest Zoo and Botanical Garden, and express thanks that it was made available and will continue to be made available in the future. The authors also thank Gábor Majoros, who helped in self-determination. The authors have reviewed and edited the output and take full responsibility for the content of this publication.
Conflicts of Interest
The authors declare no conflicts of interest. The funders had no role in the design of the study; in the collection, analyses, or interpretation of data; in the writing of the manuscript; or in the decision to publish the results.
Correction Statement
This article has been republished with a minor correction to the Data Availability Statement. This change does not affect the scientific content of the article.
Appendix A

Table A1.
Assessment of the plant species based on plant traits (PADAPT: Pannonian Database of Plant Traits) [38,40,41,42,43].
Table A1.
Assessment of the plant species based on plant traits (PADAPT: Pannonian Database of Plant Traits) [38,40,41,42,43].
| Evaluation Criteria | Value * | Definition |
|---|---|---|
| Plant family, Raunkiær life form, nativeness, area type, phytosociological categorization (Borhidi), Borhidi’s social behaviour type (SBT) | clear classification and known categories | |
| Borhidi’s T: heat supply of the habitat where the species occurs (0–8) | 5 | in accordance with the submontane broad-leaved forest belt |
| 6 | in accordance with the thermophilous forest or Eurasian forest-steppe belt | |
| 7 | in accordance with the submediterranean woodland and Eurasian steppe belt | |
| 8 | in accordance with the eumediterranean evergreen belt | |
| NA | no data | |
| Borhidi’s W: occurrence in relation to soil moisture or the water table (1–12) | 1 | plants of extremely dry habitats or bare rock surfaces |
| 2 | xero-indicators of habitats with a long dry period | |
| 3 | xero-tolerant plants occasionally occurring on wet soils | |
| 4 | plants of semi-dry habitats | |
| 5 | plants of semi-humid habitats of mesic conditions | |
| 6 | plants of usually wet soils | |
| 7 | plants of moist but well-aerated soils | |
| NA | no data | |
| Borhidi’s N: in relation to the ammonia and nitrate supply of the habitats (1–9) | 1 | only in soils extremely poor in mineral nitrogen |
| 2 | plants of habitats very poor in nitrogen | |
| 3 | plants of moderately oligotrophic habitats | |
| 4 | plants of submesotrophic habitats | |
| 5 | plants of mesotrophic habitats | |
| 6 | plants of moderately nutrient rich habitats | |
| 7 | plants of soils rich in mineral nitrogen | |
| 8 | N-indicator plants of fertilized soils | |
| NA | no data | |
| Borhidi’s L: in relation to relative light intensity during the summer (1–9) | 5 | semi-shade plants |
| 6 | semi-shade—semi-light demanding plants | |
| 7 | semi-light demanding plants mostly living in full light, but also somewhat shade-tolerant | |
| 8 | highly light demanding plants | |
| 9 | full-light demanding plants of open habitats | |
| NA | no data | |
| Borhidi’s C: in relation to the distribution of plants according to degree of continentality of the climate (1–9) | ||
* values occurring in the species of the seed mixture.
References
- Pokorny, M.L.; Sheley, R.L.; Svejcar, T.J.; Engel, R.E. Plant species diversity in a grassland plant community: Evidence for forbs as a critical management consideration. West. N. Am. Nat. 2004, 64, 9. [Google Scholar]
- Petermann, J.S.; Buzhdygan, O.Y. Grassland biodiversity. Curr. Biol. 2021, 31, R1195–R1201. [Google Scholar] [CrossRef] [PubMed]
- Cameron, R.W.F.; Hitchmough, J.D. Environmental Horticulture: Science and Management of Green Landscapes; CABI: Wallingford, UK, 2016. [Google Scholar]
- Dengler, J.; Janišová, M.; Török, P.; Wellstein, C. Biodiversity of Palaearctic grasslands: A synthesis. Agric. Ecosyst. Environ. 2014, 182, 1–14. [Google Scholar] [CrossRef]
- Rainer, T.; West, C. Planting in a Post-Wild World: Designing Plant Communities for Resilient Landscapes, 1st ed.; Timber Press: Portland, OR, USA, 2015. [Google Scholar]
- Hitchmough, J.D. Sowing Beauty: Designing Flowering Meadows from Seed; Timber Press: North Adams, MA, USA, 2017. [Google Scholar]
- Pickett, S.T.A.; Cadenasso, M.; Grove, M.; Nilon, C.; Pouyat, R.; Zipperer, W.; Costanza, R. Urban Ecological Systems: Linking Terrestrial Ecological, Physical, and Socioeconomic Components of Metropolitan Areas. Annu. Rev. Ecol. Syst. 2003, 32, 127–157. [Google Scholar] [CrossRef]
- Grimm, N.; Faeth, S.; Golubiewski, N.; Redman, C.; Wu, J.; Bai, X.; Briggs, J. Global Change and the Ecology of Cities. Science 2008, 319, 756–760. [Google Scholar] [CrossRef]
- Korotchenko, I.; Peregrym, M. Ukrainian Steppes in the Past, at Present and in the Future. In Eurasian Steppes. Ecological Problems and Livelihoods in a Changing World; Werger, M.J.A., Van Staalduinen, M.A., Eds.; Springer: Dordrecht, The Netherlands, 2012; pp. 173–196. [Google Scholar] [CrossRef]
- Torok-Tothmeresz-Gyepkotet-2015.pdf. Available online: https://orgprints.org/id/eprint/30119/1/Torok-Tothmeresz-Gyepkotet-2015.pdf (accessed on 10 March 2025).
- Báldi, A.; Batáry, P.; Kleijn, D. Effects of grazing and biogeographic regions on grassland biodiversity in Hungary–analysing assemblages of 1200 species. Agric. Ecosyst. Environ. 2013, 166, 28–34. [Google Scholar] [CrossRef]
- Norton, B.; Bending, G.; Clark, R.; Corstanje, R.; Dunnett, N.; Evans, K.; Grafius, D.; Gravestock, E.; Grice, S.; Harris, J.; et al. Urban meadows as an alternative to short mown grassland: Effects of composition and height on biodiversity. Ecol. Appl. 2019, 29, e01946. [Google Scholar] [CrossRef]
- Robbins, P.; Birkenholtz, T. Turfgrass revolution: Measuring the expansion of the American lawn. Land Use Policy 2003, 20, 181–194. [Google Scholar] [CrossRef]
- Balvanera, P.; Pfisterer, A.; Buchmann, N.; He, J.-S.; Nakashizuka, T.; Raffaelli, D.; Schmid, B. Quantifying the evidence for biodiversity effects on ecosystem functioning and services. Ecol. Lett. 2006, 9, 1146–1156. [Google Scholar] [CrossRef]
- Hector, A.; Bagchi, R. Biodiversity and Ecosystem Multifunctionality. Nature 2007, 448, 188–190. [Google Scholar] [CrossRef]
- Hooper, D.; Chapin, F.S., III; Ewel, J.J.; Hector, A.; Inchausti, P.; Lavorel, S.; Lawton, J.H.; Lodge, D.; Loreau, M.; Naeem, S.; et al. Effects of Biodiversity on Ecosystem Functioning: A Consensus of Current Knowledge. Ecol. Monogr. 2005, 75, 3–35. [Google Scholar] [CrossRef]
- Lundholm, J.T. Green roof plant species diversity improves ecosystem multifunctionality. J. Appl. Ecol. 2015, 52, 726–734. [Google Scholar] [CrossRef]
- Quijas, S.; Schmid, B.; Balvanera, P. Plant diversity enhances provision of ecosystem services: A new synthesis. Basic. Appl. Ecol. 2010, 11, 582–593. [Google Scholar] [CrossRef]
- Baruch, Z.; Liddicoat, C.; Cando-Dumancela, C.; Laws, M.; Morelli, H.; Weinstein, P.; Young, J.M.; Breed, M.F. Increased plant species richness associates with greater soil bacterial diversity in urban green spaces. Environ. Res. 2021, 196, 110425. [Google Scholar] [CrossRef] [PubMed]
- Bretzel, F.; Vannucchi, F.; Pezzarossa, B.; Paraskevopoulou, A.; Romano, D. Establishing wildflower meadows in anthropogenic landscapes. Front. Hortic. 2024, 2, 1248785. [Google Scholar] [CrossRef]
- Horváth, A.; Szemán, L.; Bartha, S.; Virágh, K.; Bölöni, J.; Fülöp, G.; Rév, S. A természetbarát visszagyepesítés technológiai lehetőségei: A 2008. május 22-23-án rendezett “Szakmapolitikai kihívások és kilátások a gyephasználatban 2007–2013” című szakmai-tudományos tanácskozáson elhangzott előadás szerkesztett változata. Gyepgazdálkodási Közlemények 2008, 6, 19–27. [Google Scholar] [CrossRef]
- Ignatieva, M.; Ahrné, K. Biodiverse green infrastructure for the 21st century: From “green desert” of lawns to biophilic cities. J. Archit. Urban. 2013, 37, 1–9. [Google Scholar] [CrossRef]
- Holmes, D. Superbloom Display Opens at the Tower of London, World Landscape Architecture. 2022. Available online: https://worldlandscapearchitect.com/superbloom-display-opens-at-the-tower-of-london/ (accessed on 8 March 2025).
- Szabó, K. Klímafák és Városfásítás; Starkiss Kft: Budapest, Hungary, 2023. [Google Scholar]
- Jim, C.Y. Urban soil characteristics and limitations for landscape planting in Hong Kong. Landsc. Urban Plan. 1998, 40, 235–249. [Google Scholar] [CrossRef]
- Szabó, K.; Boll, S.; Eros-Honti, Z. Applying artificial mycorrhizae in planting urban trees. Appl. Ecol. Environ. Res. 2014, 12, 835–853. [Google Scholar] [CrossRef]
- Szabó, K.; Lovas, V.; Eros-Honti, Z. The First Extensive Case-study on the Effects of Artificial Mycorrhization of Acer buergerianum Miq. in Hungary. Univers. J. Plant Sci. 2015, 3, 121–131. [Google Scholar] [CrossRef]
- Fini, A.; Frangi, P.; Amoroso, G.; Riccardo, P.; Faoro, M.; Bellasio, C.; Ferrini, F. Effect of controlled inoculation with specific mycorrhizal fungi from the urban environment on growth and physiology of containerized shade tree species growing under different water regimes. Mycorrhiza 2011, 21, 703–719. [Google Scholar] [CrossRef]
- Rokia, S.; Séré, G.; Schwartz, C.; Deeb, M.; Fournier, F.; Nehls, T.; Damas, O.; Vidal-Beaudet, L. Modelling agronomic properties of Technosols constructed with urban wastes. Waste Manag. 2014, 34, 2155–2162. [Google Scholar] [CrossRef] [PubMed]
- Bauer, M.; Krause, M.; Heizinger, V.; Kollmann, J. Using crushed waste bricks for urban greening with contrasting grassland mixtures: No negative effects of brick-augmented substrates varying in soil type, moisture and acid pre-treatment. Urban Ecosyst 2022, 25, 1369–1378. [Google Scholar] [CrossRef]
- Hitchmough, J.; Kendle, T.; Paraskevopoulou, A.T. Seedling emergence; survival; initial growth of forbs; grasses native to Britain; central/southern Europe in low productivity urban “waste” substrates. Urban Ecosyst. 2001, 5, 285–308. [Google Scholar] [CrossRef]
- Molineux, C.J.; Fentiman, C.H.; Gange, A.C. Characterising alternative recycled waste materials for use as green roof growing media in the U.K. Ecol. Eng. 2009, 35, 1507–1513. [Google Scholar] [CrossRef]
- Nehls, T.; Rokia, S.; Mekiffer, B.; Schwartz, C.; Wessolek, G. Contribution of bricks to urban soil properties. J. Soils Sediments 2012, 13, 575–584. [Google Scholar] [CrossRef]
- Young, T.; Cameron, D.D.; Sorrill, J.; Edwards, T.; Phoenix, G.K. Importance of different components of green roof substrate on plant growth and physiological performance. Urban For. Urban Green. 2014, 13, 507–516. [Google Scholar] [CrossRef]
- Ampim, P.; Sloan, J.; Cabrera, R.; Harp, D.; Jaber, F. Green roof growing media: Types, ingredients, composition and properties. J. Environ. Hortic. 2010, 28, 244–252. [Google Scholar] [CrossRef]
- Nagase, A.; Dunnett, N. The relationship between percentage of organic matter in substrate and plant growth in extensive green roofs. Landsc. Urban Plan. 2011, 103, 230–236. [Google Scholar] [CrossRef]
- Hitchmough, J.; Dunnett, N. The Dynamic Landscape: Design, Ecology and Management of Naturalistic Urban Planting, Routledge & CRC Press. 2004. Available online: https://www.routledge.com/The-Dynamic-Landscape-Design-Ecology-and-Management-of-Naturalistic-Urban/Dunnett-Hitchmough/p/book/9780415438100 (accessed on 6 October 2023).
- Hitchmough, J.D.; Kendle, A.D. Paraskevopoulou, Emergence, survival and initial growth of North American prairie forbs and British meadow forbs and grasses in low-productivity urban “waste” soils. J. Hortic. Sci. Biotechnol. 2003, 78, 89–99. [Google Scholar] [CrossRef]
- Korn, P. Peter Korn’s Garden: Giving Plants What They Want, 1st ed.; Peter Korn: Landvetter, Sweden, 2013. [Google Scholar]
- Beth Chatto’s Gravel Garden-Beth Chatto Gardens. Available online: https://www.bethchatto.co.uk/garden-nursery/gallery/gravel-garden.htm (accessed on 28 June 2025).
- Delos at Sissinghurst Castle Garden|Kent, National Trust. Available online: https://www.nationaltrust.org.uk/visit/kent/sissinghurst-castle-garden/recreating-delos-at-sissinghurst (accessed on 28 June 2025).
- Alzboon, K.; Al-tabbal, J.; Al-Kharabsheh, N.M.; AL-Mefleh, N. Natural volcanic tuff as a soil mulching: Effect on plant growth and soil chemistry under water stress. Appl. Water Sci. 2019, 9, 123. [Google Scholar] [CrossRef]
- Szeleczki, B.; Tompa, R.; Kristály, F. The Effect of Rhyolite Tuff Debris and Andesite Debris on the Water Content Laboratory Experiment. In Proceedings of the “Green Deal”-Challenges and Opportunities, Gyöngyös, Hungary, 5–6 May 2022. [Google Scholar]
- Báthoryné Nagy, I.R. (Ed.) Klímaadaptív Gyepgazdálkodás a Városban; VKSZ SZIE: Veszprém, Hungary, 2021. [Google Scholar]
- Balázs, D.; Török, P.; Kapocsi, I.; Lontay, L.; Vida, E.; Valkó, O.; Lengyel, S.; Tóthmérész, B. Szik- és löszgyep-rekonstrukció vázfajokból álló magkeverék vetésével a Hortobágyi Nemzeti Park területén (Egyek-Pusztakócs). Tájökológiai Lapok 2008, 6, 323–332. [Google Scholar] [CrossRef]
- Réka, K.; Balázs, D.; Tóth, K.; Lukács, K.; Rádai, Z.; Kelemen, A.; Miglécz, T.; Tóth, Á.; Godó, L.; Valkó, O. Co-seeding grasses and forbs supports restoration of species-rich grasslands and improves weed control in ex-arable land. Sci. Rep. 2022, 12, 21239. [Google Scholar] [CrossRef]
- Valkó, O.; Vida, E.; Kelemen, A.; Török, P.; Balázs, D.; Miglécz, T.; Lengyel, S.; Tóthmérész, B. Gyeprekonstrukció napraforgó-és gabonatáblák helyén alacsony diverzitású magkeverék vetésével. Tájökológiai Lapok 2010, 8, 53–64. [Google Scholar] [CrossRef]
- Valkó, O.; Balázs, D.; Török, P.; Kirmer, A.; Tischew, S.; Kelemen, A.; Tóth, K.; Miglécz, T.; Szilvia, R.; Sonkoly, J.; et al. High-diversity sowing in establishment gaps: A promising new tool for enhancing grassland biodiversity. Tuexenia 2016, 36, 359–378. [Google Scholar] [CrossRef]
- Miglécz, T.; Donkó, Á.; Török, P.; Valkó, O.; Balázs, D.; Kelemen, A.; Tóth, K.; Drexler, D.; Tóthmérész, B. Magkeverékek fejlesztése fajgazdag szőlősorköz-takarónövényzethez. Gyepgazdálkodási Közlemények 2013, 2013, 37–42. [Google Scholar]
- Valkó, O.; Deák, B.; Török, P.; Tóth, K.; Kiss, R.; Kelemen, A.; Miglécz, T.; Sonkoly, J.; Tóthmérész, B. Dynamics in vegetation and seed bank composition highlight the importance of post-restoration management in sown grasslands. Restor. Ecol. 2021, 29, e13192. [Google Scholar] [CrossRef]
- Byun, C.; de Blois, S.; Brisson, J. Plant functional group identity and diversity determine biotic resistance to invasion by an exotic grass. J. Ecol. 2013, 101, 128–139. [Google Scholar] [CrossRef]
- Fenesi, A.; Kelemen, K.; Sándor, D.; Ruprecht, E. Influential neighbours: Seeds of dominant species affect the germination of common grassland species. J. Veg. Sci. 2020, 31, 1028–1038. [Google Scholar] [CrossRef]
- Garbowski, M.; Avera, B.; Bertram, J.; Courkamp, J.; Gray, J.; Hein, K.; Lawrence, R.; McIntosh, M.; McClelland, S.; Post, A.; et al. Getting to the root of restoration: Considering root traits for improved restoration outcomes under drought and competition. Restor. Ecol. 2020, 28, 1384–1395. [Google Scholar] [CrossRef]
- Ruprecht, E.; Donath, T.; Otte, A.; Eckstein, L. Chemical effects of a dominant grass on seed germination of four familial pairs of dry grassland species. Seed Sci. Res. 2008, 18, 239–248. [Google Scholar] [CrossRef]
- Partzsch, M.; Faulhaber, M.; Meier, T. The effect of the dominant grass Festuca rupicola on the establishment of rare forbs in semi-dry grasslands. Folia Geobot. 2018, 53, 103–113. [Google Scholar] [CrossRef]
- Rehling, F.; Sandner, T.; Matthies, D. Biomass partitioning in response to intraspecific competition depends on nutrients and species characteristics: A study of 43 plant species. J. Ecol. 2021, 109, 2219–2233. [Google Scholar] [CrossRef]
- Barry, C.; Hodge, S. You Reap What You Sow: A Botanical and Economic Assessment of Wildflower Seed Mixes Available in Ireland. Conservation 2023, 3, 73–86. [Google Scholar] [CrossRef]
- Bucharova, A.; Bossdorf, O.; Hölzel, N.; Kollmann, J.; Prasse, R.; Durka, W. Mix and match: Regional admixture provenancing strikes a balance among different seed-sourcing strategies for ecological restoration. Conserv. Genet. 2019, 20, 7–17. [Google Scholar] [CrossRef]
- Atlasza, M.N. Available online: https://emna.hu (accessed on 27 June 2025).
- Balogh, P.I.; Bede-Fazekas, Á.; Dezsényi, P. Ökologikus Növényalkalmazás És Biodiverz Zöldtető Kialakítása A Budapesti Green House Irodaház Tetőkertjénél. 4D Tájépítészeti és Kertművészeti Folyóirat 2013, 8, 2–23. [Google Scholar]
- Szabó, K. The Potential Roles of Biodiverse Green Roofs in the Extending Urban Green Network. In Proceedings of the Fábos Conference on Landscape and Greenway Planning, Budapest, Hungary, 30 June–3 July 2016; Volume 5. [Google Scholar] [CrossRef]
- Vadvirágos rét Magkeverék FŐKERT-BKM. Available online: https://fokert.budapestikozmuvek.hu/vadviragos-ret-magkeverek (accessed on 26 June 2025).
- Biodiverz Magkeverékek a GreenTech-től. Available online: https://greenroof.hu/biodiverz-magkeverekek-a-greentech-tol-138 (accessed on 28 June 2025).
- 15.1.1.37. Magyarország és Budapest Időjárásának Adatai. Available online: https://www.ksh.hu/stadat_files/kor/hu/kor0037.html (accessed on 22 June 2025).
- met.hu. HungaroMet Magyar Meteorológiai Szolgáltató Nonprofit Zrt. 2025. Available online: https://www.met.hu/ (accessed on 29 June 2025).
- Értékelések, O.L. Országos Légszennyezettségi Mérőhálózat. Available online: https://legszennyezettseg.met.hu/levegominoseg/ertekelesek/olm-ertekelesek (accessed on 22 June 2025).
- Patrignani, A.; Ochsner, T. Canopeo: A Powerful New Tool for Measuring Fractional Green Canopy Cover. Agron. J. 2015, 107, 2312–2320. [Google Scholar] [CrossRef]
- Pomatto, E.; Larcher, F.; Caser, M.; Gaino, W.; Devecchi, M. Evaluation of Different Combinations of Ornamental Perennials for Sustainable Management in Urban Greening. Plants 2023, 12, 3293. [Google Scholar] [CrossRef]
- Sonkoly, J.; Tóth, E.; Balogh, N.; Balogh, L.; Bartha, D.; Bata, K.; Bátori, Z.; Békefi, N.; Botta-Dukát, Z.; Bölöni, J.; et al. PADAPT 1.0–the Pannonian Database of Plant Traits. bioRxiv 2022. [Google Scholar] [CrossRef]
- Bartha, D. Ökológiai és természetvédelmi jelzőszámok a vegetáció értékelésében/Ecological and nature conservation indicators in vegetation assessment. In Tilia; Duna–Ipoly Nemzeti Park Igazgatóság: Budapest, Hungary, 2000; pp. 170–180. [Google Scholar]
- Podani, J. SYN-TAX 2000 Computer Program for Data Analysis in Ecology and Systematics; Scientia Publishing: Budapest, Hungary, 2001; Available online: https://podani.web.elte.hu/syntax2000.pdf (accessed on 22 June 2025).
- Borhidi, A. Social behaviour types, the naturalness and relative indicator values of the higher plants in the Hungarian Flora. Acta Bot. Hung. 1995, 39, 97–182. [Google Scholar]
- Hooper, D.U.; Vitousek, P.M. Effects of Plant Composition and Diversity on Nutrient Cycling. Ecol. Monogr. 1998, 68, 121–149. [Google Scholar] [CrossRef]
- Lanta, V.; Lepš, J. Effect of functional group richness and species richness in manipulated productivity–diversity studies: A glasshouse pot experiment. Acta Oecologica 2006, 29, 85–96. [Google Scholar] [CrossRef]
- Wang, Y.; Liu, Y.; Ding, J.; Chen, P.; Zhan, T.; Yao, Y.; Song, J.; Fu, B.-J. Impact of functional groups on aboveground biomass in alpine grassland communities. Prog. Progress. Phys. Geogr. Earth Environ. 2024, 48, 698–715. [Google Scholar] [CrossRef]
- Lepŝ, J.; Dole, J.; Bezemer, T.M.; Brown, V.K.; Hedlund, K.; Arroyo, M.I.; Jörgensen, H.B.; Lawson, C.S.; Mortimer, S.R.; Geldart, A.P.; et al. Long-term effectiveness of sowing high and low diversity seed mixtures to enhance plant community development on ex-arable fields. Appl. Veg. Sci. 2007, 10, 97–110. [Google Scholar] [CrossRef]
- Cevallos, D.; Szitár, K.; Halassy, M.; Kövendi-Jakó, A.; Török, K. Larger Seed Mass Predicts Higher Germination and Emergence Rates in Sandy Grassland Species with Non-Dormant Seeds. Acta Bot. Hung. 2022, 64, 237–258. [Google Scholar] [CrossRef]
- Leishman, M.; Wright, I.; Moles, A.; Westoby, M. The Evolutionary Ecology of Seed Size. In Seeds: The Ecology of Regeneration in Plant Communities; CABI Publishing: Cambridge, UK, 2000; Chapter 2; pp. 31–57. [Google Scholar] [CrossRef]
- Scotton, M. Seed production in grassland species: Morpho-biological determinants in a species-rich semi-natural grassland. Grass Forage Sci. 2018, 73, 764–776. [Google Scholar] [CrossRef]
- Moles, A.; Westoby, M.; AT, M.; Westoby, M. Seed size and plant strategy across the whole life cycle. Oikos 2006, 113, 91–105. [Google Scholar] [CrossRef]
- Török, P.; Tóth, E.; Tóth, K.; Valkó, O.; Deák, B.; Kelbert, B.; Bálint, P.; Radócz, S.; Kelemen, A.; Sonkoly, J.; et al. New measurements of thousand-seed weights of species in the Pannonian flora. Acta Bot. Hung. 2016, 58, 187–198. [Google Scholar] [CrossRef]
- Török, P.; Miglécz, T.; Valkó, O.; Tóth, K.; Kelemen, A.; Albert, Á.-J.; Matus, G.; Molnár, V.A.; Ruprecht, E.; Papp, L.; et al. New thousand-seed weight records of the Pannonian flora and their application in analysing social behaviour types. Acta Bot. Hung. 2013, 55, 429–472. [Google Scholar] [CrossRef]
- Heinonen, R.; Mattila, T. Smartphone-based estimation of green cover depends on the camera used. Agron. J. 2021, 113, 5597–5601. [Google Scholar] [CrossRef]
- Yang, J.; Lan, L.; Jin, Y.; Yu, N.; Wang, D.; Wang, E. Mechanisms underlying legume–rhizobium symbioses. J. Integr. Plant Biol. 2022, 64, 224–267. [Google Scholar] [CrossRef] [PubMed]
Disclaimer/Publisher’s Note: The statements, opinions and data contained in all publications are solely those of the individual author(s) and contributor(s) and not of MDPI and/or the editor(s). MDPI and/or the editor(s) disclaim responsibility for any injury to people or property resulting from any ideas, methods, instructions or products referred to in the content. |
© 2025 by the authors. Licensee MDPI, Basel, Switzerland. This article is an open access article distributed under the terms and conditions of the Creative Commons Attribution (CC BY) license (https://creativecommons.org/licenses/by/4.0/).