Abstract
Urban growth often surpasses the actual needs of the population, leading to inefficient land use and long-term environmental challenges. This study provides an integrated perspective on urban landscape transformation by linking socio-demographic dynamics with ecological consequences, notably vegetation loss and increased impervious surfaces. The study area is Năvodari Administrative-Territorial Unit (ATU), a coastal tourist city located along the Black Sea in Romania. By integrating geospatial datasets such as Urban Atlas and Corine Land Cover with population- and construction-related statistics, the analysis reveals a disproportionate increase in urbanized land compared to population growth. Time-series analyses based on the Normalized Difference Vegetation Index (NDVI) and Normalized Difference Built-up Index (NDBI) from 1990 to 2022 highlight significant ecological degradation, including vegetation loss and increased built-up density. The findings suggest that real estate investment and tourism-driven development play a more substantial role than demographic dynamics in shaping land use change. Understanding urban expansion as a coupled social–ecological process is essential for promoting sustainable planning and enhancing environmental resilience. While this study is focused on the coastal city of Năvodari, its insights are relevant to a broader international context, particularly for rapidly developing tourist destinations facing similar urban and ecological pressures. The findings support efforts toward more inclusive, balanced, and environmentally responsible urban development, aligning with the core principles of Sustainable Development Goal 11, particularly Target 11.3, which emphasizes sustainable urbanization and efficient land use.
Keywords:
landscape transformation; urban expansion; land use; land cover; remote sensing; Romania; Năvodari 1. Introduction
Today, over half of the global population resides in urban areas, and this share is expected to approach 70% by 2050 [1]. Urban expansion is a major driver of land use change, particularly in small- and medium-sized cities where planning efforts often lag development pressures. Moreover, the rate of urban land expansion has surpassed that of urban population growth [2] raising concerns about land consumption, food security, environmental degradation, climate resilience, and the need for more effective spatial governance [3,4,5].
These dynamics challenge national efforts to implement the United Nations’ 2030 Agenda for Sustainable Development, particularly Sustainable Development Goal (SDG) 11, also known as the urban SDG, which calls for inclusive, safe, resilient, and sustainable cities [6]. Target 11.3 emphasizes the need for inclusive and sustainable urbanization, while the New Urban Agenda further highlights the role of timely, disaggregated data in aligning spatial planning with environmental sustainability and quality of life [7].
To support the implementation of SDG indicators and promote the use of geospatial data in sustainable development, the Working Group on Geospatial Information (WGGI) was established in 2015 by the Inter-agency Expert Group on SDG Indicators (IAEG-SDGs).
Earth observation (EO) technologies play a critical role in addressing this challenge. EO offers cost-effective and scalable solutions for monitoring land use change, providing timely and spatially consistent data that can support urban planning, policy evaluation, and sustainable land management [2,8,9]. EO is also instrumental in supporting SDG monitoring by enabling governments to track urban dynamics and environmental impacts in an evidence-based manner [10,11,12].
Countries remain at the core of SDG monitoring and reporting, primarily through their national statistical systems, including national statistical offices (NSOs), line ministries, and other key institutions responsible for data collection, coordination, validation, and the production of official statistics [13]. At the same time, local-level governance structures, including counties, municipalities, and cities play a central role in leveraging EO for SDG implementation, as they are closest to citizens and directly responsible for public service delivery [13].
Furthermore, the development of the Earth Observations Toolkit for Sustainable Cities and Human Settlements underscores the growing need for collaboration among cities, national agencies, and EO stakeholders to inform policy-making and advance sustainable urban development [14].
Despite various initiatives and institutional frameworks, the integration of geospatial and EO data into national and subnational planning and statistical systems remains limited in many countries. Romania exemplifies this gap. Although Romania has made some progress, its performance on SDG 11 is still rated as “Moderately increasing but challenges remain” in the latest SDG report [15]. Moreover, the practical implementation of EO technologies to support SDG monitoring and reporting remains significantly underdeveloped.
Whilst several studies have explored EO-based approaches for informing policy development [16] or supporting the implementation of sustainable urban strategies [17], their application to analyze urbanization dynamics at the city level remains notably underexplored. This is particularly relevant in the context of rapidly urbanizing small- and medium-sized cities, where data gaps and limited planning capacities hinder sustainable development.
Effective monitoring and management of urban development are crucial to balancing environmental concerns with the growing demand for tourism infrastructure. EO technologies, which have been widely recognized at global and national scales for monitoring land use and land cover changes and supporting urban planning [18,19,20,21,22], hold potential in this context. However, relatively few studies have focused on urban and metropolitan scales [23], which are essential for capturing the complexity of urban growth, as emphasized by SDG 11.3 [24], and for guiding sustainable development practices in rapidly growing coastal zones like Năvodari ATU.
This study aims to bridge the knowledge–policy gap by integrating EO and geospatial data with statistical analysis to assess urban expansion and landscape transformation in the Năvodari ATU. Through a localized analysis of land use and land cover (LULC) change and conversion patterns, the research examines the spatial dynamics of urban growth and its implications for sustainable land management at the city level. The findings provide critical insights into how EO can support more effective implementation of SDG 11 locally, helping municipalities address the challenges of urban expansion while aligning with both national priorities and global sustainability targets. The primary objective of this study is to quantify land use and land cover changes in the ATU Năvodari region using remote sensing and geospatial analyses. We examine temporal dynamics in LULC from 1990 to 2022, with a particular focus on urban expansion and its environmental implications.
2. Materials and Methods
2.1. Study Area
The ATU Năvodari is situated along the western coast of the Black Sea, within Constanța County (Figure 1), the most urbanized county in Romania according to the 2021 national census. From a geographical perspective, approximately half of the Năvodari ATU’s territory consists of water bodies, including the Black Sea and nearby lagoons. Agricultural land still covers a significant portion of the area, while artificial surfaces account for around 25% of the total territory. Forests and semi-natural areas are minimal, representing only about 1% [25].
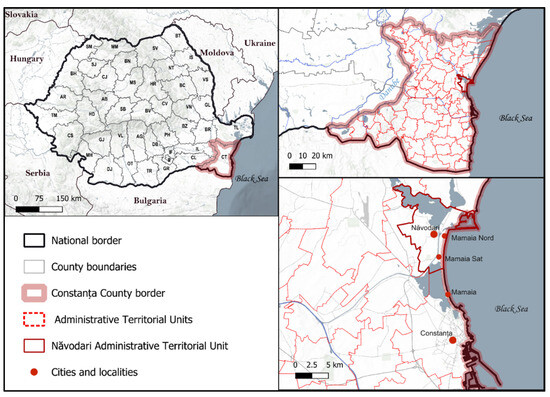
Figure 1.
Location map of Năvodari ATU, situated in Constanța County, southeastern Romania.
The ATU encompasses the city of Năvodari, which had a population of approximately 34,398 inhabitants according to the 2021 census [26], marking a 236.7% increase compared to the 2011 census. It also includes two prominent tourist destinations, Mamaia Sat and Mamaia Nord. Although these resort zones lack well-defined administrative boundaries, they have undergone significant and rapid urbanization in recent years, primarily driven by the region’s increasing appeal as a coastal tourism destination and the availability of land for residential and commercial development. Their location in the vicinity of Constanța city (the county capital), the largest city on Romania’s Black Sea coast with a population of approximately 263,688 inhabitants [26], has further accelerated this growth. As both the country’s principal maritime port and a major seaside tourist destination, Constanța exerts a strong influence on surrounding areas, reinforcing patterns of spatial expansion and tourism-driven land use change in nearby localities such as Năvodari.
The recent development in Năvodari reflects the northward expansion of urbanization from Constanța, particularly from the adjacent resort of Mamaia, the most prominent seaside resort on the Romanian Black Sea coast.
Mamaia was developed extensively during the communist period as part of a state-led strategy to promote mass tourism [27]. Characterized by a dense concentration of hotels and recreational facilities built along a narrow strip between the Black Sea and Lake Siutghiol, Mamaia became a symbolic landscape of coastal tourism planning in socialist Romania. Its historical role as a central node in the national tourism network has continued to influence spatial development patterns in the region, particularly the recent expansion toward the northern areas.
As available land in Mamaia has become increasingly limited, new construction has shifted into nearby areas such as Mamaia Sat, Mamaia Nord, and Năvodari. Their proximity to Constanța and Mamaia has been a key driver of this expansion, positioning them as strategic locations for residential, commercial, and tourism-related development.
Coastal areas are particularly vulnerable to unsustainable urban growth as tourism and real estate investments often drive land use decisions based on short-term market demands rather than long-term spatial planning or environmental sustainability [28,29,30]. Năvodari ATU exemplifies this trend, having undergone rapid expansion in recent decades due to seasonal tourism and real estate development, leading to concerns over the loss of agricultural land and habitat fragmentation [31,32].
The development of tourism infrastructure in Năvodari, including the construction of hotels, guesthouses, and leisure facilities, has been closely tied to an increase in seasonal tourist flows, particularly during the summer months. A major turning point was the beach widening project carried out between 2014 and 2016, funded through both European and national sources. Initially aimed at protecting the coastline from erosion, the project significantly transformed the local landscape by expanding the beach from a narrow 25 m strip into a broader and more accessible area. This intervention not only enhanced the attractiveness of the area for tourists but also catalyzed a wave of real estate investment as developers and hotel owners capitalized on the improved coastline to stimulate residential and commercial expansion. The resulting growth has intensified pressure on local infrastructure and highlighted the need for sustainable spatial planning to manage tourism-driven urban development.
2.2. Data Used
The study methodology integrates multiple geospatial datasets spanning a total of 32 years, enabling a detailed examination of land use and land cover dynamics, with particular focus on the patterns, extent, and transformation of urban areas over time. This multi-source approach is widely adopted in previous research as it enhances the accuracy and reliability of change detection results [33]. Timeframes were adjusted based on data availability to ensure coverage of key periods of land use change, specifically between 1990 and 2022. This timespan encompasses Romania’s post-socialist transition period (1990–2003), the pre-European Union accession years (2003–2007), and the post-accession period (2007–present), all of which were marked by significant political, economic, and spatial transformations that shaped urban development patterns [23].
The study draws on geospatial products from the Copernicus Land Monitoring Service (CLMS), notably the CORINE Land Cover (CLC) and Urban Atlas datasets. Both offer consistent, multi-temporal information suitable for assessing land use dynamics and spatial growth patterns over time. In addition, the integration of Sentinel-2-derived spectral indices enhance the analysis by capturing biophysical transformations associated with urban growth. The Normalized Difference Vegetation Index (NDVI) is widely recognized for assessing vegetation cover and urban greenness, providing valuable insights into the ecological impacts of land conversion [34,35,36]. Complementarily, the Normalized Difference Built-up Index (NDBI) effectively detects and quantifies built-up surfaces, particularly in rapidly urbanizing areas [37,38], offering a spatially explicit understanding of the extent and intensity of urban expansion. Sentinel-2’s sensors are particularly well-suited for city and sub-city scale applications due to their high spatial and temporal resolution, making them ideal for monitoring localized urban dynamics and supporting city-level planning [2].
A detailed description of the datasets used is provided in Table 1.

Table 1.
Geospatial products and timeframes used in this study.
For the socio-economic analysis, multiple statistical datasets produced by the National Institute of Statistics (INS) [26] were employed to investigate the demographic and tourism-related drivers of land cover change in Năvodari. Population growth and building stock dynamics were examined spanning the period 1991–2022. To evaluate the tourism sector, data on accommodation capacity, expressed as bed counts, were analyzed for all lodging types from 1990 to 2024, with a more detailed focus on hotels, tourist villas, and apartment hotels during the interval 2010–2024. Furthermore, statistical records of tourist arrivals and overnight stays in Năvodari were assessed for the period 2001–2022.
2.3. Methods
This study employs a multi-source geospatial analytical framework designed to ensure both temporal continuity and thematic coherence in monitoring landscape transformation over time. Datasets were selected based on their availability and level of detail and were strategically combined to minimize temporal gaps and maximize spatial and analytical consistency across the study period.
The integration of these complementary sources enabled a continuous, multi-scalar assessment of urban development and LULC transformation processes. A detailed breakdown of the methodological approach is provided below:
- (a)
- Analysis of LULC conversions using CLC Level 3
To assess the specific nature of land cover transitions the study utilized Level 3 classes of the CLC dataset, which offer the most detailed thematic categorization. This granularity allowed for the precise identification of conversion patterns, such as the shift from agricultural to artificial surfaces. To facilitate interpretation, the structure of the Level 3 classification used in this analysis is detailed in Table 2, included in the Results Section 3.2 where the class codes are referenced directly. To visualize and quantify these transitions, Sankey diagrams were employed. These diagrams provide an intuitive representation of the magnitude and direction of change between land cover classes, highlighting dominant transformation pathways over time.
Table 2.
CLC Classification structure of analysis for LULC categories.
- (b)
- Assessment of area dynamics using CLC Level 2
In parallel, Level 2 of the CLC classification was employed to assess the dynamics of LULC areas. This more aggregated classification facilitated the identification of broader patterns of spatial expansion and contraction across major land categories. The specific class structure relevant to this level is presented in Table 2, which is positioned in the Results Section 3.2 to align with the corresponding findings.
- (c)
- Urban growth analysis using Urban Atlas (2012–2018)
For a more detailed understanding of urban evolution, especially at the city and sub-city scale, the Urban Atlas dataset was employed for the 2012–2018 period. The Level 2 classes of Urban Atlas provided enhanced spatial resolution and thematic detail for artificial surfaces, particularly in densely built-up and peri-urban areas, enabling a more nuanced assessment of urban land changes. The classification structure used for this analysis is outlined in Table 3, which is presented alongside the relevant results to allow readers to easily interpret the class codes discussed in the urban growth trends.
Table 3.
Urban Atlas classification structure of land use classes.
- (d)
- Spectral analysis using NDVI and NDBI (2015–2022)
To overcome the temporal limitation of the 2018 CLC dataset, the study employed the spectral indices NDVI and NDBI derived from Sentinel-2 imagery to analyze more recent land cover dynamics. Available since 2015, due to the launch of the Sentinel-2 mission, these indices allow for the biophysical monitoring of land surface changes through the detection of vegetation cover (NDVI) and built-up intensity (NDBI). NDVI facilitated the assessment of urban greenness and vegetation loss, while NDBI effectively captured the spatial extent and intensity of built-up area expansion.
- (e)
- Integration of socio-economic context
To better understand the driving forces behind the observed land cover changes, the geospatial data were analyzed alongside key socio-economic indicators, including population growth, tourism activity, and housing development. This comparative approach provided deeper contextual insights and enabled a more comprehensive interpretation of the landscape transformation processes within the study area. The relationship between urban growth and population dynamics was assessed using statistical data obtained from the INS [26]. To quantify population growth, the Compound Annual Growth Rate (CAGR) formula [39] (was applied as follows:
where
- -
- Vfinal is the final value,
- -
- Vinitial is the initial value,
- -
- n is the number of years.
3. Results
3.1. Land Use and Land Cover Class Conversions (CLC, 1990–2018)
This subsection presents the main land cover class conversions that occurred in Năvodari ATU between 1990 and 2018 based on CLC Level 3 data. The aim is to highlight key transformation patterns and assess the impact of urbanization on natural and agricultural areas.
In the analysis period (1990–2018), several land cover classes experienced conversions, while others underwent significant changes, including disappearance. In 1990 and 2000, the land in Năvodari ATU was classified into 18 distinct categories according to Level 3 of the CLC dataset, the most detailed level available. This number gradually declined, with 17 categories in 2006, and 15 in 2012 and 2018 (Figure 2). This section may be divided by subheadings. It should provide a concise and precise description of the experimental results, their interpretation, as well as the experimental conclusions that can be drawn.
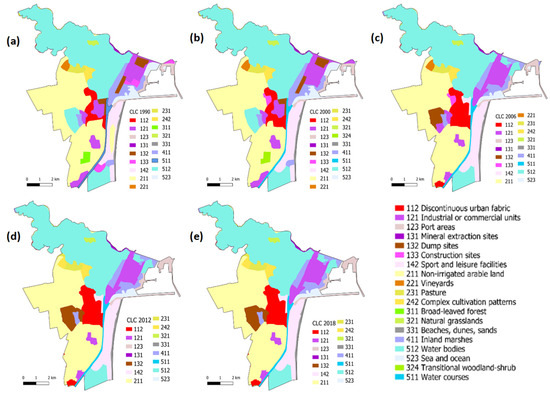
Figure 2.
CLC Level 3 data for Năvodari ATU: (a) 1990; (b) 2000; (c) 2006; (d) 2012; and (e) 2018.
A notable transformation observed during the study period is the complete disappearance of class 311 (Broad-leaved Forest), which was present in 1990 but no longer identified by 2000 (Figure 2). Concurrently, class 324 (Transitional woodland-shrub) emerged in 2000, despite its absence in the previous decade; however, this class was no longer recorded by 2006, suggesting a short-term land cover shift (Figure 2).
Further conversions occurred between 2006 and 2012 (Figure 2), including the disappearance of class 133 (Construction sites) and class 221 (Vineyards). The analysis of LULC transitions (Figure 3) reveals that, between 1990 and 2000, class 211 (Non-irrigated arable land) became the primary source of land for urban development. That land was converted into class 112 (Discontinuous urban fabric), class 133 (Construction sites), and class 131 (Mineral extraction sites) by 2000. This transition highlights the pivotal role of agricultural land in facilitating urban expansion and infrastructure development. In the subsequent 2000–2006 period, class 211 continued to contribute significantly to urban growth, with a notable portion transitioning into class 112 (Discontinuous urban fabric) (Figure 3).
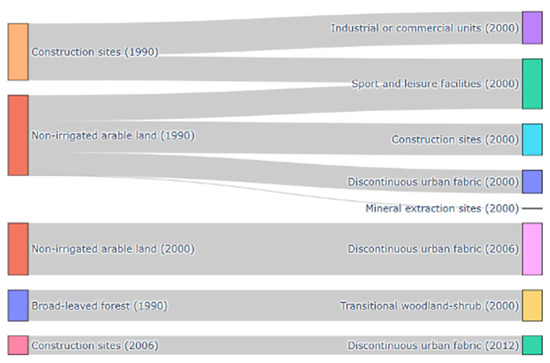
Figure 3.
Sankey diagram of CLC LULC class conversions in Năvodari ATU between 1990 and 2012.
It is noteworthy that, except for the conversion of Broad-leaved Forest (class 311) into Transitional woodland-shrub (class 324) between 1990 and 2000, all other observed transitions involved conversions to categories associated with artificial surfaces (Figure 2 and Figure 3). This pattern underscores the extensive impact of urbanization processes, where natural and agricultural land covers were progressively supplanted by urban and infrastructure-related land uses.
Furthermore, for the 2012–2018 period, the CLC changes dataset lacks transition data. Therefore, to fill this gap, further analysis will be conducted using the Urban Atlas dataset to assess the land use changes during this period.
3.2. Land Use and Land Cover Area Dynamics (CLC, 1990–2018)
This subsection examines the dynamics of land use and land cover areas in Năvodari ATU over the 1990–2018 period, based on aggregated CLC data. The analysis aims to provide an overview of spatial trends by quantifying the expansion or decline of major land categories, with a particular focus on artificial surfaces.
To enhance the accuracy of urban land use assessments, the analysis applies Level 2 of the CORINE Land Cover nomenclature exclusively to classes related to urban and artificial surfaces (Class 1). In contrast, broader land categories such as agriculture (Class 2), natural and semi-natural areas (Class 3), wetland (Class 4), and water bodies (Class 5) are examined at Level 1 (Tabel 2). This dual-level approach allows for a more detailed understanding of urban growth patterns, whilst ensuring analytical consistency across land cover types.
Between 1990 and 2006, artificial surfaces, particularly class 1.1 Urban fabric with an increase of 176 ha, class 1.2 Industrial, commercial, and transport units with an increase of 55 ha, and class 1.4 Artificial, non-agricultural vegetated areas with an increase of 170 ha, exhibited a consistent upward trend. In contrast, class 1.3 Mine, dump, and construction sites was the only artificial surface category to record a decline during this period, with a reduction of approximately 73 hectares (Figure 4).
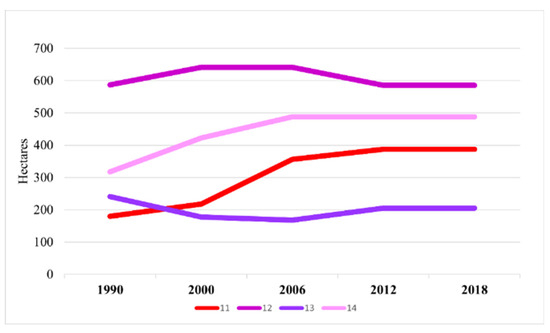
Figure 4.
Evolution of land cover classes based on CLC data: 1.1. urban fabric; 1.2. industrial, commercial, and transport units; 1.3. mine, dump, and construction sites; and 1.4. artificial, non-agricultural vegetated areas.
The spatial distribution of the identified trends showed that class 1.1 Urban fabric experienced continuous expansion within the built-up area of Năvodari city throughout the entire analysis period (Figure 5). Additionally, a new development area emerged in the southern part of the Năvodari ATU between 2000 and 2006. A similar pattern was observed for class 1.4 Artificial, non-agricultural vegetated areas which was predominantly concentrated along the coastal zone, corresponding to the areas of the Mamaia Nord and Mamaia Sat resorts.
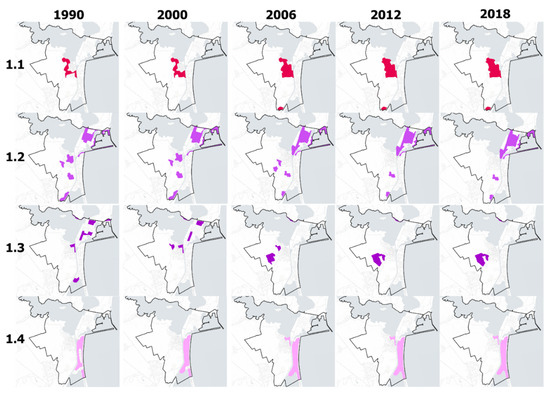
Figure 5.
Spatial distribution of artificial land cover classes based on CLC data: 1.1. urban fabric; 1.2. industrial, commercial, and transport units; 1.3. mine, dump, and construction sites; and 1.4. artificial, non-agricultural vegetated areas.
Simultaneously, significant decreases were observed in natural and semi-natural land cover categories: class 2 agricultural areas declined by approximately 82 hectares, while class 3 natural and semi-natural areas experienced a reduction of around 51 hectares. Water-related classes remained stable throughout the entire period (Figure 6).
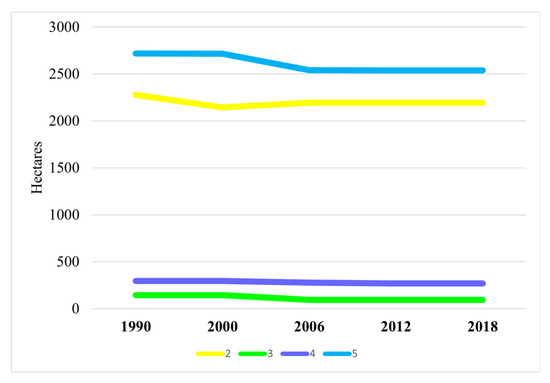
Figure 6.
Evolution of land cover classes based on CLC data: agricultural areas (class 2), natural and semi-natural areas (class 3), wetlands (class 4), and water bodies (class 5).
The spatial distribution of class 2 agricultural areas indicates a significant decrease of approximately 132 hectares between 1990 and 2000, primarily concentrated in the coastal area near Mamaia Sat, as well as along the southern and western outskirts of Năvodari city (Figure 7).
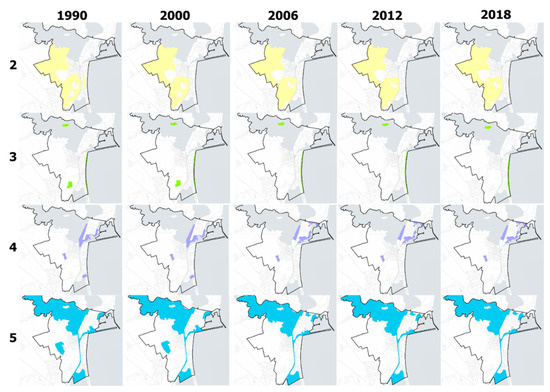
Figure 7.
Spatial distribution of artificial land cover classes based on CLC data: agricultural areas (class 2), natural and semi-natural areas (class 3), wetlands (class 4), and water bodies (class 5).
A notable observation is the lack of detected changes in land cover classes between 2012 and 2018, as reported by the CLC dataset. This stagnation suggests that CLC may not capture localized or finer-scale transformations within the study area during this period. The minimum mapping unit of 25 hectares and the thematic resolution of CLC likely contributed to the lack of detected changes, highlighting the need for supplementary datasets when monitoring urban dynamics at finer spatial scales. Similar findings have been reported by other researchers who have highlighted the uncertainties in the last two editions of CLC (2012, 2018) [40,41]. Consequently, Urban Atlas data will be used in subsequent analyses to address this limitation and provide a more detailed understanding of urban expansion.
3.3. Land Use and Land Cover Changes (Urban Atlas, 2012–2018)
The analysis of area changes was conducted using the Urban Atlas data classified as presented in Table 3.
According to Urban Atlas data between 2012 and 2018, classes 1.1, 1.2, and 1.3 exhibited upward trends, with 1.1 urban fabric showing a significant increase of approximately 103 hectares. In contrast, 2 agricultural areas experienced the most substantial decline, with a reduction of around 107 hectares. Similarly, 3 natural and semi-natural areas decreased by approximately 32.6 hectares. The class representing 1.2 industrial, commercial, and transport units recorded a spatial expansion of about 24 hectares, while 1.4 artificial, non-agricultural vegetated areas declined by 4.5 hectares. These changes underscore the intensifying anthropogenic pressure on agricultural land and natural ecosystems, mirroring broader urbanization patterns within the study area (Figure 8).
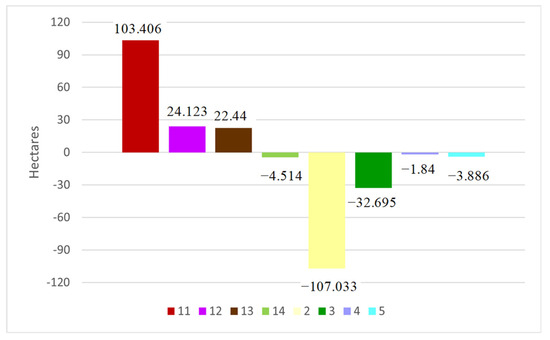
Figure 8.
Evolution of Urban Atlas level 2 classes between 2012 and 2018.
Figure 9A,B shows that the most significant changes occurred along the coastal region, where 1.1 urban fabric class expanded by replacing class 3 natural and semi-natural areas. Simultaneously, the city of Năvodari experienced an extension of 1.1 urban fabric land primarily at the expense of agricultural land.
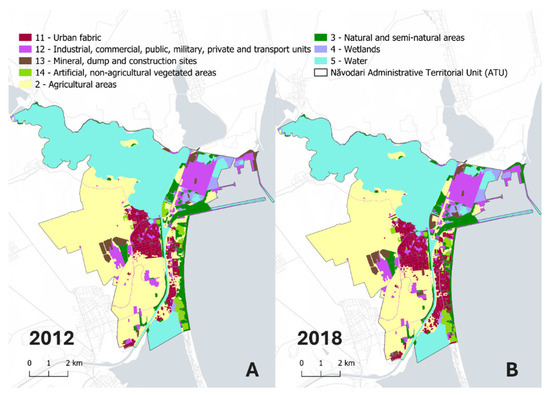
Figure 9.
Land use patterns in Năvodari ATU based on Urban Atlas data: (A) 2012; and (B) 2018.
Figure 10 illustrates the spatial development of the urban fabric class between 2012 and 2018. The included Figure 10A–J shows high-resolution Google Earth imagery of specific locations where land cover changes occurred, highlighting the expansion of built-up areas and the reduction in green or undeveloped spaces over time.
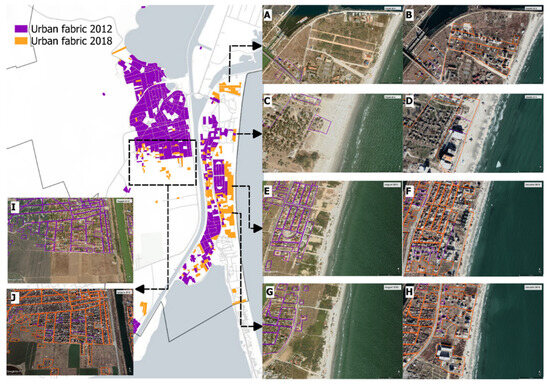
Figure 10.
Urban fabric class in 2012 and 2018 with corresponding changes illustrated using Google Earth imagery. (A) Mamaia Nord, 2012; (B) Mamaia Nord, 2018; (C) central area of Mamaia Nord, 2012; (D) central area of Mamaia Nord, 2018; (E) Mamaia Sat, 2012; (F) Mamaia Sat, 2018; (G) southern area of Mamaia Sat, 2012; (H) southern area of Mamaia Sat, 2018; (I) southern part of Năvodari city, 2012; (J) southern part of Năvodari city, 2018.
Figure 10A,B depicts the evolution of approximately 10 hectares of 1.1 urban fabric class. Of this total, 4.9 hectares were converted from class 2 agricultural areas, while 5.1 hectares originated from class 3 natural and semi-natural areas. Figure 10C,D reflects new construction in the Năvodari beach area, resulting in the conversion of approximately 2 hectares into class 1.1 urban fabric. This included 0.6 hectares transformed from 1.3 mineral extraction sites, dumps, and construction sites class, and approximately 1.4 hectares from class 3 natural and semi-natural areas. Figure 10E,F illustrates changes in the central area of the Mamaia Sat tourist resort, where the 1.1 urban fabric class expanded by approximately 25 hectares. This expansion occurred primarily at the expense of class 3 natural and semi-natural areas (10.6 hectares) and 2 agricultural areas (14.4 hectares). Figure 10G,H highlights the expansion of approximately 23 hectares of 1.1 urban fabric class in the southern part of Mamaia Sat. This development resulted from the conversion of 14.2 hectares of class 2 agricultural areas and 8.8 hectares of 3 natural and semi-natural areas. Figure 10I,J shows urban land changes in the southern part of Năvodari city, where the class 1.1 urban fabric expanded by approximately 9.8 hectares. This growth was primarily driven by the conversion of agricultural land.
Despite the limited time-frame covered by the Urban Atlas data, the dataset enabled a detailed assessment of urban expansion. The findings revealed a total increase of approximately 103 hectares in urban fabric, primarily resulting from the conversion of agricultural land, non-agricultural green spaces, and natural and semi-natural areas. The spatial distribution of these changes indicates that most new developments were concentrated in the tourist zones of Mamaia Sat and Mamaia Nord, with substantial conversions of agricultural land into built-up areas occurring near the city of Năvodari.
3.4. Remote Sensing Spectral Indices Analysis (2015–2022)
The NDVI and NDBI maps (Figure 11 and Figure 12) illustrate the spatiotemporal patterns of land cover change, highlighting the decline in vegetated surfaces and the expansion of built-up areas.
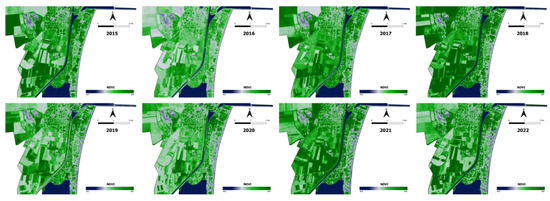
Figure 11.
NDVI maps of the Năvodari ATU for the period 2015–2022.
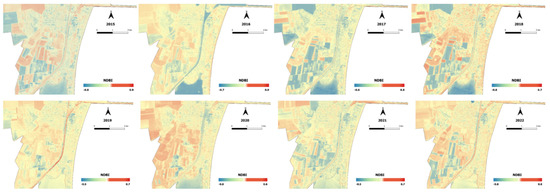
Figure 12.
NDBI maps of the Năvodari ATU for the period 2015–2022.
Emphasis is placed on the coastal region due to the significant transformations in urban land use revealed by the Urban Atlas dataset. This focus guided the selection of five representative locations within this hotspot to capture the diversity of land cover transitions and to illustrate typical patterns of urban growth, supporting a more detailed temporal analysis (Figure 13a,b).
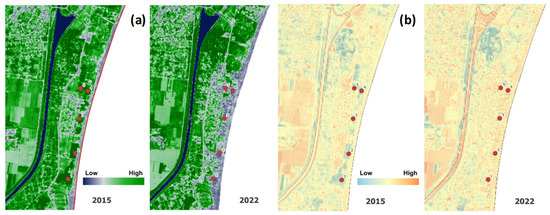
Figure 13.
Five sample points selected within Năvodari ATU for analyzing the evolution of (a) NDVI (2015–2022) and (b) NDBI (2015–2022) values, calculated from Sentinel-2 imagery.
NDVI and NDBI values were extracted annually for each location over the 2015–2022 period, to evaluate changes in vegetation cover and the increase in built-up surfaces. Figure 14 presents the evolution of these values, with the X-axis showing the years of analysis and the Y-axis displaying values ranging from −1 to 1.
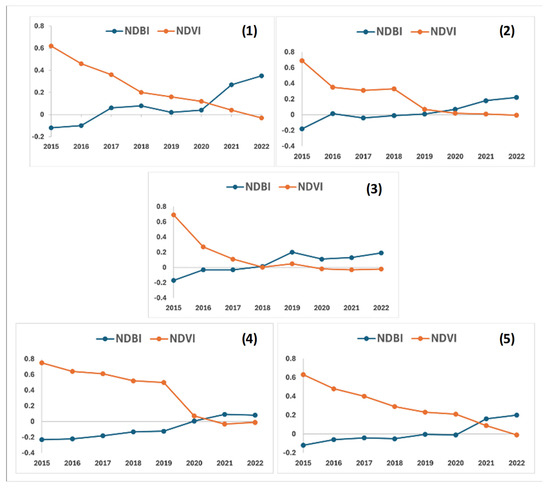
Figure 14.
Five sample points for analyzing the evolution of NDVI and NDBI values.
At all five locations, NDVI values in 2015 were relatively high (0.65–0.75), indicating the presence of healthy vegetation. Throughout the study period, these values steadily declined, reaching near-zero by 2019, reflecting significant vegetation loss and a shift toward non-vegetated surfaces such as bare soil or built-up areas. This downward trend continued in the final years of analysis, consistent with ongoing urban expansion and surface sealing. Simultaneously, NDBI values, which indicate built-up land intensity, exhibit an upward trend, particularly in conjunction with the decline in NDVI values. Positive NDBI values correspond to increased urbanization and the expansion of built-up areas, while negative values are associated with non-urban landscapes [42]. In 2015, NDBI values for the five analyzed points ranged from −0.12 to −0.23, reflecting predominantly non-urban areas with minimal built-up structures. Over time, these values steadily increased, reaching a range of 0.19 to 0.35 by 2022, signaling a clear shift toward urbanization.
The progression of urbanization over the study period is evident in the simultaneous decline of NDVI values and the increase in NDBI values, indicative of a shift toward intensified construction and infrastructure development. This inverse relationship reflects a link between vegetation loss and urbanization, as evidenced by the progressive replacement of green areas with bare soil and impervious surfaces.
The point of convergence of NDVI and NDBI values around the sixth year of analysis (2020) marks a critical turning point, indicating a phase in which built-up surfaces surpass vegetation in spatial extent, reflecting the completion of significant land conversion processes. Following this intersection NDVI values remain consistently low while NDBI either stabilizes or exhibits a marginal increase, indicating that urbanization has reached a more stable phase with limited prospects for vegetation recovery.
This pattern underscores the environmental implications of urban expansion, including potential secondary effects such as increased surface temperatures [43,44] and habitat fragmentation [45,46]. Understanding this transition is crucial for evaluating the long-term sustainability of urban growth and emphasizing the importance of green space preservation in rapidly developing areas.
3.5. Socio-Economic Analysis
This section explores the socio-economic dimensions of urban expansion and landscape transformation in the Năvodari ATU, Romania. Drawing on more than three decades of geospatial analysis, the results reveal a rapid and spatially uneven pattern of land cover change, particularly in coastal areas, driven largely by tourism pressures and speculative real estate development. These transformations extend beyond the physical landscape, generating significant socio-ecological impacts that influence the functionality, identity, and long-term sustainability of the area. We focus here on the broader consequences of these changes, especially the challenges they pose to sustainable spatial planning and the strategies needed to guide future development. A particularly striking finding is the mismatch between modest population growth and the accelerated expansion of the built-up area, highlighting the depth of socio-ecological change occurring in Năvodari.
Over the years, the population has shown a consistent upward trend, increasing from 30,587 in 1992 to 43,303 in 2023, representing a growth of approximately 41%. Concurrently, the number of residential buildings underwent substantial expansion, rising from 9021 in 1992 to 25,551 in 2022, nearly tripling over the 30-year period with an increase of 16,530 units (Figure 15).
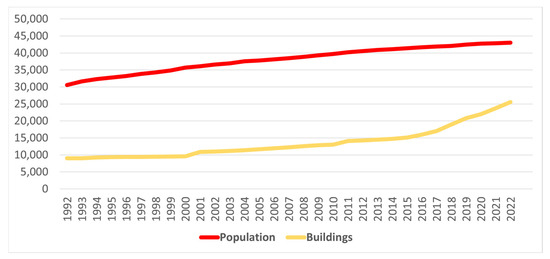
Figure 15.
Population growth and building number evolution in Năvodari.
Both population and the number of residential buildings experienced significant expansion between 1992 and 2022, although at different rates.
The population grew at an average annual rate of 1.15%, indicating steady demographic expansion. In contrast, the number of residential buildings increased at a notably higher average annual rate of 3.53% during the same period. This discrepancy highlights the rapid acceleration of urban expansion and infrastructure development, indicating that factors beyond population growth, such as tourism, real estate development, and industrial activities, may be significant drivers of this trend, particularly in coastal cities [47,48,49]. The observed imbalance raises critical concerns for urban planning, particularly regarding the alignment of housing supply with market demand, and points to the need for more comprehensive strategies to address the growing urban infrastructure.
The compound annual growth rate reveals that the number of residential buildings has increased considerably faster than the resident population, indicating that urban development may be influenced by speculative real estate investment and tourism-driven demand rather than demographic needs. This divergence raises concerns about inefficient land consumption and unsustainable urban sprawl, which can increase pressure on infrastructure, natural resources, and ecosystem services.
Compared to the European average of 450–500 dwellings per 1000 inhabitants, the Năvodari ATU exhibited an estimated dwelling density of approximately 591 units per 1000 inhabitants in 2022, surpassing the continental benchmark and reflecting a tourism-driven and speculative real estate development pattern. This intense pressure from tourism and real estate investment has induced substantial transformations in the area, characterized by the proliferation of permanent residences, holiday homes, hotels, and restaurants. These developments have altered both land use patterns and the visual and functional identity of the resort. A sociological survey conducted on-site revealed that nearly half of the tourists (48.9%) identified the chaotic urban landscape as the principal concern, followed by traffic congestion (43%) and inadequately maintained green spaces (32%). These results underscore the imperative to revise existing urban planning regulations to support sustainable development and to establish a coherent, aesthetically pleasing, and functional urban environment [50].
4. Discussion
The results of this study underscore the dynamic nature of the landscape in the Năvodari ATU, where transitions involving agricultural and natural land into construction sites have been central to processes of urban expansion and densification. These patterns mirror broader regional trends in land transformation and underscore the urgency of strategic planning.
Land cover transitions derived from the CLC dataset reveal that the period between 1990 and 2003 was particularly dynamic in terms of land use conversions, reflecting the broader socio-economic transformation following Romania’s shift from a centralized regime to a market-oriented economy. This period was marked by substantial socio-political and institutional shifts that restructured land ownership and land use patterns nationwide. This socio-political transformation significantly reshaped land use dynamics throughout Romania [19,20,21,23,51,52,53]. In Năvodari, all transitions followed a unidirectional trajectory, from non-urban to urban land uses, with no reversals observed. This consistent conversion of agricultural and natural land into urban areas reflects the expansionist logic of post-socialist development, often lacking long-term environmental or spatial planning considerations.
However, the ability to detect such dynamics is influenced by the spatial and thematic resolution of the datasets employed. The absence of visible change in CLC data between 2012 and 2018, despite ongoing construction and land use conversion on the ground, points to a key limitation: the dataset’s minimum mapping unit (5 ha for changes, 25 ha for land cover) is insufficient to capture localized transformations typical of tourism-led urban growth. This aligns with previous findings suggesting the CLC’s reduced sensitivity in urban contexts, particularly in peripheral and tourism-intensive zones [41,54].
In contrast, the Urban Atlas dataset provided a more nuanced picture of urban expansion, capturing a significant increase in artificial surfaces, particularly in Mamaia Sat and Mamaia Nord (Figure 1). These areas, previously dominated by agricultural and semi-natural land cover, have experienced rapid urbanization in recent years, driven largely by tourism infrastructure and speculative development. The spatial trajectory of these changes emphasizes a pattern of low-density sprawl, often disconnected from formal planning mechanisms and increasingly encroaching on ecologically valuable land.
Complementary analyses using spectral indices further confirmed the ecological consequences of these transitions. NDVI values showed a consistent decline from 2015 to 2022, indicating vegetation loss, while NDBI values increased, reflecting an intensification of built-up surfaces. Notably, no signs of vegetation recovery were observed during the period, pointing to a permanent alteration of land cover and a diminishing capacity for urban ecological regulation. These findings raise broader concerns about the degradation of green infrastructure, loss of ecosystem services, and the resilience of coastal urban systems in the face of rapid land use change.
These landscape transformations have not gone unnoticed by local civil society. Several non-governmental organizations (NGOs) and civic groups, including “Salvăm Mamaia Sat,” “Constanta Altfel,” and “Verde Urban,” have raised concerns about the pace and nature of urban development, particularly its impact on coastal ecosystems, public access to beaches, and the potential weakening of spatial planning regulations. The rapid urbanization and extensive hotel construction in Năvodari have sparked significant socio-ecological concerns as the accelerated development continues to alter both the landscape and the quality of life for residents and visitors alike. These NGOs have specifically pointed out key issues such as the reduction in public spaces, the encroachment of buildings near beaches that obstruct sunlight and limit access, and the lack of adequate green areas [55,56].
Additionally, NGOs have raised concerns over the disregard for building height regulations and the absence of essential services, such as paved roads and public lighting. These problems underscore the tension between the rapid economic growth fueled by tourism and the long-term sustainability of urban ecosystems. As urban sprawl encroaches upon sensitive coastal environments, the increasing pressure on local ecosystems, coupled with poor spatial planning, undermines the region’s ecological balance, leading to a cycle of environmental degradation and growing social discontent.
While population growth is commonly cited as a major driver of urban expansion, it does not fully account for the land use changes observed in the study area. In the case of Năvodari ATU, seasonal tourism and the associated infrastructure development play a key role in shaping urban dynamics, especially in coastal and peri-urban zones.
The evolution of accommodation capacity in Năvodari between 1990 and 2024 reveals a complex, non-linear trend shaped by broader socio-economic dynamics. The 1990s were marked by fluctuating values and an overall slight decline, from 10,883 places in 1991 to 7837 in 2000, reflecting the instability of the post-communist transition period. A sharp increase occurred in 2001, when capacity jumped to 12,383, suggesting early investments in the tourism sector. However, this was followed by a gradual decline, with the number decreasing to 10,527 in 2008 and 10,287 in 2009, culminating in a sharp contraction in 2011, when capacity dropped to just 4411 places, reflecting the effects of the global financial crisis (Figure 16a).
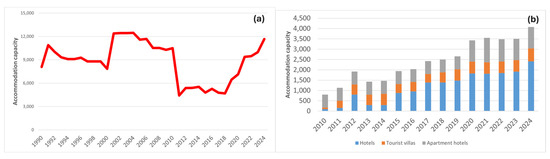
Figure 16.
(a) Accommodation capacity (all types of lodging) based on bed count, and (b) accommodation capacity for hotels, tourist villas, and apartment hotels based on bed count.
From 2011 onward, a slow recovery began, turning into a steady and then accelerated growth. Notably, accommodation capacity increased from 4777 in 2017 to 11,671 in 2024, more than doubling in just seven years. This surge appears to align with key institutional developments, particularly the official designation of Mamaia Sat (administratively part of Năvodari) as a national tourist resort in March 2018. This milestone likely acted as a catalyst for renewed investment and intensified development in the area, contributing to the significant expansion of accommodation infrastructure observed in recent years (Figure 16a).
A breakdown of accommodation capacity by type of facility for the period 2010–2024 offers additional insight into the structural dynamics of tourism development in Năvodari. In line with national tourism classifications, these categories differ in terms of both design and function: hotels offer fully equipped rooms or apartments alongside reception and food service facilities; tourist villas are smaller-capacity, stand-alone buildings with distinct architectural features located in touristic areas; and apartment hotels consist of suites or studios equipped for food storage, preparation, and in-room dining [26].
Hotels have seen the most notable expansion, growing from just 96 units in 2010 to 2413 in 2024, an almost 25-fold increase that highlights the rising demand for higher-standard lodging. Tourist villas also experienced moderate growth, from 78 sites in 2010 to 627 in 2024, with some fluctuations, particularly a decline between 2014 and 2017. Apartment hotels maintained a stable capacity of 624 units between 2010 and 2019, followed by a sharp increase to 1036 in 2020 and a peak of 1188 in 2021, before stabilizing again at 1036 in 2024.
These patterns indicate a diversification of the accommodation offer, with a particular emphasis on hotel infrastructure (Figure 16b) [19].
These structural developments in accommodation types are reflected in the increasing use of tourism infrastructure. The number of tourist arrivals (Figure 17a) and overnight stays (Figure 17b) in Năvodari followed similar trajectories, both showing consistent and significant growth starting from 2010. Tourist arrivals rose from approximately 10,093 in 2010 to a peak of 134,054 in 2021, while the number of overnight stays climbed from 21,805 in 2010 to over 454,000 in the same year. This growth trend illustrates a marked intensification in the utilization of local accommodation facilities, aligning with the broader expansion observed in hotel and apartment infrastructure. The sustained increase, particularly after 2018, reinforces the assumption that the designation of Mamaia Sat as a national tourist resort may have acted as a catalyst, stimulating both demand and investment in the area’s tourism services.
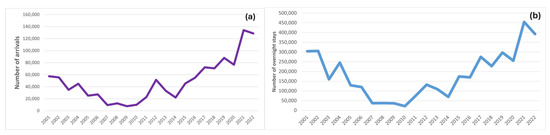
Figure 17.
Statistical data for the (a) number of tourist arrivals and (b) number of overnight stays in Năvodari during the period 2001 and 2022.
Overall, the upward trends in accommodation capacity, tourist arrivals, and overnight stays provide compelling evidence for the growing significance of tourism in Năvodari’s local economy. These dynamics not only justify the continued development of tourism-related infrastructure but also explain the spatial expansion of built-up areas in recent years. The sustained demand for lodging and services reinforces the need for additional facilities while placing increasing pressure on land resources, accelerating the conversion of formerly undeveloped or agricultural zones into urbanized spaces.
The alignment of these indicators reflects a significant increase in the utilization of tourism infrastructure and highlights the growing popularity of the region as a destination. Notably, the designation of Mamaia Sat as a national tourist resort in 2018 appears to have played a role in boosting demand. Furthermore, many newly built apartments and houses in the area function as secondary residences, owned by individuals from cities like Bucharest and used primarily during the summer season. This phenomenon may inflate perceived housing demand and impose additional seasonal strain on urban infrastructure.
The ongoing development of tourism infrastructure and the spatial expansion of built-up areas in Năvodari are driven by the growing tourist influx, as evidenced by the significant increase in hotel constructions and other accommodation facilities. This expansion has notably enhanced the region’s capacity to host visitors, with a marked rise in tourist arrivals and overnight stays in recent years. However, these trends also highlight the pronounced seasonality of the local economy, which places additional pressure on local resources and infrastructure, reinforcing the need for integrated planning strategies that address both permanent and temporary population pressures.
Together, these findings reveal the intricate dynamics of urbanization in coastal areas, where economic incentives and environmental trade-offs jointly shape the evolving urban fabric. The observed imbalance, marked by rising demand and infrastructure expansion alongside green space loss, raises critical concerns about the long-term sustainability of urban growth. In particular, the risk of underutilized or poorly integrated infrastructure highlights the potential for inefficient land use and unsustainable development patterns. These issues are in line with the objectives of SDG 11.3, which calls for more inclusive, safe, resilient, and sustainable cities. Within this framework, the observed decline in vegetated surfaces is not solely an environmental concern but a fundamental challenge for urban planning. It underscores the urgent need to integrate green infrastructure, nature-based solutions, and ecological resilience into planning practices to ensure balanced and adaptive urban development [24].
The expansion of urban areas in Năvodari not only reflects shifting land use patterns but also poses challenges to ecological integrity and the cultural landscape identity of the coastal zone. These dynamics underscore the need for integrated planning approaches that reconcile tourism-driven growth with long-term landscape sustainability.
The results of the geospatial analysis offer valuable contributions to urban landscape planning by providing a nuanced understanding not only of the overall expansion trends but also of the specific locations where transformations have occurred and the land use classes affected. Such insights are essential for designing targeted and sustainable planning interventions. For example, identifying the conversion of green spaces or agricultural land into built-up areas enables planners to prioritize the conservation of ecological corridors, reintroduce green spaces in densely developed zones, or integrate green infrastructure in new urban developments. By providing both spatial and thematic clarity, EO-based LULC assessments serve as valuable tools in guiding more sustainable urban growth and in supporting the goals of SDG 11.3, which advocates for inclusive, safe, resilient, and sustainable cities.
Challenges and Outlook
Despite the significant potential of EO technologies in monitoring urban dynamics, there remains a considerable gap in applying these insights to local-level planning and decision-making. Many local governments face challenges such as limited technical capacity, insufficient trained personnel, or lack of financial resources to invest in EO technologies. Additionally, there is often skepticism about the value these technologies can bring to urban planning and decision-making processes. This disconnect between research findings and their practical implementation hinders the operational impact of EO-based knowledge in addressing urban challenges. The United Nations has acknowledged this issue, noting the absence of indicators and concrete initiatives related to urban remote sensing within the Sustainable Development Goals framework, particularly under SDG 11 [24]. Bridging this gap is crucial for enabling evidence-based urban planning and fostering informed decisions that support sustainable development [57].
A positive example of integrating EO into local decision-making is the Municipality of Thessaloniki, which has adopted the “Thessaloniki 2030 Resilience Strategy.” This strategy incorporates the monitoring of geospatial key performance indicators within a GIS framework, directly aligning with SDG 11.3. By collaborating with local stakeholders, civil society, and other actors in the urban ecosystem, Thessaloniki demonstrates how EO and geospatial technologies can be utilized to support sustainable urban governance and guide future planning decisions [58].
5. Conclusions
Building on these global examples of effective integration of EO tools in urban governance, our study contributes to the broader discourse on landscape change by offering empirical evidence on the spatial dynamics of urban expansion and vegetation loss in Năvodari ATU. In particular, the study highlights the critical role that EO technologies can play in monitoring and managing urban growth, while also acknowledging the challenges of their practical application. It emphasizes both the potential and the limitations of these technologies in monitoring urban dynamics and associated landscape changes. The study also reveals a persistent gap between scientific analysis and its practical application in local-level decision-making. Bridging this gap remains a critical challenge for future urban planning, particularly for ensuring that sustainable and context-sensitive development strategies are effectively implemented.
Despite inherent limitations, the geospatial datasets employed have proven effective for monitoring urban dynamics at the city level, offering critical insights into the pace and direction of change. This analysis calls for a more balanced approach to urban development, one that integrates long-term sustainability planning, anticipatory land use strategies, and environmental monitoring through EO tools, in order to preserve ecological integrity while promoting socio-economic equity. As urbanization advances, municipalities must prioritize sustainable land use practices and embed EO tools into governance structures to support data-driven planning. Strengthening the institutional capacity for EO integration will be essential for making informed decisions, ensuring resilient urban growth, and aligning local development pathways with global sustainability goals.
By integrating multisource geospatial datasets, EO has proven to be a powerful tool for monitoring land use and land cover changes at the local level, including in urban areas such as Năvodari, Mamaia Sat, and Mamaia Nord. It enables the identification of urbanization trends and their impact on vegetation degradation, offering valuable insights for sustainable urban planning. These capabilities highlight EO’s essential role in supporting data-driven strategies aligned with SDG 11.3, which advocates for inclusive, safe, resilient, and sustainable cities.
In addition to the expected patterns of built-up expansion driven by tourism-related development, the spatial analysis revealed localized anomalies, such as scattered construction zones outside designated urban areas, suggesting informal development or weak enforcement of planning regulations. These findings highlight the need for stronger institutional oversight and better alignment between land use policies and environmental objectives.
Moreover, beyond these expected dynamics, the findings point to deeper governance tensions. Field observations and public discourse suggest a growing gap between urban planning objectives and actual land use practices, particularly in rapidly transforming coastal areas such as Mamaia Sat and Mamaia Nord. Civic organizations, including Salvăm Mamaia Sat, Constanța Altfel, and Verde Urban, have raised concerns about unregulated construction, restricted public beach access, and insufficient enforcement of zoning and building codes. These conflicts reveal a fragmented planning system, where short-term economic pressures often override environmental safeguards and community interests. Acknowledging and addressing such mismatches is essential for developing integrated planning frameworks that reconcile growth with ecological sustainability. In this regard, EO can support transparent, real-time monitoring and foster accountability and coordination across multiple levels of governance.
Author Contributions
C.-E.M.: Conceptualization, methodology, formal analysis, investigation, writing—original draft preparation, writing—review and editing, and validation, M.D.: writing—original draft preparation, writing—review and editing, and supervision. All authors have read and agreed to the published version of the manuscript.
Funding
This research benefited from funding from the Romanian Academy, the Institute of Geography.
Data Availability Statement
Upon request.
Conflicts of Interest
The authors declare no conflicts of interest.
References
- World Bank Group. Urban Development; World Bank Group: Washington, DC, USA, 2024; Available online: https://www.worldbank.org/en/topic/urbandevelopment (accessed on 28 August 2024).
- European Space Agency. Compendium of Earth Observation contributions to the SDG Targets and Indicators; European Space Agency: Paris, France, 2020; Available online: https://eo4society.esa.int/wp-content/uploads/2021/01/EO_Compendium-for-SDGs.pdf (accessed on 3 February 2025).
- Liu, Y.; Yue, W.; Fan, P. Spatial determinants of urban land conversion in large Chinese cities: A case of Hangzhou. Environ. Plan. B Plan. Des. 2011, 38, 706–725. [Google Scholar] [CrossRef]
- de Bruin, S.; Holleman, C. Urbanization is transforming agrifood systems across the rural–urban continuum creating challenges and opportunities to access affordable healthy diets. In FAO Agricultural Development Economics Working Paper; (Series No. 23-08); FAO: Rome, Italy, 2023. [Google Scholar] [CrossRef]
- Wan, M.; Han, Y.; Song, Y.; Hashimoto, S. Estimating and projecting the effects of urbanization on the forest habitat quality in a highly urbanized area. Urban For. Urban Green. 2024, 94, 128270. [Google Scholar] [CrossRef]
- United Nations. Transforming Our World: The 2030 Agenda for Sustainable Development; United Nations: New York, NY, USA, 2015; Available online: https://sdgs.un.org/2030agenda (accessed on 2 March 2025).
- UN-Habitat. The New Urban Agenda; UN-Habitat: Nairobi, Kenya, 2020; Available online: https://unhabitat.org/the-new-urban-agenda-illustrated (accessed on 7 March 2025).
- Fraisl, D.; Campbell, J.; See, L.; Wehn, U.; Wardlaw, J.; Gold, M.; Moorthy, I.; Arias, R.; Piera, J.; Oliver, J.L.; et al. Mapping citizen science contributions to the UN sustainable development goals. Sustain. Sci. 2020, 15, 1735–1751. [Google Scholar] [CrossRef]
- Lehmann, A.; Mazzetti, P.; Santoro, M.; Nativi, S.; Masò, J.; Serral, I.; Spengler, D.; Niamir, A.; Lacroix, P.; Ambrosone, M.; et al. Essential earth observation variables for high-level multi-scale indicators and policies. Environ. Sci. Policy 2022, 131, 105–117. [Google Scholar] [CrossRef]
- Anderson, K.; Ryan, B.; Sonntag, W.; Kavvada, A.; Friedl, L. Earth observation in service of the 2030 Agenda for Sustainable Development. Geo-Spat. Inf. Sci. 2017, 20, 77–96. [Google Scholar] [CrossRef]
- Andries, A.; Morse, S.; Murphy, R.; Lynch, J.; Woolliams, E.; Fonweban, J. Translation of Earth observation data into sustainable development indicators: An analytical framework. Sustain. Dev. 2019, 27, 366–376. [Google Scholar] [CrossRef]
- Scott, G.; Rajabifard, A. Sustainable development and geospatial information: A strategic framework for integrating a global policy agenda into national geospatial capabilities. Geo-Spat. Inf. Sci. 2017, 20, 59–76. [Google Scholar] [CrossRef]
- Group on Earth Observations. EO4SDG: Earth Observations in Service of the 2030 Agenda for Sustainable Development—Strategic Implementation Plan 2023–2025; Group on Earth Observations: Geneva, Switzerland, 2025; Available online: https://eo4sdg.org/get-more-information/strategic-implementation-plan/ (accessed on 13 February 2025).
- EO4SDG. Earth Observations Toolkit for Sustainable Cities and Human Settlements: Overview and Progress to Date; 2021. Available online: https://eo4sdg.org/wp-content/uploads/2021/03/EO-Toolkit-Overview-Document.pdf (accessed on 7 February 2025).
- Sachs, J.D.; Lafortune, G.; Fuller, G. Sustainable Development Report 2024; 2024. Available online: https://dashboards.sdgindex.org/ (accessed on 20 February 2025).
- Pirrone, N.; Mazzetti, P.; Cinnirella, S.; Athanasopoulou, E.; Gerasopoulos, E.; Klánová, J.; Lehmann, A.; Pau, J.M.; Petäjä, T.; Pokorný, L.; et al. The science-policy interfaces of the European network for observing our changing planet: From Earth Observation data to policy-oriented decisions. Environ. Sci. Policy 2022, 137, 359–372. [Google Scholar] [CrossRef]
- Gerasopoulos, E.; Bailey, J.; Athanasopoulou, E.; Speyer, O.; Kocman, D.; Raudner, A.; Tsouni, A.; Kontoes, H.; Johansson, C.; Georgiadis, C.; et al. Earth observation: An integral part of a smart and sustainable city. Environ. Sci. Policy 2022, 132, 296–307. [Google Scholar] [CrossRef]
- Cieślak, I.; Biłozor, A.; Szuniewicz, K. The Use of the CORINE Land Cover (CLC) Database for Analyzing Urban Sprawl. Remote Sens. 2020, 12, 282. [Google Scholar] [CrossRef]
- Grigorescu, I.; Kucsicsa, G.; Popovici, E.-A.; Mitrică, B.; Mocanu, I.; Dumitraşcu, M. Modelling land use/cover change to assess future urban sprawl in Romania. Geocarto Int. 2019, 36, 721–739. [Google Scholar] [CrossRef]
- Kucsicsa, G.; Popovici, E.A.; Bălteanu, D.; Grigorescu, I.; Dumitraşcu, M.; Mitrică, B. Future land use/cover changes in Romania: Regional simulations based on CLUE-S model and CORINE land cover database. Landsc. Ecol. Eng. 2019, 15, 75–90. [Google Scholar] [CrossRef]
- Popovici, E.A.; Bălteanu, D.; Kucsicsa, G. Assessment of changes in land-use and land-cover pattern in Romania using Corine Land Cover Database. Carpathian J. Earth Environ. Sci. 2013, 8, 195–208. [Google Scholar]
- Wellmann, T.; Lausch, A.; Andersson, E.; Knapp, S.; Cortinovis, C.; Jache, J.; Scheuer, S.; Kremer, P.; Mascarenhas, A.; Kraemer, R.; et al. Remote sensing in urban planning: Contributions towards ecologically sound policies? Landsc. Urban Plan. 2020, 204, 103921. [Google Scholar] [CrossRef]
- Grigorescu, I.; Mitricǎ, B.; Kucsicsa, G.; Popovici, E.A.; Dumitraşcu, M.; Cuculici, R. Post-communist land use changes related to urban sprawl in the Romanian metropolitan areas. Hum. Geogr. 2012, 6, 35–46. [Google Scholar] [CrossRef]
- United Nations Department of Economic and Social Affairs. SDG Goal 11: Make cities and Human Settlements Inclusive, Safe, Resilient and Sustainable; 2025. Available online: https://sdgs.un.org/goals/goal11 (accessed on 23 April 2025).
- Primăria Năvodari. Năvodari—Oraș Turistic! 2018. Available online: https://primaria-navodari.ro/navodari-oras-turistic/#1499276816536-2831d76f-d78f (accessed on 4 January 2025).
- INS. Direcţia Judeţeană de Statistică Constanţa. 2025. Available online: https://constanta.insse.ro/ (accessed on 4 January 2025).
- Berbecaru, I.; Botez, M. Teoria și Practica Amenajării Turistice; Editura Sport-Turism: Bucharest, Romania, 1977. [Google Scholar]
- Buckley, R. Sustainable tourism: Research and reality. Ann. Tour. Res. 2012, 39, 528–546. [Google Scholar] [CrossRef]
- Petrişor, A.-I.; Hamma, W.; Nguyen, H.D.; Randazzo, G.; Muzirafuti, A.; Stan, M.-I.; Tran, V.T.; Aştefănoaiei, R.; Bui, Q.-T.; Vintilă, D.-F.; et al. Degradation of Coastlines under the Pressure of Urbanization and Tourism: Evidence on the Change of Land Systems from Europe, Asia and Africa. Land 2020, 9, 275. [Google Scholar] [CrossRef]
- Smith, T.F.; Elrick-Barr, C.E.; Thomsen, D.C.; Celliers, L.; Le Tissier, M. Impacts of Tourism on Coastal Areas. Camb. Prism. Coast. Futures 2023, 1, e5. [Google Scholar] [CrossRef]
- Plesoianu, D. Current situation of the environement in the Midia-Navodari area. J. Environ. Prot. Ecol. 2011, 12, 1–6. [Google Scholar]
- Dodu, S.; Patrichi, I.; Firoiu, D. Globalization in the tourism industry and its impact on travel destinations. Case study of undeveloped beaches on the Romanian Black Sea coast. Strategica. Oppor. Risks Contemp. Bus. Environ. 2016, 1, 96–110. [Google Scholar]
- Jenerowicz, A.; Bielecka, E. Urban Growth Monitoring—Remote Sensing Methods for Sustainable Development. The International Archives of the Photogrammetry. Remote Sens. Spat. Inf. Sci. 2022, XLIII-B3-2022, 107–112. [Google Scholar] [CrossRef]
- Jimenez, R.B.; Lane, K.J.; Hutyra, L.R.; Fabian, M.P. Spatial resolution of Normalized Difference Vegetation Index and greenness exposure misclassification in an urban cohort. J. Expo. Sci. Environ. Epidemiol. 2022, 32, 213–222. [Google Scholar] [CrossRef] [PubMed]
- de la Iglesia Martinez, A.; Labib, S.M. Demystifying normalized difference vegetation index (NDVI) for greenness exposure assessments and policy interventions in urban greening. Environ. Res. 2023, 220, 115155. [Google Scholar] [CrossRef] [PubMed]
- Rhew, I.C.; Vander Stoep, A.; Kearney, A.; Smith, N.L.; Dunbar, M.D. Validation of the Normalized Difference Vegetation Index as a Measure of Neighbourhood Greenness. Ann. Epidemiol. 2011, 21, 946–952. [Google Scholar] [CrossRef] [PubMed]
- Yasin, M.Y.; Abdullah, J.; Noor, N.M.; Yusoff, M.M.; Noor, N.M. Landsat observation of urban growth and land use change using NDVI and NDBI analysis. IOP Conf. Ser. Earth Environ. Sci. 2022, 1067, 012037. [Google Scholar] [CrossRef]
- Zheng, Y.; Tang, L.; Wang, H. An improved approach for monitoring urban built-up areas by combining NPP-VIIRS nighttime light, NDVI, NDWI, and NDBI. J. Clean. Prod. 2021, 328, 129488. [Google Scholar] [CrossRef]
- Forget, Y.; Shimoni, M.; Gilbert, M.; Linard, C. Mapping 20 Years of Urban Expansion in 45 Urban Areas of Sub-Saharan Africa. Remote Sens. 2021, 13, 525. [Google Scholar] [CrossRef]
- García-Álvarez, D.; Viana, C.M.; Gomes, E.; Marcelino, F.; Caetano, M.; Rocha, J. Dealing with the uncertainty of technical changes in the CORINE Land Cover dataset: The Portuguese approach. Int. J. Appl. Earth Obs. Geoinf. 2023, 122, 103389. [Google Scholar] [CrossRef]
- Śleszyński, P.; Gibas, P.; Sudra, P. The Problem of Mismatch between the CORINE Land Cover Data Classification and the Development of Settlement in Poland. Remote Sens. 2020, 12, 2253. [Google Scholar] [CrossRef]
- Zha, Y.; Gao, J.; Ni, S. Use of normalized difference built-up index in automatically mapping urban areas from TM imagery. Int. J. Remote Sens. 2003, 24, 583–594. [Google Scholar] [CrossRef]
- Sandoval, S.; Escobar-Flores, J.G.; Badar Munir, M. Urbanization and its impacts on land surface temperature and sea surface temperature in a tourist region in Mexico from 1990 to 2020. Remote Sens. Appl. Soc. Environ. 2023, 32, 101046. [Google Scholar] [CrossRef]
- Zhang, M.; Kafy, A.-A.; Xiao, P.; Han, S.; Zou, S.; Saha, M.; Zhang, C.; Tan, S. Impact of urban expansion on land surface temperature and carbon emissions using machine learning algorithms in Wuhan, China. Urban Clim. 2023, 47, 101347. [Google Scholar] [CrossRef]
- Shimrah, T.; Lungleng, P.; Devi, A.R.; Sarma, K.; Varah , F.; Khuman , Y.S. Spatio-temporal assessment on land use and land cover (LULC) and forest fragmentation in shifting agroecosystem landscape in Ukhrul district of Manipur, Northeast India. Environ Monit Assess. 2022, 194, 14. [Google Scholar] [CrossRef] [PubMed]
- Ren, Q.; He, C.; Huang, Q.; Zhang, D.; Shi, P.; Lu, W. Impacts of global urban expansion on natural habitats undermine the 2050 vision for biodiversity. Resour. Conserv. Recycl. 2023, 190, 106834. [Google Scholar] [CrossRef]
- Dadashpoor, H.; Hasankhani, Z. Exploring patterns and consequences of land consumption in a coastal city-region. Ecol. Process. 2022, 11, 49. [Google Scholar] [CrossRef]
- McGranahan, G.; Marcotullio, P.; Bai, X.; Balk, D.; Braga, T.; Douglas, I.; Songsore, J. Ecosystems and Human Well-Being: Synthesis; (Series 1); Island Press: Washington, DC, USA, 2005. [Google Scholar]
- Sun, C.; Wu, Z.; Lv, Z.; Yao, N.; Wei, J. Quantifying different types of urban growth and the change dynamic in Guangzhou using multi-temporal remote sensing data. Int. J. Appl. Earth Obs. Geoinf. 2013, 21, 409–417. [Google Scholar] [CrossRef]
- Cira, D.A.; Mitrea, A.; Sarbu, C.; Ionescu-Heroiu, M.; Cristea, M.; Tutuianu, A.; Bascu, A.; Mihailescu, A.L.; Vintan, A.D.; Irimia, I.A.; et al. Romania—Constanta Urban Development Program: Deliverable 4.1.3—Metropolitan Spatial Planning Measures: Updating the Zonal Urban Plan of Mamaia, a National Interest Resort—Input to Terms of Reference (English); World Bank Group: Washington, DC, USA, 2019; Available online: http://documents.worldbank.org/curated/en/795851613998828416 (accessed on 12 June 2025).
- Bălteanu, D.; Popovici, E. Land use changes and land degradation in post-socialist Romania. Rom. J. Geogr. 2010, 54, 95–107. [Google Scholar]
- Bălteanu, D.; Dragotă, C.S.; Popovici, A.; Dumitraşcu, M.; Kucsicsa, G.; Grigorescu, I. Land use and crop dynamics related to climate change signals during the post-communist period in the south Oltenia, Romania. Proc. Rom. Acad. 2013, 15, 265–278. [Google Scholar]
- Grigorescu, I.; Kucsicsa, G.; Popovici, E.A.; Mitricǎ, B.; Dumitraşcu, M.; Mocanu, I. Regional disparities in the urban sprawl phenomenon in Romania using CORINE land cover database. Rom. J. Geogr. 2018, 62, 169–184. [Google Scholar]
- Diaz-Pacheco, J.; Gutiérrez, J. Exploring the limitations of CORINE Land Cover for monitoring urban land-use dynamics in metropolitan areas. J. Land Use Sci. 2014, 9, 243–259. [Google Scholar] [CrossRef]
- Consiliul Local Năvodari. Hotărâre Privind Aprobarea Planului de Mobilitate Urbană Durabilă a Orașului Năvodari; 2018. Năvodari, Romania. Available online: https://primaria-navodari.ro/wp-content/uploads/2020/02/HCL-59_2018-privind-aprobarea-Planului-de-mobilitate-urban%C4%83-durabil%C4%83-al-ora%C8%99ului-N%C4%83vodari-2018-2030.pdf (accessed on 12 June 2025).
- Focus Press. Asociatia Salvam Mamaia Sat; Focus Press, 2020. Available online: https://focuspress.ro/asociatia-salvam-mamaia-sat-cere-primariei-navodari-sa-opreasca-haosul-si-dezastrul-arhitectural (accessed on 12 June 2025).
- Paganini, M.; Petiteville, I.; Ward, S.; Dyke, G.; Steventon, M.; Harry, J.; Kerblat, F.; Satellite Earth Observations in Support of the Sustainable Development Goals. The CEOS Earth Observation Handbook; 2018. Available online: https://eohandbook.com/sdg/files/CEOS_EOHB_2018_SDG.pdf (accessed on 12 June 2025).
- UN-Habitat. The Urban Resilience Observatory for the Evaluation of SDGs of the Municipality of Thessaloniki; UN-Habitat: Nairobi, Kenya, 2021; Available online: https://eotoolkit.unhabitat.org/pages/thessaloniki-use-case (accessed on 2 March 2025).
Disclaimer/Publisher’s Note: The statements, opinions and data contained in all publications are solely those of the individual author(s) and contributor(s) and not of MDPI and/or the editor(s). MDPI and/or the editor(s) disclaim responsibility for any injury to people or property resulting from any ideas, methods, instructions or products referred to in the content. |
© 2025 by the authors. Licensee MDPI, Basel, Switzerland. This article is an open access article distributed under the terms and conditions of the Creative Commons Attribution (CC BY) license (https://creativecommons.org/licenses/by/4.0/).