
Quantifying Soil Carbon Sequestration Potential Through Carbon Farming Practices with RothC Model Adapted to Lithuania


Abstract
1. Introduction
2. Materials and Methods
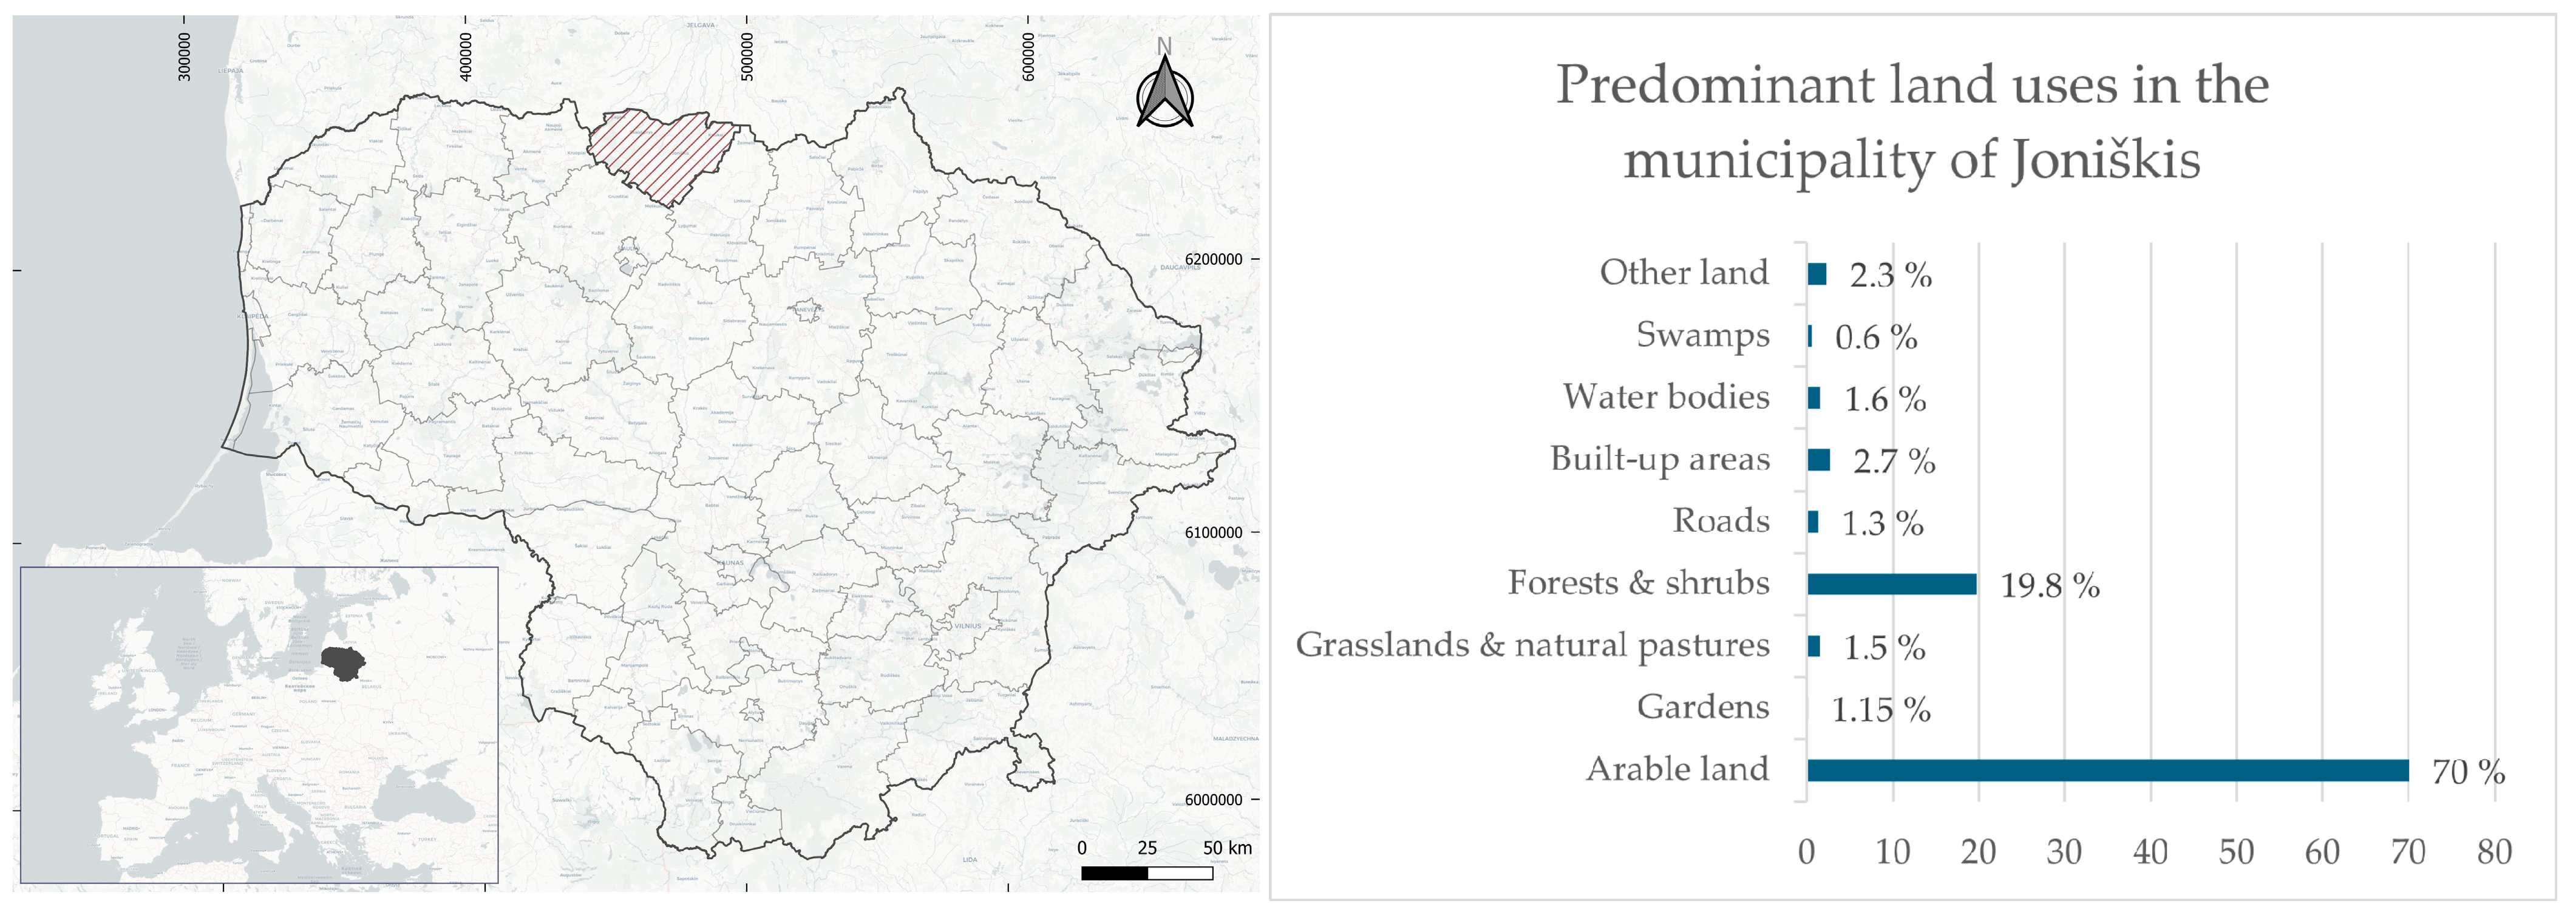
2.1. Study Area
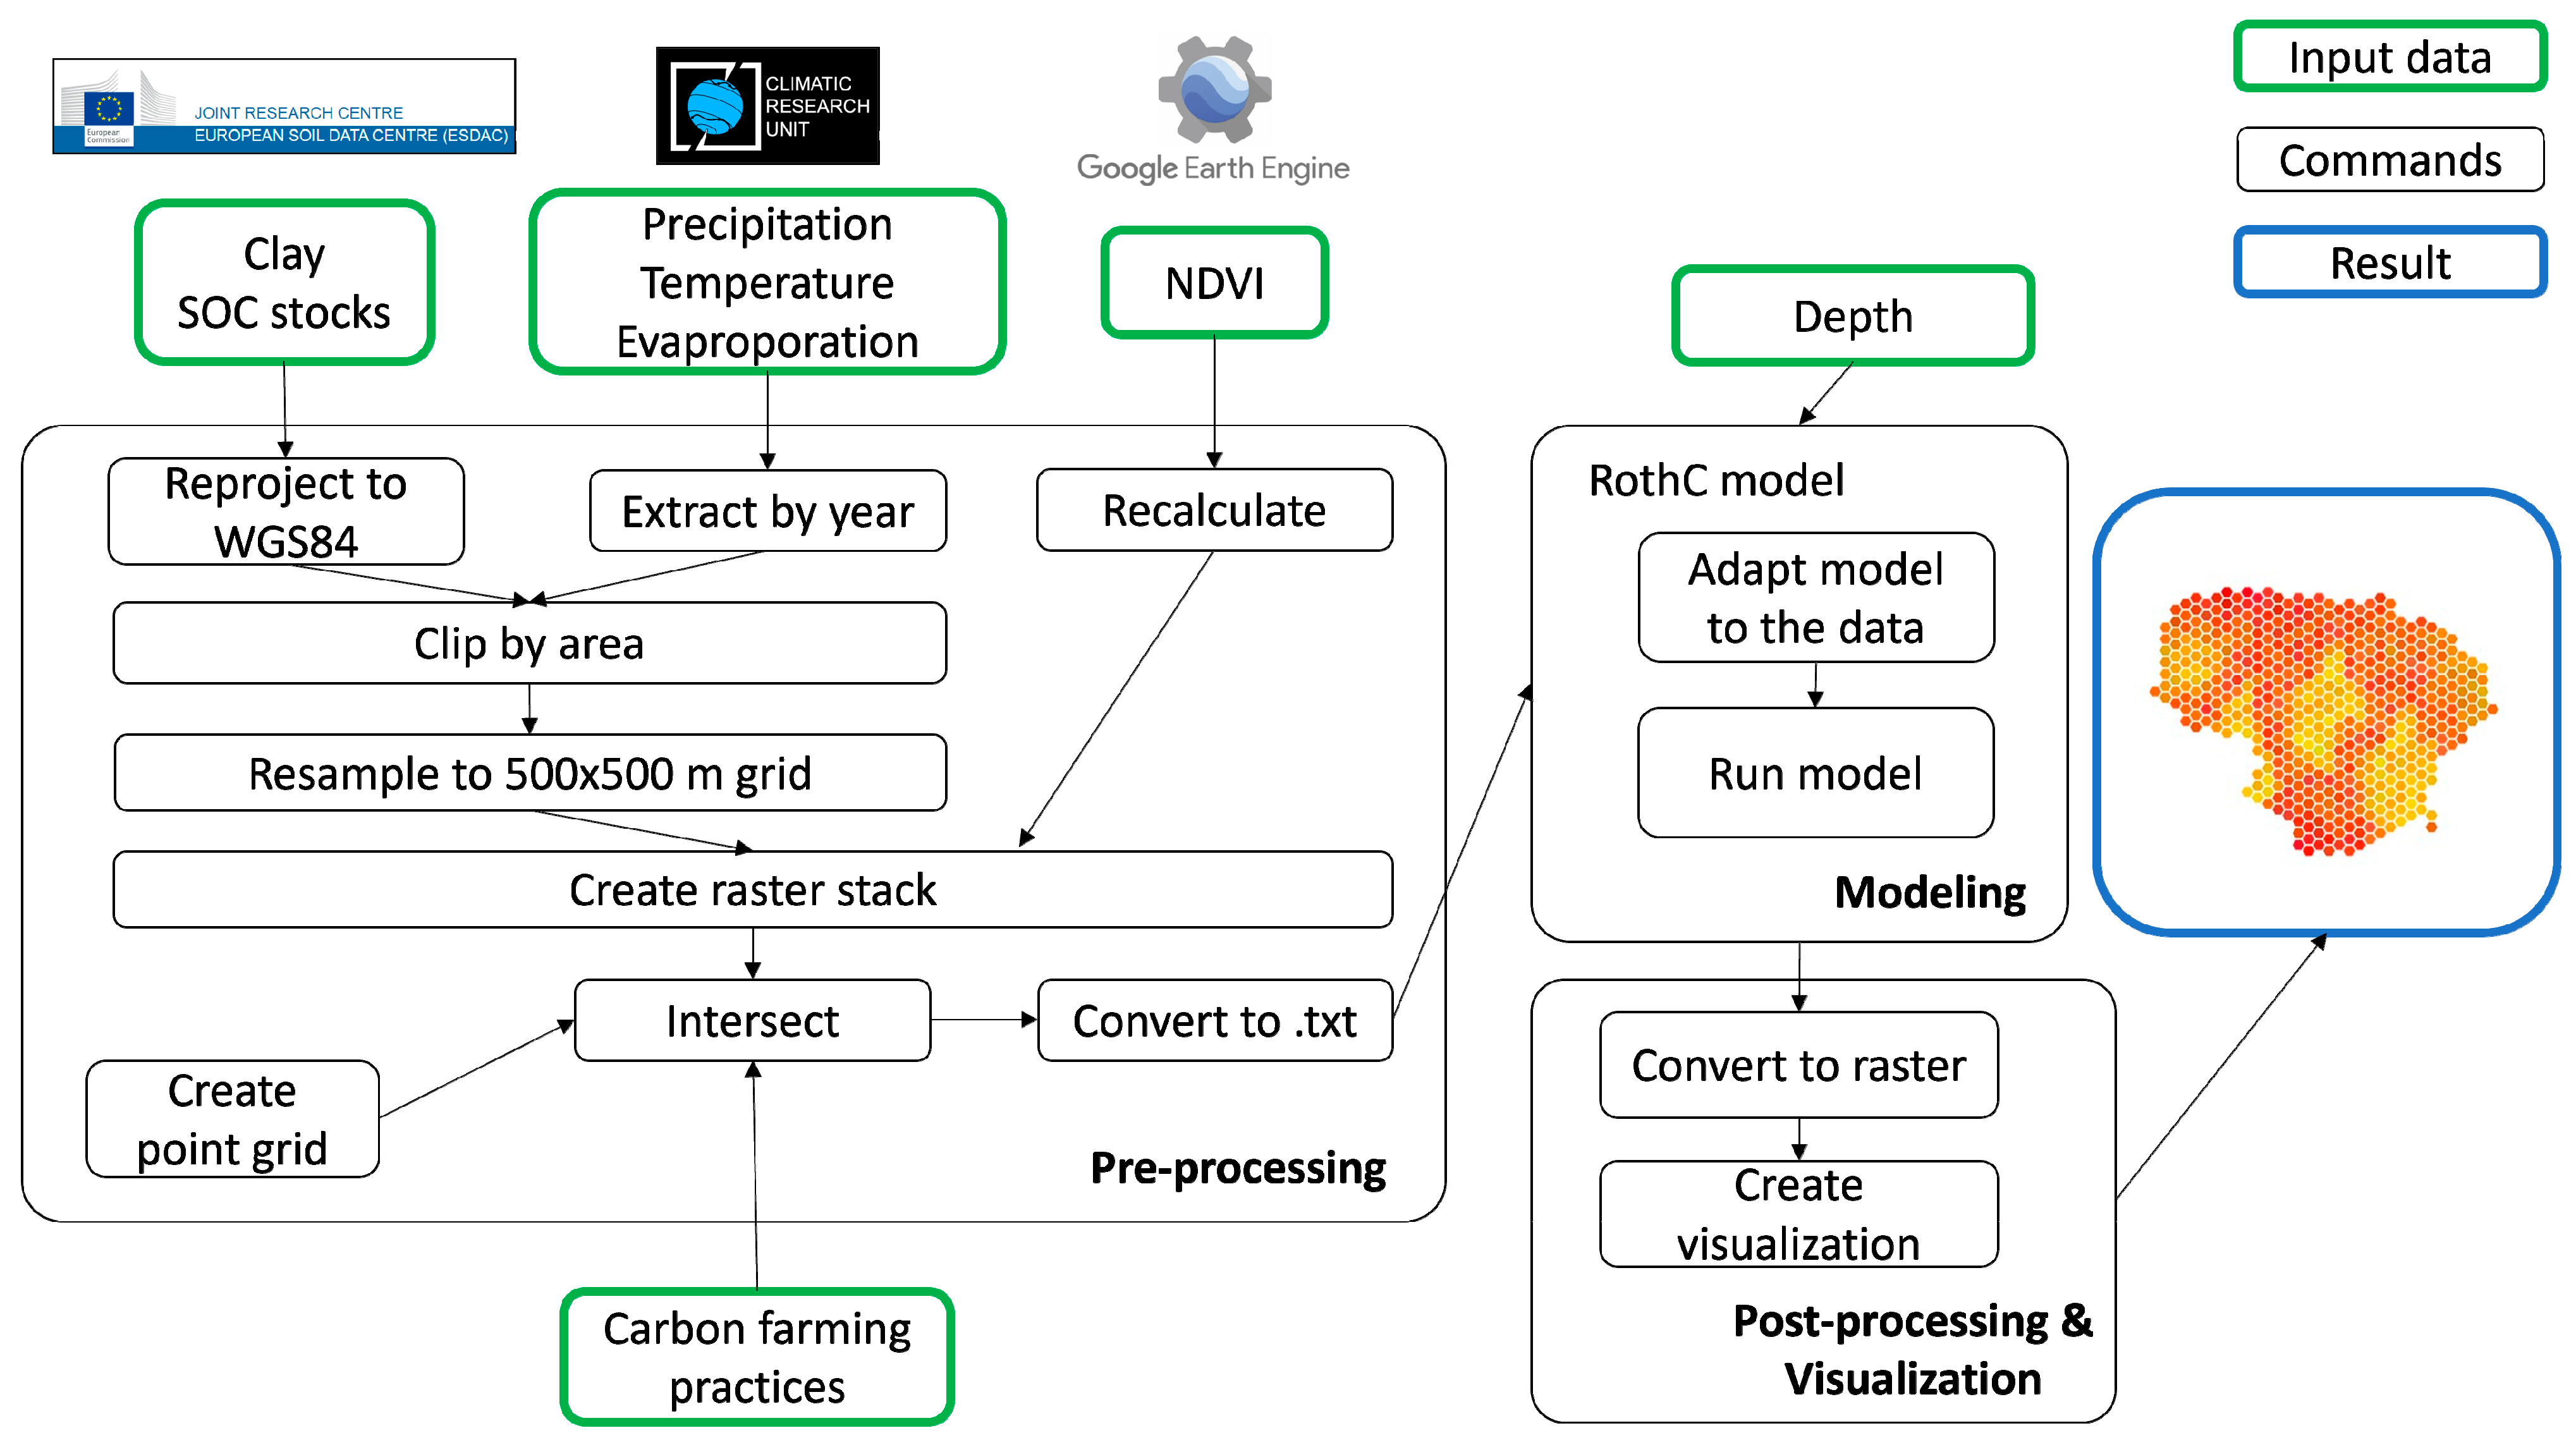
2.2. Data Sources
2.3. Data Processing
2.4. Identification of Carbon Farming Practices
2.5. Soil Organic Carbon Modeling with RothC
Carbon Input Modifications
- α1 = 0.8—a coefficient for cover crops;
- α2 = 0.6—a coefficient for residue retention;
- Cbase—baseline carbon input for cropland;
- CC—cover crops indicator (1/0);
- R—residue retention indicator (1/0).
- DPM/RPMbase—the default ratio;
- = 0.5—the increase in the DPM/RPM ratio due to tillage;
- T—tillage indicator (1/0).
- Temperature (Temp) modifier:
- 2.
- Moisture (Moist) modifier:
- 3.
- Plant cover (PC) modifier:
- —remaining carbon at time;
- C0—initial pool carbon;
- k—pool specific decay constant (i.e., for DPM k = 10, for HUM k = 0.02, for RPM k = 0.3, for BIO k = 0.66)
- f—combined RMF.
3. Results
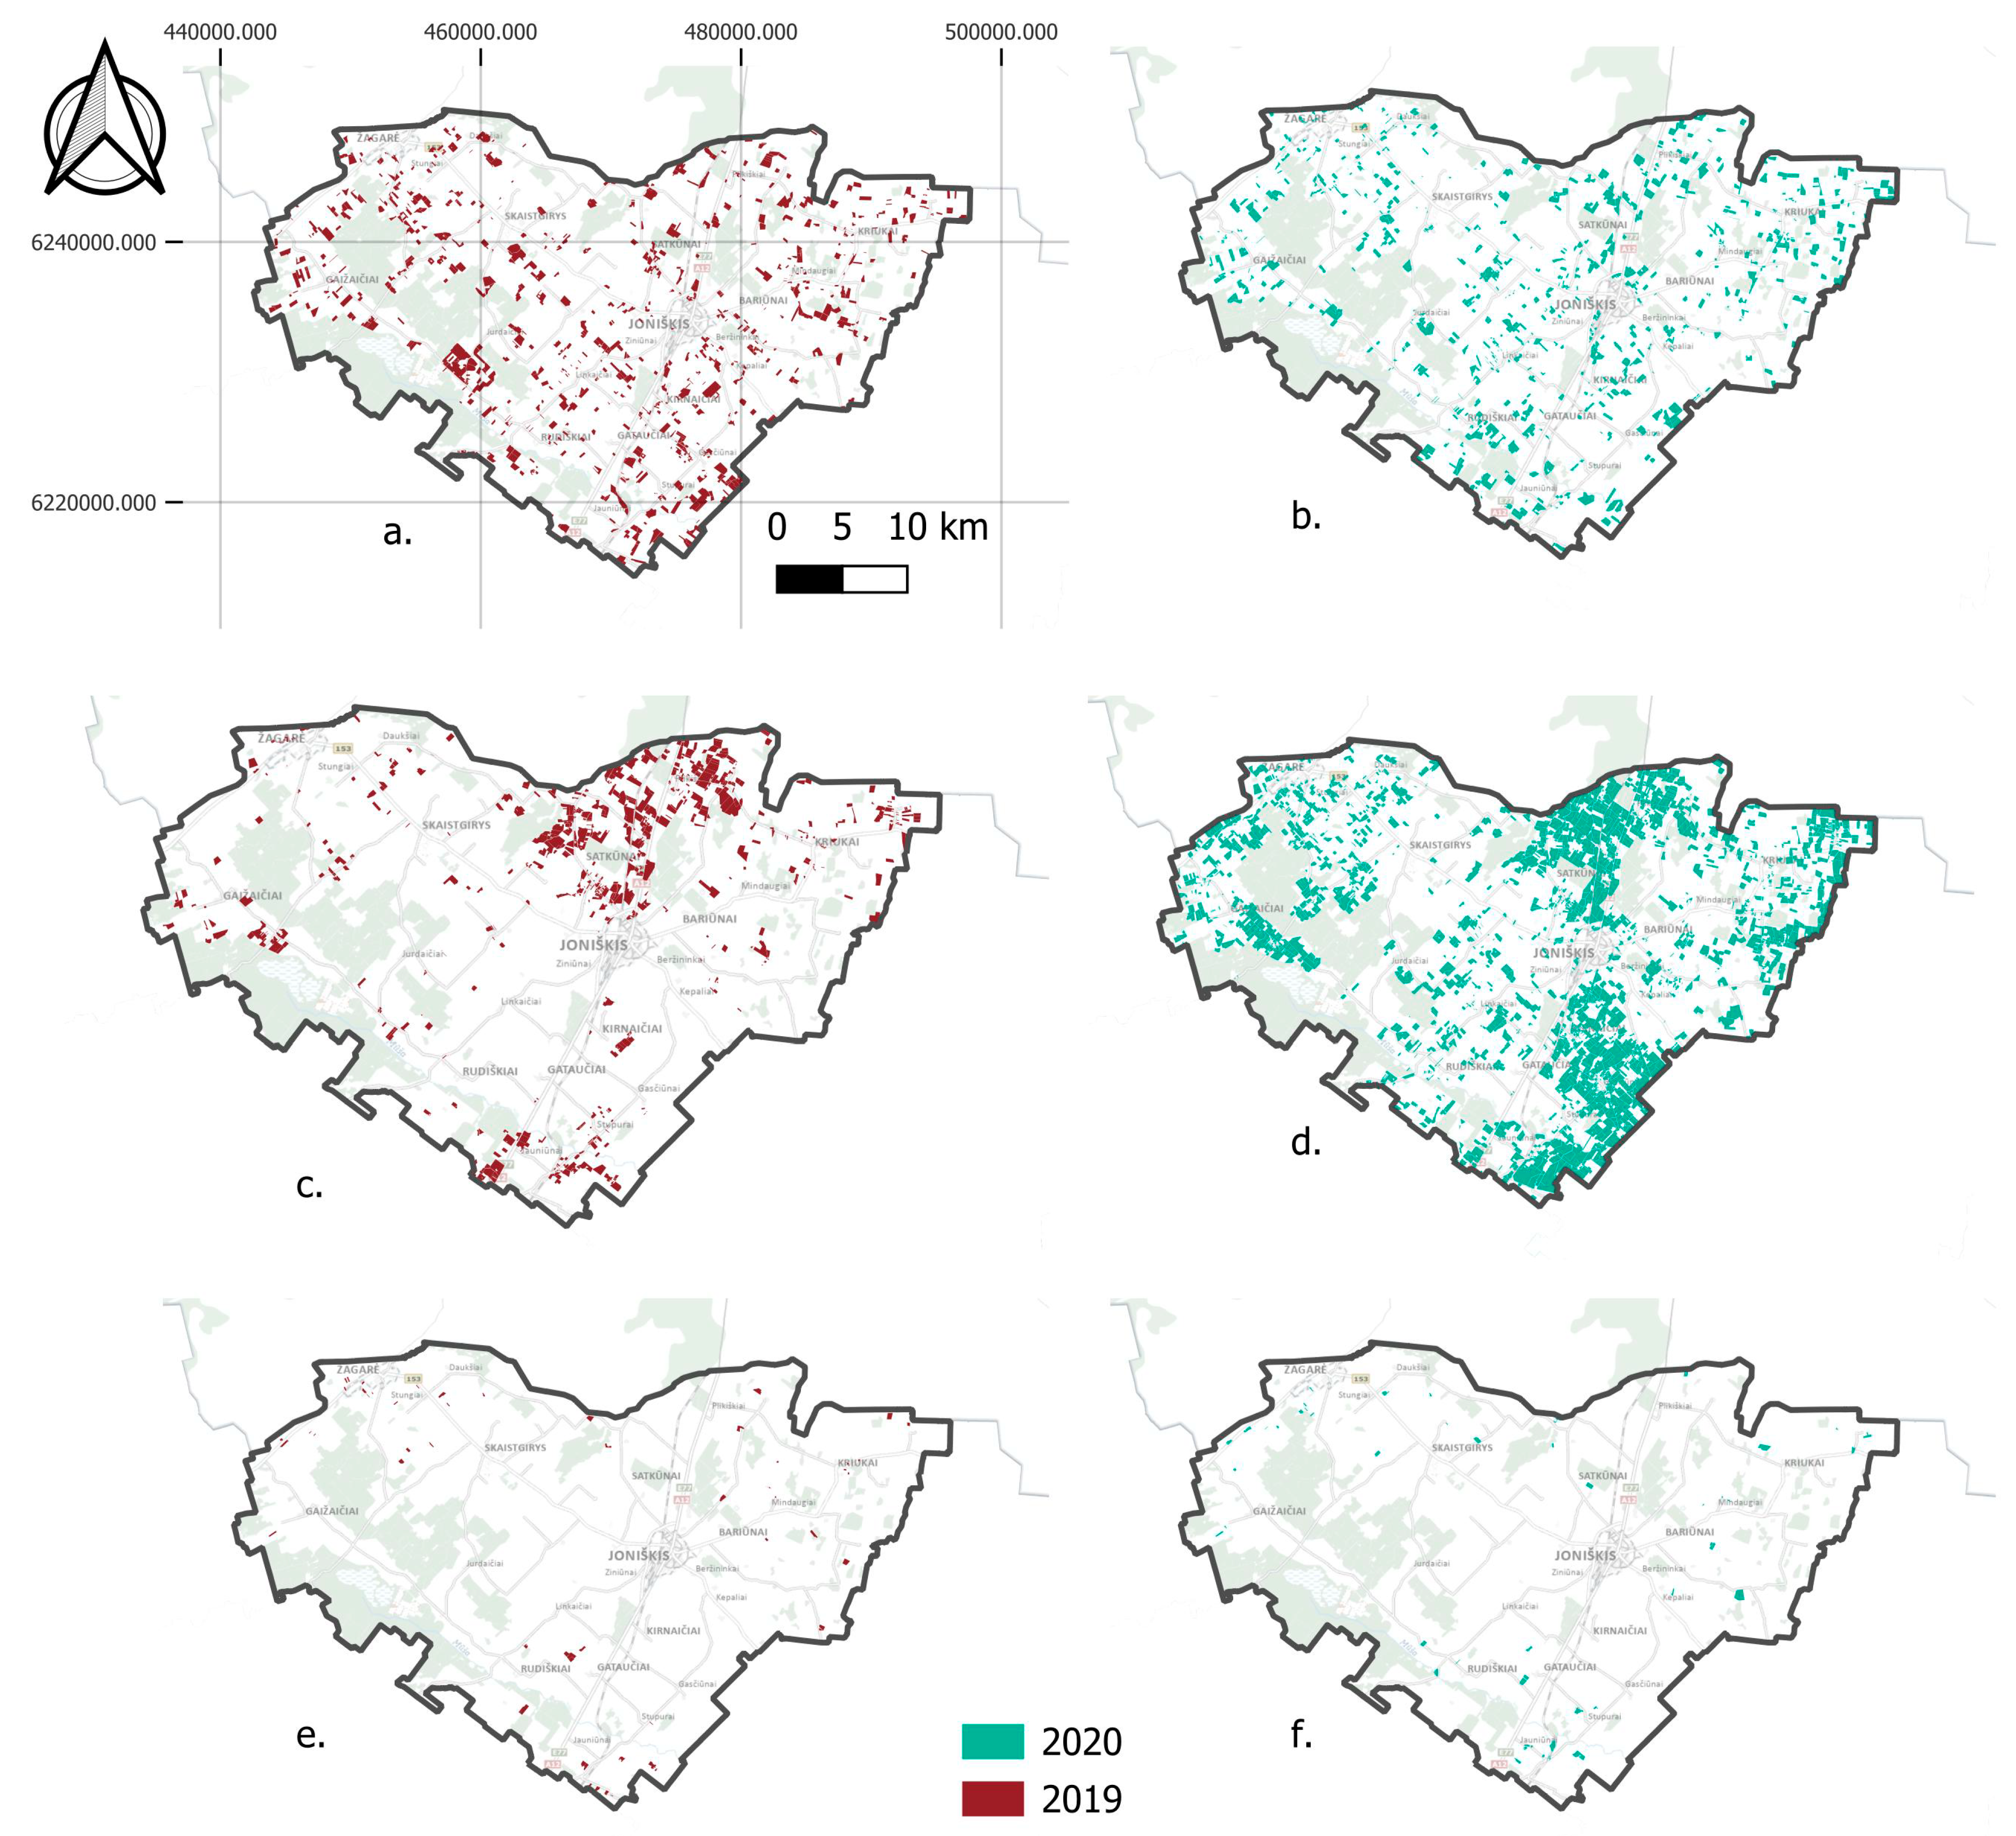
3.1. Results of Identified Carbon Farming Practices
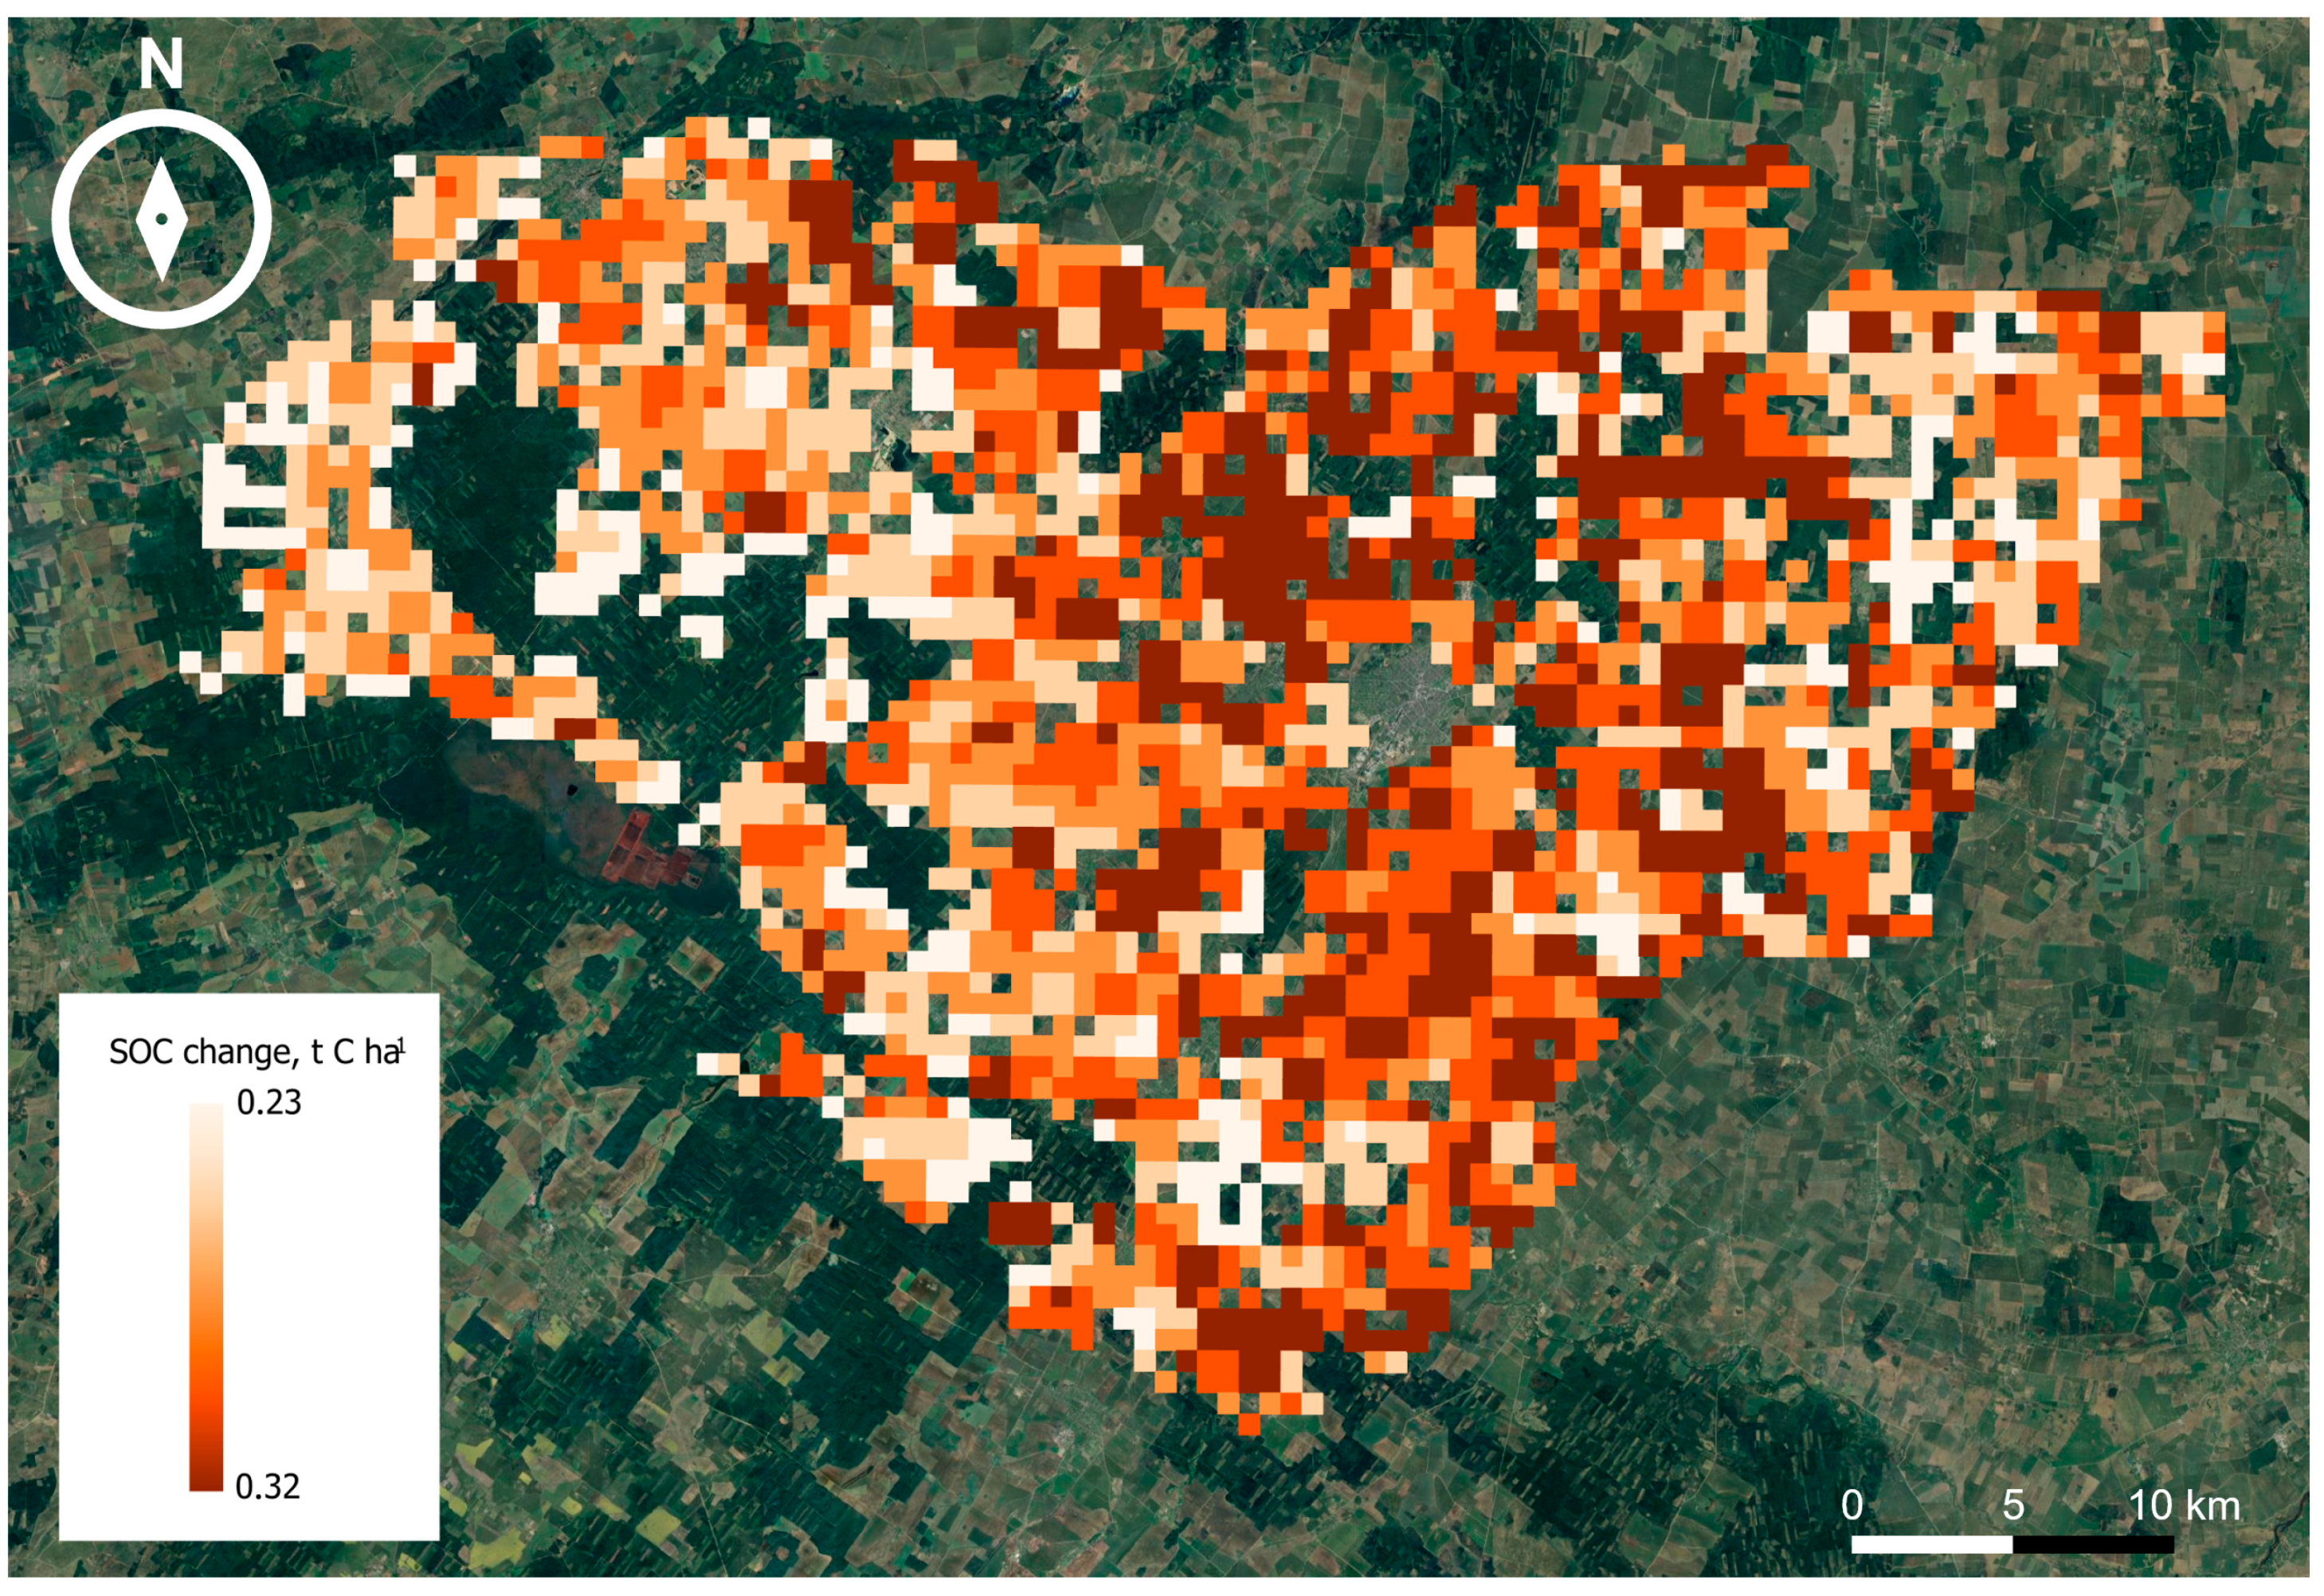
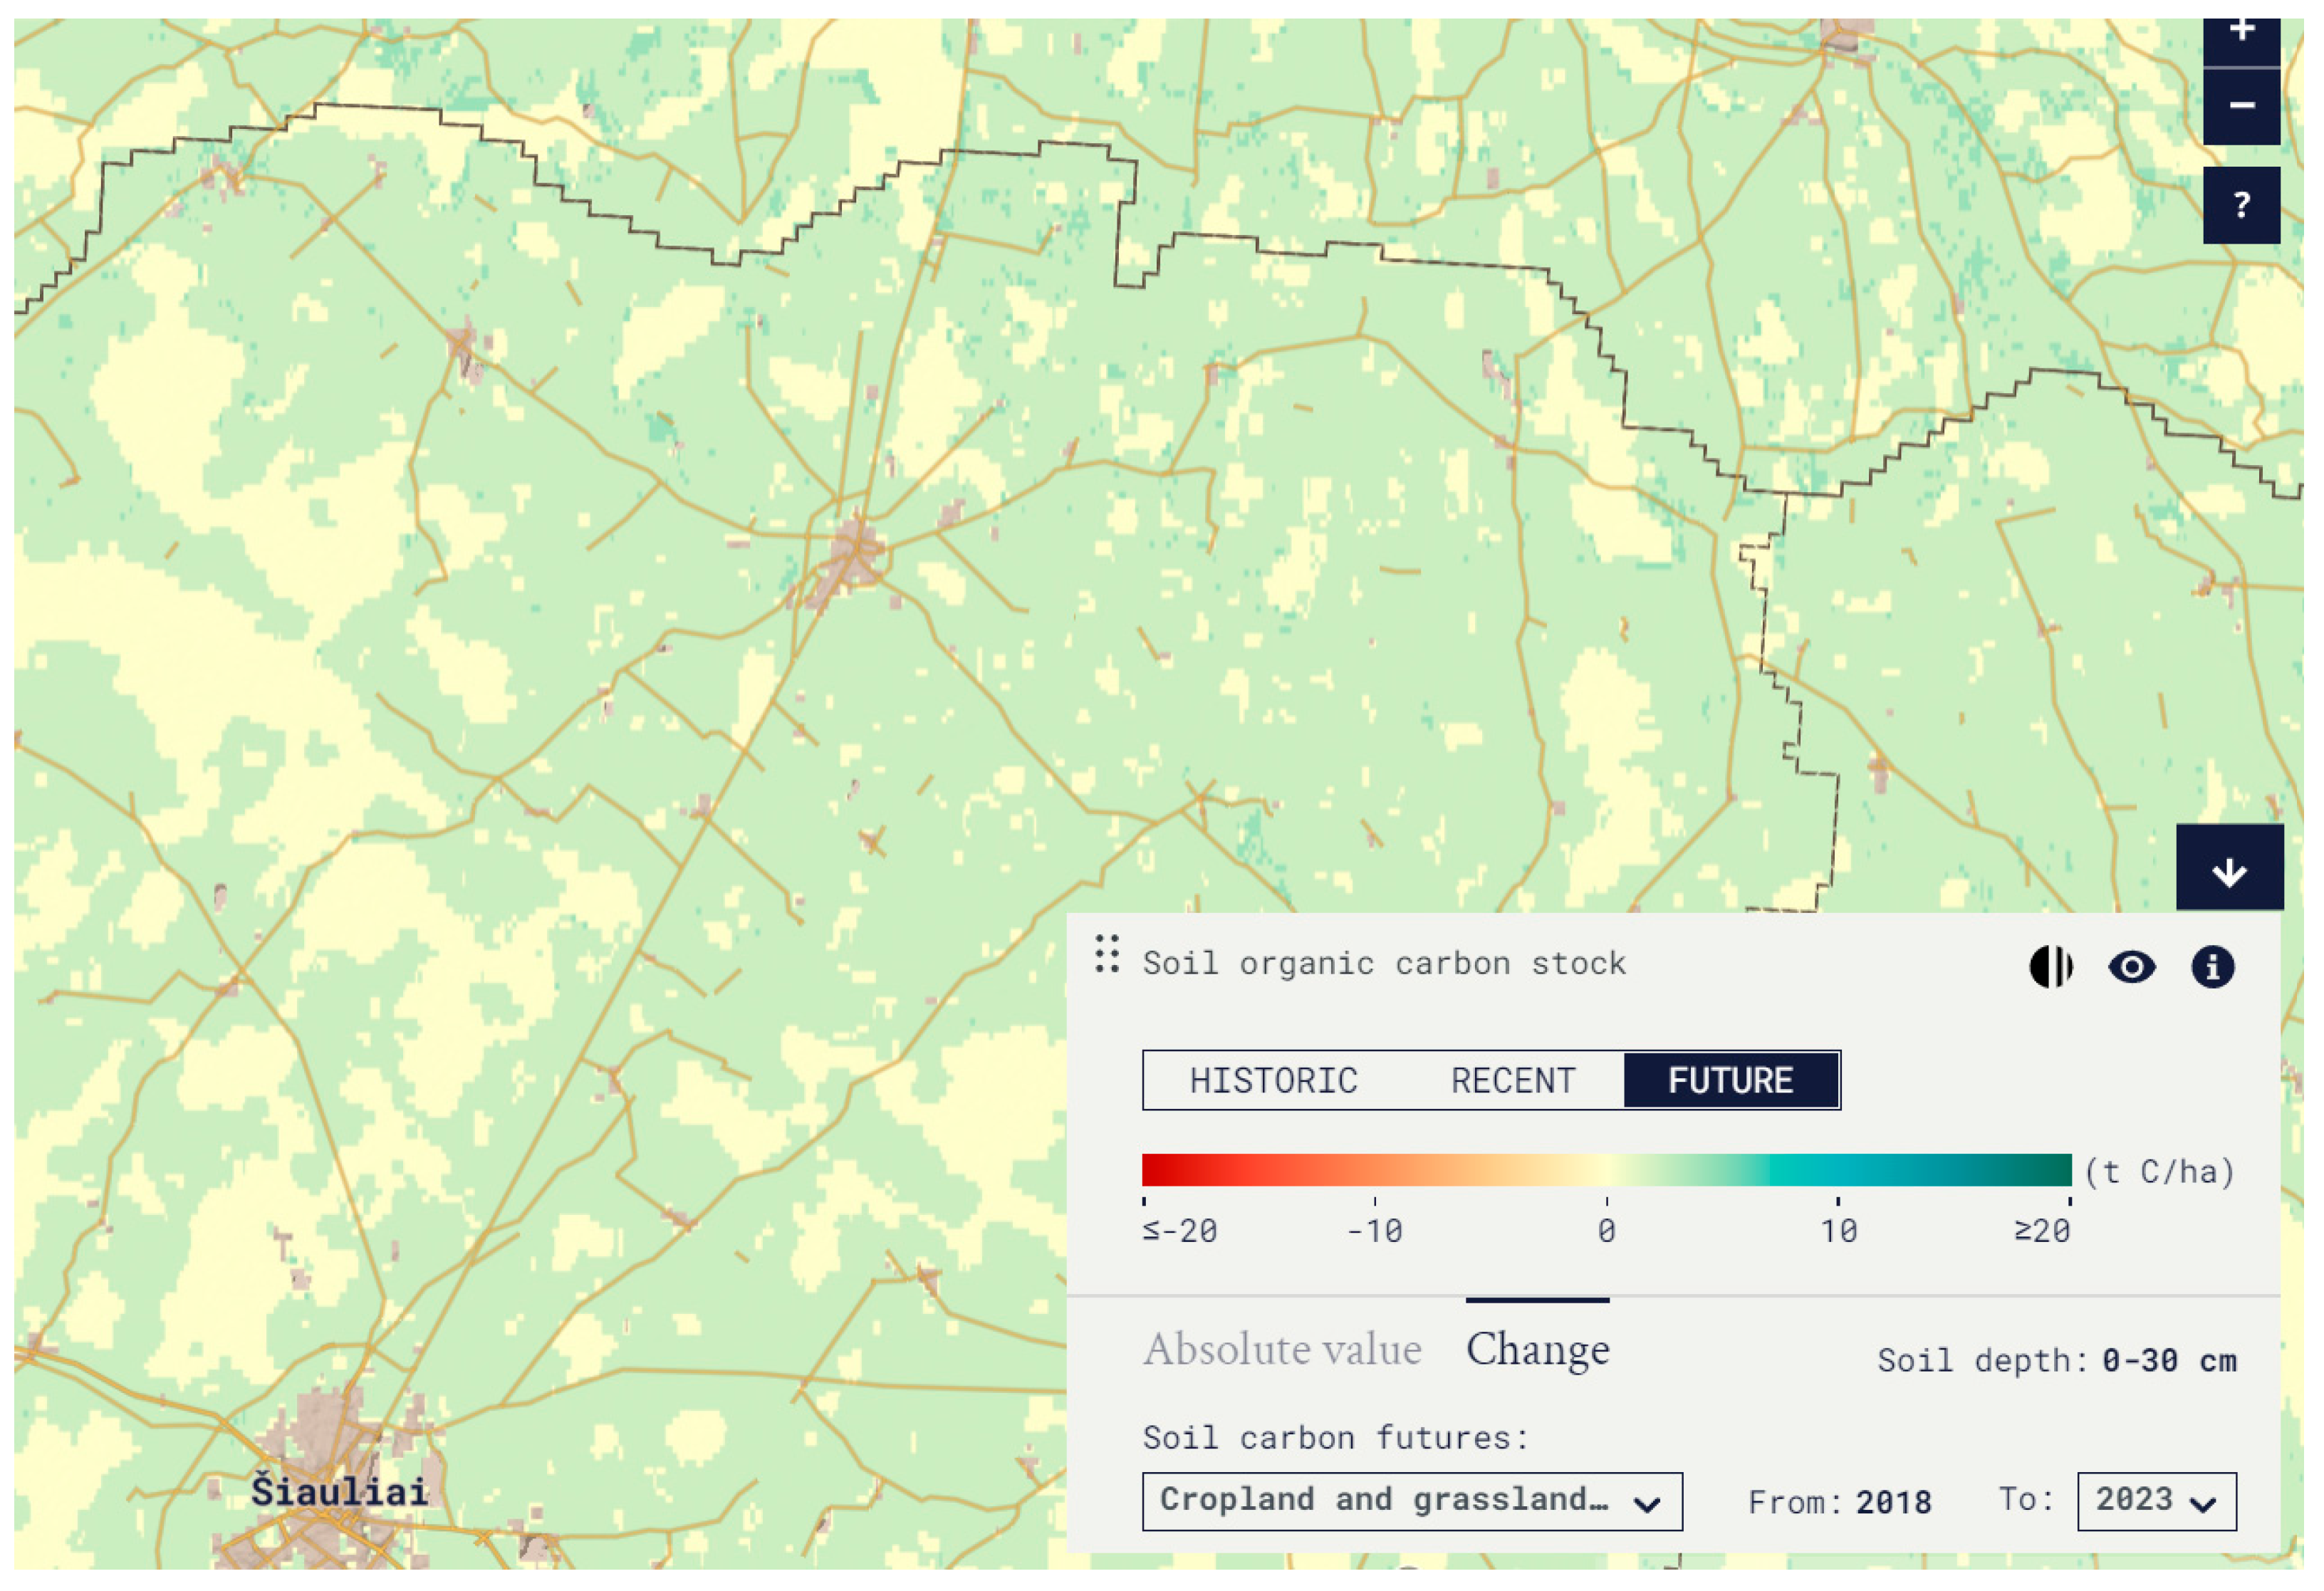
3.2. Modeled Soil Organic Carbon Change
4. Discussion
5. Conclusions and Recommendations
- Establishing long-term SOC monitoring plots for calibration and validation;
- Improving climate and soil-input resolution (e.g., ERA5-Land) and extending simulations to multi-year periods;
- Encoding management intensity on a continuous rather than binary scale;
- Integrating farmer-reported data and participatory mapping for ground-truthing;
- Applying machine-learning classifiers to refine remote sensing detection of tillage and residue cover.
Author Contributions
Funding
Data Availability Statement
Conflicts of Interest
References
- Pandey, D.; Agrawal, M. Carbon Footprint Estimation in the Agriculture Sector. In Assessment of Carbon Footprint in Different Industrial Sectors; Springer: Singapore, 2014; pp. 25–47. [Google Scholar]
- European Commission. Regulation (EU) 2018/1999 on the Governance of the Energy Union and Climate Action; European Commission: Brussels, Belgium, 2018; Volume 328, pp. 1–77. [Google Scholar]
- Spacenus Carbon Farming & Satellite Imagery 2021. Available online: https://www.mdpi.com/authors/references (accessed on 11 December 2024).
- Perosa, B.; Newton, P.; da Silva, R.F.B. A Monitoring, Reporting and Verification System for Low Carbon Agriculture: A Case Study from Brazil. Environ. Sci. Policy 2023, 140, 286–296. [Google Scholar] [CrossRef]
- Paul, C.; Bartkowski, B.; Dönmez, C.; Don, A.; Mayer, S.; Steffens, M.; Weigl, S.; Wiesmeier, M.; Wolf, A.; Helming, K. Carbon Farming: Are Soil Carbon Certificates a Suitable Tool for Climate Change Mitigation? J. Environ. Manag. 2023, 330, 117142. [Google Scholar] [CrossRef]
- Ellis, J. Sensing and Satellite Technology Advances Are Unlocking Carbon Markets for Farmers; CleanTech: London, UK, 2023. [Google Scholar]
- Mandal, A.; Majumder, A.; Dhaliwal, S.S.; Toor, A.S.; Mani, P.K.; Naresh, R.K.; Gupta, R.K.; Mitran, T. Impact of Agricultural Management Practices on Soil Carbon Sequestration and Its Monitoring through Simulation Models and Remote Sensing Techniques: A Review. Crit. Rev. Environ. Sci. Technol. 2022, 52, 1–49. [Google Scholar] [CrossRef]
- Tiefenbacher, A.; Sandén, T.; Haslmayr, H.-P.; Miloczki, J.; Wenzel, W.; Spiegel, H. Optimizing Carbon Sequestration in Croplands: A Synthesis. Agronomy 2021, 11, 882. [Google Scholar] [CrossRef]
- Tripathi, S.; Soni, S.K.; Maurya, A.K.; Kr, P. Calculating Carbon Sequestration Using Remote Sensing and GIS. Geospat. World 2010. [Google Scholar]
- Tellatin, S.; Myers, R. Cover Crops and Carbon Sequestration; National Institute for Food and Agriculture, Sustainable Agriculture Research & Education: College Park, MD, USA, 2018; Available online: https://www.sare.org/publications/cover-crops/ecosystem-services/cover-crops-and-carbon-sequestration/ (accessed on 1 May 2023).
- Brockett, B.F.T.; Browne, A.L.; Beanland, A.; Whitfield, M.G.; Watson, N.; Blackburn, G.A.; Bardgett, R.D. Guiding Carbon Farming Using Interdisciplinary Mixed Methods Mapping. People Nat. 2019, 1, 191–203. [Google Scholar] [CrossRef]
- Beillouin, D.; Corbeels, M.; Demenois, J.; Berre, D.; Boyer, A.; Fallot, A.; Feder, F.; Cardinael, R. A Global Meta-Analysis of Soil Organic Carbon in the Anthropocene. Nat. Commun. 2023, 14, 3700. [Google Scholar] [CrossRef]
- Bolinder, M.A.; Crotty, F.; Elsen, A.; Frac, M.; Kismányoky, T.; Lipiec, J.; Tits, M.; Tóth, Z.; Kätterer, T. The Effect of Crop Residues, Cover Crops, Manures and Nitrogen Fertilization on Soil Organic Carbon Changes in Agroecosystems: A Synthesis of Reviews. Mitig. Adapt. Strateg. Glob. Change 2020, 25, 929–952. [Google Scholar] [CrossRef]
- Gaudaré, U.; Kuhnert, M.; Smith, P.; Martin, M.; Barbieri, P.; Pellerin, S.; Nesme, T. Soil Organic Carbon Stocks Potentially at Risk of Decline with Organic Farming Expansion. Nat. Clim. Change 2023, 13, 719–725. [Google Scholar] [CrossRef]
- McDonald, H.; Frelih-Larsen, A.; Lóránt, A.; Duin, L.; Andersen, S.P.; Costa, G.; Bradley, H. Carbon Farming. Making Agriculture Fit for 2030; Study for the committee on Environment, Public Health and Food Safety (ENVI). Policy Department for Economic, Scientific and Quality of Life Policies, European Parliament: Luxemburg, 2021. [Google Scholar]
- Beeson, P.C.; Daughtry, C.S.T.; Wallander, S.A. Estimates of Conservation Tillage Practices Using Landsat Archive. Remote Sens. 2020, 12, 2665. [Google Scholar] [CrossRef]
- Melillo, J.; Gribkoff, E. Soil-Based Carbon Sequestration. Clim. Portal 2021. Available online: https://climate.mit.edu/explainers/soil-based-carbon-sequestration (accessed on 23 June 2024).
- Naftel, H. Understanding the Barriers to Carbon Farming on Private Lands; Utah State University: Logan, UT, USA, 2022. [Google Scholar]
- Tembotov, R.K. Using a Multifunctional Approach for Cartographic Modeling of Organic Carbon Content in Natural and Arable Soils of the Central Caucasus. Cosm. Res. 2023, 61, S71–S79. [Google Scholar] [CrossRef]
- Nguyen, T.T. Predicting Agricultural Soil Carbon Using Machine Learning. Nat. Rev. Earth Environ. 2021, 2, 825. [Google Scholar] [CrossRef]
- Nateghi, S.; Souri, M.; Khalifehzadeh, R.; Khodagholi, M.; Amiri, F. Prediction of Topsoil Organic Carbon Based on Vegetation Indices Derived from Landsat-8 OLI Images in Semiarid Rangelands of Semnan Province, Iran. Arab. J. Geosci. 2022, 15, 1304. [Google Scholar] [CrossRef]
- Kaye, J.P.; Quemada, M. Using Cover Crops to Mitigate and Adapt to Climate Change. A Review. Agron. Sustain. Dev. 2017, 37, 4. [Google Scholar] [CrossRef]
- McDowell, J.; Ruis, S.; Blanco, H. Cover Crops and Carbon Sequestration: Benefits to the Producer and the Planet. CropWatch 2019, 11, 2019. [Google Scholar]
- Pradhan, A.; Wakchaure, G.C.; Shid, D.; Minhas, P.S.; Biswas, A.K.; Reddy, K.S. Impact of Residue Retention and Nutrient Management on Carbon Sequestration, Soil Biological Properties, and Yield in Multi-Ratoon Sugarcane. Front. Sustain. Food Syst. 2023, 7, 1288569. [Google Scholar] [CrossRef]
- Jayaraman, S.; Sinha, N.K.; Mohanty, M.; Hati, K.M.; Chaudhary, R.S.; Shukla, A.K.; Shirale, A.O.; Neenu, S.; Naorem, A.K.; Rashmi, I.; et al. Conservation Tillage, Residue Management, and Crop Rotation Effects on Soil Major and Micro-Nutrients in Semi-Arid Vertisols of India. J. Soil. Sci. Plant Nutr. 2020, 21, 523–535. [Google Scholar] [CrossRef]
- Zhang, T.; Zhang, W.; Yang, R.; Liu, Y.; Jafari, M. CO2 Capture and Storage Monitoring Based on Remote Sensing Techniques: A Review. J. Clean. Prod. 2021, 281, 124409. [Google Scholar] [CrossRef]
- He, Q.; Lu, C.; Cowie, A.; Zhao, S.; Liu, D.L.; Yi, B.; Shi, L.; Zhang, S.; Qiu, T.; Shi, Y.; et al. Optimizing Cover Cropping Application for Sustainable Crop Production. Sustain. Agric. 2025, 3, 10. [Google Scholar] [CrossRef]
- Regrow Ecosystem Markets 101. 2023. Available online: https://4430549.fs1.hubspotusercontent-na1.net/hubfs/4430549/05.%20Marketing%20Content/EcosystemMarkets101-Feb22.pdf (accessed on 1 March 2025).
- USDA. Conservation Practice Standard. Cover Crop. 2014. Available online: https://www.nrcs.usda.gov/sites/default/files/2022-09/Cover_Crop_340_Overview.pdf (accessed on 24 August 2023).
- Lemtiri, A.; Colinet, G.; Alabi, T.; Bodson, B.; Olivier, C.; Brostaux, Y.; Pierreux, J.; Haubruge, E.; Cluzeau, D.; Francis, F. Short-Term Effects of Tillage Practices and Crop Residue Exportation on Soil Organic Matter and Earthworm Communities in Silt Loam Arable Soil; Elsevier Inc.: Amsterdam, The Netherlands, 2018; ISBN 9780128121290. [Google Scholar]
- USDA. Conservation Practice Standard Overview. Residue and Tillage Management, No Till. 2016. Available online: https://www.nrcs.usda.gov/sites/default/files/2022-09/Residue_And_Tillage_Management_No_Till_329_PO_Sep_2016_0.pdf (accessed on 21 August 2023).
- Blevins, R.L.; Cook, D.; Phillips, S.H.; Phillips, R.E. Influence of No-Tillage on Soil Moisture. Agron. J. 1971, 63, 593–596. [Google Scholar] [CrossRef]
- Garcia-Franco, N.; Hobley, E.; Hübner, R.; Wiesmeier, M. Climate-Smart Soil Management in Semiarid Regions; Elsevier Inc.: Amsterdam, The Netherlands, 2018; ISBN 9780128121290. [Google Scholar]
- van der Voort, T.S.; Verweij, S.; Fujita, Y.; Ros, G.H. Enabling Soil Carbon Farming: Presentation of a Robust, Affordable, and Scalable Method for Soil Carbon Stock Assessment. Agron. Sustain. Dev. 2023, 43, 22. [Google Scholar] [CrossRef]
- Schilling, F.; Baumüller, H.; Ecuru, J.; Von Braun, J. Carbon Farming in Africa: Opportunities and Challenges for Engaging Smallholder Farmers; University of Bonn: Bonn, Germany, 2023. [Google Scholar]
- Robert, M. Soil Carbon Sequestration for Improved Land Management; Food and Agricultural Organization of the United Nations: Rome, Italy, 2001. [Google Scholar]
- FAO. Measuring and Modelling Soil Carbon Stocks and Stock Changes in Livestock Production Systems; FAO: Rome, Italy, 2019. [Google Scholar]
- Peralta, G.; Di Paolo, L.; Omuto, C.; Viatkin, K.; Luotto, I.; Yigini, Y. Technical Manual Global Soil Organic Carbon Sequestration Potential Map GSOCseq; FAO: Rome, Italy, 2020. [Google Scholar]
- Abrahamsen, P.; Styzcen, M.; Darkner, S.; Diamantopoulos, E.; Niebe Abel, S.M.; Holbak, M. Daisy—Mechanistic Simulation of Agricultural Fields 2023. Available online: https://daisy.ku.dk/about-daisy/ (accessed on 30 May 2024).
- Chertov, O.G.; Komarov, A.S. SOMM: A Model of Soil Organic Matter Dynamics. Ecol. Modell. 1997, 94, 177–189. [Google Scholar] [CrossRef]
- Colorado State University. DayCent Model. Available online: https://www.nrel.colostate.edu/projects/daycent (accessed on 30 May 2024).
- Colorado State University. Century Model. Available online: https://www.nrel.colostate.edu/projects/century (accessed on 30 May 2024).
- Deng, J. The DNDC Model. Available online: https://www.dndc.sr.unh.edu/ (accessed on 30 May 2024).
- Franko, U.; Oelschlä, B.; Schenk, S.; Puhlmann, M.; Kuka, K.; Mallast Neé KrüGer, J.; Thiel, E.; Prays, N.; Meurer, K.; Bö, E. CANDY Manual. Description of Background. 2015. Available online: https://www.ufz.de/export/data/2/95948_CANDY_MANUAL.pdf (accessed on 30 May 2024).
- Grace, P.R.; Ladd, J.N.; Robertson, G.P.; Gage, S.H. SOCRATES—A Simple Model for Predicting Long-Term Changes in Soil Organic Carbon in Terrestrial Ecosystems. Soil. Biol. Biochem. 2006, 38, 1172–1176. [Google Scholar] [CrossRef]
- Holzworth, D.P.; Huth, N.I.; deVoil, P.G.; Zurcher, E.J.; Herrmann, N.I.; McLean, G.; Chenu, K.; van Oosterom, E.J.; Snow, V.; Murphy, C.; et al. APSIM—Evolution towards a New Generation of Agricultural Systems Simulation. Environ. Model. Softw. 2014, 62, 327–350. [Google Scholar] [CrossRef]
- Coleman, K. Rothamsted Carbon Model (RothC). Available online: https://www.rothamsted.ac.uk/rothamsted-carbon-model-rothc (accessed on 30 May 2024).
- Coleman, K.; Prout, J.M.; Milne, A.E.; Coleman, K.; Prout, J.; Milne, A. RothC-A Model for the Turnover of Carbon in Soil. 2024. Available online: https://www.rothamsted.ac.uk/sites/default/files/Documents/RothC_description.pdf (accessed on 15 July 2025).
- Byrne, K.A.; Kiely, G. Evaluation of Models (PaSim, RothC, CENTURY and DNDC) for Simulation of Grassland Carbon Cycling at Plot, Field and Regional Scale. 2008. Available online: https://www.researchgate.net/publication/238730877_Evaluation_of_Models_PaSim_RothC_CENTURY_and_DNDC_for_Simulation_of_Grassland_Carbon_Cycling_at_Plot_Field_and_Regional_Scale (accessed on 15 July 2025).
- FAO. Assessing Carbon Stocks and Modelling Win-Win Scenarios of Carbon Sequestration Though Land-Use Changes. Available online: https://www.fao.org/4/y5490e/y5490e08.htm? (accessed on 18 June 2025).
- Harris, I.; Osborn, T.J.; Jones, P.; Lister, D. Version 4 of the CRU TS Monthly High-Resolution Gridded Multivariate Climate Dataset. Sci. Data 2020, 7, 109. [Google Scholar] [CrossRef]
- Agricultural Data Center. Land Fund Accounting Data on Land Use. Available online: https://data.gov.lt/datasets/1290/#info (accessed on 31 May 2024).
- European Soil Data Centre (ESDAC). Pan-European SOC Stock of Agricultural Soils. Available online: https://esdac.jrc.ec.europa.eu/content/pan-european-soc-stock-agricultural-soils (accessed on 6 May 2025).
- Lugato, E.; Panagos, P.; Bampa, F.; Jones, A.; Montanarella, L. A New Baseline of Organic Carbon Stock in European Agricultural Soils Using a Modelling Approach. Glob. Change Biol. 2014, 20, 313–326. [Google Scholar] [CrossRef] [PubMed]
- Climatic Research Unit (CRU). High-Resolution Gridded Datasets. Available online: https://crudata.uea.ac.uk/cru/data/hrg/#current (accessed on 6 May 2025).
- Metrikaityte, G.; Visockiene, J.S.; Papsys, K. Digital Mapping of Land Cover Changes Using the Fusion of SAR and MSI Satellite Data. Land 2022, 11, 1023. [Google Scholar] [CrossRef]
- Gudelė, G.M.; Visockienė, J.S. Remote Sensing Data Application to Monitor Carbon Farming Practices. In Proceedings of the International Archives of the Photogrammetry, Remote Sensing and Spatial Information Sciences—ISPRS Archives; International Society for Photogrammetry and Remote Sensing: Paris, France, 2024; Volume 48, pp. 257–265. [Google Scholar]
- Aplinkos Apsaugos Agentūra. Nuotolinio Stebėjimo Duomenų Paėmimo, Apdorojimo, Panaudojimo Ir Saugojimo Sistemos Preliminariam Vandens Būklės Vertinimui Ir Jos Efektyvesniam Valdymui Projektavimo Ir Įdiegimo Paslaugų Projekto Galutinė Ataskaita; Vilnius, Lithuania. 2024. Available online: https://aaa.lrv.lt/media/viesa/saugykla/2024/1/DoH30faIwb0.pdf (accessed on 18 July 2025).
- Zhang, K.; Liu, Z.; McCarl, B.A.; Fei, C.J. Enhancing Agricultural Soil Carbon Sequestration: A Review with Some Research Needs. Climate 2024, 12, 151. [Google Scholar] [CrossRef]
- Sanderman, J.; Woolf, D.; Lehmann, J.; Rivard, C.; Poggio, L.; Heuvelink, G. Soils Revealed Soil Carbon Futures. Harvard Dataverse 2020. [CrossRef]
- Seitz, D.; Fischer, L.M.; Dechow, R.; Wiesmeier, M.; Don, A. The Potential of Cover Crops to Increase Soil Organic Carbon Storage in German Croplands. Plant Soil. 2023, 488, 157–173. [Google Scholar] [CrossRef]
- Fohrafellner, J.; Keiblinger, K.M.; Zechmeister-Boltenstern, S.; Murugan, R.; Spiegel, H.; Valkama, E. Cover Crops Affect Pool Specific Soil Organic Carbon in Cropland—A Meta-Analysis. Eur. J. Soil. Sci. 2024, 75, e13472. [Google Scholar] [CrossRef]
- Poeplau, C.; Aronsson, H.; Myrbeck, Å.; Kätterer, T. Effect of Perennial Ryegrass Cover Crop on Soil Organic Carbon Stocks in Southern Sweden. Geoderma Reg. 2015, 4, 126–133. [Google Scholar] [CrossRef]
- Joshi, D.R.; Sieverding, H.L.; Xu, H.; Kwon, H.; Wang, M.; Clay, S.A.; Johnson, J.M.; Thapa, R.; Westhoff, S.; Clay, D.E. A Global Meta-Analysis of Cover Crop Response on Soil Carbon Storage within a Corn Production System. Agron. J. 2023, 115, 1543–1556. [Google Scholar] [CrossRef]
- Volungevicius, J.; Žydelis, R.; Amaleviciute-Volunge, K. Advancements in Soil Organic Carbon Mapping and Interpolation Techniques: A Case Study from Lithuania’s Moraine Plains. Sustainability 2024, 16, 5157. [Google Scholar] [CrossRef]
- Armolaitis, K.; Varnagirytė-Kabašinskienė, I.; Žemaitis, P.; Stakėnas, V.; Beniušis, R.; Kulbokas, G.; Urbaitis, G. Evaluation of Organic Carbon Stocks in Mineral and Organic Soils in Lithuania. Soil. Use Manag. 2022, 38, 355–368. [Google Scholar] [CrossRef]
- Kadžiulienė, Ž.; Šlepetienė, A.; Feizienė, D.; Amalevičiūtė-Volungė, K.; Armolaitis, K.; Bogužas, V.; Sinkevičienė, A.; Skinulienė, L. Anglies Sekvestracijos Potencialo Žemės Ūkyje Įvertinimas; Lithuania, 2019. Available online: https://zum.lrv.lt/uploads/zum/documents/files/4_%20LAMMC%20anglies%20sekvestracija%20galutin%C4%97(1).pdf (accessed on 15 July 2025).

| Data Group | Data Type | Source | Original Spatial Resolution | Units |
|---|---|---|---|---|
| Soil Data | Total initial 0–30 cm SOC stocks | ESDAC | 1 × 1 km | t C ha−1 |
| Clay content | ESDAC | 500 × 500 m | % | |
| Climate Data | Monthly precipitation | CRU | 0.5° | mm |
| Average monthly air temperature | CRU | 0.5° | °C | |
| Monthly potential evaporation | CRU | 0.5° | mm | |
| Satellite Data | Tillage raster | Sentinel-1/Author | 10 × 10 m | Binary: 1—applied, 0—not applied |
| Crop cover raster | Sentinel-2/Author | 10 × 10 m | Binary: 1—applied, 0—not applied | |
| Residue raster | Sentinel-2/Author | 10 × 10 m | Binary: 1—applied, 0—not applied | |
| Plant cover raster | MODIS | 500 × 500 m | Binary: 1—plant cover, 0—bare | |
| Other data | Depth | Constant: 30 | - | cm |
| Steps | Constant: 24 | - | - |
| Latitude | Longitude | Year | Month | Temp | Precip | Evap | Cbase | PC | DPM/RPMbase | Clay | Depth |
|---|---|---|---|---|---|---|---|---|---|---|---|
| 56.260449 | 23.078712 | 2019 | 1 | -3.7 | 55.8 | 0.3 | 0.5 | 0.0 | 1.44 | 10.08 | 30 |
| 56.260449 | 23.078712 | 2019 | 2 | 0.6 | 32.6 | 0.4 | 0.5 | 0.0 | 1.44 | 10.08 | 30 |
| 56.260449 | 23.078712 | 2019 | 3 | 2.6 | 55.0 | 0.9 | 0.5 | 0.0 | 1.44 | 10.08 | 30 |
| 56.260449 | 23.078712 | 2019 | 4 | 8.2 | 1.9 | 2.8 | 0.5 | 0.0 | 1.44 | 10.08 | 30 |
| 56.260449 | 23.078712 | 2019 | 5 | 12.3 | 56.1 | 2.9 | 0.5 | 1.0 | 1.44 | 10.08 | 30 |
| 56.260449 | 23.078712 | 2019 | 6 | 18.7 | 32.9 | 4.7 | 0.5 | 1.0 | 1.44 | 10.08 | 30 |
| 56.260449 | 23.078712 | 2019 | 7 | 16.9 | 95.5 | 3.6 | 0.5 | 1.0 | 1.44 | 10.08 | 30 |
| 56.260449 | 23.078712 | 2019 | 8 | 17.9 | 63.8 | 3.0 | 0.5 | 1.0 | 1.44 | 10.08 | 30 |
| 56.260449 | 23.078712 | 2019 | 9 | 13.1 | 69.5 | 1.8 | 0.5 | 1.0 | 1.44 | 10.08 | 30 |
| 56.260449 | 23.078712 | 2019 | 10 | 8.7 | 68.7 | 0.7 | 0.5 | 1.0 | 1.44 | 10.08 | 30 |
| 56.260449 | 23.078712 | 2019 | 11 | 4.3 | 53.0 | 0.3 | 0.5 | 1.0 | 1.44 | 10.08 | 30 |
| 56.260449 | 23.078712 | 2019 | 12 | 2.2 | 51.3 | 0.3 | 0.5 | 0.0 | 1.44 | 10.08 | 30 |
| 56.260449 | 23.078712 | 2020 | 1 | 2.3 | 50.6 | 0.3 | 0.5 | 0.0 | 1.44 | 10.08 | 30 |
| 56.260449 | 23.078712 | 2020 | 2 | 2.0 | 56.7 | 0.5 | 0.5 | 0.0 | 1.44 | 10.08 | 30 |
| 56.260449 | 23.078712 | 2020 | 3 | 3.3 | 42.2 | 1.2 | 0.5 | 0.0 | 1.44 | 10.08 | 30 |
| 56.260449 | 23.078712 | 2020 | 4 | 6.6 | 14.4 | 2.3 | 0.5 | 0.0 | 1.44 | 10.08 | 30 |
| 56.260449 | 23.078712 | 2020 | 5 | 10.1 | 49.5 | 3.0 | 0.5 | 1.0 | 1.44 | 10.08 | 30 |
| 56.260449 | 23.078712 | 2020 | 6 | 18.1 | 96.4 | 4.1 | 0.5 | 1.0 | 1.44 | 10.08 | 30 |
| 56.260449 | 23.078712 | 2020 | 7 | 17.1 | 89.7 | 3.6 | 0.5 | 1.0 | 1.44 | 10.08 | 30 |
Disclaimer/Publisher’s Note: The statements, opinions and data contained in all publications are solely those of the individual author(s) and contributor(s) and not of MDPI and/or the editor(s). MDPI and/or the editor(s) disclaim responsibility for any injury to people or property resulting from any ideas, methods, instructions or products referred to in the content. |
© 2025 by the authors. Licensee MDPI, Basel, Switzerland. This article is an open access article distributed under the terms and conditions of the Creative Commons Attribution (CC BY) license (https://creativecommons.org/licenses/by/4.0/).
Share and Cite
Metrikaitytė Gudelė, G.; Sužiedelytė Visockienė, J. Quantifying Soil Carbon Sequestration Potential Through Carbon Farming Practices with RothC Model Adapted to Lithuania. Land 2025, 14, 1497. https://doi.org/10.3390/land14071497
Metrikaitytė Gudelė G, Sužiedelytė Visockienė J. Quantifying Soil Carbon Sequestration Potential Through Carbon Farming Practices with RothC Model Adapted to Lithuania. Land. 2025; 14(7):1497. https://doi.org/10.3390/land14071497
Chicago/Turabian StyleMetrikaitytė Gudelė, Gustė, and Jūratė Sužiedelytė Visockienė. 2025. "Quantifying Soil Carbon Sequestration Potential Through Carbon Farming Practices with RothC Model Adapted to Lithuania" Land 14, no. 7: 1497. https://doi.org/10.3390/land14071497
APA StyleMetrikaitytė Gudelė, G., & Sužiedelytė Visockienė, J. (2025). Quantifying Soil Carbon Sequestration Potential Through Carbon Farming Practices with RothC Model Adapted to Lithuania. Land, 14(7), 1497. https://doi.org/10.3390/land14071497