Article

Supply–Demand Assessment of Cultural Ecosystem Services in Urban Parks of Plateau River Valley City: A Case Study of Lhasa

1
School of Landscape Architecture, Beijing Forestry University, No. 35 Qinghua East Road, Haidian District, Beijing 100083, China
2
National Engineering Research Center for Forestry and Grassland Landscape Architecture, No. 35 Qinghua East Road, Haidian District, Beijing 100084, China
*
Author to whom correspondence should be addressed.
Land 2025, 14(6), 1301; https://doi.org/10.3390/land14061301
Submission received: 7 May 2025 / Revised: 14 June 2025 / Accepted: 15 June 2025 / Published: 18 June 2025

Abstract

Cultural ecosystem services (CES) in urban parks, as a vital component of urban ecosystem services (ES), are increasingly recognized as an important tool for advancing urban sustainability and implementing nature-based solutions (NbS). The supply–demand relationship of CES in urban parks is strongly shaped by sociocultural and spatial geographic factors, playing a crucial role in optimizing urban landscape structures and enhancing residents’ well-being. However, current research generally lacks adaptive evaluation frameworks and quantitative methods, particularly for cities with significant spatial and cultural diversity. To address this gap, this study examines the central district of Lhasa as a case study to develop a CES supply–demand evaluation framework suitable for plateau river valley cities. The study adopts the spatial integration analysis method to establish an indicator system centered on “recreational potential–recreational opportunities” and “social needs–material needs,” mapping the spatial distribution and matching characteristics of supply and demand at the community scale. The results reveal that: (1) in terms of supply–demand balance, 25.67% of communities experience undersupply, predominantly in the old city cluster, while 16.22% experience oversupply, mainly in key development zones, indicating a notable supply–demand imbalance; (2) in terms of supply–demand coupling coordination, 55.11% and 38.14% of communities are in declining and transitional stages, respectively. These communities are primarily distributed in near-mountainous and peripheral urban areas. Based on these findings, four urban landscape optimization strategies are proposed: culturally driven urban park development, demand-oriented park planning, expanding countryside parks along mountain ridges, and revitalizing existing parks. These results provide theoretical support and decision-making guidance for optimizing urban park green space systems in plateau river valley cities.

1. Introduction

Cultural ecosystem services (CES) in urban parks are a crucial component of urban ecosystem services (ES), playing a significant role in advancing urban sustainability and the implementation of nature-based solutions (NbS) [1,2,3,4]. As important green spaces in urban areas, parks play a key role in promoting residents’ well-being and physical and mental health [5,6], providing a variety of environmental, social, and cultural benefits. These benefits, whether direct or indirect, are recognized as ecosystem services [7,8]. The Millennium Ecosystem Assessment (2005) categorizes these services into provisioning, regulating, cultural, and supporting services [9,10]. Among them, cultural ecosystem services (CES) refer to the non-material benefits that people derive from natural or semi-natural ecosystems, and are described in dimensions such as aesthetics, recreation, inspiration, research and education, and cultural heritage value [11]. These services reflect the emotional connection and cultural identity that human societies have with the natural environment. In urban ecosystem services, CES have the characteristic of transcending the boundaries of green spaces. However, urban parks, as focal points for ecological, social, and cultural functions, also serve as accessible and frequent spaces where residents experience the benefits of CES in their daily lives, making research on CES particularly relevant and significant in practice. Such research is crucial for addressing and managing urban natural environments, contributing to the integration of multifunctional ecosystems and their services into urban landscapes. It also raises the awareness of urban residents and planners, ultimately positively influencing urban sustainability [3,4,12].
With the acceleration of urbanization [13], the expansion of urban parks in central districts struggles to meet the demand driven by population growth [14], particularly in areas characterized by high geographical and cultural heterogeneity. Issues such as uneven distribution of park green spaces and mismatched supply and demand are common, severely affecting urban ecological functions and residents’ well-being. As a key provider of “near nature” and major CES within urban ecosystems [15,16], the assessment of CES supply and demand in urban parks has become a critical reference for urban planning, ecological governance, and municipal services [17]. However, due to the complexity of urban park CES, including cultural diversity and complex spatial characteristics [3,8], this field of research has not yet been fully developed, and its practical applications remain promising [7]. Particularly, the quantification of park CES supply and demand faces significant challenges due to the intangible, subjective, and often ambiguous boundaries of CES, making the identification and quantification of these services especially complex [8]. Many studies currently focus only on the supply side of park CES, with a lack of comprehensive research on the matching of supply and demand, especially in terms of spatial explicitness [18,19,20].
In CES assessment, non-monetary qualitative evaluation is considered one of the primary methods [7]. Among these, the observational method [7] and social media-based method [21] are associated with revealed preferences, where the value of CES is assessed by observing behaviors or analyzing texts, photos, and other documents that represent preferences. Meanwhile, stated preference methods are also widely used to directly obtain CES evaluations from the public, including interviews [22], questionnaires [23], and participatory mapping [24]. Since CES assessments for all types of parks in central urban areas are subjective processes, a single method is insufficient to fully capture the supply and demand characteristics [19]. Therefore, a hybrid evaluation framework combining revealed and stated preferences should be adopted, integrating remote sensing imagery, field surveys, POI platform data, and official statistics, developing multidimensional indicators to quantify the structural and cultural functions of parks. This approach retains the objectivity of spatial analysis while incorporating cultural perceptions into the model through operational metrics. By bridging qualitative non-monetary evaluation with quantitative methods, the framework can enhances the scientific rigor and practical applicability of CES assessments [7,25].
According to the Common International Classification of Ecosystem Services (CICES), most current studies on the value of CES in urban parks focus on recreational and aesthetic benefits, followed by cultural heritage value, while educational and inspirational values are seldom examined [26]. In supply-side evaluations, indicators such as park area and degree of naturalness are commonly used to represent aesthetic value [27,28]. Recreational value is primarily associated with the proportion of activity-friendly areas, such as plazas and water bodies. Cultural heritage is reflected in landscape elements that embody local historical characteristics and contribute to the park’s regional service advantages [29]. Educational and inspirational values enhance human–nature connections, fostering interest and empathy toward parks [30]. However, there remains a lack of multidimensional indicator systems capable of capturing the differences in park CES value across urban areas, especially in the assessment of cultural heritage, education, and inspiration [31]. In addition, accessibility is a prerequisite for converting the potential supply of park green spaces into actual services perceived by residents, as it reflects the ease with which people can obtain CES [19,26]. While some studies have included accessibility in supply–demand frameworks, most lack assessments of spatial coverage at the community scale. Such assessment is crucial for measuring the proportion of different accessibility zones relative to total residential area and for assessing the efficiency of service flow between supply and demand. This enables a more realistic measurement of CES supply aligned with actual use, helping to overcome limitations in locational analysis and spatial expression of service potential [32,33]. Regarding demand evaluation, social demand focuses on reflecting the demand for CES from communities and resident groups. Material demand emphasizes the demand for parks driven by commercialization and development processes across different regions. By combining both aspects, these indicators provide a comprehensive understanding of the demand structure for park CES, accurately capturing regional demand differences across multiple dimensions, thus informing evidence-based urban park planning [26,34].
Current research on the supply and demand of CES in parks mainly focuses on metropolitan areas in plains, mountain, or coastal regions [19,24,35,36], without considering the connection between the assessment frameworks and the characteristics of the urban area. However, existing studies have shown that sociocultural diversity and geographic environment significantly influence park CES, subtly guiding park use and residents’ demand [37]. As a result, the applicability of existing assessment frameworks and indicator systems is limited for cities with high spatial heterogeneity and cultural specificity [38], such as Lhasa. In this context, developing regionally adaptive assessment methods, especially for plateau river valley cities, will contribute to deeper exploration of park CES and provide valuable insights for other cities.
As the capital of the Tibetan Plateau and a national historical and cultural city, Lhasa has a unique geographical, cultural, and ecological background. The city’s narrow, strip-shaped multi-cluster spatial structure is constrained by mountains on both sides of the river valley. Due to the limited urban construction land in the central urban area [39], the quantity of parks is relatively insufficient and unevenly distributed. With the increasing demand for park services by residents, the phenomenon of supply–demand mismatch in CES has become more pronounced. This study examines the central urban area of Lhasa, a plateau river valley city, as the research area, using street communities as the research unit. The study integrates spatial mapping, network analysis, and spatial overlay analysis to quantify the CES supply–demand levels in the central urban area of Lhasa, selecting both objective environmental and socio-economic indicators for analysis, establish an indicator system centered on “recreational potential—recreational opportunities” and “social needs—material needs”. Based on this, the study assesses the spatial distribution and matching characteristics of CES supply and demand at the community scale and proposes CES optimization strategies. The results can provide valuable reference for the rational allocation and planning of parks in the central urban area of Lhasa. The objectives of this study are: (1) to develop an index system adapted to plateau river valley cities for quantifying urban park CES supply capacity, providing a more accurate tool for assessing park CES; (2) to conduct urban park CES spatial mapping at the community scale, improving the readability and interpretability of CES spatial distribution characteristics; (3) to identify CES supply–demand matching characteristics and propose CES-guided urban park layout optimization strategies, ensuring the resolution of identified mismatches. Through this research, the significance of the study lies in providing theoretical support and practical guidance for improving the supply–demand matching of park CES and optimizing urban landscape planning in plateau river valley cities.

2. Study Area and Data Processing

2.1. Study Area

Lhasa, located in the heart of the Qinghai–Tibet Plateau at coordinates 91°06′ to 94°00′ east longitude and 29°36′ to 31°00′ north latitude, has an average elevation of 3650 m. As a representative plateau river valley city, Lhasa is traversed by the Lhasa River, with the terrain gradually descending from the north to the south. The city’s valley exhibits a distinctive spatial pattern of “two mountains surrounding a valley, blending natural features with urban areas.” To the north lie the Nyenchen Tanglha Mountains, while the south is bordered by the Guo Kara Riju Mountain Range. The central and southern areas consist of the flat Lhasa River valley plain. Influenced by its mountainous terrain and river courses, Lhasa’s central urban area has developed a spatial structure featuring “one core, two wings, and multiple centers and clusters.” This area is home to key natural landscapes, such as the Northern and Southern Mountains, Lalu Wetland, and the Lhasa River Scenic Area. It is also a crucial hub for preserving Tibetan culture and integrating the diverse cultures of various ethnic groups. Landmark historical sites, including the Potala Palace, Jokhang Temple, and Norbulingka, are located within the city. This study focuses on the central urban area of Lhasa, as defined in the “Lhasa City Territorial Spatial Master Plan (2021-2035).” The study area covers 360.08 square kilometers and includes one central urban core (Chengguan District), two sub-centers (Duilong District and Dazi District), 20 distinct clusters, and 75 communities (Figure 1).

2.2. Data Sources

The data used in this study primarily consists of multi-source spatial vector data and socio-economic data: (1) Park data were sourced from the park directory in the “Lhasa Green Space System Plan (2021–2035).” These data were combined with high-resolution Google imagery and field surveys. After conducting geometric corrections, removing duplicates, and merging the data, 113 parks built before 2022 were identified. Based on the “Standard for classification of urban green space (CJJ/T85-2017) [40]”, these parks were categorized into four types: comprehensive parks, specialized parks, recreational parks, and community parks (Figure 2). (2) Land use data came from China’s 30 m resolution remote sensing monitoring data (https://www.gis5g.com, accessed on 2 February 2025). (3) DEM data (30 m resolution) were obtained from NASA Earthdata (https://search.earthdata.nasa.gov/search, accessed on 2 February 2025). (4) NDVI data (30 m spatial resolution) were sourced from the Chinese Academy of Sciences Ecological Data Center (https://www.nesdc.org.cn, accessed on 2 February 2025). (5) Transportation network data were obtained from the OpenStreetMap website (https://www.openstreetmap.org, accessed on 2 February 2025). (6) Population data (1 km resolution) were sourced from the WorldPop website (https://www.worldpop.org, accessed on 2 February 2025). (7) Data on commercial services and park entrance points of interest were extracted from Amap using Python 3.13.

3. Methods

This study focused on the geographical and cultural characteristics of plateau river valley cities to construct an evaluation system for the supply and demand of urban parks CES in central urban area in Lhasa. The study analyzed the spatial distribution and matching characteristics of supply and demand at the community level. This study, guided by the goals of indicator quantification, spatial mapping, and supply–demand assessment, follows three methodological steps: (1) From the aspects of recreational potential and recreational opportunities, a total of eight and two core indicators were selected, respectively, based on five categories of cultural service values and residents’ travel modes to quantify CES supply levels. Two core indicators from each of the social and material demand dimensions were selected to quantify CES demand levels. (2) At the community scale, the spatial distribution of both individual and composite indicators of CES supply and demand was mapped using spatial overlay analysis. (3) The supply–demand ratio method and the coupling coordination degree model [41,42] were employed to assess supply–demand balance and coordination, identify problematic communities, and propose optimization strategies (Figure 3).

3.1. Quantification of CES Supply and Demand Indicators

3.1.1. Quantification of CES Supply Indicators

The potential supply of CES from urban parks represents the total CES these spaces can provide. The supply level depends on both the potential for service provision and the accessibility of recreational opportunities [43]. Building on previous studies, this research constructed a CES supply quantification framework based on two key dimensions: recreational potential and recreational opportunities [44] (Table 1).
1. In terms of recreational potential, this study was based on the cultural service environment of Lhasa, referencing the MEA report. From five service categories—aesthetic value, recreational value, inspirational value, scientific education value, and cultural heritage value—eight indicators were selected for evaluation. Consistent with previous studies, the focus remains on aesthetic and recreational values [25]. Considering the geographical characteristics of plateau river valley cities and the local residents’ cultural relationship with nature, the visibility and proximity of mountains and water were incorporated into the evaluation framework. Moreover, previous studies on inspirational, scientific education, and cultural heritage values often relied on broad data that were inadequate for capturing specific urban elements, such as cultural relics, monuments, and historic buildings [45]. To improve the precision of this evaluation, data was collected from government documents, field research, and publicly available information from websites (Figure 4).
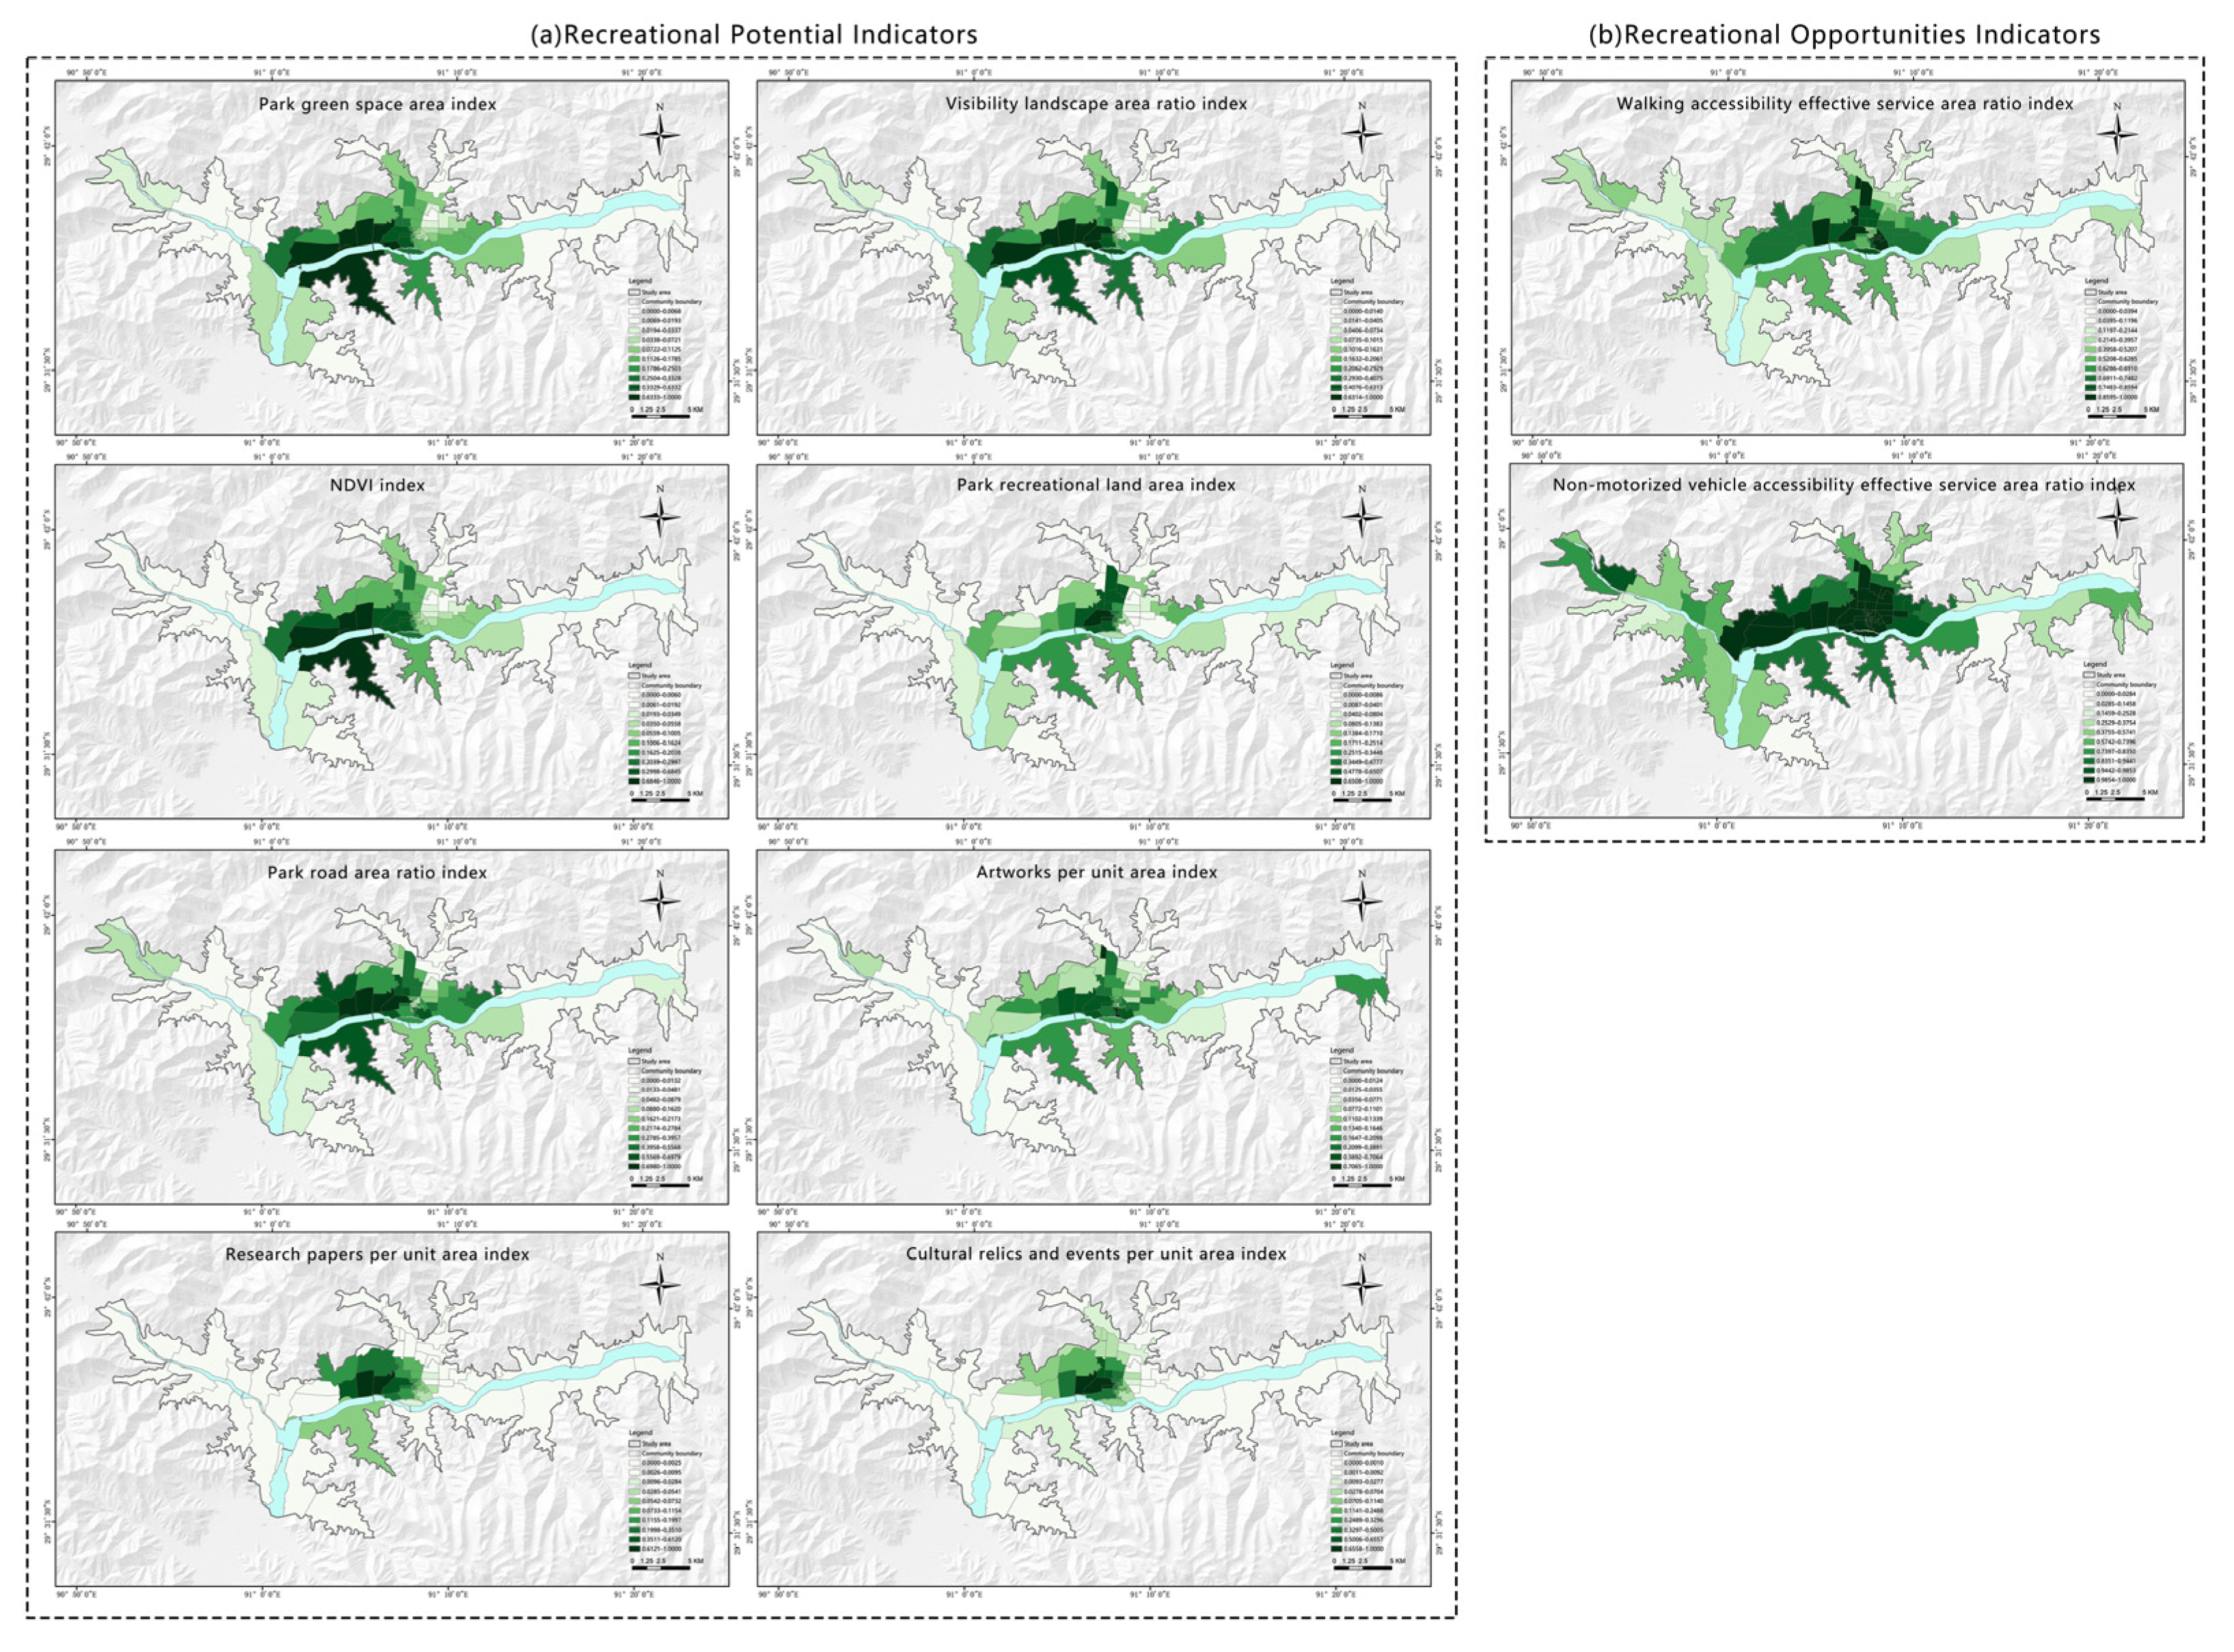
  • Large parks have more complex landscape compositions (such as woodlands, grasslands, water bodies, and built facilities), thereby enhancing landscape element diversity [12]; a higher proportion of visible landscape area allows visitors to have a broader visual exposure to the scenery [46]. High NDVI values typically indicate lush vegetation, which is considered by people to have greater visual appeal [47,48]. These three indicators serve as key measures for assessing the aesthetic value of urban parks. Among them, the proportion of visible landscape area is determined using the landscape visibility function in ArcGIS. The analysis utilized the 2022 DEM of Lhasa to calculate the ratio of each park’s visible mountain and water landscape area to its total green space area.
  • Recreational land in park includes lawns, sand areas, squares, and water bodies. The larger the proportion of these areas, the more space is available for recreation, making the park more accessible [45]. Additionally, the greater the proportion of road area within the park, the more abundant the open spaces for activities such as walking and running. These two indicators were selected to evaluate the recreation value of parks. Using the “Lhasa Green Space System Plan (2021–2035)” as a reference, high-resolution satellite imagery was analyzed to obtain relevant data and assess the park recreational service capacity.
  • The inspirational value of urban park is primarily reflected in artworks within the parks, such as sculptures and inscriptions. Data for this was gathered through field surveys and records of park green spaces, with the number of artworks per unit area used to assess this value.
  • The scientific education value is primarily reflected in the number of research papers focusing on park green spaces. Published Chinese papers are retrieved from the China Journal Full-text Database (https://www.cnki.net, accessed on 5 January 2025), while English-language publications are sourced from Web of Science (https://webofscience.clarivate.cn, accessed on 5 January 2025). The number of research papers published per unit area was used for evaluation.
  • Lhasa is home to many historically significant urban parks with rich cultural heritage, offering substantial cultural heritage services. This value is reflected by the number of cultural relics and events per unit area. Data were collected from the Lhasa City Historical and Cultural City Protection Plan outlined in the “Lhasa City Land and Space Overall Plan (2021–2035),” the “National Representative List of Intangible Cultural Heritage” (https://www.ihchina.cn, accessed on 5 January 2025), and park introductions.
2. In terms of recreational opportunities, considering the travel habits of local residents, the accessibility of urban parks was measured by the ratio of effective service area for walking and non-motorized vehicles. The calculation involves both accessibility and effective service area ratio. Accessibility is a key factor in converting the potential recreational opportunities of urban green spaces into actual CES provision, reflecting the ease with which residents can access CES, measured by absolute time values [44]. This study used a network analysis model to calculate urban parks accessibility based on two modes of transportation: walking and non-motorized vehicles, reflecting the most commonly used travel modes by local residents. Following the “Standard for planning of urban green spaces (GB/T51346-2019)” [47] and the concept of living circles, accessibility was categorized into three levels based on time costs: 5 min, 10 min, and 15 min, with values of 1, 0.5, and 0.33, respectively [49,50]. The calculated accessibility data were combined with residential area data in Lhasa’s central urban area. The accessibility calculation results were overlaid with the residential area of Lhasa’s central urban district. By summing up the effective service areas corresponding to different travel times for residents, the final walking and non-motorized vehicle effective service area ratio can be obtained. The calculation formula is as follows:
W A = ( S 5 W 1 + S 10 W 0.5 + S 15 W 0.33 ) / S
B A = ( S 5 B 1 + S 10 B 0.5 + S 15 B 0.33 ) / S
where W A and W A represent the effective service area ratios for walking and non-motorized vehicles, and S 5 W , S 10 W , S 15 W , S 5 B , S 10 B , S 15 B   represent the effective service areas for residents with different time costs. S is the community unit area.
3. The data for each indicator was normalized using the range method. Assuming that recreational potential and recreational opportunities were of equal importance, the Entropy Weight Method (EWM) was used to calculate the weight of each indicator. The calculation formula for the CES supply of parks was as follows:
S = R + A 0.5
R = 0.086 P A + 0.088 P N + 0.055 R V + 0.135 R W + 0.017 R R + 0.1 R I + 0.31 R A + 0.21 R H
A = 0.874 W A + 0.126 B A
where S represents the CES supply of parks, and R and A represent the recreational potential and recreational opportunities of the parks. The variables are defined as follows:
PA: Park area index.
RV: Visibility landscape area ratio index.
PN: NDVI index.
RW: Park recreational land area index.
RR: Park road area ratio index.
RI: Artworks per unit area index.
RA: Research papers per unit area index.
RH: Cultural relics and events per unit area index.
WA: Walking accessibility effective service area ratio index.
BA: Non-motorized vehicle accessibility effective service area ratio index.
To calculate the CES provided by parks to the community, the radius delivery method was used to quantify the value of S provided to t the community [19], as follows:
S d = S ,   0 d 1 3 r 2 3 S ,   1 3 r < d 2 3 r 1 3 S ,   2 3 r < d r
where S d is the supply value at a distance d (0 ≤ dr), S is the park’s supply value, and r is the service radius. The park service radius, r, used in this study is based on the service radius standards for different park types (comprehensive parks, specialized parks, recreational parks, and community parks) as outlined in the “Lhasa Green Space System Plan (2021-2035)” and the “Standard for classification of urban green space (CJJT85-2017) [40].” These standards are shown in Table 2.

3.1.2. Quantification of CES Demand Indicators

The CES demand measurement system was based on the relevant research framework, from the two dimensions of social demand and material demand [34], four specific indicators are selected. (1) The social demand dimension included two basic indicators: population density and population activity intensity. (2) The material demand dimension included two indicators: commercial service capacity and development and construction intensity (Table 3). The specific formula is as follows.
D = P D + H A I L S + S D + B D
where D represents the demand for CES in urban parks, PD is the population density, calculated using population raster data; SD is the density of commercial services, based on POI data, obtained by applying kernel density analysis; BD is the intensity of development and construction, calculated by the ratio of all construction land within the region; HAILS is the intensity of human activities in the surface layer of the land, with reference to Xu Y., who divided land use into cropland, forest land, and forest land; and D is the intensity of human activities in the surface layer of the land. It is divided into six categories: arable land, forest land, grassland, water, construction land and unused land, and its equivalent conversion coefficients of construction land are 0.2, 0, 0.067, 0.6 [51], 1 and 0, respectively, and the magnitude of the coefficients reflects the magnitude of the intensity of human activities in each land use type.

3.2. Identification of CES Supply–Demand Matching Characteristics

The supply–demand ratio method was used to classify CES supply–demand matching types [52], reflecting the supply–demand equilibrium relationship of communities. Communities were categorized as supply excess, supply–demand balance, and supply lag, where the supply–demand balance was divided into high-level balance and low-level balance.
The supply–demand coupling coordination degree (CCD) was analyzed using a coupling coordination model [53], which was commonly used to measure the mutual influence and coordination consistency between two or more variables. In this study, it was employed to indicate the degree and trend of synergistic development between urban parks supply and demand, reflecting the coupling of development speed and direction. Based on the calculation results, the coupling coordination degree was divided into three categories to indicate the development status of CES supply and demand at the community level: coordinated development, transitional development, and uncoordinated and declining. The formula is as follows [54].
C = n u 1 × u 2 × u 3 u n u i + u j k 1 k = 2 u 1 u 2 u 1 + u 2
T = α u 1 + β u 2
D = C × T
In the formula, C is for the coupling of supply and demand, u1, u2, respectively, said for the supply and demand index, the distribution of both intervals are [0, 1], T is for the coordination index, taking the value of the range of [0, 1]; α , β are for the coefficient to be determined. According to the previous relevant research, the parks supply and demand for the two types of indicators are considered to be equally important, and α and β are taken as the value of 0.5; D is for the coupling coordination degree of supply and demand, with the range in value of [0, 1]; a D that is bigger indicates that the coupling of supply and demand co-ordination is higher, and with reference to the relevant literature will be divided into 10 levels and 3 types of coupling and coordinated development.
To determine the classification thresholds for the CES supply–demand ratio and the coupling coordination degree, this study applied four data classification methods based on the characteristics of the dataset: K-means clustering, Z-score normalization, Jenks natural breaks, and the interquartile range (IQR) method. The optimal classification thresholds were identified through the following steps: (1) Sensitivity analysis was conducted to assess the robustness of each classification method. Four sets of classification data were subjected to perturbations ranging from ±1% to ±16%, and the classification procedures were repeated using the four methods. (2) The Kappa coefficient was used as the sensitivity analysis metric. By plotting the trend of Kappa values under different levels of perturbation, the classification method demonstrated the highest stability and lowest volatility was selected.

4. Results

4.1. Spatial Distribution of Urban Park CES in Central Urban Areas

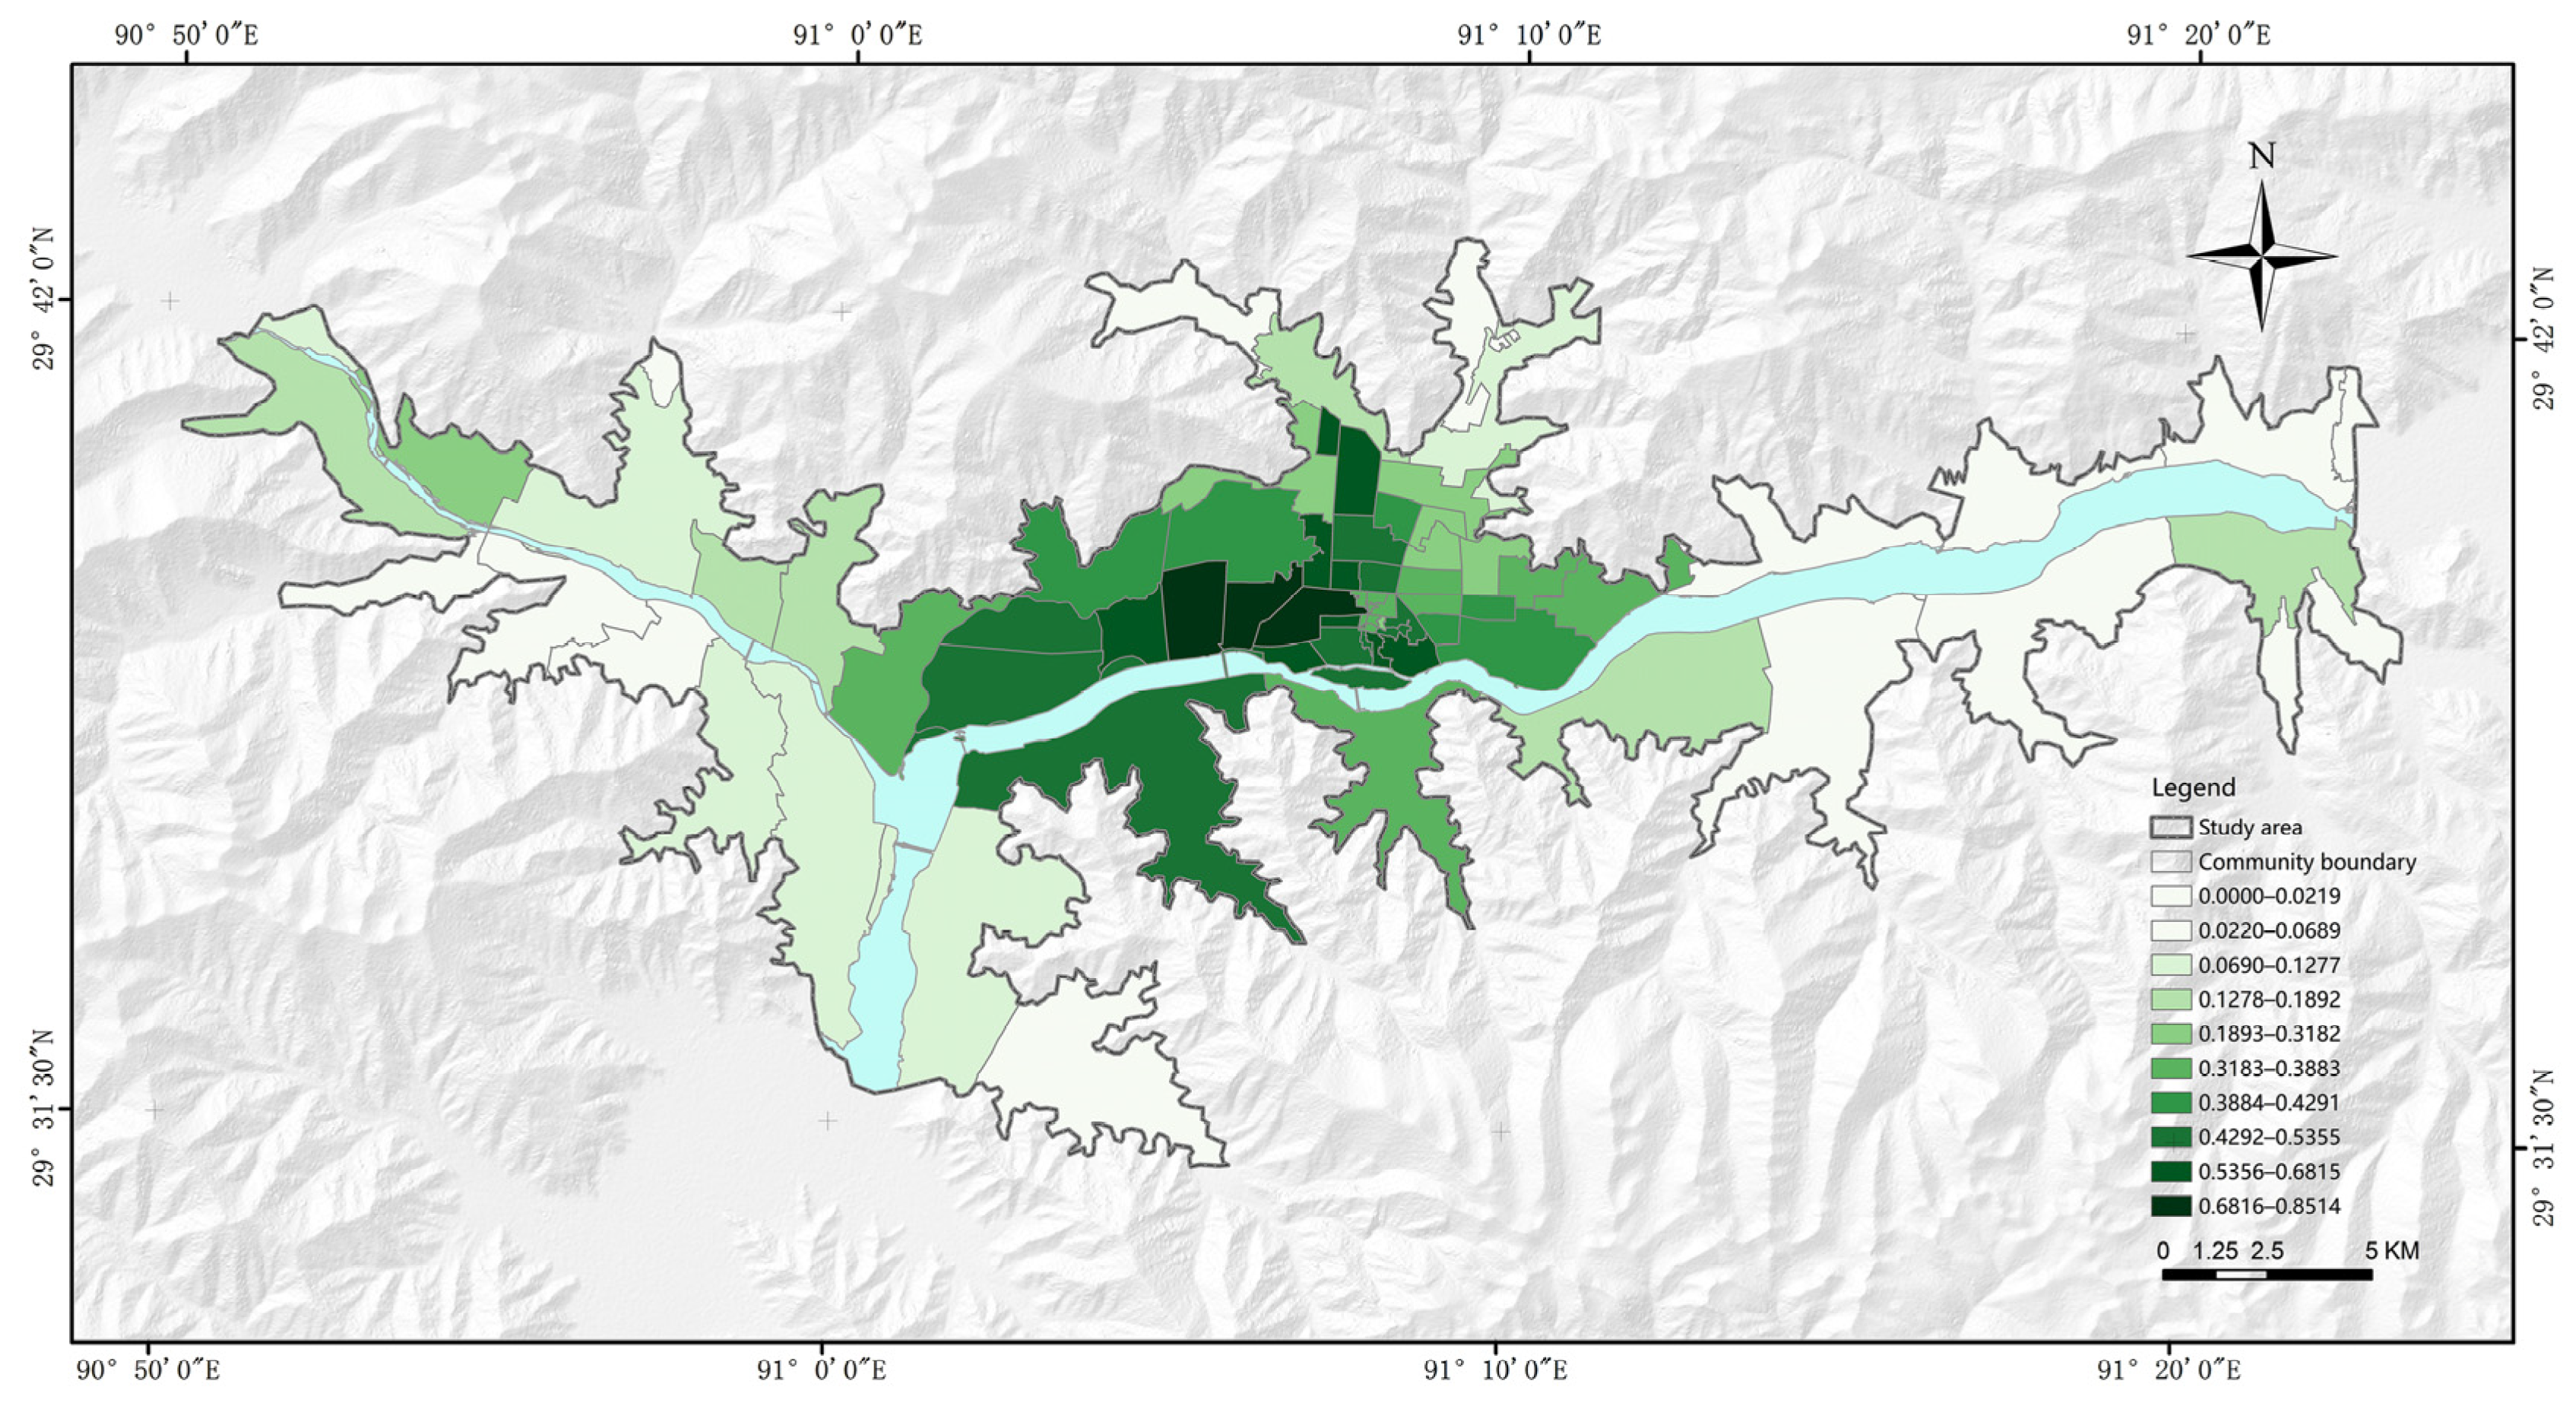
4.1.1. Spatial Distribution of CES Supply

The spatial distribution of CES supply for urban park in central urban area of Lhasa is shown in Figure 5 and Figure 6, presenting a spatial pattern of high in the middle, low in the east and west wings, and distributed along the river. High-supply communities are primarily concentrated in the western part of the Old City Cluster, the southern part of the Nyange Cluster, the Two Island Street Cluster, and the West City Cluster. Medium-supply communities are predominantly located on the periphery of the city center and in the key development area at the confluence of the three forks, which includes the Eastern New City Cluster, the southern part of the Duodi Cluster, the Cijueling Culture Cluster, the northern part of the Lhasa National High-tech Zone (LNHZ), and the Lhasa Economic and Technological Development Zone (LETDZ). Low-supply communities are primarily located in peripheral zones and underdeveloped new urban areas distant from the city center, including the Dulong New City Cluster, Dulong Industrial Cluster, Comprehensive Bonded Area Cluster, LNHZ (central and south) Cluster, Education New City Cluster, Dazi Central City Cluster, Dazi New City Cluster, Yeba Cluster, Puxiong Cluster, Gangdui Cluster, and others. It is worth noting that extremely high values appear in the Potala Palace and Norbulingka areas in the core area of the old city. These areas are affected by historical development, retaining more historical and cultural gardens with perfect integrated functions, providing greater recreational potential and more opportunities, and the level of supply is significantly higher than that of other areas. The extremely low values appear in the near-mountain valley areas far away from the city center, affected by the terrain, with a lower intensity of development and construction, and the level of supply is generally lower than downtown.

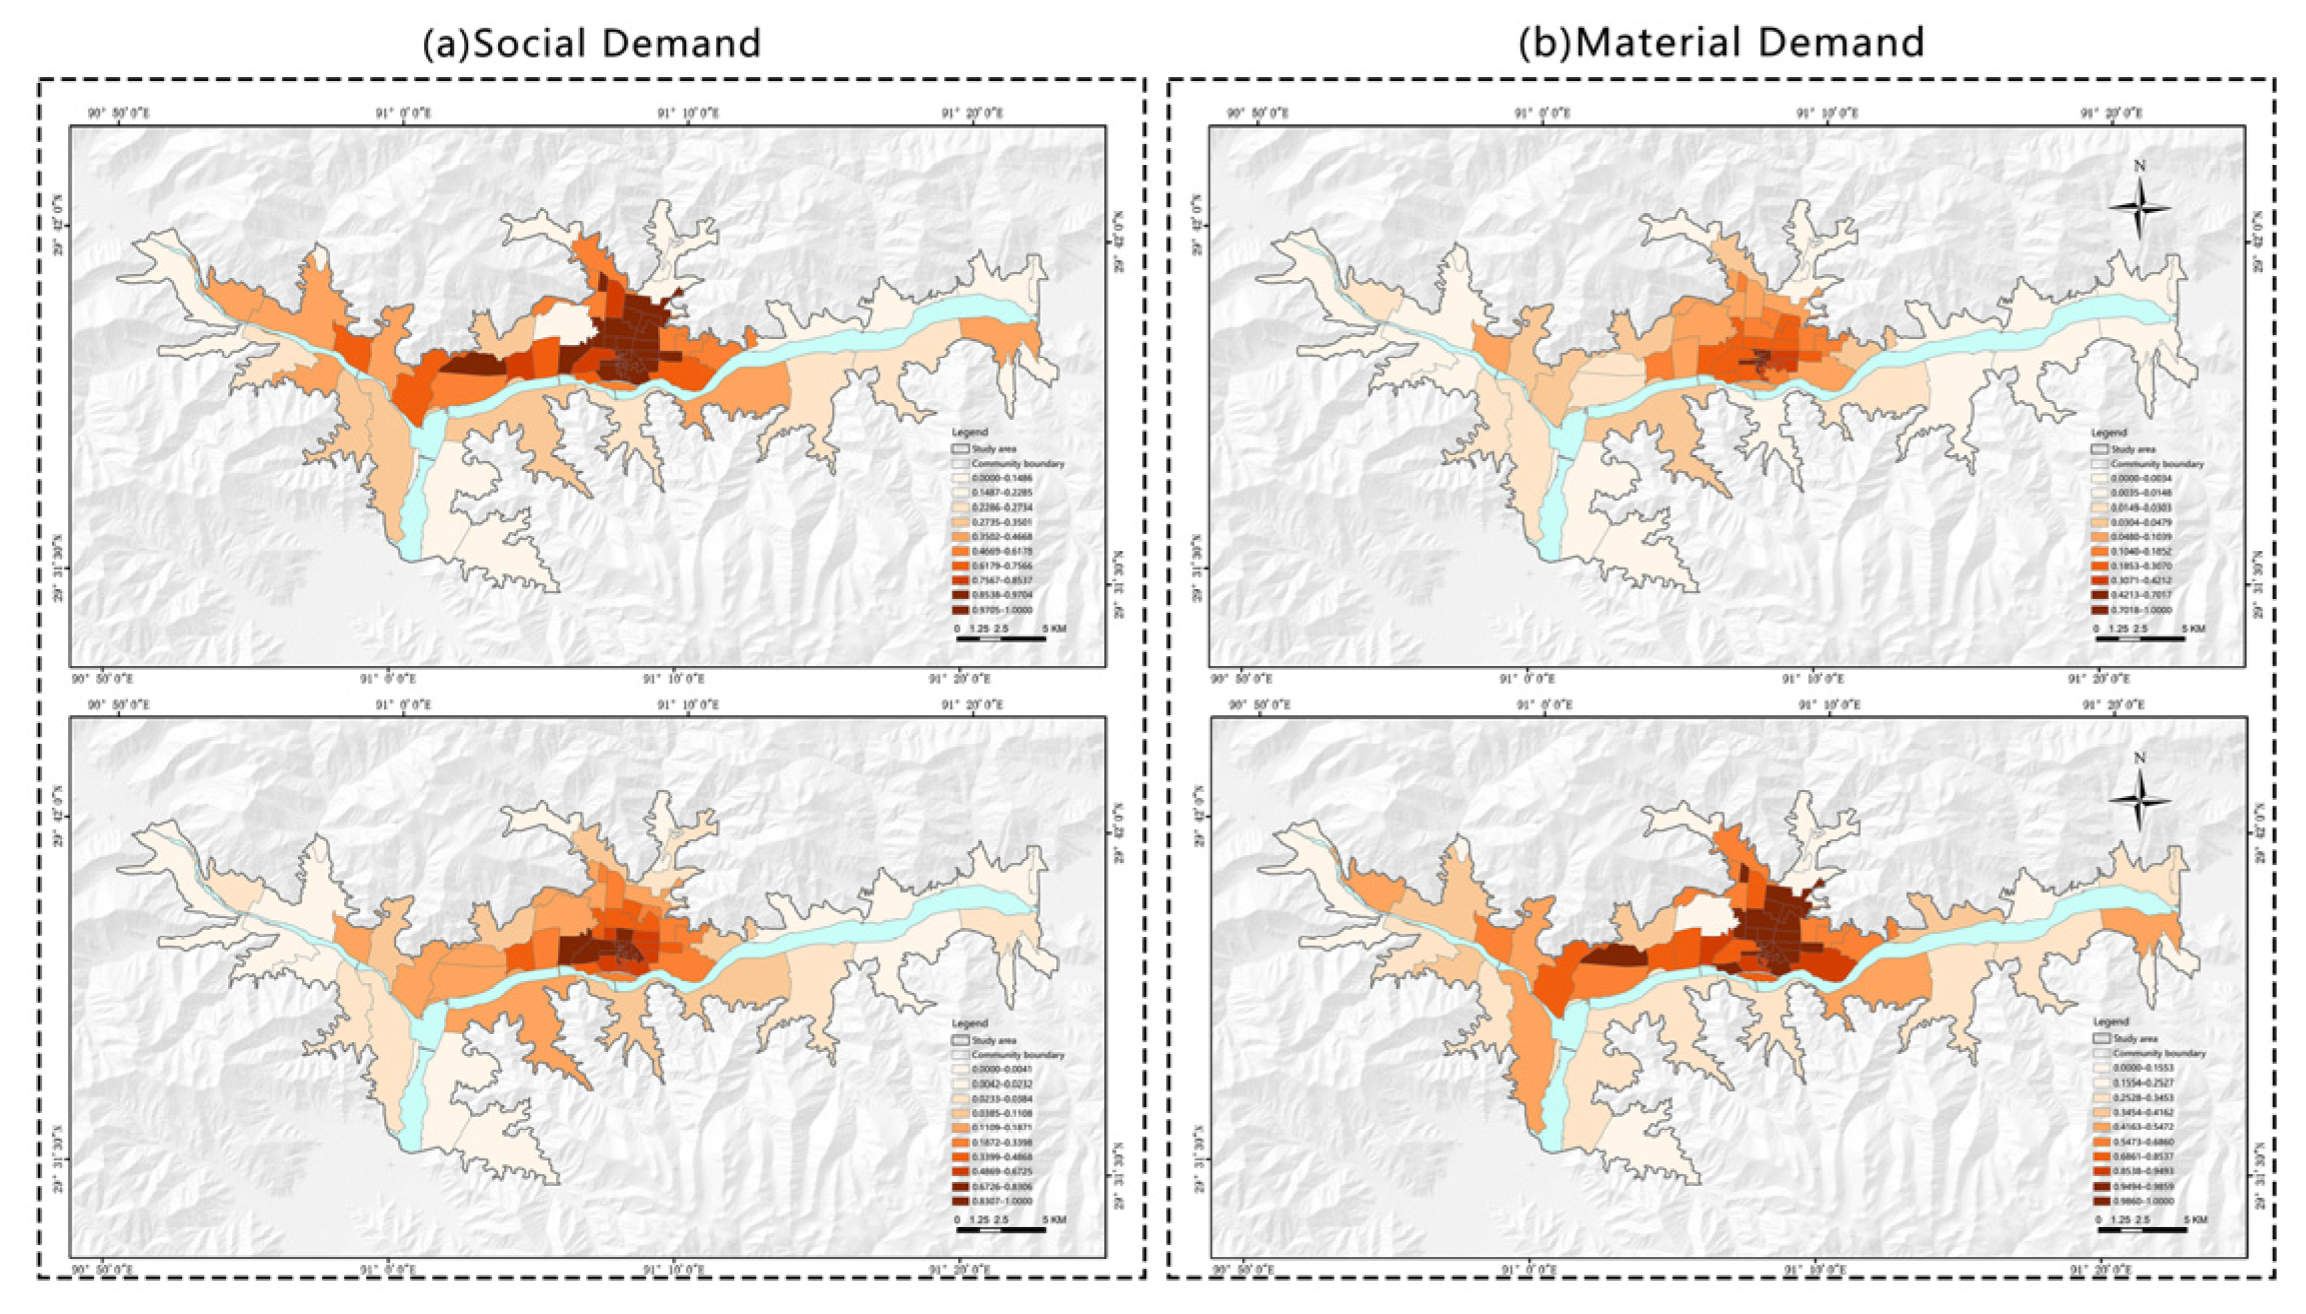
4.1.2. Spatial Distribution of CES Demand

The spatial distribution of CES demand for urban park in central urban area of Lhasa presents the distribution characteristics of high in the center, low in the surrounding area, and decreasing in a stepwise manner along the east and west directions. As shown in Figure 7 and Figure 8, the four types of service demand, namely, human activity intensity, population density, commercial service capacity, and development and construction intensity, show a tendency to gather towards the main and sub-centers of the city. High-demand communities are distributed in the population gathering area of the main center of the city, with the largest value appearing in the Barkhor Street area of the core group of the old city. Medium-demand communities are mainly distributed in the population gathering area around the Barkhor Street area, as well as in the eastern new city group and western city group, which are the focus of the development of the city of Lhasa. Low-demand communities are widely distributed in the suburbs of north and south mountain where the density of the population is relatively low, as well as in some of the new city areas.

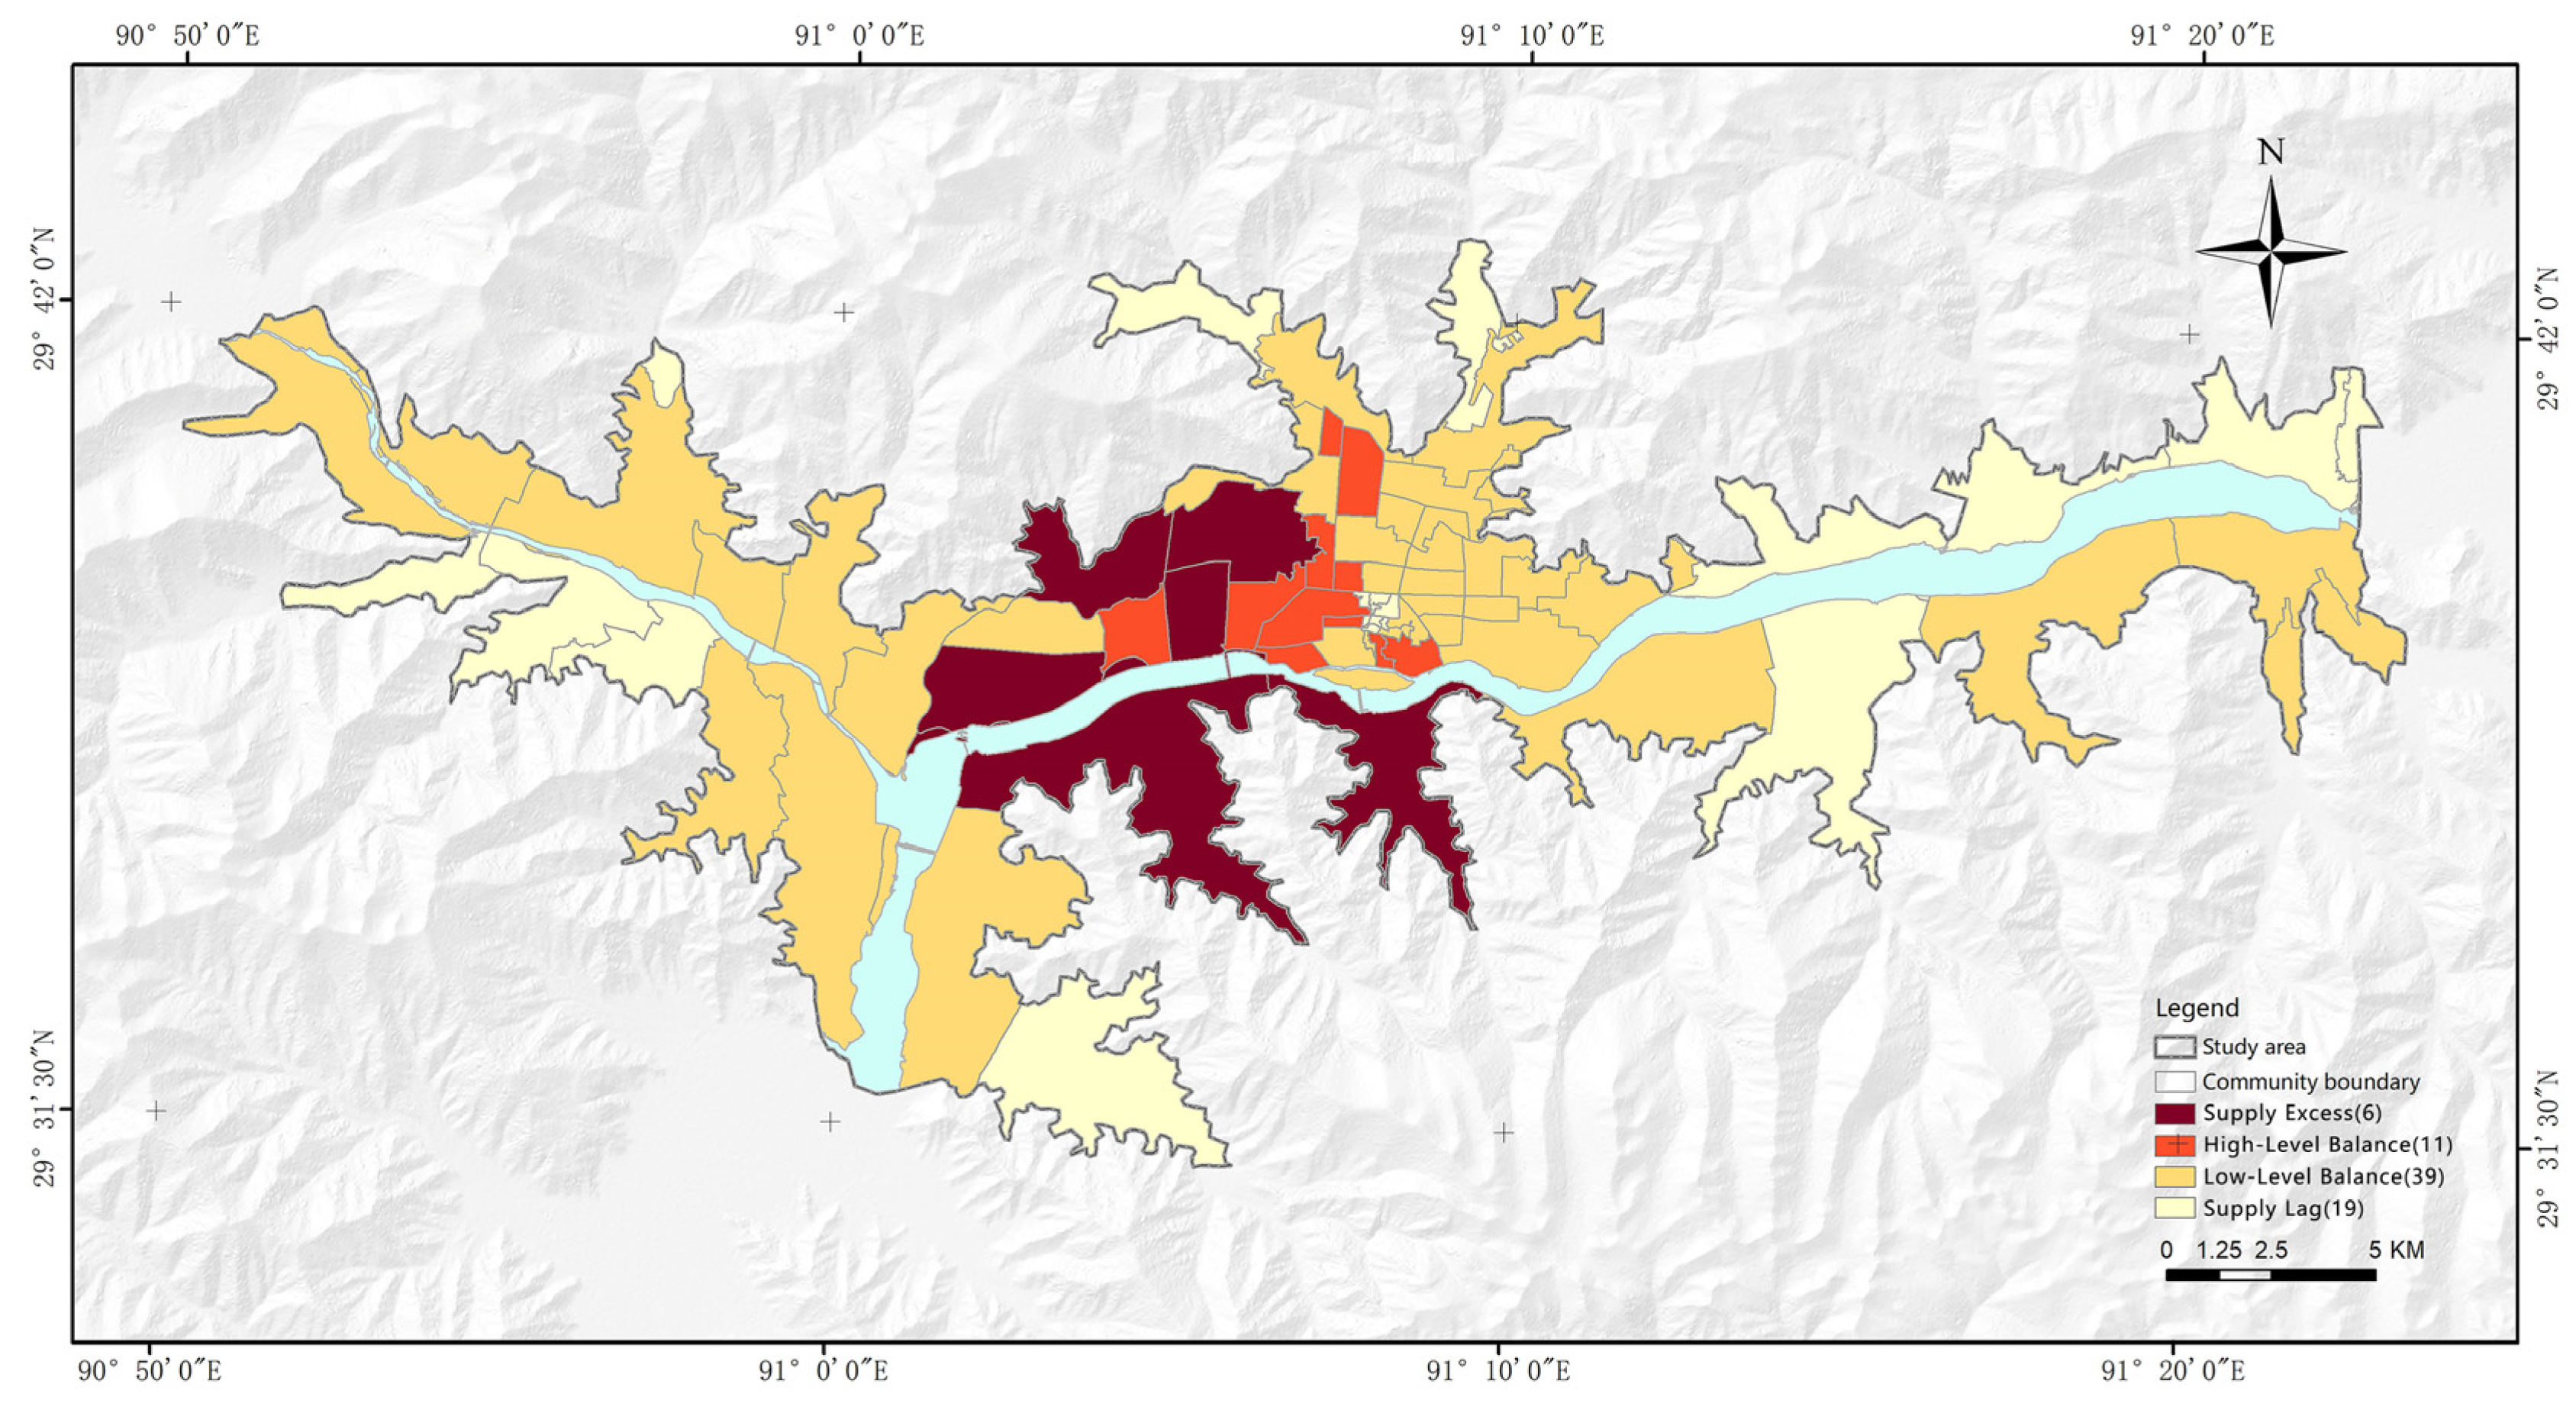
4.2. Supply–Demand Matching Analysis of Urban Park CES in Central Urban Areas

Based on the above research, this study analyzes the spatial coupling between park supply and demand using the supply–demand balance relationship and the CCD model. Following sensitivity analysis and Kappa coefficient comparison, the Jenks natural breaks method was determined to be the most stable and was thus adopted for classification [19,52]. Considering both the supply–demand ratio and the supply level, the study area is categorized into four supply–demand matching types: undersupply, oversupply, high-level balance, and low-level balance. Additionally, three levels of coordinated development status are identified: coordinated development, transitional development, and uncoordinated and decline.
The analysis of supply–demand matching types reveals a pronounced imbalance in the CES supply and demand of urban parks in Lhasa’s city center. Approximately 25.67% of communities experience undersupply, predominantly located in the eastern core of the old city and adjacent near-mountain areas. In contrast, 16.22% of communities exhibit oversupply, concentrated in the western part of the old city, the central urban core, and several key development zones. Although 58.11% of communities maintain a generally balanced supply–demand relationship, only 3.73% achieve a high level of equilibrium. (Figure 9). It is worth noting that in the undersupplied communities of Barkhor Street, Jibanggang Street, Gamagongsang Street, Raidi Street, and Najin Street, located in the downtown area, there is high demand but low supply. This imbalance is due to the intensive movement of the population, ongoing construction and development, and the over-compression of urban open space caused by high-density development. The population in the near-mountain river valley areas located at the eastern and western wings, as well as the northern and southern ends of the city, is relatively small. However, the mountains and river valleys in these regions have not been fully utilized to provide CES, resulting in a phenomenon where supply lags behind demand. Among the oversupplied communities, the Gongdelin and Jipenggang Street areas located in the core cluster of the old city are relatively densely populated, but due to the historical development of the area, there are numerous parks retained that rank high in terms of their cultural service capacity, presenting the phenomenon of supply overrun and high-level balance. Located at the mouth of the three forks river as well as along the banks of the river, the LNHZ Cluster, the Eastern New Town, and the Cijueling Cluster are the key construction areas in Lhasa in recent years and are relatively less populated, with lower demand for parks, presenting the phenomenon of oversupply.
The spatial distribution of the CCD of parks in the central urban area of Lhasa shows a “center-periphery” concentric diffusion pattern (Figure 10). Specifically, 55.11% of the area exhibits a state of disorganization and decline, while only 6.75% of the area shows coordinated development. Additionally, 38.14% of the area is in a transitional development phase, characterized by a tendency towards coordination but still approaching a disorganized state (Table 4).
Comprehensive analysis of the relationship between supply and demand balance and coordinated development of parks CES in central urban area of Lhasa, the areas in a coordinated development state account for a relatively small proportion. Among these, sseven communities, predominantly characterized by a lag in supply, are mainly concentrated in the Barkhor Street area of the Old City Core Cluster. Notably, five oversupplied communities are identified within the transitional development areas, primarily distributed across the Cijueling Culture Cluster, the northern part of the LNHZ, and the West City Cluster. The communities exhibiting an uncoordinated and declining state are primarily supply-lag and low-level balanced communities (23 in total), mainly located in the peripheral mountainous districts of the city. This phenomenon can be attributed to the relatively late initiation of urban green space planning in Lhasa, the lack of countryside park types, and the absence of a systematic framework for the conservation and utilization of the city’s extensive mountainous and river valley areas.

5. Discussion

5.1. Supply–Demand Assessment of Urban Park CES in the Central Urban Area

This study reveals a significant spatial supply–demand mismatch in the CES of urban parks in the central urban area of Lhasa. There are notable disparities in the supply–demand balance and coordination levels between different urban clusters, and this finding aligns with research results from several cities worldwide. Existing studies have shown that the degree of supply–demand matching for park CES is influenced by the spatiotemporal coupling of geographic, cultural, and developmental factors [17,37,55,56]. In the central urban area of Lhasa, the supply–demand imbalance is more pronounced in the old city cluster compared to the new city cluster. Specifically, in the Barkhor Street area and its surrounding communities, high-demand communities remain widespread due to difficulties in implementing historical preservation and population relocation policies [26], aggravating the supply–demand imbalance. In contrast, new city clusters such as the Northern LNHZ and the Cijuelin Cultural Cluster, following a “plan first, build later” development model, have seen an oversupply of park CES. However, due to relatively slow population aggregation and economic vitality, and insufficient service demand, a typical transitional development pattern in urban expansion process has emerged [57]. This spatial pattern indicates that urban park development is not aligned with population growth, emphasizing the importance of urban population dispersal and the identification of resident demand in urban park planning [32].
In contrast to studies in Europe, the United States, and India, which focus on aesthetic and recreational functions of urban CES [8,20,58], this study further reveals cultural differences in the CES supply structure in Lhasa. In the old city cluster, the historical cultural gardens in the Potala Palace and Norbulingka areas provide services far exceeding those in other regions. The prominent cultural heritage value of these areas constitutes a critical support for local CES supply. These parks not only represent high-potential service points but also strengthen residents’ cultural identity and emotional connection through symbolic cultural landscapes [59]. This phenomenon reflects the deep driving influence of urban culture and geographic history on CES supply. The long-standing recognition of “Linka” (meaning garden in Tibetan) by the Tibetan people, coupled with urban historical preservation practices, has jointly shaped the unique advantages of CES supply in the old city cluster of Lhasa. Moreover, the suburban clusters in the near-mountain area of Lhasa’s central urban area have lower urban development intensity and sparse population, and due to natural mountainous terrain, a systematic suburban park system has not yet formed. This area presents a development pattern with uncoordinated and decline development, and significant supply lag, differing markedly from cities like Chongqing, where parks follow a high-value belt distribution along the “Four Mountains” [36]. This research highlights the significant impact of natural landforms, urban development strategies, and green space planning levels on CES spatial supply–demand patterns.
China is undergoing rapid urbanization, and to ensure the sustainable use of parks in future landscape management [19], this study explores the urban typology perspective to develop a CES evaluation system for parks in plateau river valley cities. The study focuses on the factors of various indicators on supply and demand levels, combining clear geographic spatial data with field survey data. It quantifies the landscape attributes of water bodies, roads, plazas, art pieces, and cultural heritage sites in the park green spaces of the central urban area of Lhasa while considering the spiritual needs of local residents for mountains and water. The visibility of mountain and water features and the selection of holiday gathering places are incorporated into the assessment system. A relatively comprehensive assessment of park recreational potential is achieved from five aspects: aesthetic value, recreational value, heritage value, research value, and inspirational value. Additionally, to intuitively reflect the conversion of the “potential service volume” provided by urban parks into the “actual service volume” used by residents, the effective service area ratio based on walkability and non-motorized accessibility is used to measure recreational opportunities, effectively reflecting residents’ ability to access park services [19,26]. Moreover, the study analyzes CES supply–demand matching at the community scale in terms of supply–demand balance and coordination levels, facilitating the analysis of neighborhood spatial characteristics of supply–demand mismatch. This enables an adaptive assessment of supply-demand capacity and temporal regulation, making the optimization strategies for community supply–demand matching more practical.

5.2. Optimization Strategies for Supply-Demand Alignment of Urban Parks CES in Central Urban Areas

As a plateau city located in an ethnic region, Lhasa has consistently prioritized the protection of historical and cultural heritage alongside the development of its green space system. The “Lhasa Territorial Spatial Master Plan (2021–2035)” and the “Lhasa Green Space System Plan (2021–2035)” both emphasize integrating ethnic cultural features and ecological functionality into urban planning. This approach aims to create an open spatial landscape that organically blends urban areas with natural mountain and water features, gradually increasing the area and diversity of urban parks. However, due to factors such as the late start of planning, complex terrain, and the cultural significance of mountain and water worship, Lhasa residents have become highly dependent on natural spaces within the city. This has led to a significant spatial mismatch in the supply and demand of CES in urban parks, presenting a major challenge to sustainable urban development.
The optimization method for urban green space systems, based on the balance of supply and demand and efficiency improvements, serves as an effective approach to enhancing the construction and management of urban living environments, promoting high-quality development [60]. A study on the primary uses of parks in five European cities found that respondents’ socio-cultural and geographical backgrounds play a significant role in the CES provided by parks [37]. The plateau mountain–water landscape and political–cultural influences have shaped the urban spatial structure of Lhasa [61], profoundly affecting the demand patterns of its social groups and the utilization of urban parks. Therefore, in optimizing CES, it is essential to fully consider the coupling relationship between regional topography, cultural traditions, and resident needs. Based on the spatial assessment of supply–demand balance and coordination levels in CES in the central urban area of Lhasa, this study identifies four typical community types with specific issues: undersupply, oversupply, imbalanced decline, and low-level balance. Targeted optimization strategies are proposed, considering recreational potential, opportunities, and local residents’ needs.
In the study area, the supply–demand imbalance is primarily reflected in the insufficient CES supply in the old town’s central cluster and the oversupply in key development clusters. To address the issue of limited land availability in the residential areas of the old town, a strategy of placing small green spaces into the urban environment is proposed. It is recommended to explore local cultural activity routes in detail and increase small green spaces, such as pocket park and community parks, based on targeted demand, in order to improve the efficiency of CES supply and demand in the old town’s parks. The LNHZ and the Cijuelin cultural group, which currently exhibit an oversupply of green space, do not face a lack of green resources at present. However, to prevent resource wastage, it is recommended that future urban development integrate population resettlement from the old town with the city’s economic and demographic growth directions, ensuring that park resources are used efficiently and promoting equitable development.
The uncoordinated supply–demand development is primarily concentrated in the near-mountain areas and the peripheral clusters of the city center, characterized by supply lag and low-level balance. To enhance the supply capacity in near-mountain areas, a strategy is proposed to expand countryside parks along the northern and southern mountain ranges, aiming to optimize the use of ecological land and cultural resources. It is recommended to make full use of the valley resources while providing space for local folk activities, thereby enhancing the availability of green spaces and optimizing the integration of suburban green spaces with urban development. Additionally, leveraging Lhasa’s southern and northern mountains, a greenway network should be established to improve access to suburban recreational resources and strengthen the connection between suburban areas and the urban core. Low-level balance communities are mostly located in the peripheral clusters of the city center. The communities show a general supply–demand match but fail to meet the specific needs of certain groups. Therefore, optimization is required to align with changes in population and economic development. It is recommended to prioritize the renewal of existing park infrastructure, taking into account the specific needs of target groups, and to expand leisure spaces and services tailored to the elderly and children.

5.3. Limitations and Future Prospects

The intangible, subjective, complex, and dynamic nature of CES presents a challenge in accurately selecting indicators to quantify supply and demand levels. Due to limited data availability, the selected indicators may still fail to fully capture all aspects of the supply–demand system. Some non-material cultural values within CES, such as “inspirational value” and deep spiritual connections, remain difficult to fully quantify using existing indicator systems. Future studies should consider addressing this limitation through more in-depth qualitative methods, such as narrative analysis and cultural mapping. In this study, Lhasa, being a tourism city, primarily focuses on the park CES needs of urban residents while neglecting the needs of tourists. Additionally, values shape how people interpret their environment and make decisions [62]. Local residents in Lhasa, influenced by their beliefs, follow fixed patterns of behavior. However, there is a lack of comprehensive long-term data to quantitatively evaluate these cultural and spiritual needs. Future research should combine multi-source data analysis (such as social media photos and park visitor numbers) with long-term field surveys to quantify cultural ecosystem services in urban parks from the perspectives of both local residents and tourists. This approach will enhance the applicability of the research and provide a more accurate and comprehensive framework for CES evaluation, further expanding the precision and depth of the analysis [63]. To further reflect the dynamics of urban development and its impact on the CES supply–demand relationship, temporal variations in demand at different stages of urban development will be considered, when data is available, to provide a more forward-looking planning pathway.

6. Conclusions

This study developed a CES supply–demand assessment system for urban parks in the central urban area of Lhasa, suitable for the characteristics of typical plateau river valley cities. Based on spatially explicit methods, the study analyzed the supply–demand matching characteristics at the community scale and proposed optimization strategies with high feasibility. The main conclusions are as follows:
(1) Influenced by the natural geographic environment and urban development level of plateau river valley cities, the spatial distribution of CES supply and demand in urban parks in Lhasa showed significant variation. The supply was higher in the central area and lower in the eastern and western wings, while the demand decreases from the old city center toward the periphery.
(2) The phenomenon of CES supply–demand imbalance was widespread. In total, 25.67% of the communities experienced an undersupply, 16.22% exhibited oversupply, and 58.11% maintained a balanced supply–demand relationship, with just 3.73% of the communities achieving a high-level balance. The overall supply–demand coupling coordination degree was poor. In total, 55.11% and 38.14% of communities were in declining and transitional stages, respectively.
(3) Differences in CES supply–demand relationships were significant within urban clusters. The imbalance in supply and demand was mainly reflected in the seven communities in the center of the old city cluster, where CES supply was insufficient, and the five communities in the key development clusters, where CES supply was excessive. The issue of supply–demand uncoordinated development was concentrated in 23 communities in the near-mountain areas and the periphery of the city center.
The findings of this study show that the supply-demand relationship of urban park CES is driven by park landscape attributes and resident needs, and is significantly influenced by sociocultural and geographical background, the timing of urban development, and the completeness of the urban park system. This study integrates non-monetary qualitative assessment with quantitative methods to develop an indicator system centered on “recreational potential–recreational opportunities” and “social needs–material needs.” It enhances the understanding of the supply–demand mechanisms of urban park CES and provides an operational and replicable evaluation framework and optimization path for cities with geographical particularities and cultural diversity. The four strategies proposed to address the CES supply–demand issues in the research area, namely “culturally driven urban park development,” “demand-oriented park planning,” “expanding countryside parks along mountain ridges,” and “revitalizing existing parks,” are both practical and targeted. These strategies are designed to address specific local challenges identified in the study, offering actionable guidance for the future optimization and development of urban parks.

Author Contributions

Conceptualization, S.Z.; Methodology, S.Z. and Z.N.; Software, S.Z. and Y.L. (Yuqi Li); Validation, S.Z. and Y.L. (Yuqi Li); Formal analysis, S.Z., Y.L. (Yuqi Li) and Z.N.; Investigation, S.Z. and Y.L. (Yuqi Li); Resources, S.Z. and Y.L. (Yunyuan Li); Data curation, S.Z. and Y.L. (Yunyuan Li); Writing—original draft, S.Z. and Y.L. (Yunyuan Li); Writing—review & editing, S.Z. and Y.L. (Yunyuan Li); Visualization, S.Z.; Supervision, Y.L. (Yunyuan Li); Project administration, S.Z. and Y.L. (Yunyuan Li); Funding acquisition, Y.L. (Yunyuan Li). All authors have read and agreed to the published version of the manuscript.

Funding

This study was supported by the National Key Research and Development Program of China (Project No. 2024YFD2200902).

Data Availability Statement

The data used for this study are available in the following databases: (1) Land use data came from China’s 30 m resolution remote sensing monitoring data (https://www.gis5g.com, accessed on 2 February 2025). (2) DEM data (30 m resolution) were obtained from NASA Earthdata (https://search.earthdata.nasa.gov/search, accessed on 2 February 2025). (3) NDVI data (30 m spatial resolution) were sourced from the Chinese Academy of Sciences Ecological Data Center (https://www.nesdc.org.cn, accessed on 2 February 2025). (4) Transportation network data were obtained from the OpenStreetMap website (https://www.openstreetmap.org, accessed on 2 February 2025). (5) Population data (1 km resolution) were sourced from the WorldPop website (https://www.worldpop.org, accessed on 2 February 2025). (6) Some data will be provided after contact and consent has been obtained.

Conflicts of Interest

The authors declare that they have no known competing financial interest or personal relationships that could have appeared to influence the work reported in this paper.

Appendix A

Appendix A.1. Score of 113 City Park Indicators

The content of this appendix lists the types of the 113 parks, the data of the eight indicators. The subsequent study used this as the source data for the production of the bubble map, which visually reflects the CES capacity of each park in the central urban area of Lhasa.
Table A1. Park type classification.
IDTypeName
1Comprehensive parksZongjiao Lukang Park
2Comprehensive parksLiuwu Park
3Comprehensive parksRende Park
4Comprehensive parksNorbulingka Square Park
5Comprehensive parksCisongtang Water Park
6Comprehensive parksQihui Lake Park
7Comprehensive parksGaji Park
8Comprehensive parksCijuelin Park
9Specialized parksThe East Side of Luding South Road Park
10Specialized parksThe Economic Development Zone Health Park
11Specialized parksLhasa Riverside Park
12Specialized parksPrincess Wencheng Cultural Tourism Theme Park
13Specialized parksWellness Park
14Specialized parksDuilong Riverside Sports Park
15Specialized parksTibet Astronomical Park
16Specialized parksGymnasium Recreational Park
17Specialized parksTax Linka
18Specialized parksSports Park
19Specialized parksSichuan-Tibet Monument Park
20Specialized parksLhasa River Sports Park
21Specialized parksMopan Mountain Park
22Specialized parksYaowang Mountain Greenland Park
23Specialized parksThe Potala Palace Park
24Specialized parksNorbulingka
25Specialized parksYingqin Bridge Bridgehead Park
26Specialized parksChildren’s Park
27Specialized parksRiverfront Park
28Specialized parksChinese Cultural Park
29Specialized parksAlong Tanga Avenue South Park
30Specialized parksNanshan Park
31Community parksNaigang Park
32Community parksCentury Avenue Park
33Community parksDuilong Avenue North Park
34Community parksThe East Side of Langkang 2nd Road Park
35Community parksSouth Mudui Community Park
36Community parksSenzu Island Ribbon Park
37Community parksLinqiong Park
38Community parksQumi Road Park
39Community parksTongniu Park
40Community parksGesang Flower Park
41Community parksHarmony Park
42Community parksCisongtang Middle Road South Park
43Community parksNoba Garden
44Community parksHeba Forest Park
45Community parksDazi Industrial Park
46Community parksZhenjiang Park
47Community parksDazi District Deqing Park
48Community parksRurulinka
49Community parksSango Park
50Community parksGuanshan Road Park
51Community parksChagu Avenue East Park
52Community parksZijin East Road Park
53Community parksThe West Side of Lingyue Mansion Park
54Community parksKangsang Garden
55Community parksXicheng Anju Garden
56Community parksKelsang Linka Community Park
57Community parksIn the Economic Development Zone Ecological Park
58Community parksLaqing Park
59Community parksDuilong Avenue North Park
60Community parksYangda Street Park
61Community parksNaiqiong Temple Park
62Community parksNorth Loop Park
63Community parksNational Unity Park
64Recreational parksTiger Peak Road Park
65Recreational parksResiga Park
66Recreational parksDuilong Avenue North Recreational Park
67Recreational parksYangda Street Park
68Recreational parksBoth Sides of the Student Avenue Recreational Park
69Recreational parksTour the Island and Visit Recreational Park
70Recreational parksChildren’s Palace Recreational Park
71Recreational parksZhongsa Road Recreational Park
72Recreational parksOpposite the Sixteenth Regiment Recreational Park
73Recreational parksLiuwu Bridge Recreational Park
74Recreational parksQuicksand River Ribbon Recreational Park
75Recreational parksJinzhu Middle Road North Recreational Park
76Recreational parksPotala Palace Park
77Recreational parksBeijing West Road Ribbon Recreational Park
78Recreational parksWetland Drainage Canals Are Strip-Shaped Recreational Park
79Recreational parksKang Yuen Park West Recreational Park
80Recreational parksNiangregou Recreational Park
81Recreational parksAba Linka Community Recreational Park
82Recreational parksThe West Side of Niangre North Road Recreational Park
83Recreational parksSera North Road Recreational Park
84Recreational parksCisongtang Middle Road North Community Recreational Park
85Recreational parksSnowy Pearl Park Recreational Park
86Recreational parksZaki Garden
87Recreational parksCisongtang East Road North Recreational Park
88Recreational parksHerdsmen Settle Down Recreational Park
89Recreational parksBalku North Recreational Park
90Recreational parksThe Eastern Convention and Exhibition Center Recreational Park
91Recreational parksYangcheng Recreational Park
92Recreational parksThe North Side of Jiangsu Avenue Recreational Park
93Recreational parksThe South Side of Jiangsu Avenue Recreational Park
94Recreational parksThe Middle Trunk Canal Recreational Recreational Park
95Recreational parksDuoren Garden
96Recreational parksDuilong New Town Group Recreational Park
97Recreational parksNine Children’s Paradise Park
98Recreational parksThe City Hall Circles Recreational Park
99Recreational parksThe North of the Chengnan Traffic Police Brigade Recreational Park
100Recreational parksPumpbare Recreational Park
101Recreational parksPolinka Park
102Recreational parksSouth of the Bureau of Culture and Tourism Recreational Park
103Recreational parksJiangsu East Road Monument Recreational Park
104Recreational parksRuyi Garden
105Recreational parksPearl Garden
106Recreational parksGyatso Garden
107Recreational parksDuilong Recreational Park
108Recreational parksNagin Bridge Recreational Park
109Recreational parksNorth Ring Riverside Road Recreational Park
110Recreational parksSouth Ring Road Riverside Park
111Recreational parksLhasa Riverside Recreational Park
112Recreational parksLinkuo East Road Recreational Park
113Recreational parksWelcome Park
Table A2. Eight CES recreational potential indicators for parks.
IDPARVPNRWRRRIRARH
10.1350030.1335839930.1954510060.5481879710.1319510040.027330.1975679990.52827
20.1989510.1519940050.2197750060.2486270070.1010010020.0077300
30.08041270.3954960110.0938350040.5326939820.2077820.0114400
40.04064940.1829299930.0497152990.1033950.1621740010.0375100.10238
50.04918230.1636469960.06209019910.1869799940.0310600
60.1348780.4306350050.0678628980.4148809910.2007240060.0045600
70.04878730.02774170.05981209900.03000910.0062600
80.07091510.4605970080.0385390.5623790030.0860894020.0259300
90.05555120.4507850110.05576210100.236460.0110100
100.33769210.2211930010.2622219920.1493140010.0027400
110.05487990.3120130.0479550990.1075910030.3897410040.0278700
120.02857790.3227069970.021708600.1677159970.0106200
130.04741190.3365100030.03982669900.2465869930.0193300
140.0764410.01332160.0621052010.1145989970.2084700020.0160400
150.1202420.427601010.0641020010.1057310030.1341640060.0102200
160.0439120.0320350010.0536701010.3288759890.1443639990.013900
170.2155510.6788010.22927600100.001550030.0014300.05846
180.01588260.4874500040.022306500.214417994000
190.00516750.0636174010.0046940600.1582369950.0547100.74664
200.1989840.5474290250.1599379930.1961109940.1583109950.0108300
210.00794870.0358684990.0080013800.3772569890.1099201
220.1887360.5850290060.15017600400.01620240.0130400.06675
230.01932790.0375499990.01719900.1645160020.0155800.42526
240.3035070.3370130060.3586440090.0159658990.0111340.0121810.12464
250.03747740.440755010.021238100.1535490010.0325200
260.01995680.5620960.0090055600.3097350.0453100
270.2368440.650604010.2274000050.0693437010.109839998000
2810.718930006100.1944240030.00370.003821820
290.1956790.5080320240.15953600400.3132640120.0157300
300.3992850.4997819960.3231489960−1.11 × 10−80.001540.004782450
310.00611890.1631900070.007592600.5749449730.0468200
320.01079230.0792448970.015053500.3165110050.0821700
330.03506130.4096600120.03306119900.3097130060.0173600
340.01885070.1855680050.019450100.2188449950.0319300
350.00783980.2388129980.0054635900.2948130070.0371200
360.06740250.3172209860.05285700.265417010.0181800
370.02245140.0305064990.0238141990.3089640140.3926450010.0269200
380.008754600.011881800.2812039850.0668800
390.018760400.0181511990.1254909930.3134669960.0320800
400.00997130.0002043320.01182440.1356150060.0791824010.0590900
410.004680700.0063476600.2928679880.0598800
420.01145190.0159786010.018831700.123327002000
430.00912990.0001622890.012604600.4621199970.0321300
440.011434700.010029400.6821129920.103650.1605820060
450.07615570.2304600030.0847363020.4668059950.281623989000
460.01318560.0652472970.012696400.5378890040.0677700
470.0202080.1521700020.019769700.229145005000
480.01003330.2462770040.0077908100.4474210140.0881100
490.02023460.2388170060.009481910.5250660180.2691879870.029800
500.03261860.2279060040.03064009900.1676560040.0186500
510.1220550.03590.1288930030.2786819930.2026219960.0100700
520.008794400.010205800.339693010.033300
530.01373380.0654041020.013104500.640214980.0434400
540.00842950.0110670.0075920700.2348710.0346600.473
550.002328400.0016398900.2741450070.2204200
560.02648690.004320890.0183109010.0552432020.3148790.0572200
570.05646070.0859031980.067183100.2021149990.0108400
580.00523310.2752479910.0052715100.7380639910.1081700
590.01288660.7964190240.00871770.3070990150.2861610050.0461900
600.01894510.2828890090.019331900.1792490040.0317800
610.01378760.2032469960.01559900.133805007000.29525
620.00928110.3413339850.0026448700.0877555010.0316300
630.06989010.0701206030.04087229800.0360790010.0087700
640.00014630.02550320.001136400.893375993100
650.002712500.0024026400.6514229770.1938200
660.0080120.1227200030.0072013900.4292140010.109100
670.00419430.1112359990.0036675400.866623998000
680.01171570.01877930.015290700.3388819990.0253100
690.0283520.0158590990.0305020010.1061050.4632300140.0428100
700.00045140000.5811049940.3345600
710.01016890.0114640.015759500.4066010120.0579900
720.00618730.005216540.0085576800.520124018000
730.04426710.1956509950.05640770100.0704957990.0137900
740.07906570.006948740.08870559900.5431569810.0155100.05293
750.00265140.009946930.0038509700.440131009000
760.07527470.1317200060.0970503020.3760589960.1918540.024440.07571990.11116
770.01439520.0792450980.0063640201000
780.01779830.3153479990.021821300.350263000
790.00127110.00783610.0028817800.410946995000
800.00152090.4678860010.00075875500.403753996000
810.00053270.00145946.41164 × 10−500.1933570060.3074500
820.00202780.04629590.0015189700.309305012000
830.0024650.002068070.0017589400.320522010.3152400
840.00283300.0063638800.483651996000
850.00698290.8361979720.006413500.41991201000
860.00355880.01057590.003457900.41782099000
870.00278617.20749 × 10−70.0020110200.0658368990.0947200
880.00023910.565832973000.400766999000
890.01043990.2509970070.010811900.2819310130.0282700
900.01217460.0007107780.012850700.0533858020.024400
910.0076730.8428850170.0080322400.387448013000
920.01545980.1044970010.0150720.4114879970.229120001000
930.00840810.3281730120.0083087900.280153990.0347400
940.06582770.2834100130.04844940100.444795012000.0635
950.00521190.0005737160.0093206900.204766005000
960.00695120.03078590.0040012900.233105004000
970.002121300.0010573900.455823988000
980.015580.0263279990.018597500.070188403000
990.002388100.0051674900.619035006000
1000.00579110.6318979860.0041150200.227663994000
1010.00296760.006483980.0024575700.3622699980.0897200
1020.003227200.001989200.546922982000
1030.00299420.01137860.00065247100.3523809910.0890300
1040.001791500.0033695700.574238002000
1050.00541540.001886440.0085963800.156046003000
1060.00038390.0183304010.00057358900.742215991000
1070.08293710.356110990.05777050200.2232860030.007400
1080.02590150.4780260030.02654440.3795289990.392093986000
1090.02181690.0001554410.01212030.1395280060.323309988000
1100.07840360.5403680210.06415359700.1345790030.0039100
1110.1396520.3833000060.09089379800.1974589970.0110100
11200.0004276440.00016680900.452659994000
1130.01005180.02550330.0075658700.6448339820.0293200

Appendix A.2. The Supply-Demand Matching Index of Community CES

The data in this appendix lists 75 communities in the central urban area of Lhasa, along with the level of CES provided by parks to each community, the level of demand for parks from each community, the supply-demand ratio, and the coupling coordination degree (CCD).
Table A3. Community CES Supply-Demand Ratio and Coupling Coordination Degree.
Community NameSupplyDemandS-D RatioCCD
1Barkhor Street, Barkhor Community0.387273910.8822660560.4389536580.72677
2Barkhor Street, Bailin Community0.458202660.6891339380.6648963760.71077
3Barkhor Street, Chongsaikang Community0.37336240.937544320.3982344050.73157
4Barkhor Street, Dangjeling Community0.60433050.7883665030.7665603470.78891
5Barkhor Street, Lugu Community0.462556160.5058188330.9144700280.65664
6Barkhor Street, Dangsai Community0.548412830.5606983370.9780889250.70418
7Barkhor Street, Xia Sasu Community0.383708320.9847135840.3896649010.74598
8Caigongtang Street, Bai Ding Village0.007374020.0776066020.0950178950.13079
9Caigongtang Street, Cai Village0.180348540.1119763181.610595380.3337
10Caigongtang Street, Ciguoling Village0.361241190.0957517933.7726832620.37549
11Raidi Street, Luo’o Village0.085357570.0778112441.0969824030.2415
12Raidi Street, Sangyi Community0.227816160.26161970.8707912880.4593
13Jiedi Street, Weiba Village0.043184720.0643755180.6708252180.18728
14Gamagongsang Street, Ojetang Community0.38632090.4285457150.9014695150.60049
15Gamagongsang Street, Gamagongsang Community0.380189620.5922730430.6419161280.65191
16Gamagongsang Street, Garma Gonsang Street, Najin Road North Community0.38088650.4852407060.7849434190.61863
17Garma Gonsang Street, Tujian Community0.391609440.5806881950.6743884910.65334
18Gongdeling Street, Gatso Community0.833036310.2874207572.8983164670.65218
19Gongdeling Street, Lalu Community0.412958710.1459784412.8289020410.44797
20Gongdeling Street, Happiness Community0.672904020.4181862181.6091013750.68531
21Gongdeling Street, Xue Community0.796388330.5133857911.5512473180.75515
22Gongdeling Street, Tsemenlin Community0.813547820.529831141.5354851030.76557
23Jibungang Street, Jibungangang Community0.38227150.7810298450.4894454450.70185
24Jibungang Street, Mulu Community0.39051680.7798742240.5007433070.70533
25Jibungang Street, Jiemuqi Community0.393370290.796524160.4938585840.71051
26Jibungang Street, Palangxue Community0.496333610.6654515360.7458598860.71851
27Jiri Street, Hebalin Community0.565161320.4546898781.2429599780.67099
28Jiri Street, Jiri Community0.326140680.8303808930.3927603340.68536
29Jiri Street, Tiebanggang Community0.534855520.7116256110.7515967870.74503
30Jinzhu West Road, Bayi Community0.612991670.3439516051.7822032520.63485
31Jinzhu West Road, Dangba Community0.41280250.1207816793.4177575680.42114
32Jinzhu West Road, Jinzhu West Road Community0.422253210.225576231.871886990.51365
33Jinzhu West Road, Lodu Community0.468096810.1648793172.8390268460.48011
34Liangdao Street, Karmalingka Community0.603732270.3935308541.5341421370.65611
35Liangdao Street, Xianzudao Community0.458219680.2188479622.0937808790.51967
36Najin Street, Zangge Community0.302868370.2889894761.0480256050.5072
37Najin Street, Garba Village0.020965210.0469172910.4468546490.13022
38Najin Street, Garong Community0.284678530.4259071030.6684052150.55543
39Najin Street, Najin Village0.361063310.1597529232.2601358750.44558
40Najin Street, Naryu Community0.362454280.2718932381.3330757390.52148
41Najin Street, Tama Village0.403232090.2559251741.5755858640.52648
42Nyange Street, Abalinka Community0.561766550.3212445251.7487194660.60958
43Nyange Street, Cisongtang Community0.59766590.2769160572.1582926960.59399
44Nyange Street, Jisu Village0.174130630.1325517721.313680160.34998
45Nyange Street, Galsi Village0.007552270.0442771760.1705680580.0965
46Nyange Street, Rinchen Cai Village0.306355720.1850911461.655161380.44725
47Zhaxi Street, Nizhulin Community0.249143050.3768986930.6610345310.51973
48Zhaxi Street, Unity New Village Community0.57830970.5280191171.0952438640.70232
49Zhaxi Street, Xiongha Community0.493738540.5687589540.8680980610.68852
50Zhaxi Street, Zhaxi Community0.415804190.3612871741.1508966210.58396
51Zhaxi Street, Zhaxi Xincun Community0.509192730.42038351.2112576520.64008
52Bangdui Township, Bangdui Village0.003696460.0541419620.0682733990.09252
53Bangdui Township, Lin’a Village0.00523990.0307058320.1706484680.00139
54Bangdui Township, Yeba Village0.000402440.0322652610.0124729320.02699
55Deqing Township, Baina Village0.0317440.0458884340.6917646790.1421
56Deqing Township, Deqing Village0.145122170.0872411221.6634606630.28864
57Deqing Township, Sangzhulin Village0.06718280.0643654061.0437718530.20914
58Deqing Township, Xincang Village0.038237550.0354088731.0798861830.11106
59Dongga Street, Dongga Village0.360282910.1936768941.8602266120.47209
60Dongga Street, Nanga Village0.156900470.1546585621.0144958380.35814
61Dongga Street, Sangmu Village0.142506160.2194585770.6493533440.38839
62Gurong Town, Baje Village0.055555560.0650714770.8537620270.20047
63Gurong Town, Join Village0.082861450.0425605951.9469052390.16979
64Liwu Street, Deyang Village0.000166750.0580657510.0028716790.04432
65Liwu Street, Liwu Village0.432102840.1387499843.1142550520.4458
66Liuwu Street, Sangda Village0.096009110.0552909931.7364331640.21139
67Naiqiong Street, Boma Village0.150607410.0602216762.5008837690.24764
68Naiqiong Street, Gangdelin Village0.099420970.0862787031.15232340.26147
69Naiqiong Street, Jamu Village0.026450050.0619499590.4269583150.16261
70Naiqiong Street, Jiage Village0.016582510.0691315070.2398690010.15237
71Naiqiong Street, Naiqiong Village0.126767620.0958968661.3219161810.28916
72Naiqiong Street, Sema Village0.029847810.0927242680.3218985670.19893
73Yangda Street, Gangpu Village00.05045824400
74Yangda Street, Yangda Village0.109150170.0960630051.1362352020.27872
75Yangda Street, Tongga Village0.255049090.1097924542.3230111190.36143

Appendix A.3. Classification of Supply-Demand Balance and Coupling Coordination States

To ensure objectivity and transparency, this study compared four classification methods—K-means, Z-score, Jenks natural breaks, and IQR. A sensitivity analysis was conducted to assess robustness by introducing data perturbations. The Kappa coefficient was used to evaluate stability, and the Jenks method was found to be the most stable and consistent approach for classifying the supply-demand ratio and coupling coordination degree. The validation process is shown in Figure A1, Figure A2, and Figure A3.
Figure A1. Sensitivity Analysis of CES Supply–Demand Ratio Classification Method. X-axis: test data; Y-axis: perturbation coefficient. Shapes indicate classification types; red markers denote data points with classification changes.
Land 14 01301 g0a1
Figure A2. Sensitivity Analysis of CES Coupling Coordination Degree Classification Method. X-axis: test data; Y-axis: perturbation coefficient. Shapes indicate classification types; red markers denote data points with classification changes.
Land 14 01301 g0a2
Figure A3. Changes in Kappa Statistic with Perturbation. Y-axis: Kappa coefficient; X-axis: perturbation coefficient.
Land 14 01301 g0a3

References

  1. Elliot, T.; Torres-Matallana, J.A.; Goldstein, B.; Babí Almenar, J.; Gómez-Baggethun, E.; Proença, V.; Rugani, B. An expanded framing of ecosystem services is needed for a sustainable urban future. Renew. Sustain. Energy Rev. 2022, 162, 112418. [Google Scholar] [CrossRef]
  2. Fang, X.; Li, J.; Ma, Q. Integrating green infrastructure, ecosystem services and nature-based solutions for urban sustainability: A comprehensive literature review. Sustain. Cities Soc. 2023, 98, 104843. [Google Scholar] [CrossRef]
  3. Andersson, E.; Tengö, M.; McPhearson, T.; Kremer, P. Cultural ecosystem services as a gateway for improving urban sustainability. Ecosyst. Serv. 2015, 12, 165–168. [Google Scholar] [CrossRef]
  4. Panaro, S.; Delabre, I.; Marshall, F. Cultural ecosystem services and opportunities for inclusive and effective nature-based solutions. Ecol. Econ. 2025, 230, 108525. [Google Scholar] [CrossRef]
  5. Schirpke, U.; Meisch, C.; Marsoner, T.; Tappeiner, U. Revealing Spatial and Temporal Patterns of Outdoor Recreation in the European Alps and Their Surroundings. Ecosyst. Serv. 2018, 31, 336–350. [Google Scholar] [CrossRef]
  6. Chiesura, A. The Role of Urban Parks for the Sustainable City. Landsc. Urban Plan. 2004, 68, 129–138. [Google Scholar] [CrossRef]
  7. Cheng, X.; Van Damme, S.; Li, L.; Uyttenhove, P. Evaluation of Cultural Ecosystem Services: A Review of Methods. Ecosyst. Serv. 2019, 37, 100925. [Google Scholar] [CrossRef]
  8. Adhikary, M.; Ghosh, D.; Mandal, B.; Das, S. Estimating and Mapping the Value of Cultural Ecosystem Services in an Urban Landscape Context. Appl. Geogr. 2025, 177, 103556. [Google Scholar] [CrossRef]
  9. Browning, M.H.; Rigolon, A.; McAnirlin, O. Where Greenspace Matters Most: A Systematic Review of Urbanicity, Greenspace, and Physical Health. Landsc. Urban Plan. 2022, 217, 104233. [Google Scholar] [CrossRef]
  10. Holland, I.; DeVille, N.V.; Browning, M.H.E.M.; Buehler, R.M.; Hart, J.E.; Hipp, J.A.; Mitchell, R.; Rakow, D.A.; Schiff, J.E.; White, M.P.; et al. Measuring Nature Contact: A Narrative Review. Int. J. Environ. Res. Public. Health 2021, 18, 4092. [Google Scholar] [CrossRef]
  11. Assessment, M.E. Ecosystems and Human Well-Being: Biodiversity Synthesis; World Resources Institute: Washington, DC, USA, 2005; Volume 86, Available online: https://www.researchgate.net/publication/269576188 (accessed on 12 March 2025).
  12. Bi, X.; Gan, X.; Jiang, Z.; Li, Z.; Li, J. How Do Landscape Patterns in Urban Parks Affect Multiple Cultural Ecosystem Services Perceived by Residents? Sci. Total Environ. 2024, 946, 174255. [Google Scholar] [CrossRef]
  13. Jin, A.; Ge, Y.; Zhang, S. Spatial Characteristics of Multidimensional Urban Vitality and Its Impact Mechanisms by the Built Environment. Land 2024, 13, 991. [Google Scholar] [CrossRef]
  14. Liu, B.; Tian, Y.; Guo, M.; Tran, D.; Alwah, A.A.Q.; Xu, D. Evaluating the Disparity between Supply and Demand of Park Green Space Using a Multi-Dimensional Spatial Equity Evaluation Framework. Cities 2022, 121, 103484. [Google Scholar] [CrossRef]
  15. Taylor, L.; Leckey, E.H.; Lead, P.J.; Hochuli, D.F. What Visitors Want from Urban Parks: Diversity, Utility, Serendipity. Front. Environ. Sci. 2020, 8, 595620. [Google Scholar] [CrossRef]
  16. Bertram, C.; Rehdanz, K. Preferences for Cultural Urban Ecosystem Services: Comparing Attitudes, Perception, and Use. Ecosyst. Serv. 2015, 12, 187–199. [Google Scholar] [CrossRef]
  17. Hegetschweiler, K.T.; de Vries, S.; Arnberger, A.; Bell, S.; Brennan, M.; Siter, N.; Olafsson, A.S.; Voigt, A.; Hunziker, M. Linking Demand and Supply Factors in Identifying Cultural Ecosystem Services of Urban Green Infrastructures: A Review of European Studies. Urban For. Urban Green. 2017, 21, 48–59. [Google Scholar] [CrossRef]
  18. De Valck, J.; Broekx, S.; Liekens, I.; De Nocker, L.; Van Orshoven, J.; Vranken, L. Contrasting collective preferences for outdoor recreation and substitutability of nature areas using hot spot mapping. Landsc. Urban Plan. 2016, 151, 64–78. [Google Scholar] [CrossRef]
  19. Liu, Z.; Huang, Q.; Yang, H. Supply-Demand Spatial Patterns of Park Cultural Services in Megalopolis Area of Shenzhen, China. Ecol. Indic. 2021, 121, 107066. [Google Scholar] [CrossRef]
  20. Cao, H.; Miguez, N.G.; Mason, B.M.; Callaghan, C.T.; Qiu, J. Spatial Patterns and Interactions among Multiple Cultural Ecosystem Services across Urban Greenspaces. Ecosyst. Serv. 2025, 73, 101740. [Google Scholar] [CrossRef]
  21. Willemen, L.; Cottam, A.J.; Drakou, E.G.; Burgess, N.D. Using Social Media to Measure the Contribution of Red List Species to the Nature-Based Tourism Potential of African Protected Areas. PLoS ONE 2015, 10, e0129785. [Google Scholar] [CrossRef]
  22. Schmidt, K.; Walz, A.; Jones, I.; Metzger, M.J. The Sociocultural Value of Upland Regions in the Vicinity of Cities in Comparison with Urban Green Spaces. Mt. Res. Dev. 2016, 36, 465–474. [Google Scholar] [CrossRef]
  23. Bryce, R.; Irvine, K.N.; Church, A.; Fish, R.; Ranger, S.; Kenter, J.O. Subjective Well-Being Indicators for Large-Scale Assessment of Cultural Ecosystem Services. Ecosyst. Serv. 2016, 21, 258–269. [Google Scholar] [CrossRef]
  24. Brown, G.; Hausner, V.H. An Empirical Analysis of Cultural Ecosystem Values in Coastal Landscapes. Ocean Coast. Manag. 2017, 142, 49–60. [Google Scholar] [CrossRef]
  25. Márquez, L.A.M.; Rezende, E.C.N.; Machado, K.B.; do Nascimento, E.L.M.; Castro, J.D.B.; Nabout, J.C. Trends in Valuation Approaches for Cultural Ecosystem Services: A Systematic Literature Review. Ecosyst. Serv. 2023, 64, 101572. [Google Scholar] [CrossRef]
  26. Wei, J.; Chen, M.; Chu, C.; Zhao, C.; Xia, X.; Li, Y. Assessing Cultural Ecosystem Services Supply–Demand Balance of Urban Parks in the Context of Old and New Urban Districts. Ecol. Indic. 2024, 159, 111688. [Google Scholar] [CrossRef]
  27. Min, W.; Ming, Q.I.U.; Jieqiong, W.; Ying, P. The Supply-Demand Relation Analysis and Improvements Based on Importance-Performance Analysis of Cultural Ecosystem Services in Waterfront Areas along the Suzhou Creek in Shanghai. Landsc. Archit. 2019, 26, 107–112. [Google Scholar] [CrossRef]
  28. Wang, Y.; Shi, X.; Cheng, K.; Zhang, J.; Chang, Q. How Do Urban Park Features Affect Cultural Ecosystem Services: Quantified Evidence for Design Practices. Urban For. Urban Green. 2022, 76, 127713. [Google Scholar] [CrossRef]
  29. Zheng, H.W.; Shen, G.Q.; Wang, H. A Review of Recent Studies on Sustainable Urban Renewal. Habitat Int. 2014, 41, 272–279. [Google Scholar] [CrossRef]
  30. Liu, Y.; Cleary, A.; Fielding, K.S.; Murray, Z.; Roiko, A. Nature Connection, pro-Environmental Behaviours and Wellbeing: Understanding the Mediating Role of Nature Contact. Landsc. Urban Plan. 2022, 228, 104550. [Google Scholar] [CrossRef]
  31. Zhao, Y.; You, W.; Lin, X.; He, D. Assessing the Supply and Demand Linkage of Cultural Ecosystem Services in a Typical County-Level City with Protected Areas in China. Ecol. Indic. 2023, 147, 109992. [Google Scholar] [CrossRef]
  32. Wendel, H.E.W.; Zarger, R.K.; Mihelcic, J.R. Accessibility and Usability: Green Space Preferences, Perceptions, and Barriers in a Rapidly Urbanizing City in Latin America. Landsc. Urban Plan. 2012, 107, 272–282. [Google Scholar] [CrossRef]
  33. Long, Y.; Qin, J.; Wu, Y.; Wang, K. Analysis of Urban Park Accessibility Based on Space Syntax: Take the Urban Area of Changsha City as an Example. Land 2023, 12, 1061. [Google Scholar] [CrossRef]
  34. Wang, M.M.; Wang, Y.C. Balance or Match? Multi-Scenario Analysis and Optimization of Supply and Demand of Park Green Space with Ecological Wisdom. Chin. Landsc. Archit. 2021, 37, 37–42. [Google Scholar] [CrossRef]
  35. Yang, L.; Cao, K. Cultural Ecosystem Services Research Progress and Future Prospects: A Review. Sustainability 2022, 14, 11845. [Google Scholar] [CrossRef]
  36. Sun, X.; Li, X.; Yang, D.; He, Y. The supply-demand relationship of urban green space cultural services based on multi-source data in Chongqing. West. J. Hum. Settl. Environ. 2025, 39, 162–168. [Google Scholar] [CrossRef]
  37. Fischer, L.K.; Honold, J.; Botzat, A.; Brinkmeyer, D.; Cvejić, R.; Delshammar, T.; Elands, B.; Haase, D.; Kabisch, N.; Karle, S.J. Recreational Ecosystem Services in European Cities: Sociocultural and Geographical Contexts Matter for Park Use. Ecosyst. Serv. 2018, 31, 455–467. [Google Scholar] [CrossRef]
  38. You, C.; Qu, H.; Feng, C.-C.; Guo, L. Evaluating the match between natural ecosystem service supply and cultural ecosystem service demand: Perspectives on spatiotemporal heterogeneity. Environ. Impact Assess. Rev. 2024, 108, 107592. [Google Scholar] [CrossRef]
  39. Niu, D.; Wang, L.; Qiao, F.; Li, W. Analysis of Landscape Characteristics and Influencing Factors of Residential Areas on the Qinghai–Tibet Plateau: A Case Study of Tibet, China. Int. J. Environ. Res. Public. Health 2022, 19, 14951. [Google Scholar] [CrossRef]
  40. CJJ/T85-2017; Urban Green Space Classification Standards. China Building Industry Press: Beijing, China, 2017.
  41. Wang, Z.Z.; Zhang, L.W.; Li, X.P.; Li, Y.J.; Wang, P.T.; Yan, J.P. Spatio-Temporal Pattern of Supply-Demand Risk of Ecosystem Services at Regional Scale: A Case Study of Water Yield Service in Shaanxi Province. Acta Ecol Sin 2020, 40, 1887–1900. [Google Scholar] [CrossRef]
  42. Mangmang, W.; Yuncai, W. Measurement and Optimization of Supply and Demand of Park Green Space at Urban Block Scale: A Case Study of Yangpu District, Shanghai. Landsc. Archit. 2021, 28, 22–27. [Google Scholar] [CrossRef]
  43. Maes, J.; Paracchini, M.L.; Zulian, G.; Dunbar, M.B.; Alkemade, R. Synergies and Trade-Offs Between Ecosystem Service Supply, Biodiversity, and Habitat Conservation Status in Europe. Biol. Conserv. 2012, 155, 1–12. [Google Scholar] [CrossRef]
  44. Ala-Hulkko, T.; Kotavaara, O.; Alahuhta, J.; Helle, P.; Hjort, J. Introducing Accessibility Analysis in Mapping Cultural Ecosystem Services. Ecol. Indic. 2016, 66, 416–427. [Google Scholar] [CrossRef]
  45. La Rosa, D.; Spyra, M.; Inostroza, L. Indicators of Cultural Ecosystem Services for Urban Planning: A Review. Ecol. Indic. 2016, 61, 74–89. [Google Scholar] [CrossRef]
  46. De Luca, C.; Calcagni, F.; Tondelli, S. Assessing Distributional Justice around Cultural Ecosystem Services (CES) Provided by Urban Green Areas: The Case of Bologna. Urban For. Urban Green. 2024, 101, 128556. [Google Scholar] [CrossRef]
  47. GB/T 51346-2019; Standard for Planning of Urban Green Space. China Building Industry Press: Beijing, China, 2019.
  48. Wang, J.; Zhou, W.; Wang, J.; Qian, Y. From Quantity to Quality: Enhanced Understanding of the Changes in Urban Greenspace. Landsc. Ecol. 2019, 34, 1145–1160. [Google Scholar] [CrossRef]
  49. Stanners, D.; Bourdeau, P.; Godfrey, J. Europe’s Environment: The Dobris Assessment. Nature 1996, 383, 138. [Google Scholar]
  50. Wu, W.; Ding, K. Optimization Strategy for Parks and Green Spaces in Shenyang City: Improving the Supply Quality and Accessibility. Int. J. Environ. Res. Public. Health 2022, 19, 4443. [Google Scholar] [CrossRef]
  51. Xu, Y.; Xu, X.; Tang, Q. Human Activity Intensity of Land Surface: Concept, Methods and Application in China. J. Geogr. Sci. 2016, 26, 1349–1361. [Google Scholar] [CrossRef]
  52. Liu, S.; Ying, Y.; Yan, W. Research Framework of Green Space Allocation in Parks Based on Cultural Ecosystem Services Supply-Demand Balance. J. Chin. Urban For. 2021, 19, 14–18. [Google Scholar] [CrossRef]
  53. Wang, S.; Kong, W.; Ren, L.; Zhi, D. Research on Misuses and Modification of Coupling Coordination Degree Model in China. J. Nat. Resour. 2021, 36, 793–810. [Google Scholar] [CrossRef]
  54. Wang, C.; Huang, S.; Deng, M.; Wei, W. Research on Equity of Park Green Spaces in High-Density Cities from the Perspective of Supply-Demand Coupling Coordination: A Case Study of Longhua District, Shenzhen. Landsc Arch. 2023, 39, 79–84. [Google Scholar] [CrossRef]
  55. Luo, C.; Wang, F. Identifying Supply-Demand Spatial Matches of Cultural Ecosystem Services Provided by Urban Parks in Polycentric Mountainous Cities. Acta Ecol. Sin. 2024, 44, 5816–5827. [Google Scholar] [CrossRef]
  56. Pert, P.L.; Hill, R.; Maclean, K.; Dale, A.; Rist, P.; Schmider, J.; Talbot, L.; Tawake, L. Mapping Cultural Ecosystem Services with Rainforest Aboriginal Peoples: Integrating Biocultural Diversity, Governance and Social Variation. Ecosyst. Serv. 2015, 13, 41–56. [Google Scholar] [CrossRef]
  57. Xiao, L.; Haiping, T.; Haoguang, L. A Theoretical Framework for Researching Cultural Ecosystem Service Flows in Urban Agglomerations. Ecosyst. Serv. 2017, 28, 95–104. [Google Scholar] [CrossRef]
  58. Zwierzchowska, I.; Hof, A.; Iojă, I.-C.; Mueller, C.; Poniży, L.; Breuste, J.; Mizgajski, A. Multi-Scale Assessment of Cultural Ecosystem Services of Parks in Central European Cities. Urban For. Urban Green. 2018, 30, 84–97. [Google Scholar] [CrossRef]
  59. Tengberg, A.; Fredholm, S.; Eliasson, I.; Knez, I.; Saltzman, K.; Wetterberg, O. Cultural Ecosystem Services Provided by Landscapes: Assessment of Heritage Values and Identity. Ecosyst. Serv. 2012, 2, 14–26. [Google Scholar] [CrossRef]
  60. Huabin, X.; Xinyu, H.; Yue, W.; Jiening, W.; Qianzi, J. Research Progress on the Correlation between Urban Green Space and Residents’ Physical and Mental Well-Being from a Perspective of Matching Ecosystem Services Supply and Demand. Acta Ecol Sin 2021, 41, 5045–5053. [Google Scholar] [CrossRef]
  61. Chen, T.; Lang, W.; Chan, E.; Philipp, C.H. Lhasa: Urbanising China in the Frontier Regions. Cities 2018, 74, 343–353. [Google Scholar] [CrossRef]
  62. Dickinson, D.C.; Hobbs, R.J. Cultural Ecosystem Services: Characteristics, Challenges and Lessons for Urban Green Space Research. Ecosyst. Serv. 2017, 25, 179–194. [Google Scholar] [CrossRef]
  63. Buchel, S.; Frantzeskaki, N. Citizens’ Voice: A Case Study about Perceived Ecosystem Services by Urban Park Users in Rotterdam, the Netherlands. Ecosyst. Serv. 2015, 12, 169–177. [Google Scholar] [CrossRef]
Figure 1. Location of the central urban area of Lhasa. (a) The location of Lhasa’s central urban area within Lhasa City and the Tibet Autonomous Region. (b) Communities in the map are labeled with numerical codes; detailed names are provided in Appendix A.2.
Land 14 01301 g001
Figure 2. Distribution of parks in the central urban area of Lhasa.
Land 14 01301 g002
Figure 3. Analysis and optimization framework for the cultural ecosystem services (CES) supply–demand match.
Land 14 01301 g003
Figure 4. Score of 113 City Park Indicators. Park IDs (x-axis), 8 recreational indicators (y-axis); colors/sizes show potential levels. Park names and values in Appendix A.1.
Land 14 01301 g004
Figure 5. CES supply of parks for each indicator (a) Recreational Potential Indicators; (b) Recreational Opportunities Indicators.
Land 14 01301 g005
Figure 6. The CES supply of parks in central urban area of Lhasa at the community scale.
Land 14 01301 g006
Figure 7. Demand for CES of parks by each indicator: (a) Social Demand (b) Material Demand.
Land 14 01301 g007
Figure 8. The demand for parks in central urban area of Lhasa at the community scale.
Land 14 01301 g008
Figure 9. CES supply and demand balance distribution.
Land 14 01301 g009
Figure 10. The spatial distribution of the coupling coordination degree (CCD).
Land 14 01301 g010
Table 1. Indicator system for evaluating the supply of cultural ecosystem services (CES) in parks.
CategoryPrimary IndicatorSecondary IndicatorIndicator Description
SupplyEntertainment potentialPark areaLarger parks often exhibit higher spatial complexity and environmental connectivity, which enhances the visual layering and aesthetic quality of the landscape.
Visible scenic area ratioBased on the geographical characteristics and natural worship concepts of Lhasa, mountains and water are the main objects of scenic area calculation.
NDVI indexThe NDVI index reflects vegetation productivity, indicating the quality of park vegetation, and is positively correlated with the aesthetic value of cultural services and the sense of well-being of the population.
Recreational land area ratioUrban parks provide spatial carriers for CES, and the larger the available recreational area, the more tourists it can accommodate, and the higher the recreational value.
Park road area ratioThe larger the park road area ratio, the greater the possibility of activities such as walking and running, and the higher the recreational value.
Number of art works per unit areaUrban parks inspire artists to create, and through park-related art sculptures, inscriptions, and poetry, they showcase their inspirational value.
Number of scientific research papers published per unit areaBuildings, vegetation, water, and other essential elements in parks, as well as cultural connotations, can provide research objects for scientific education.
Number of cultural relics and events per unit areaCultural relics are products accumulated over historical periods, and their value is deeply connected with the service environment of the area.
Entertainment opportunitiesWalkability effective service area ratioThe proportion of residential areas covered by walking within 5, 10, and 15 min.
Non-motor vehicle accessibility effective service area ratioThe proportion of residential areas covered by non-motor vehicle travel within 5, 10, and 15 min.
Table 2. Service radius standards for different park types.
Type of ParksService Radius (m)Appropriate Scale (hm2)Functional CharacteristicNumber of Parks Average Area
Comprehensive park300020–50Green spaces with rich contents suitable for various types of outdoor activities and with comprehensive recreational and ancillary management and service facilities811.67
200010–20
Specialised park300020–50Green space with specific content or form with appropriate recreational and service facilities, including botanical gardens, historical gardens, heritage parks, play parks, children’s parks, sports parks, waterfront parks, etc.2220.14
200010–20
10005–10
5002–5
Community park10005–10Green spaces with independent sites and basic recreational and service facilities, mainly serving residents within a certain community area to carry out daily recreational activities nearby332.96
5001–5
Recreation park3000.2–1Green spaces with independent sites, small scale or diversified shapes, convenient for residents to enter in the vicinity and with certain open space functions502.17
Table 3. Indicator system for evaluating the demand of CES in parks.
CategoryPrimary IndicatorSecondary IndicatorIndicator Description
DemandSocial DemandHuman Activity IntensityReflects the degree of human impact and activity on the land surface, the size of population demand, and serves as a comprehensive indicator of human impact and activity on the land surface.
Population DensityThe number of people per unit area, reflecting the spatial distribution of the population. The larger the value, the greater the residents’ demand for parks; conversely, the smaller the value, the smaller the residents’ demand.
Material DemandCommercial Service CapabilityReflects the intensity of regional economic activities. The larger the value, the more concentrated the development area, and the greater the demand for open spaces such as park green spaces.
Development and Construction IntensityMeasured by the proportion of construction land within the community. The larger the value, the higher the degree of urban construction, and the greater the demand for open spaces such as park green spaces.
Table 4. Classification and coordination development degree of supply and demand matching types.
Area ProportionSupply and Demand Matching TypeArea ProportionCommunity Quantity
Coordinated Development6.75Oversupply1.021
High-Level Balance3.7311
Low-Level Balance1.799
Undersupply0.217
Transition
Development
38.14Oversupply15.195
High-Level Balance0.000
Low-Level Balance22.9519
Undersupply0.000
Uncoordinated and Decline55.11Oversupply0.000
High-Level Balance0.000
Low-Level Balance29.6311
Undersupply25.4812
Disclaimer/Publisher’s Note: The statements, opinions and data contained in all publications are solely those of the individual author(s) and contributor(s) and not of MDPI and/or the editor(s). MDPI and/or the editor(s) disclaim responsibility for any injury to people or property resulting from any ideas, methods, instructions or products referred to in the content.

