Abstract
Climate change poses substantial threats to natural ecosystems and human livelihoods, particularly in coastal regions, by intensifying coastal erosion. This process leads to land loss, infrastructure damage, and habitat destruction while amplifying challenges such as sea-level rise, flooding, desertification, and salinization. In Vietnam’s Red River Delta (RRD), the dynamic interplay between erosion and accretion presents a highly complex challenge, necessitating effective risk assessment and management to safeguard communities and resources. Using the principles of natural disaster risk assessment and comprehensive analysis, this study develops a coastal erosion risk assessment framework incorporating hazard, exposure, and vulnerability dimensions. The framework integrates 17 indicators, including human activities, socioeconomic factors, shoreline type, and vegetation cover, with indicator weights determined through expert evaluation and the analytic hierarchy process. The application of this framework reveals that coastal erosion risk in the RRD is relatively high, with greater risk concentrated in the central and northern segments of the coastline compared to the flanking areas. This framework offers valuable insights for coastal erosion prevention, mitigation strategies, and the optimization of coastal spatial planning. The application of coastal erosion risk assessment methods provides a relatively complete foundation for developing comprehensive prevention and adaptation solutions in the future. Through the system of parameters and corresponding weights, it provides an overview of potential responses to future impacts while identifying current high-risk zones specifically and accurately, thereby assessing the importance of each parameter on that impact. Based on specific analysis of assessment results, a reasonable resource use and management policy can be developed to minimize related natural disasters. Therefore, two main groups of solutions proposed under the “Protection—Adaptation” strategy are proposed to prevent natural disasters, minimize risks and sustainably develop the coastal area of the RRD.
1. Introduction
The coastal zone is a unique geographical region where marine and terrestrial systems intersect, interact, and overlap. It is one of the most dynamic natural areas, characterized by diverse phenomena and processes, abundant resources, and favorable conditions for development. Coastal zones are intrinsically linked to human survival and development, with approximately 70% of the global population residing in these areas [1]. However, these regions face significant challenges, including rising sea levels, saltwater intrusion, and geological disasters such as tsunamis, earthquakes, land subsidence, and cumulative erosion.
Throughout human history, natural disasters have continually impacted societies. According to Annan [2], natural events become disasters only when they adversely affect human life and production. While natural disasters cannot be entirely avoided, efforts can be made to reduce their risks, adapt to their impacts, and develop strategies to minimize damage. This is especially critical for coastal zones, where dense populations and high economic activity amplify the potential consequences of disasters. As climate change intensifies, rising sea levels are accelerating the rate of erosion in coastal areas, posing a great threat to densely populated coastal cities [3].
Risk assessment is a cornerstone of disaster management, offering insights into the likelihood of losses by analyzing hazards, vulnerabilities, and exposures. As defined by the United Nations International Strategy for Disaster Reduction (UNISDR, 2009), risk assessment is the process of determining potential losses by analyzing hazards and vulnerabilities that threaten people, property, livelihoods, and the environment. The 2017 UNISDR report further elaborates on risk assessment as a qualitative or quantitative approach to evaluate disaster risks by examining hazards and existing conditions of exposure and vulnerability (UNISDR, 2017). The methodologies for disaster risk assessment vary, influenced by the type of disaster, regional characteristics, and available data. While qualitative methods have been applied in several studies [4,5], quantitative risk assessments often focus on single hazards, such as coastal erosion. However, comprehensive studies assessing the overall risk of marine geological hazards remain limited. Quantitative assessments frequently employ models like the analytic hierarchy process (AHP) or other risk assessment models, which determine indicator weights under various criteria and calculate risk levels through linear superposition [6,7,8,9]. The AHP method is common in the assessment of coastal hazards, including storm surges, coastal erosion, etc. [10,11,12]. This method can compare the importance of disaster impacts, transforming qualitative analysis into quantitative analysis, and then calculate the contribution of different factors to the impact level and identify the affected areas [13,14]. The construction of risk assessment frameworks for coastal geological disasters varies across studies, influenced by differing disaster types, regional factors, and researcher preferences [15,16]. These frameworks typically involve hazard and vulnerability assessments, forming the basis for overall risk evaluations.
Scholars also diverge in their definitions of vulnerability. Some define it as a measure of physical vulnerability, exposure, and disaster mitigation capacity, while others separate exposure and mitigation capacity into distinct categories [17,18,19,20]. Despite these differences, the fundamental components of risk assessment remain consistent. Studies focusing on coastal erosion hazards (Pei et al., 2016 [21]) and vulnerability illustrate the diversity of approaches in the field (Liu et al., 2010 [8]; Jiang et al., 2008 [14]; Abuodha et al., 2010 [1]; Kumar et al., 2012 [17]; Bryan et al., 2005 [22]; Djouder et al., 2017 [23]; Murali et al., 2013 [16]; Yin et al., 2012 [24]; Theocharidis et al., 2024 [25]; Wang et al., 2024 [26]).
Currently, there is limited research on coastal erosion risk assessment in the RRD, and most studies focus on vulnerability to coastal erosion at the provincial level. Existing research primarily addresses issues like seawater intrusion, flooding due to sea-level rise, and general coastal vulnerability. For example, Nguyen et al. [27] assessed coastal vulnerability in the RRD based on topographical, ecological, and socio-economic indicators. Their results showed that 15.2 km of coastline exhibited low vulnerability, 3.2 km had moderate vulnerability, and 2 km were highly vulnerable, with 0.8 km of coastline classified as very highly vulnerable. Ve, N.D et al. [28] evaluated the coastal vulnerability of Nam Dinh Province using similar indicators and proposed three main adaptation strategies: protection, accommodation, and retreat. The RRD is one of Vietnam’s most densely populated regions, with over 1450 people per square kilometer, and plays a vital role in the country’s social and economic development. However, it is highly vulnerable to natural disasters, particularly in the context of climate change and sea-level rise. Integrated coastal zone management in the RRD is crucial for disaster prevention, risk reduction, and sustainable development. Risk assessment and zoning are necessary components of effective coastal management in Vietnam. Current studies lack a large-scale and comprehensive assessment of the risk of coastal erosion in RRD, resulting in the neglect of risks in many places. If not responded to in a timely manner, the erosion will lead to widespread property losses.
This study aims to evaluate the risk of coastal erosion in the RRD through a comprehensive analysis of hazards, exposure, and vulnerability. Each factor will be assessed through grading and superimposed using a weight coefficient method. The hazard analysis involves a comprehensive review of historical disaster data, evaluating the intensity, frequency, and geographic extent of past events. Exposure analysis examines the elements within the disaster-prone areas, identifying the population and assets at risk. Vulnerability analysis assesses the resilience of disaster-prone areas by analyzing their sensitivity to various types of disasters, along with the capacity for disaster mitigation and adaptation. The results will shed light on the potential impacts on human populations, infrastructure, property, and land resources. Based on specific analysis of risk assessment results, it is possible to develop appropriate adaptation solutions while creating a foundation for developing a reasonable resource use and management policy to minimize related natural disasters.
2. Materials and Methods
2.1. Study Area
The Red River is the second largest in Vietnam, following the Mekong River. The 2022 statistics show that the population of the RRD area exceeds 7 million people. Among them, Hai Phong has the largest population, reaching 2.08 million [29].
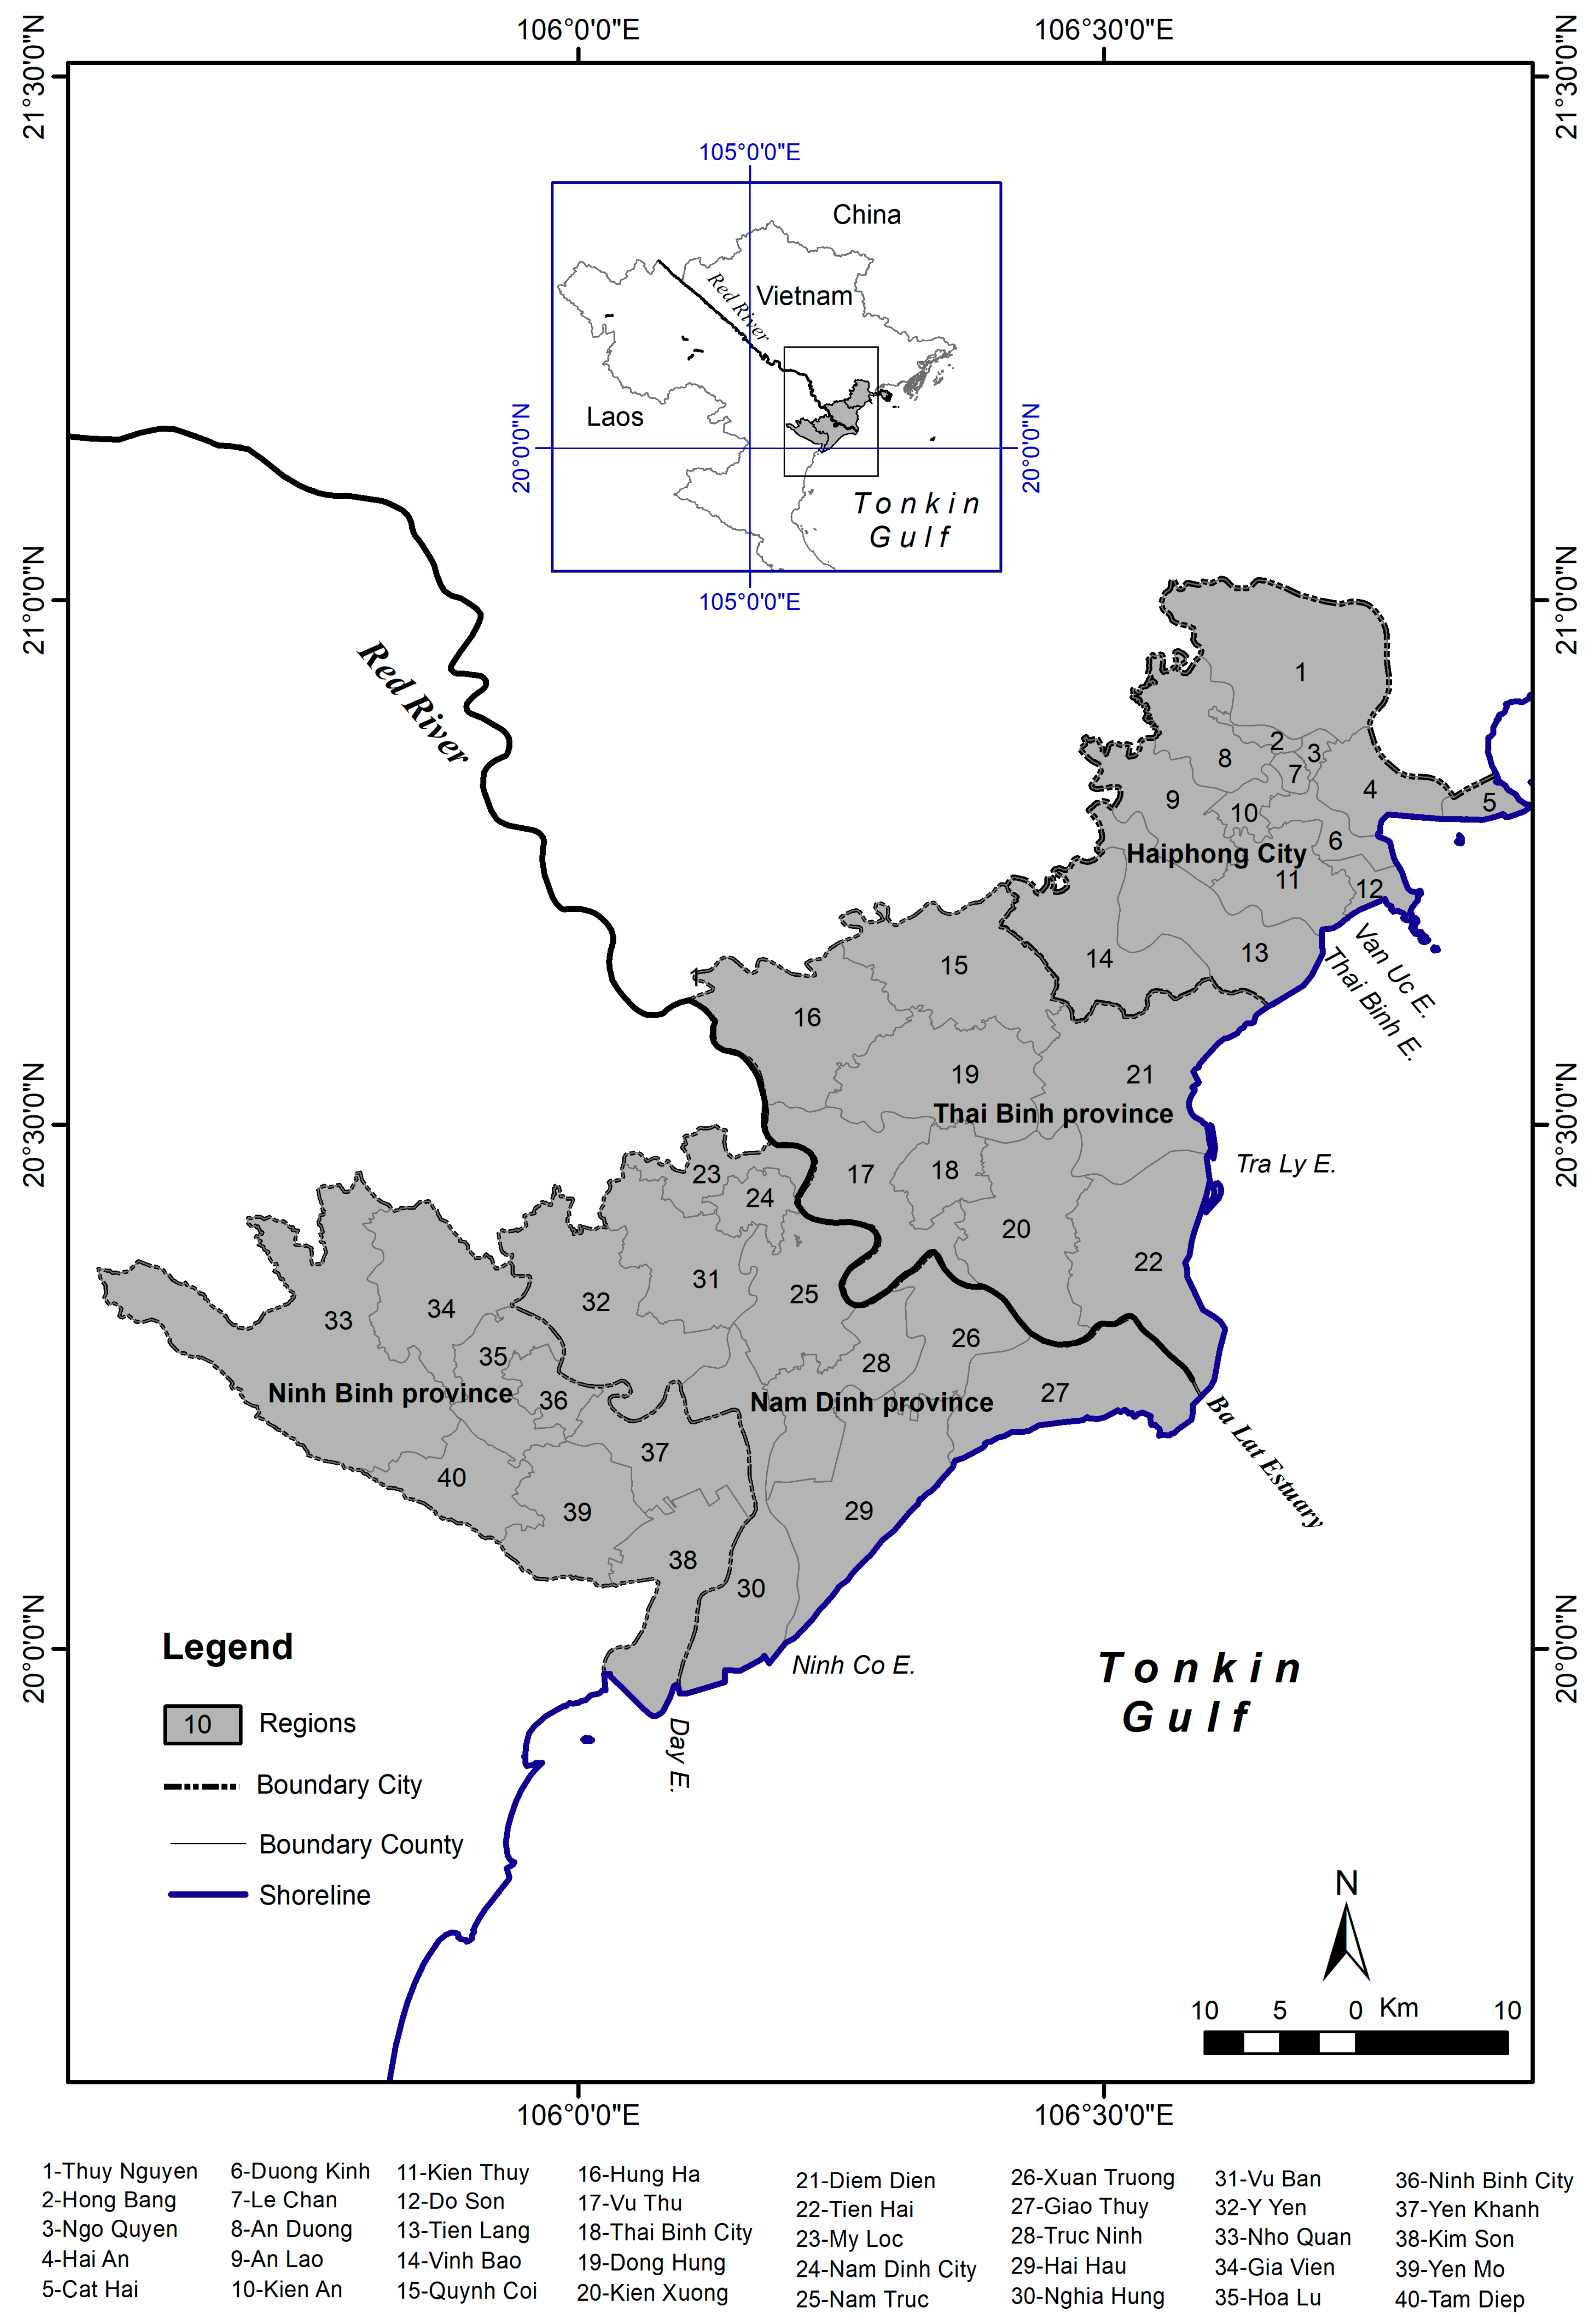
The Red River originates from the Tibetan Plateau in China and flows into Vietnam through Lao Cai, traversing Yen Bai, Phu Tho, and Hanoi, before forming the Red River Delta (RRD) and discharging into the sea through six main outlets: Van Uc, Thai Binh, Tra Ly, Ba Lat, Ninh Co, and Day (Figure 1). The RRD coastal zone spans approximately 120 km, extending from Do Son to Lach Truong, covering an area of about 17,000 km2. Much of this low-lying region is less than three meters above sea level, with significant portions less than one meter, making it home to vital socio-economic and residential areas in northern Vietnam [30]. Furthermore, agricultural land is the basic resource of the region, deposited by alluvium from the Red River and Thai Binh River systems. Currently, over 103 million hectares of land have been used, accounting for 82.48% of the region’s natural land area and 5.5% of the country’s land use area. Thus, the land use level of the region is the highest compared to other regions in the country [31]. This study focuses on coastal districts in four provinces within the RRD: Hai Phong, Thai Binh, Nam Dinh, and Ninh Binh.
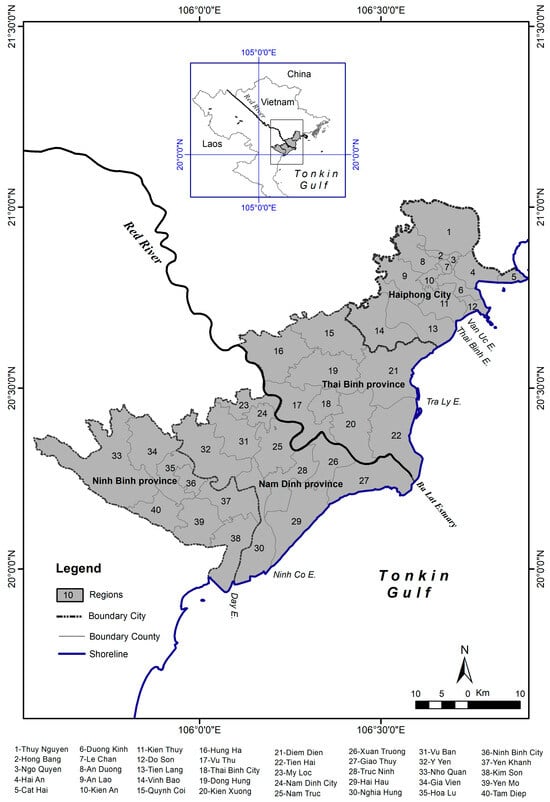
Figure 1.
The study area.
Elevation:
The RRD is one of the lowest-lying and most densely populated deltas in Southeast Asia, characterized by a flat coastal plain formed through long-term fluvial and marine sedimentation processes. The elevation of the delta generally ranges from 0 to 3 m above sea level, with a gradual slope from the northwest highlands toward the southeast coast, where the Red River and its distributaries discharge into the Gulf of Tonkin (World Bank, 2011 [12]; Chapman et al., 2016) [32].
A significant portion of the delta lies at less than 2 m above mean sea level, particularly in coastal provinces such as Nam Dinh, Thai Binh, and Ninh Binh, making the region extremely vulnerable to natural hazards such as flooding, storm surges, sea-level rise, and saltwater intrusion. This vulnerability is exacerbated by climate change and land subsidence driven by both natural compaction and human activities, including groundwater extraction and infrastructural loading (Yin et al., 2020) [33].
The terrain of the RRD is the result of millennia of alluvial deposition, primarily from the Red River and its tributaries, which has created extensive floodplains, levees, intertidal flats, and coastal sand dunes. Tidal processes, particularly in the estuarine and coastal fringe, have also contributed to shaping the modern deltaic landscape. Areas near the river mouths and the coast are especially flat and low-lying, often below high tide level, requiring protective systems such as dikes and sluices to prevent inundation (Tanaka et al., 2001) [34].
Water System:
The RRD features a dense, interconnected, and historically modified river network, dominated by the Red River and its major tributaries: the Da River, Lo River, and Thai Binh River. These rivers originate from mountainous areas in China and northern Vietnam, converging in the delta before discharging into the Gulf of Tonkin. Together, they form a complex fluvial system that is essential for agriculture, water supply, transportation, and ecosystem functions across the region (Dang, T. H. et al., 2010) [35].
Over centuries, and particularly since the 20th century, the natural hydrological regime of the delta has been heavily modified by human activity. The river system is now intensively controlled through a vast infrastructure of dikes, levees, canals, sluice gates, and pumping stations, built primarily for purposes of irrigation, flood control, and drainage (MRC, 2009 [36]; Nguyen, V. L. et al., 2014 [37]). This engineered system is crucial in protecting agricultural lands and densely populated areas from annual flooding while also enabling triple-crop rice cultivation in some districts.
Seasonal monsoonal rainfall plays a significant role in determining the hydrological dynamics of the delta. During the rainy season (April to October), influenced by the southwest monsoon, precipitation increases sharply, leading to higher river discharge, flooding risk, and elevated groundwater levels. In contrast, the dry season (November to March) sees lower rainfall and water levels, often requiring artificial irrigation to sustain agriculture. River discharge can vary by a factor of 3–5 between these two seasons (Le, T. V. H. et al., 2007) [15].
The Red River system’s discharge is also affected by upstream water use and dam operation, particularly in China and northern Vietnam. The construction of large reservoirs like Hoa Binh (on the Da River) and Thac Ba (on the Chay River) has significantly altered the seasonal flow regime, reducing peak floods but also affecting sediment delivery and downstream water availability (Pham, T. T. et al., 2018) [38].
Annually, the Red River system contributes approximately 120.106 tons of sediment to the ocean. The Red River described the delta in the early 20th century, stating that “the terrain of the RRD has been paralyzed during evolution” [39]. In recent decades, human activities (such as building a system of dams and water reservoirs in the basin and reclaiming in the coastal delta [11,13,28] have significantly influenced the river basin, resulting in reduced sediment availability and adverse effects on the environment and coastal ecosystems. Several studies by Vietnamese and international scientists have explored the geology, geomorphology, and evolution of the delta. Key research includes investigations into the annual sediment flow of the Red River [40], N.D et al. (2021) studied the diffusion process of alluvial materials along the deltaic coastline [28] and the impact of sediment supply on coastal morphology and associated hazards [11].
Before 2000, almost all coastal areas of RRD had eroded; erosion of coastal Cat Hai Island (Hai Phong City) and coastal Hai Hau (Nam Dinh province) was very strong [41]. The cause of coastal RRD erosion is natural factors such as tectonic movement (tectonic subsidence is dominant). However, in the river mouths (Ba Lat, Cua Day), accretion is strong. From 2000 up to now, along the coast, RRD has been mainly stable because of protection solutions (construction of sea dikes, groins, etc.) and mangrove planting; however, some areas have eroded, such as Hai Thinh and Thinh Long, Hai Hau district, Nam Dinh province, because of a lack of sediment and sea level rise.
Vegetation:
The vegetation of the Red River Delta reflects a long history of human settlement, intensive agriculture, and significant modification of coastal ecosystems. The dominant land cover in the delta consists of agricultural land, particularly rice paddies, which thrive due to the region’s fertile alluvial soils and a well-developed irrigation system (Nguyen et al., 2008) [27]. Over time, natural vegetation—especially mangrove forests that were once widespread along estuarine and coastal zones—has been significantly reduced as a result of extensive land conversion for aquaculture and agriculture (Hong et al., 1993) [42]. Xuan Thuy National Park in Nam Dinh Province and the Tien Hai Wetlands in Thai Binh Province (Tran et al., 2019) [19]. In these and other coastal regions, salt-tolerant species, including Avicennia, Rhizophora, and Sonneratia, remain prevalent, particularly in zones undergoing ecological restoration (Tran et al., 2017) [43]. Furthermore, planted forest species such as Casuarina equisetifolia are commonly used as windbreaks and for coastal erosion control in sandy coastal environments (Nguyen et al., 2008) [27].
Temperatures:
The RRD experiences a humid subtropical monsoon climate characterized by distinct seasonal temperature variations. The average annual temperature typically ranges from 22 °C to 24 °C. During summer months, from May to September, the region is hot and humid, with average temperatures between 27 °C and 30 °C, and peak temperatures during heatwaves often reaching 35 °C to 38 °C. In contrast, winter months, from December to February, are cooler and drier, with average temperatures dropping to around 16 °C to 18 °C, and occasional cold spells causing temperatures to fall below 10 °C. The diurnal temperature range is generally moderate throughout the year but tends to be larger during the winter season due to clearer skies and lower humidity (Vietnam Institute of Meteorology, Hydrology and Climate Change [IMHEN], 2021 [44]; World Bank, 2011 [12]; General Statistics Office of Vietnam, 2020 [45]).
Precipitation:
The RRD experiences moderate to high annual precipitation, strongly influenced by the Southwest monsoon. The average yearly rainfall ranges from approximately 1600 to 2000 mm. Most of this precipitation occurs during the rainy season, from April to October, which accounts for 80–85% of the total annual rainfall. Peak rainfall typically falls between July and September, often bringing heavy downpours that can cause flooding, especially in low-lying and poorly drained areas. The dry season, spanning November to March, receives significantly less rainfall, sometimes resulting in prolonged dry spells. Additionally, the region is frequently affected by typhoons from July to November, which contribute to sudden and intense rainfall events, further impacting flood risks and water management in the delta (IMHEN, 2021 [44]; Nguyen, Ta, & Tateishi, 2000 [37]; Asian Development Bank, 2020 [46]).
Coastal Dynamics of the RRD:
The coastal zone of the RRD is characterized by a complex and dynamic hydrodynamic regime influenced primarily by tidal forces, monsoon-driven currents, and river discharge. The tide in the RRD is predominantly diurnal, with tidal amplitudes ranging from 2 to 3.5 m, decreasing from north to south along the coastline. Seasonal variations are strongly affected by the monsoon winds: the northeast monsoon dominates in winter, driving cooler and drier conditions with tidal currents flowing mainly in an anti-clockwise direction in the Gulf of Tonkin, whereas the southwest monsoon in summer brings warmer, humid weather and alters the current patterns.
Wave action is generally moderate, with average wave heights between 0.7 and 1.3 m, increasing up to 3.5 to 4.5 m during storms or typhoons, which occur primarily from July to November. The coastal circulation is also affected by freshwater discharge from the Red River and its tributaries, which fluctuates seasonally with monsoon rainfall, impacting sediment transport, erosion, and accretion processes along the delta coast.
This dynamic interplay of tides, waves, river discharge, and monsoon winds shapes the sediment distribution, coastal morphology, and ecosystem development of the Red River Delta, making it highly sensitive to climatic and anthropogenic changes (Duc, D.M et al., 2007 [47]; Fang et al., 1999 [48]; Vinh, V.D et al., [49], Fan, D et al., 2019 [50]).
2.2. Current Status of Erosion and Accretion in the RRD During the Period 1930–2024
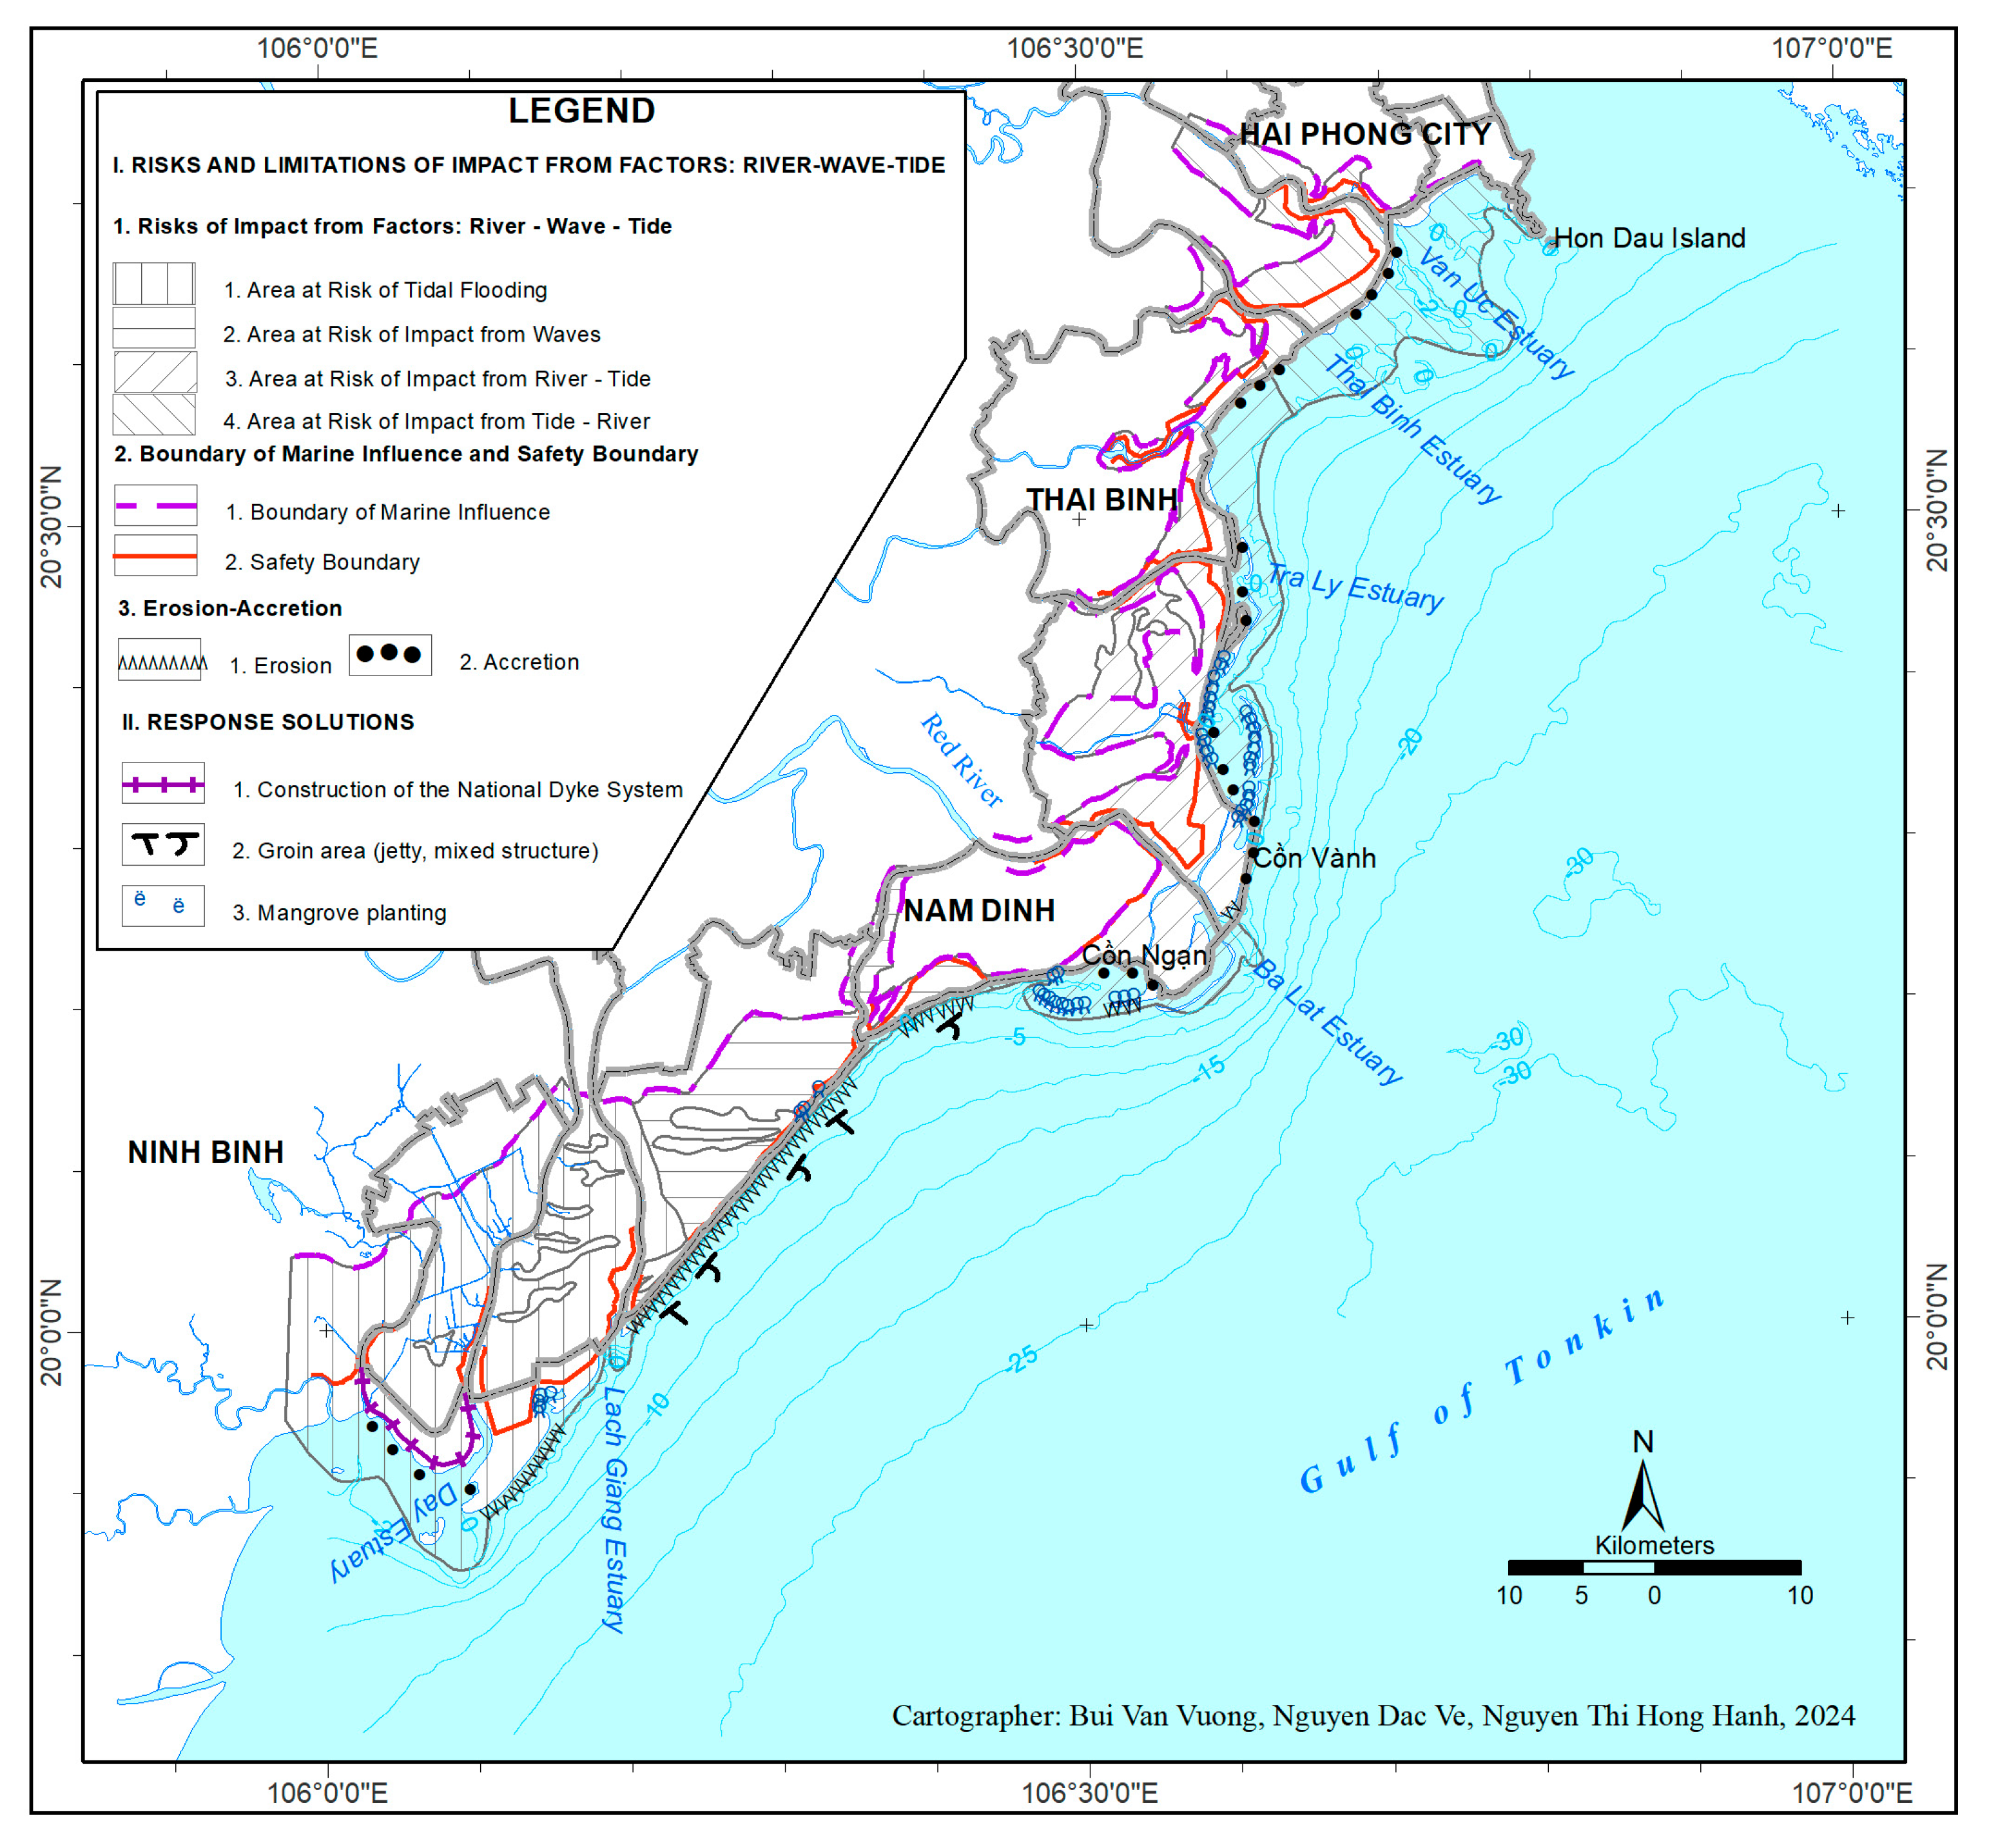
Based on the analysis of morpho-dynamic factors (River–Wave–Tide), the coastal zone of the RRD is divided into four regions: (1) Area at Risk of Tidal Flooding; (2) Area at Risk of Impact from Waves; (3) Area at Risk of Impact from River–Tide; (4) Area at Risk of Impact from Tide–River (Figure 2). Coastal shoreline changes in the Red River Delta from 1930 to 2024 have been highly complex and can be divided into four distinct periods, each associated with the following main causes of shoreline changes (Bui Van Vuong et al., 2016; 2024) [51,52]:
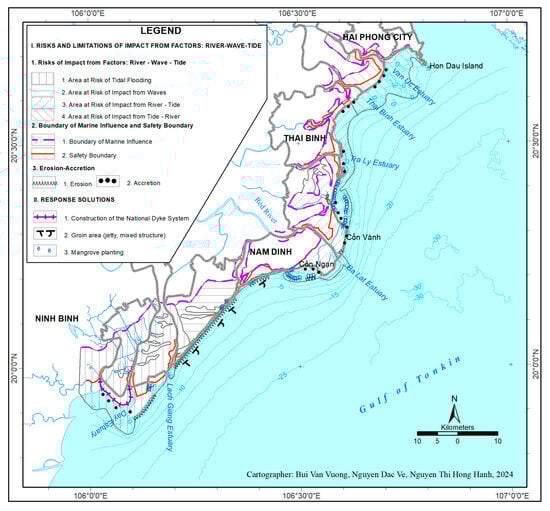
Figure 2.
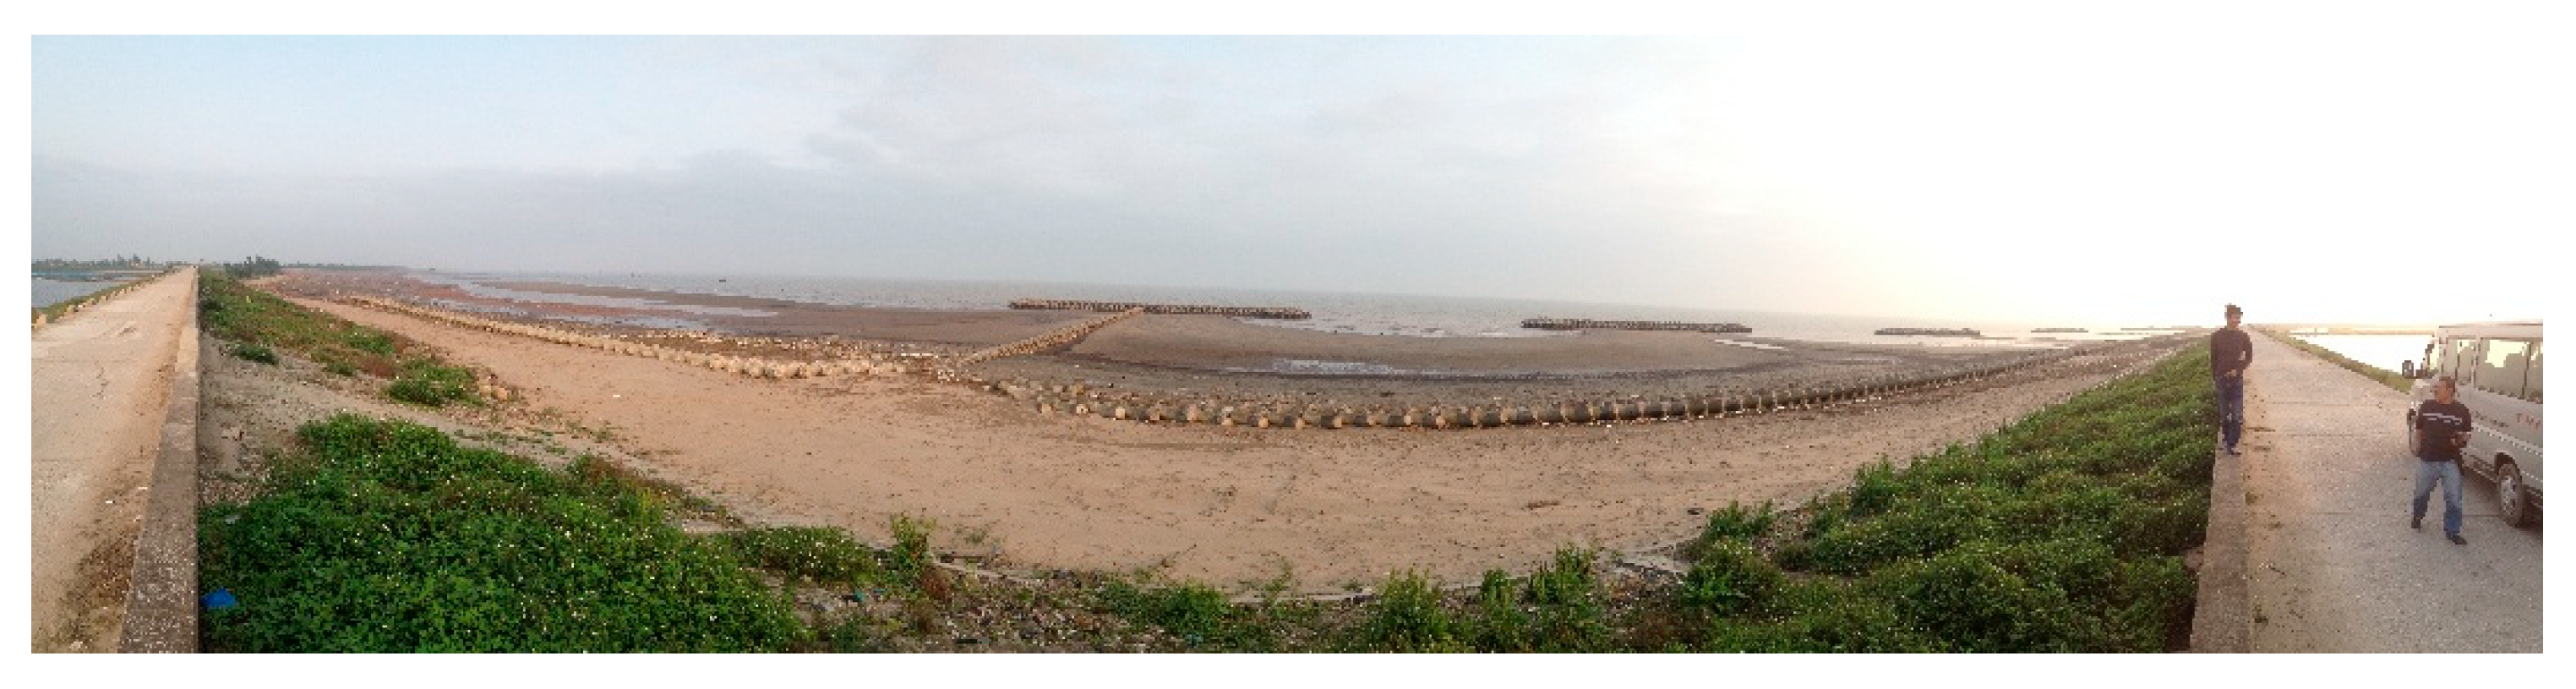
Current status of erosion and accretion and some response solutions in the coastal zone of the Red River Delta.
Period 1930–1965: Shoreline changes in the Red River Delta were mainly caused by natural processes, with minimal and almost negligible human impact.
Period 1965–1990: Human impacts on the entire river basin intensified, particularly with the construction of reservoirs. During this period, several reservoirs began to be built in the Vietnamese portion of the Red River Basin, starting in the 1970s. Key reservoirs include the Thac Ba Hydropower Reservoir (1970), the Hoa Binh Hydropower Reservoir (1990), and several smaller ones. These reservoirs altered the flow and sediment discharge from the river system to the coastal zone of the delta, changing the hydro-sedimentary dynamics and leading to more complex patterns of erosion and accretion compared to the 1930–1965 period.
Period 1990–2000: Most of the reservoirs in the basin became operational during this period, leading to sediment being trapped within the reservoirs or blocked due to river damming (such as the damming of the Sò River, which caused a sediment deficit and increased coastal erosion in Hai Hau District, Nam Đinh Province). Erosion occurred intensely and with great severity, attracting significant research efforts and technical solutions. These included afforestation initiatives such as Program 327 (1993–1998) and the PAM 5325 Project (1997–1999), among others, which were implemented to address shoreline erosion in the Red River Delta. As a result of these efforts, many previously eroding shoreline sections became stabilized.
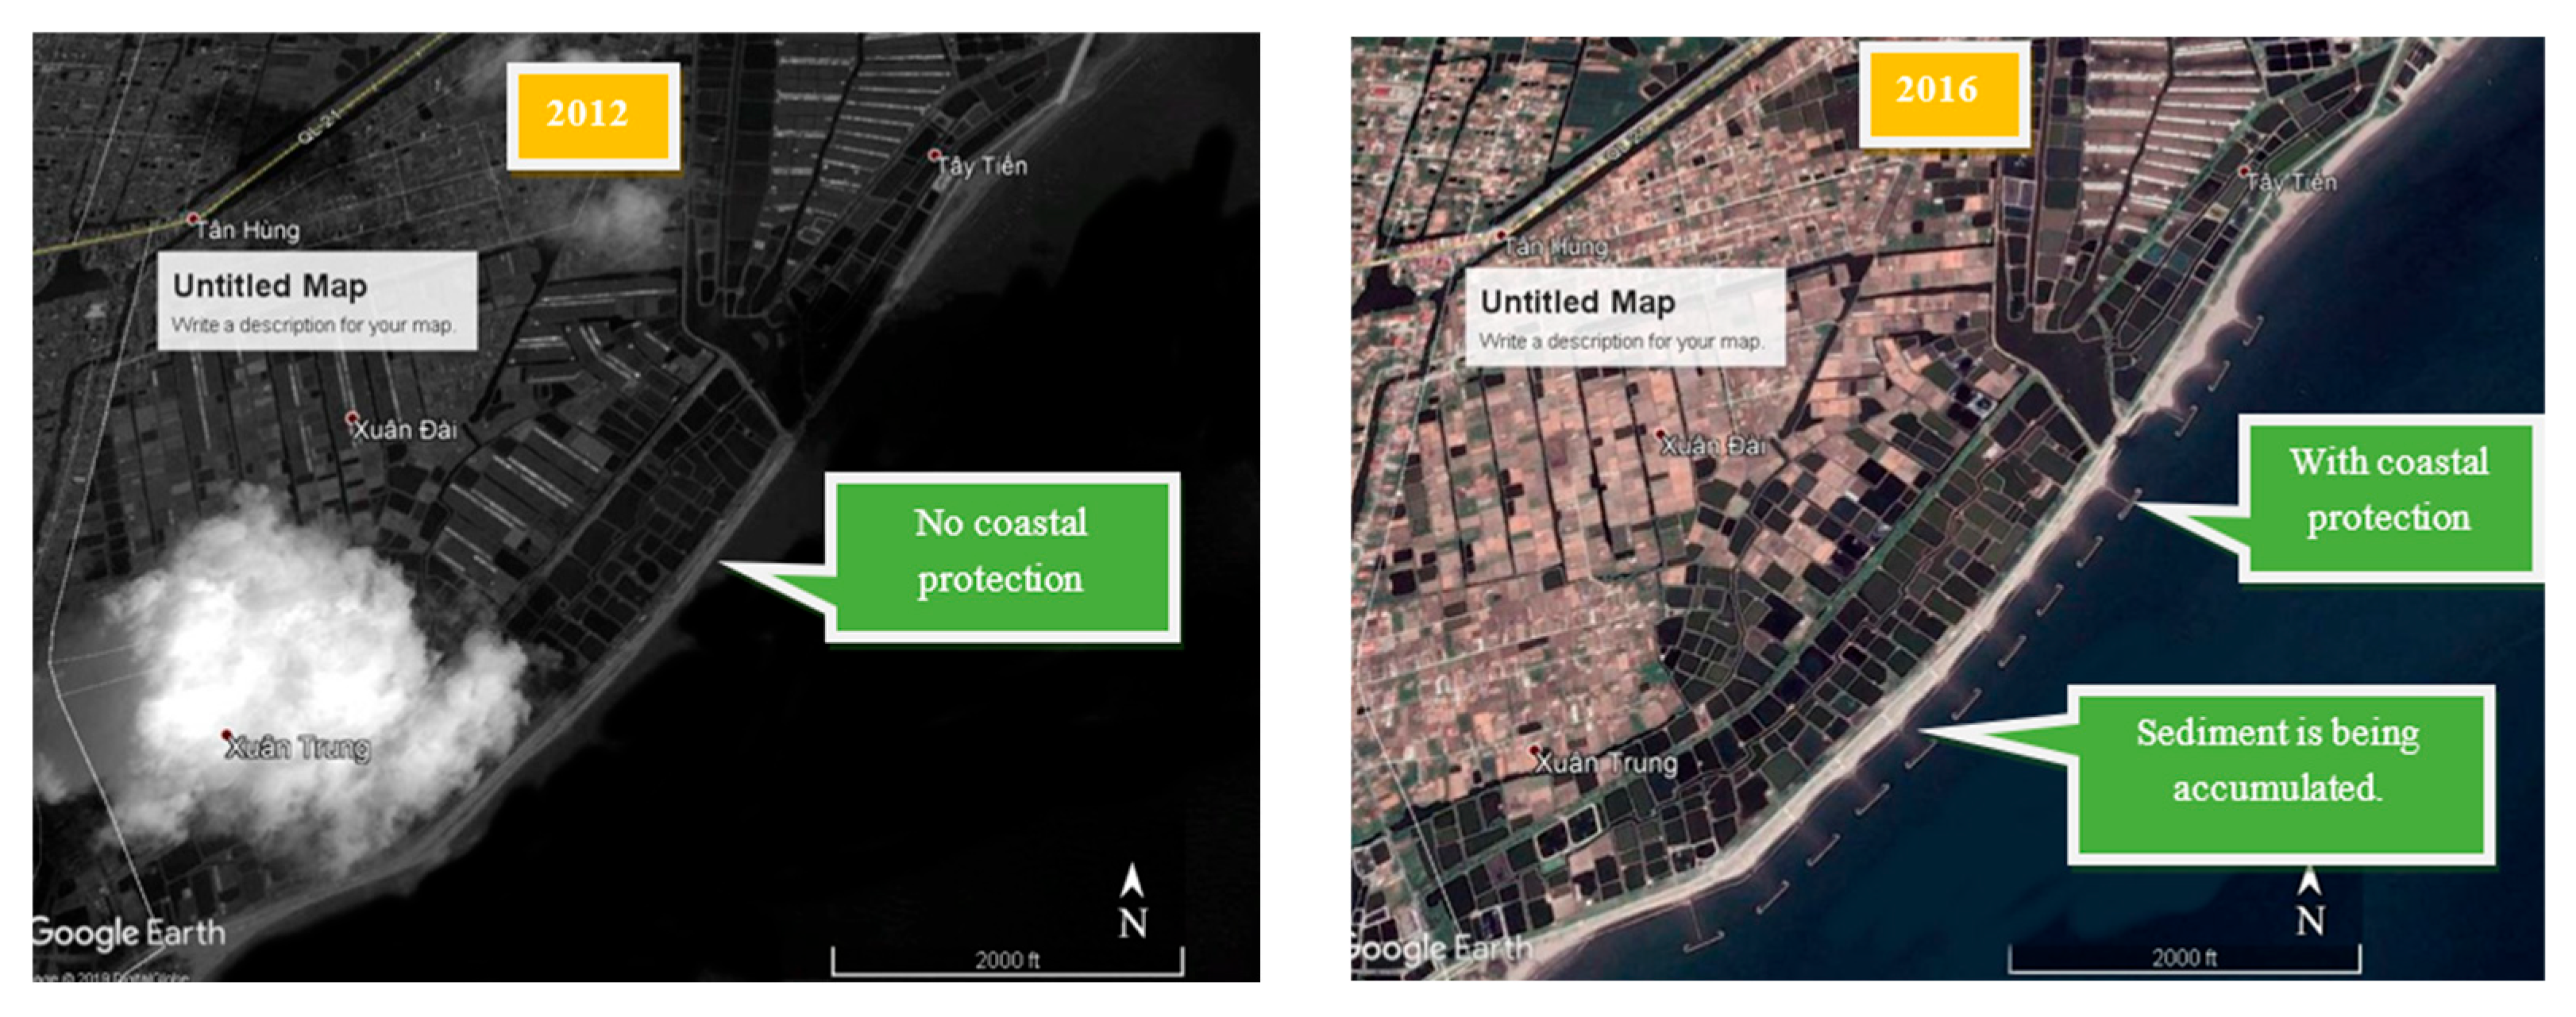
Period 2000–2024: Although sediment supply from the Red River system to the sea continued to decline during this period due to the operation of upstream reservoirs, many shoreline sections shifted from erosion to stability and accretion compared to the 1990–2000 period, thanks to the effectiveness of various anti-erosion measures. Notably, during the 10-year period from 1988 to 2008, mangrove forest area increased by 5275 hectares. Areas with significant mangrove expansion included Kien Thuy and Tien Lang (Hai Phong), Thai Thuy and Tien Hai (Thai Binh), and Nghia Hung (Nam Dinh). Along with the increase in accreted land, aquaculture pond areas expanded by approximately 12,005 hectares. The most notable increases in aquaculture pond area occurred in Tien Lang (Hai Phong), Thai Thuy and Tien Hai (Thai Binh), Giao Thuy and Nghia Hung (Nam Dinh), and Kim Son (Ninh Binh) (Van Vuong, B et al., 2016; Van Vuong, B et al., 2018; Van Vuong, B et al., 2024) [13,51,52] (Scheme 1). This phenomenon is consistent with trends observed in other river deltas around the world (Saito et al., 2007) [53]. In the current period, coastal erosion along the Red River has been addressed with the following protective measures: (1) construction of the National Dike System; (2) groin area (jetty, mixed structure) (Scheme 2); (3) mangrove planting (Figure 2).
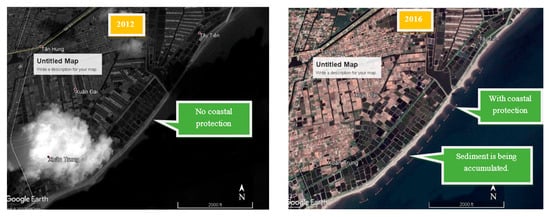
Scheme 1.
The coastal section of Hai Hau, Nam Dinh, is protected. (Source: Google Earth).

Scheme 2.
The combination of T-shaped groins and shore-parallel breakwaters forms an accreted beach section behind the coastal protection structure in Hai Hau, Nam Dinh.
2.3. Selection of Indicators and Construction of Evaluation System
Due to the varying research areas and influencing factors associated with different types of marine geological disasters, the selected assessment indicators differ accordingly. However, they generally encompass two main components: hazard assessment and vulnerability assessment. The overall risk of marine geological disasters is evaluated based on the results of these two components [18]. According to Chen [54], the risk assessment of geological disasters consists of four parts. The first is risk assessment, that is, analyzing the status of geological disaster activities and determining the intensity, frequency, density, and hazard range of geological disasters. The second is exposure assessment, which indicates the number and value of elements and the intensity of harm caused by these elements. The third aspect is vulnerability, which refers to the degree of element loss caused by a certain degree of natural disasters in the disaster. The fourth is the assessment of disaster prevention and mitigation capabilities: describing the engineering and non-engineering measures for disaster prevention, as well as the degree of recovery from disasters in the long and short term [55].
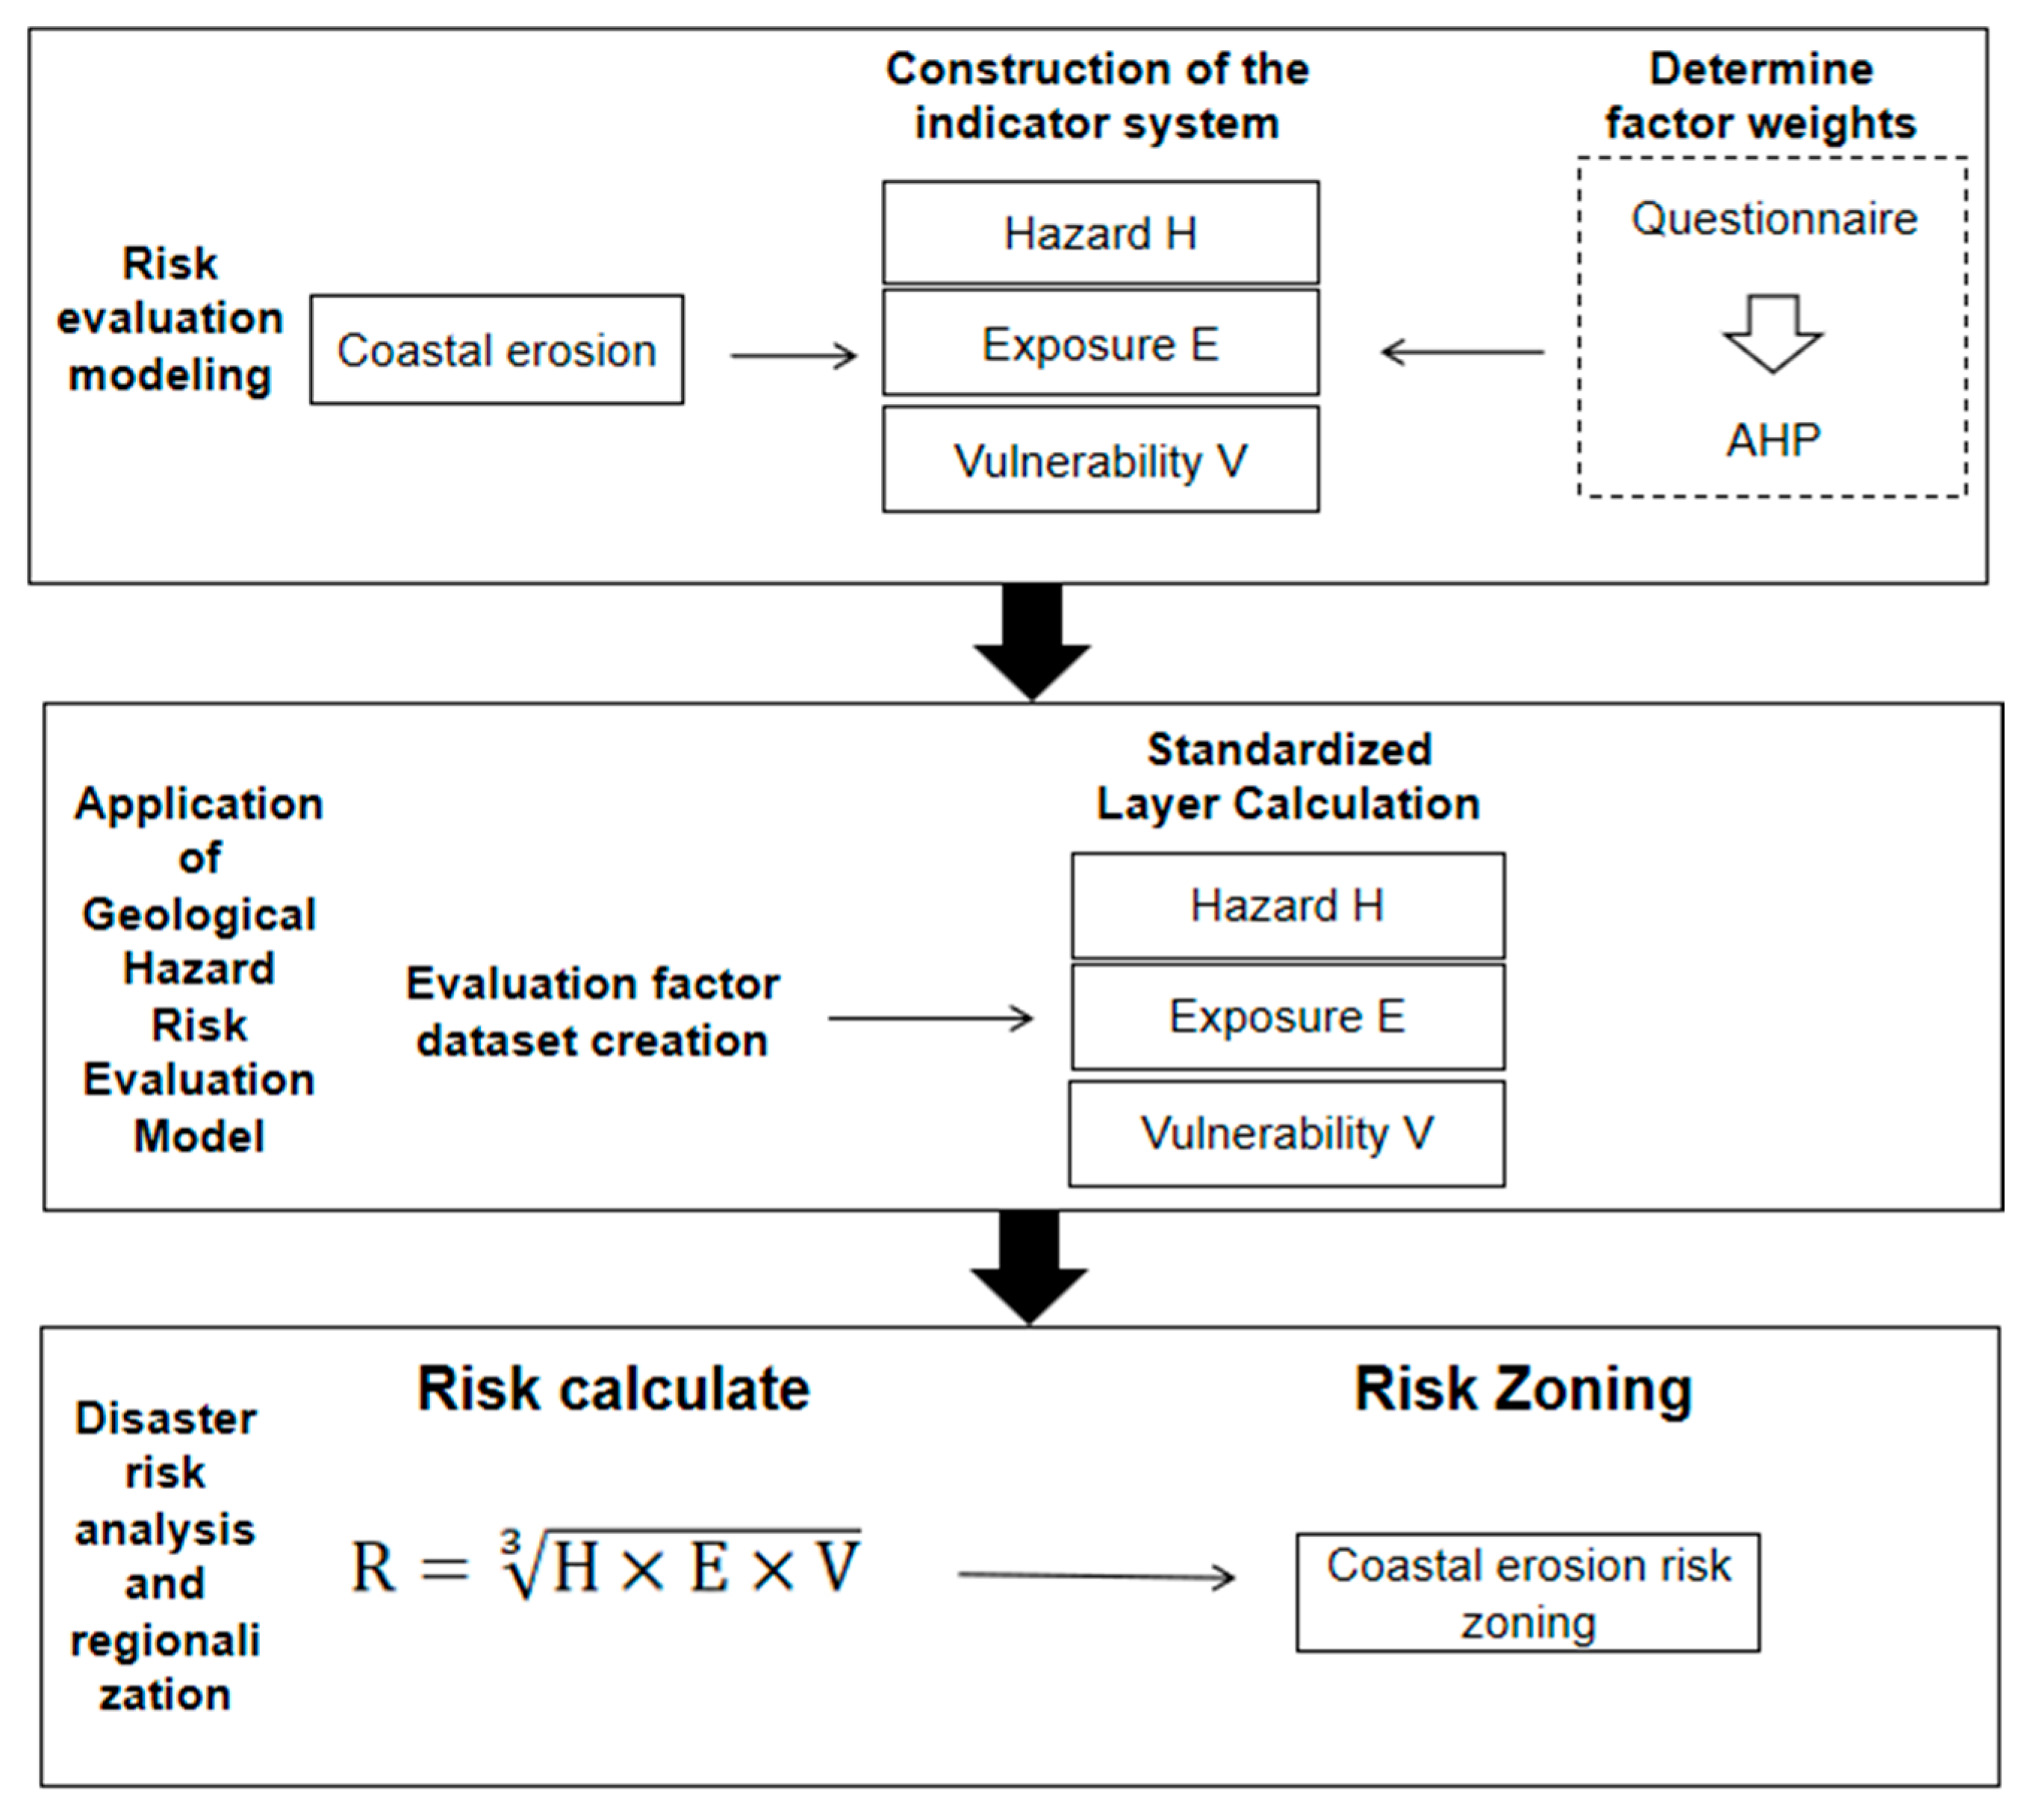
This study divides marine disaster risk assessment into three parts: disaster hazard, exposure and vulnerability (Figure 3). The weight coefficient method is used to evaluate the various factors and calculate the disaster risk. Hazard analysis refers to the comprehensive analysis of the degree of historical disaster activities and various conditions of disaster activities to evaluate the degree of danger of disaster activities, determine the density, intensity, probability of occurrence of disaster activities, and the location and scope of the possible harm area; exposure analysis is to analyze the elements within the disaster range to identify the number and area of possible disaster-prone bodies; and vulnerability analysis is to conduct a comprehensive analysis of the sensitivity of disasters of different types and intensities, as well as the analysis of disaster prevention and control projects and disaster reduction capabilities of the disaster-prone system, and comprehensively evaluate the vulnerability of the disaster-prone area, determine the population, projects, property value and damage loss rate of land and resources that may be harmed by disasters (Table 1). The specific factors are shown in Table 2.
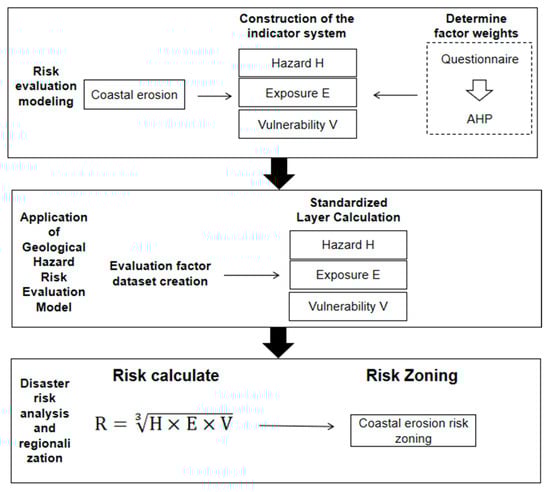
Figure 3.
Assessment steps.

Table 1.
Weighting table of coastal erosion assessment factors.
Table 2.
Classification standards for coastal erosion factors.
2.4. Coastal Erosion Assessment Methods
This research integrates advanced technologies, including neural networks, pattern recognition, and geographic information systems (GIS), to evaluate marine geological disasters. The study assesses disaster levels, evaluates disaster situations, and identifies the overall characteristics of marine geological hazards. All factor data were imported into ArcGIS 10.8. After clipping, the data were standardized to obtain the same range as the study area. The specific standardization classification method is shown in Table A2.
Hazard, exposure, and vulnerability assessments are conducted using the Graham method and range standardization. To be specific, we first list the possible influencing factors, screen them using neural networks, and then make a questionnaire to determine the weights. The Graham method quantifies the likelihood of an accident, the frequency of occurrence of personnel, and the severity of the consequences of the accident. These factors are assigned specific scores, starting with the score of dangerousness. The aggregate risk index of disasters is calculated, and the risk areas are classified into five levels: very high-risk areas (level I), high-risk areas (level II), medium-risk areas (level 3), low-risk areas (level 4), and very low-risk areas (level 5). The coastal erosion risk assessment index system is summarized in Table 1 [5,6,11,56]. The specific evaluation results are shown in Appendix A.
In addition to the evaluation factors, a questionnaire survey was conducted with 22 marine geologists, employing a hierarchical analysis approach to rate the importance of relevant indicators. The collected responses were analyzed using SPSS 26.0 software to determine the weights of each factor, as shown in Table 2. Furthermore, we use SPSS software to calculate the entropy weight (the more chaotic or disordered the system is, the lower the weight) as the reference to reduce subjective impact.
2.5. Risk Zoning Method
Building on the hazard, exposure, and vulnerability assessments of coastal erosion outlined above, this study defines disaster risk as follows:
R is the regional disaster risk result; H is the regional disaster hazard result; E is the result of regional disaster exposure; and V is the result of regional disaster vulnerability.
The risk assessment focused on coastal erosion in the RRD. Using the theoretical maximum and minimum values of the disasters, the risk levels were evenly divided into five categories (Table 3).
Table 3.
Risk zone levels.
Referring to the technical guidelines for marine disaster risk zoning and existing research, it can be seen that the current disaster zoning results are mostly analyzed based on the assessment results of the current disaster situation [54,57]. However, this study considers that the validity period of zoning is usually 10 years or more for a longer period. Therefore, referring to the research results of Xu et al. (2022) [58], based on the current risk results of coastal erosion and the potential disaster changes caused by future climate change impacts in this study area for coastal erosion, there were 12 coastal districts in 4 provinces and cities of the RRD.
3. Results
3.1. Hazard Assessment
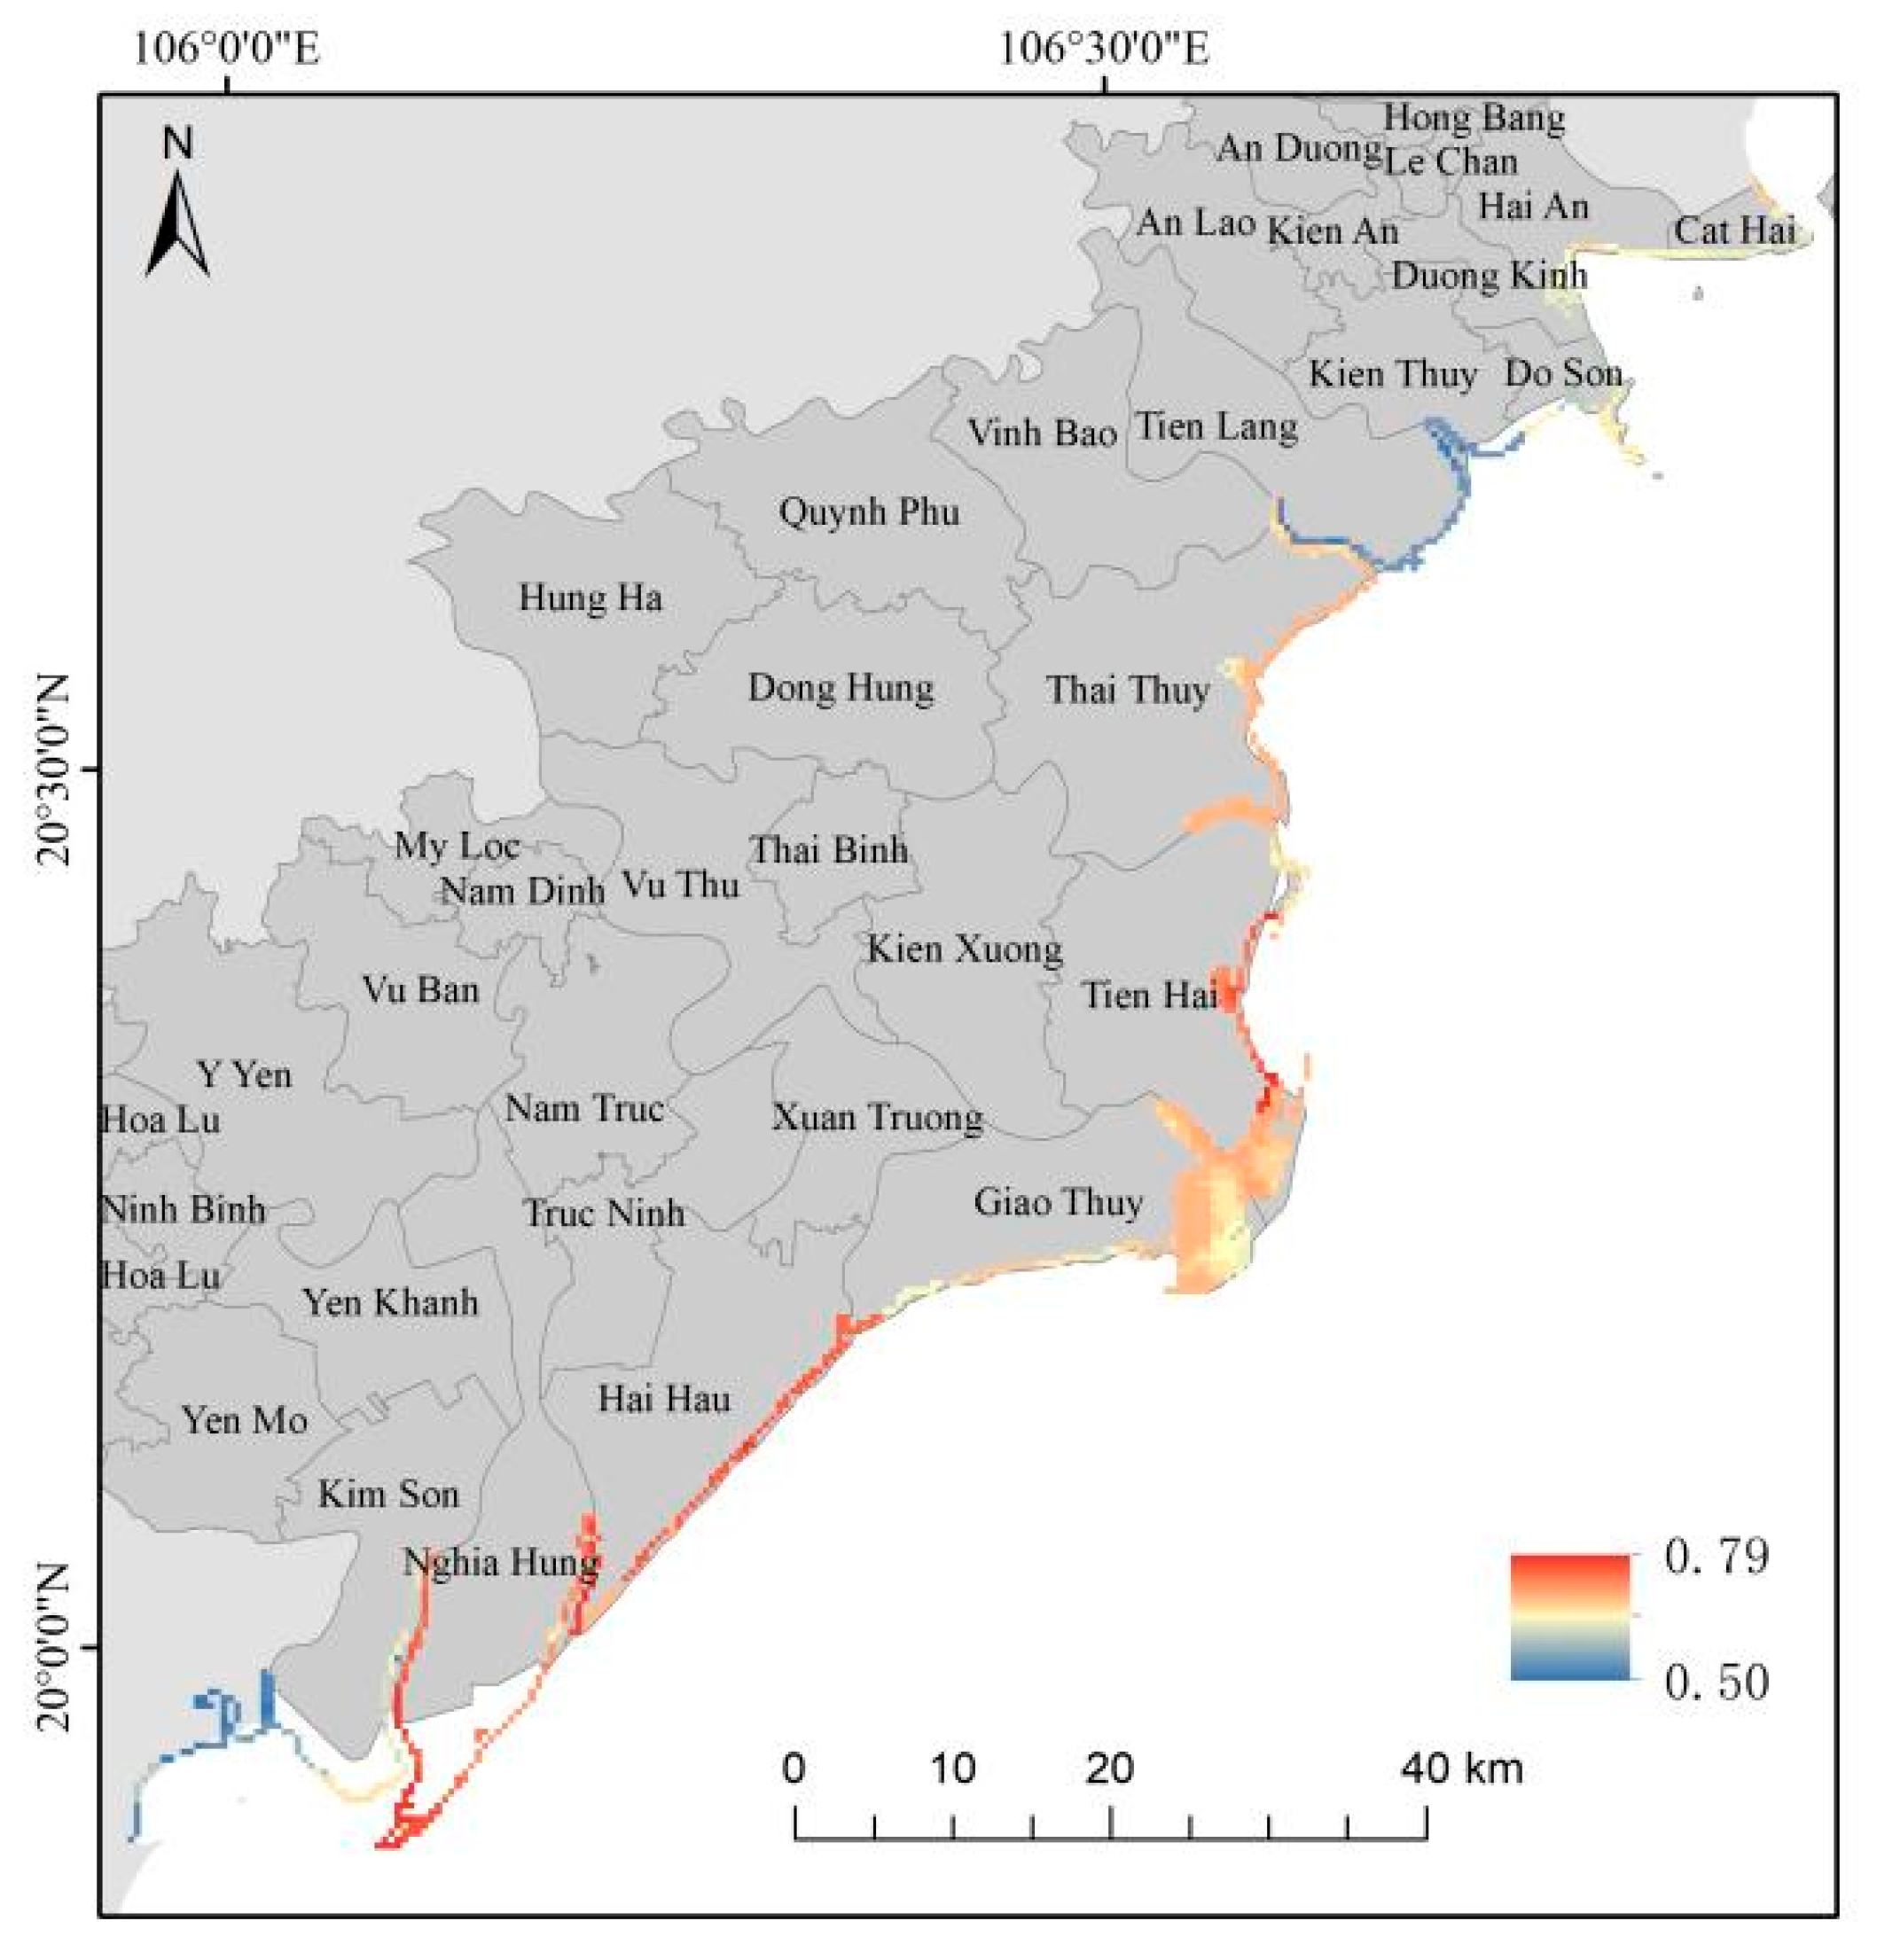
The coastal erosion hazard in the Red River Delta (RRD) ranges from 0.50 to 0.79, as shown in Figure 4. The northern coastline of Nam Dinh Province and Ninh Binh Province emerges as a high-risk area, ranging from 0.65 to 0.79. The coastal region along Thai Binh Province and the area north of Do Son District in Hai Phong City exhibit moderately high coastal erosion hazards, while the remaining regions show lower hazard levels. Among them, Hai Hau district and Nghia Hung district in Nam Dinh Province are at a high hazard level due to the shoreline type, erosion rate and rainfall in most areas, and their erosion degree and effective wave height are higher than other areas in the study area, and the water increase in the maximum once-in-a-century storm in Nghia Hung district is relatively high, resulting in relatively high hazard values in these two areas. Giao Thuy district in Nam Dinh Province and Thai Binh Province has the second highest hazard of coastal erosion (around 0.74).
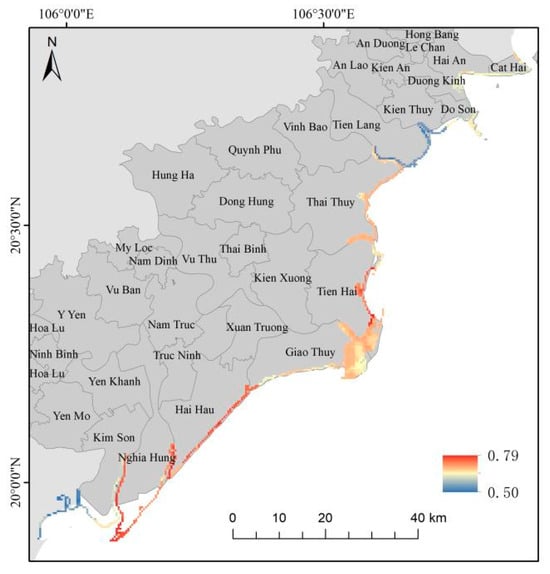
Figure 4.
Coastal erosion hazard assessment.
Despite high erosion rates and significant storm surge increases, their shoreline types—dominated by dikes, artificial shorelines, and mangroves—along with relatively low effective wave heights, mitigate the overall hazard level. The area north of Do Son district and its north and the area north of Ninh Binh Province are in the median risk zone, where the former is associated with low hazard levels of shoreline type, erosion degree and effective wave height, but relatively high risk of erosion rate, rainfall and storm water increase, and the latter is associated with higher erosion degree and rainfall but overall low risk of the remaining factors. Finally, the Tien Lang district, the Kien Thuy district and the southern part of the Ninh Binh Province have the relatively lowest coastal erosion hazard, mainly related to their shoreline accretion and favorable shoreline type, which mitigate the erosion risk, whose value is mostly less than 0.6.
3.2. Exposure Assessment
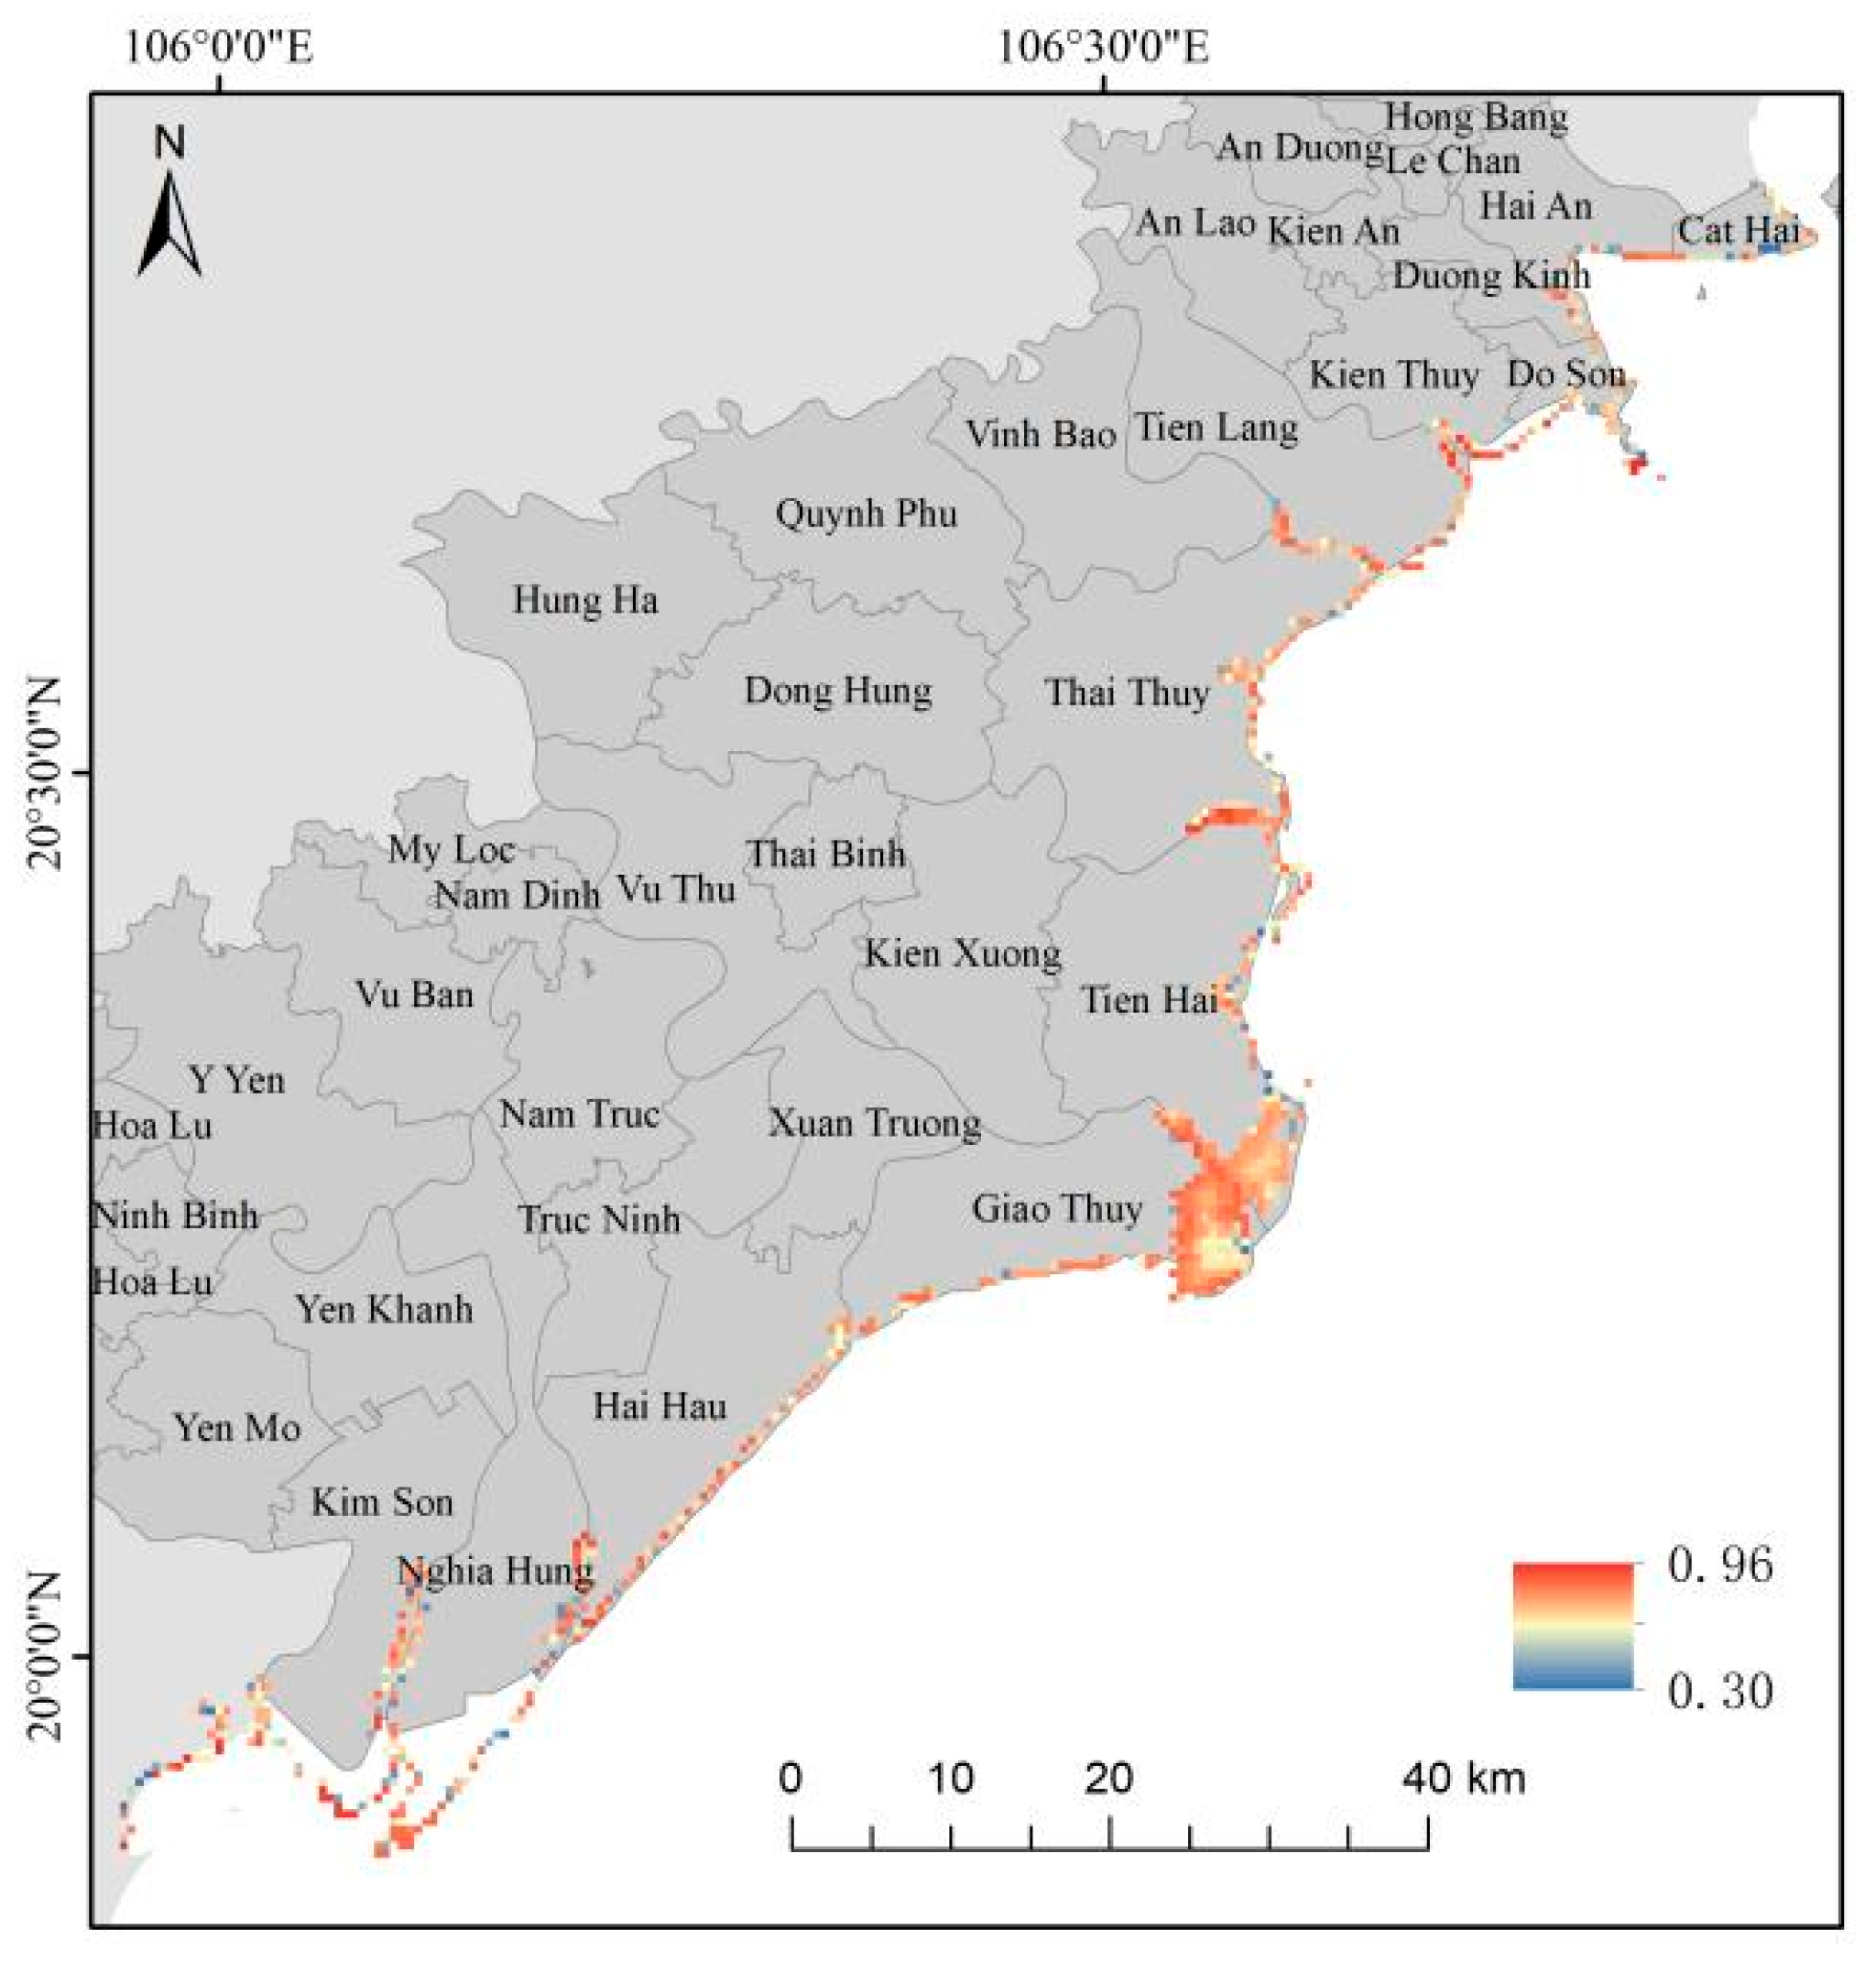
Figure 5 shows that the exposure values of coastal erosion in the study area range from 0.3 to 0.96, with overall exposure levels being notably high. This can be attributed to factors such as dense population distribution, extensive use of cultivated land and other vulnerable land types, low altitudes, and sparse vegetation cover throughout the region. Among them, the high exposure areas are located at the junction of Thai Thuy and Tien Hai District in Thai Binh Province, the southern coast of Kim Son District in Ninh Binh Province and the southeast of Do Son District in Hai Phong City (more than 0.6). It is due to a combination of factors: higher population densities, predominant land use for agriculture and other activities vulnerable to coastal erosion, proximity to the coastline, low altitudes, and limited vegetation cover. The Ba Lat estuary tidal flats show significantly lower exposure values, which are mostly lower than 0.5. This is primarily due to their greater distance from the shore and the extremely low population density in the area, which reduces the overall exposure risk.
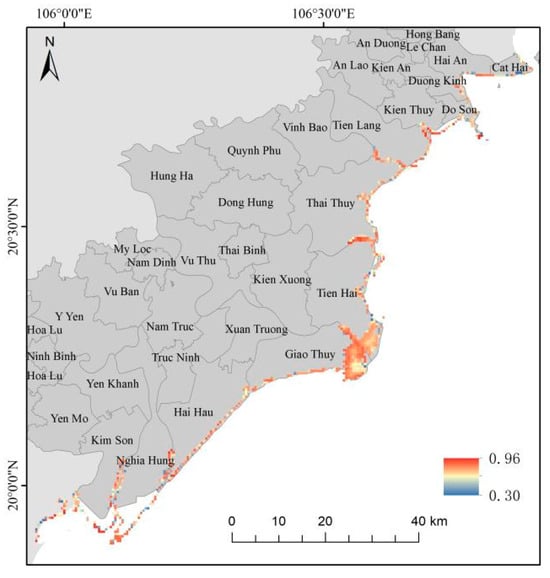
Figure 5.
Coastal erosion exposure assessment.
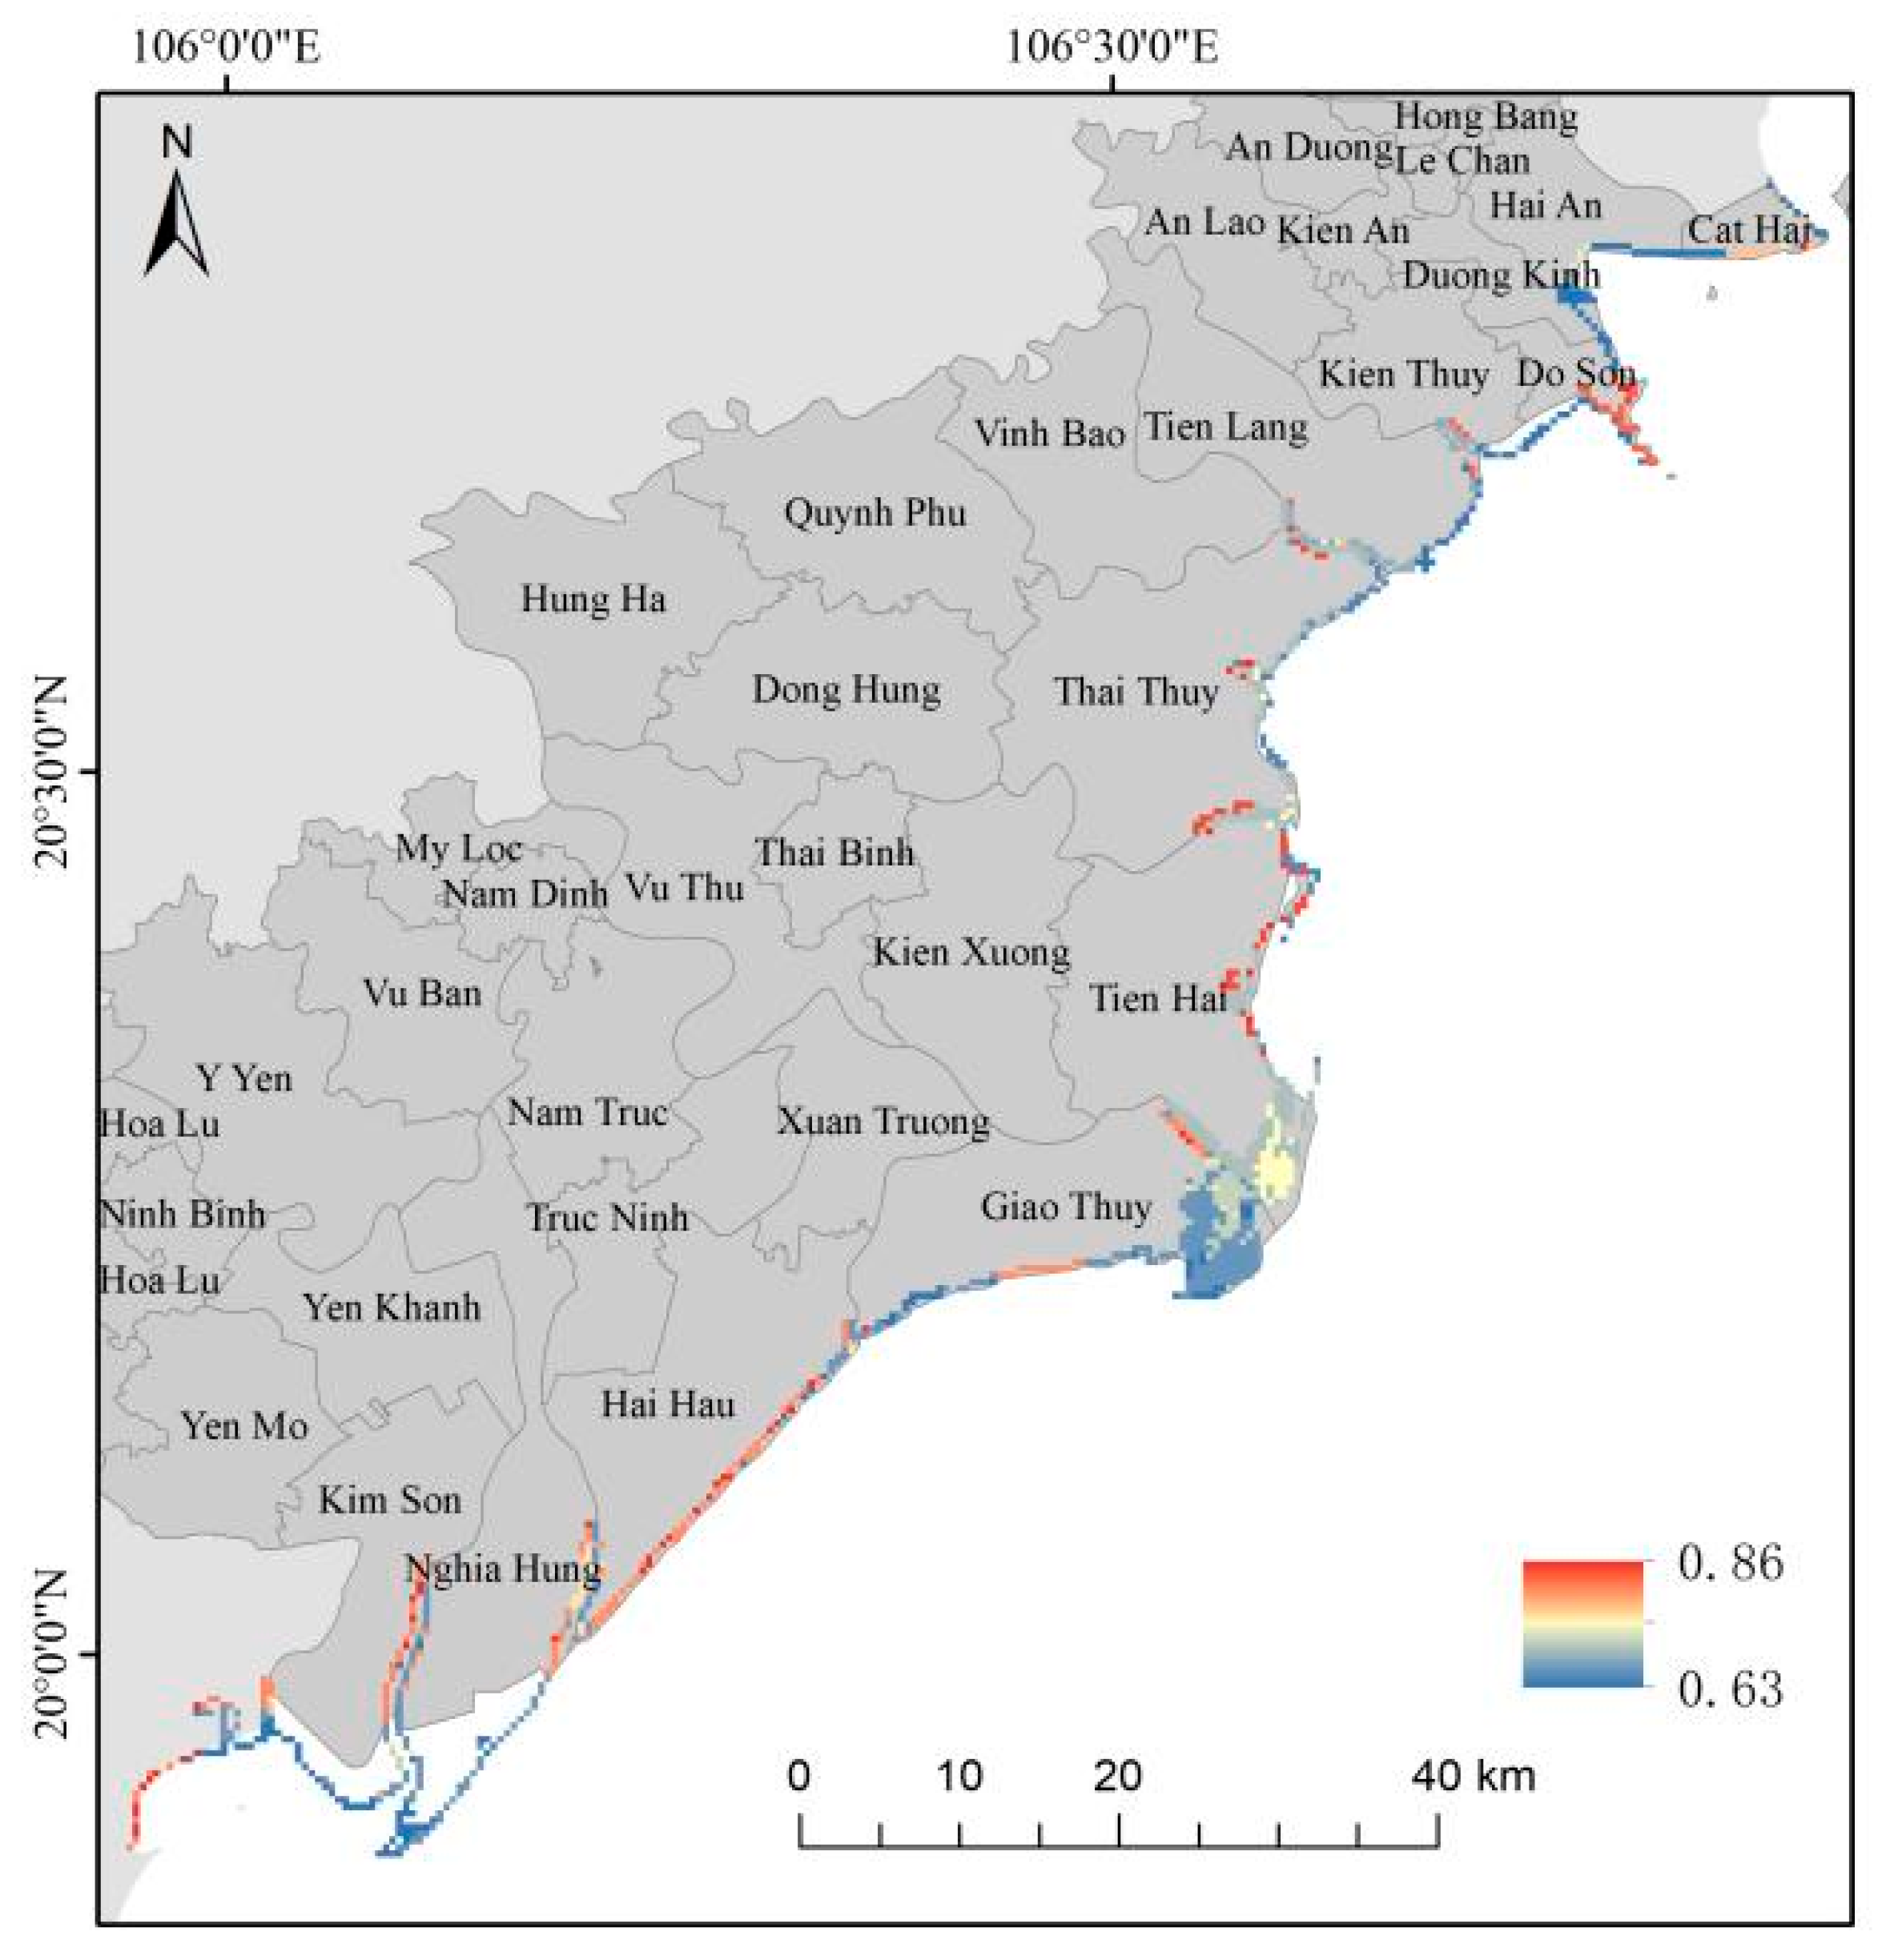
3.3. Vulnerability Assessment
As shown in Figure 6, the coastal erosion vulnerability values in the study area range from 0.63 to 0.86, indicating a generally high level of vulnerability. This high vulnerability is closely associated with the region’s low vegetation coverage and the substantial proportion of susceptible land, such as arable land, across the RRD. Among them, the high vulnerability area, which value is more than 0.8, is located on the northwest shoreline of Do Son district in Hai Phong City, the coast of Hai Hau district in Nam Dinh Province, and the border between Tien Hai County and Thai Thuy district in Thai Binh Province, whose is due to sparse vegetation cover and extensive agricultural land use, making them more prone to the impacts of coastal erosion. The values of Ba Lat estuary tidal flats are mostly lower than 0.5. This is primarily due to the area’s exceptionally low coastal elevation, which mitigates some of the contributing factors to vulnerability observed in this region.
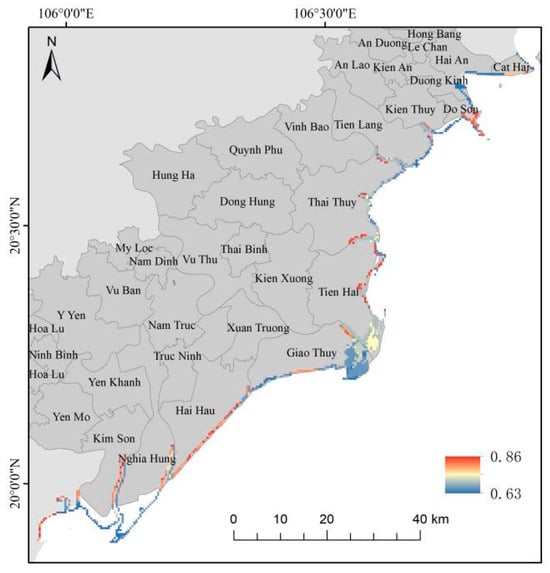
Figure 6.
Coastal erosion vulnerability assessment.
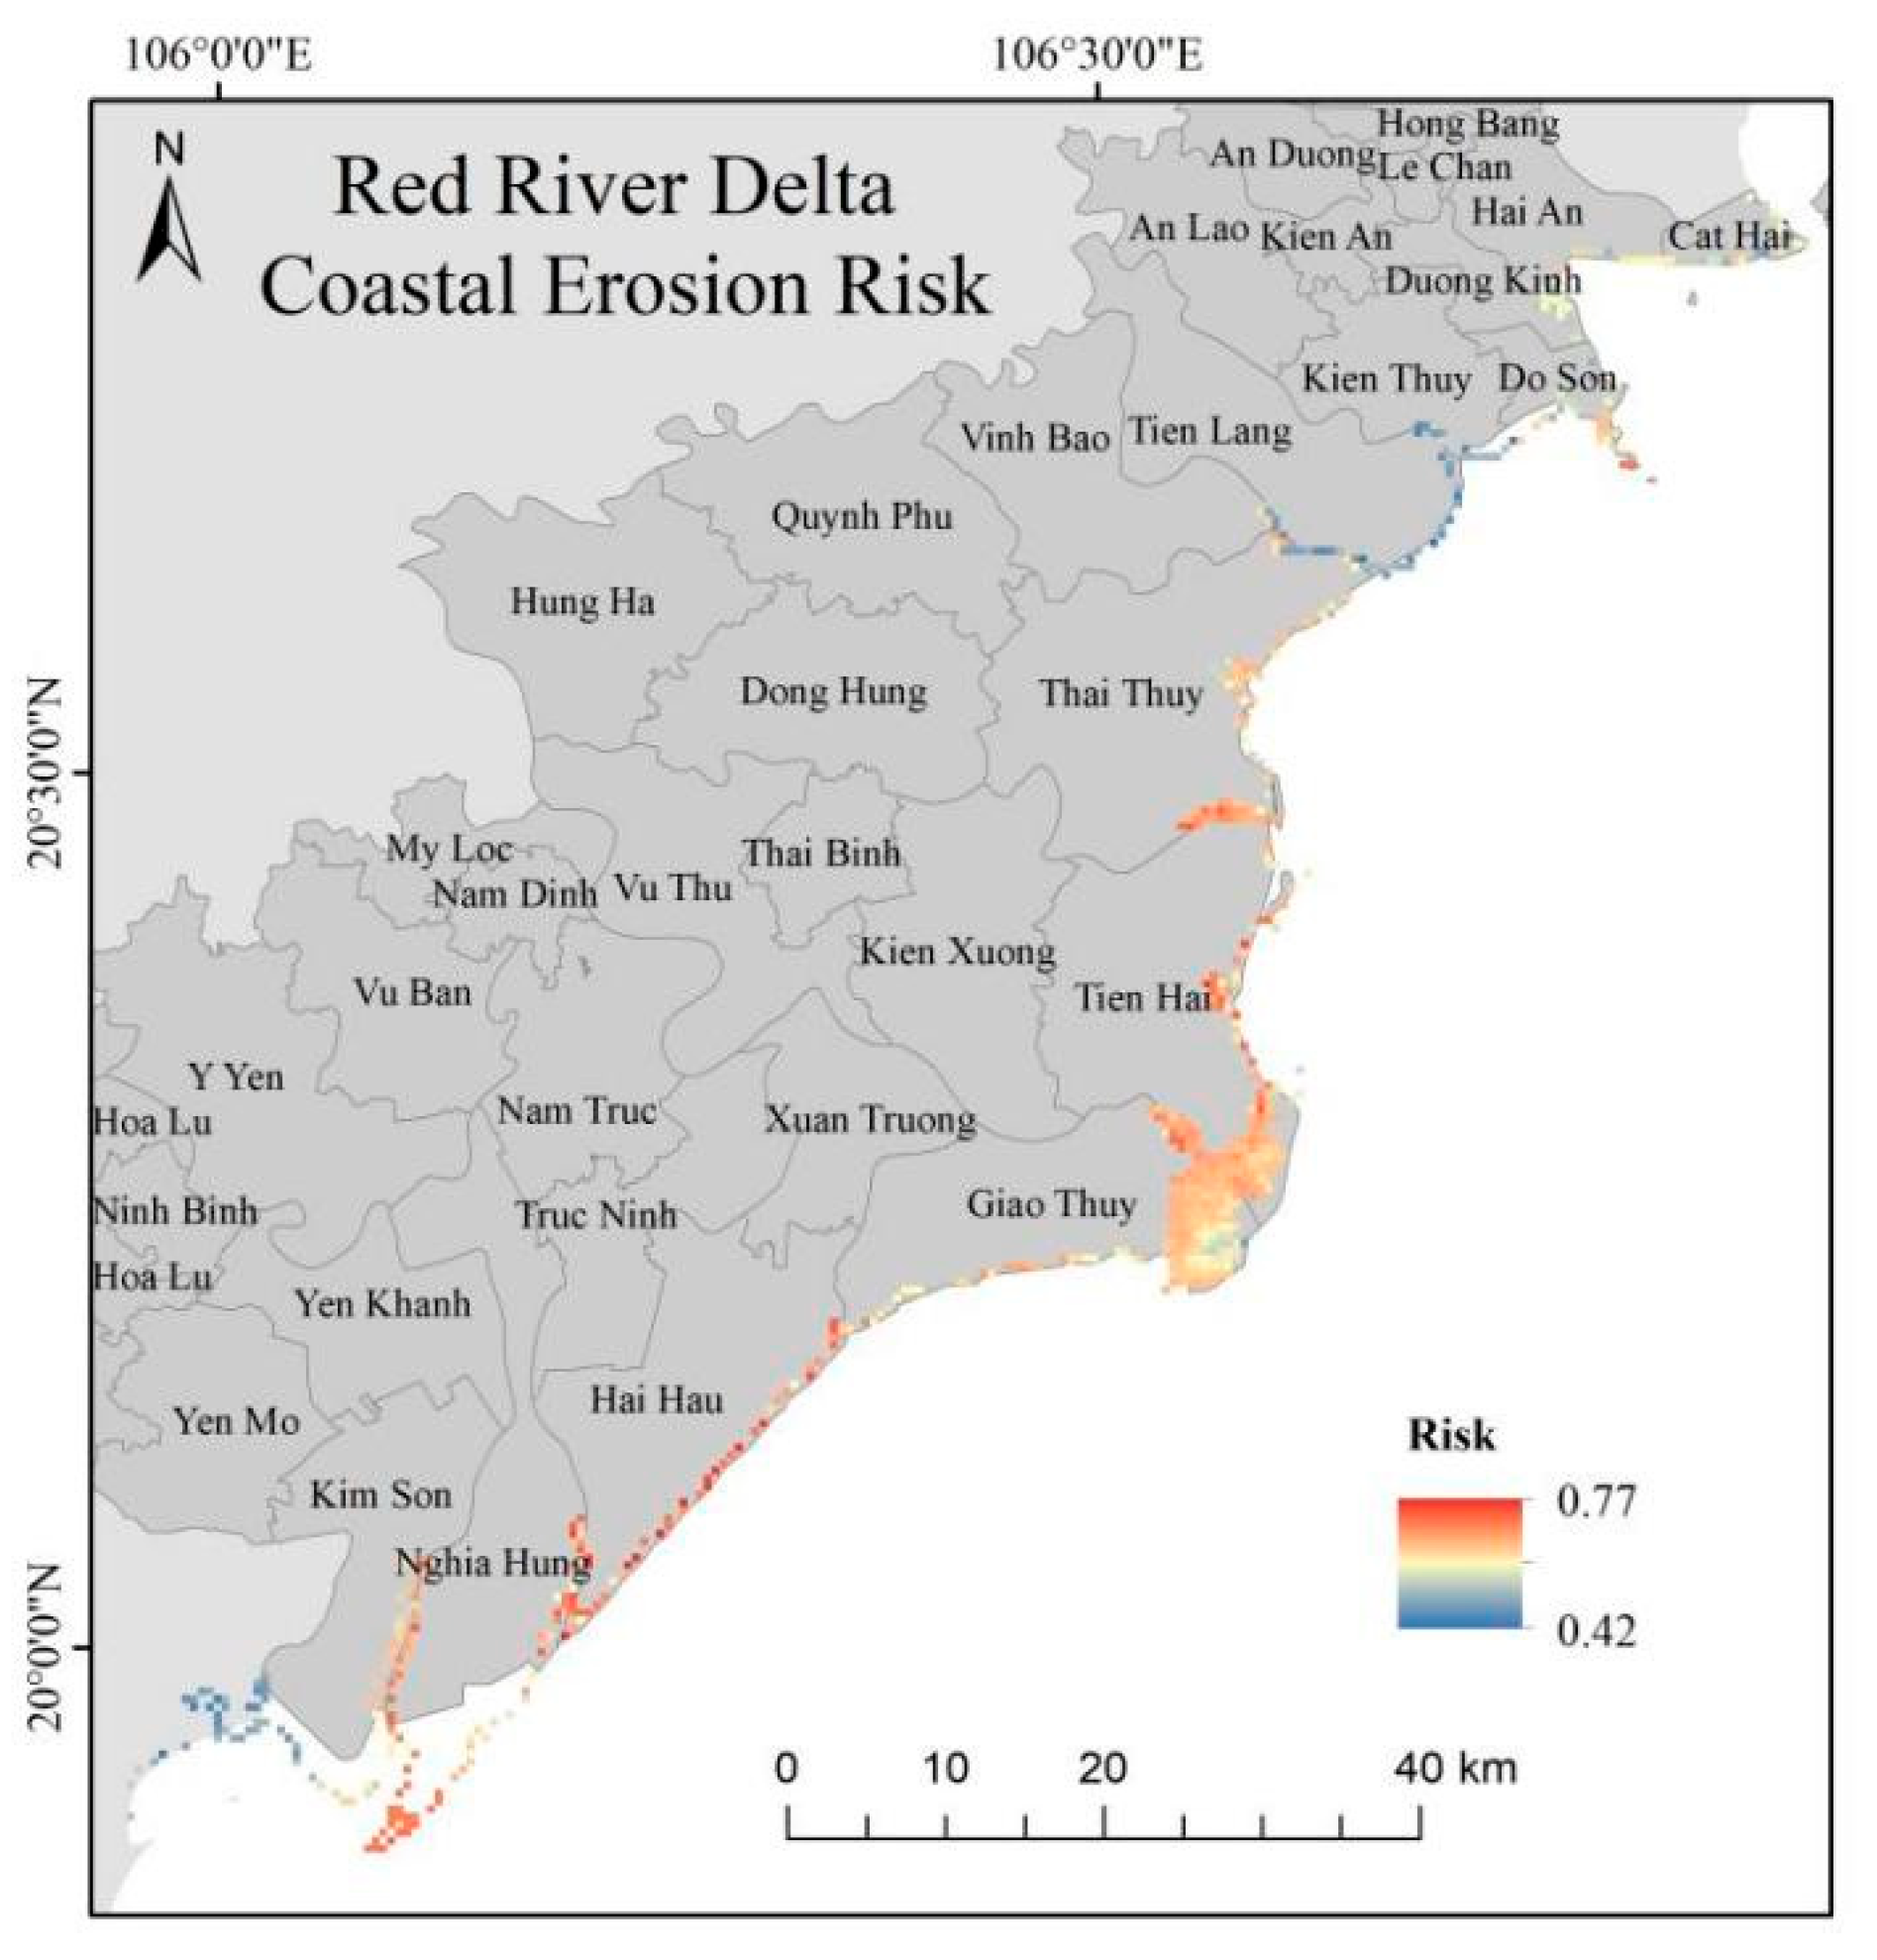
3.4. Risk Assessment Result
The risk values of coastal erosion in the RRD range between 0.42 and 0.77, indicating that the region overall faces moderate to high-risk levels of coastal erosion disasters. The spatial distribution of risk reveals a higher concentration of risk in the central and southern regions, with relatively lower risks on both sides (Figure 7).

Figure 7.
Risk results of coastal erosion disaster in the RRD.
Among them, the Do Son district in Haiphong City is at a high level of risk, exposure, and vulnerability to coastal erosion, resulting in a higher risk of coastal erosion. This is related to factors such as a high local erosion rate, high per capita GPD but low level of science, education, and environmental governance, high population density, and low vegetation coverage in the region. The high-risk coastal areas in Thai Binh Province are mainly affected by factors such as local shoreline types, erosion rates, storm surge, high effective wave height and rainfall, low altitude and vegetation coverage, and low investment in Thai Binh Province’s environment and related science and education. The risk and exposure of coastal erosion disasters in the region, as well as the vulnerability of cultivated land distribution areas, result in a higher overall disaster risk value. The high-risk areas in Nam Dinh Province are mainly affected by factors such as the distribution of vulnerable land types such as arable land, high-density population distribution, local silt and sandy shorelines, and weak disaster response capabilities of the provincial government with low financial income levels. Their risk, exposure, and vulnerability to vulnerable land types are relatively high, resulting in higher overall disaster risk.
3.5. Risk Zoning
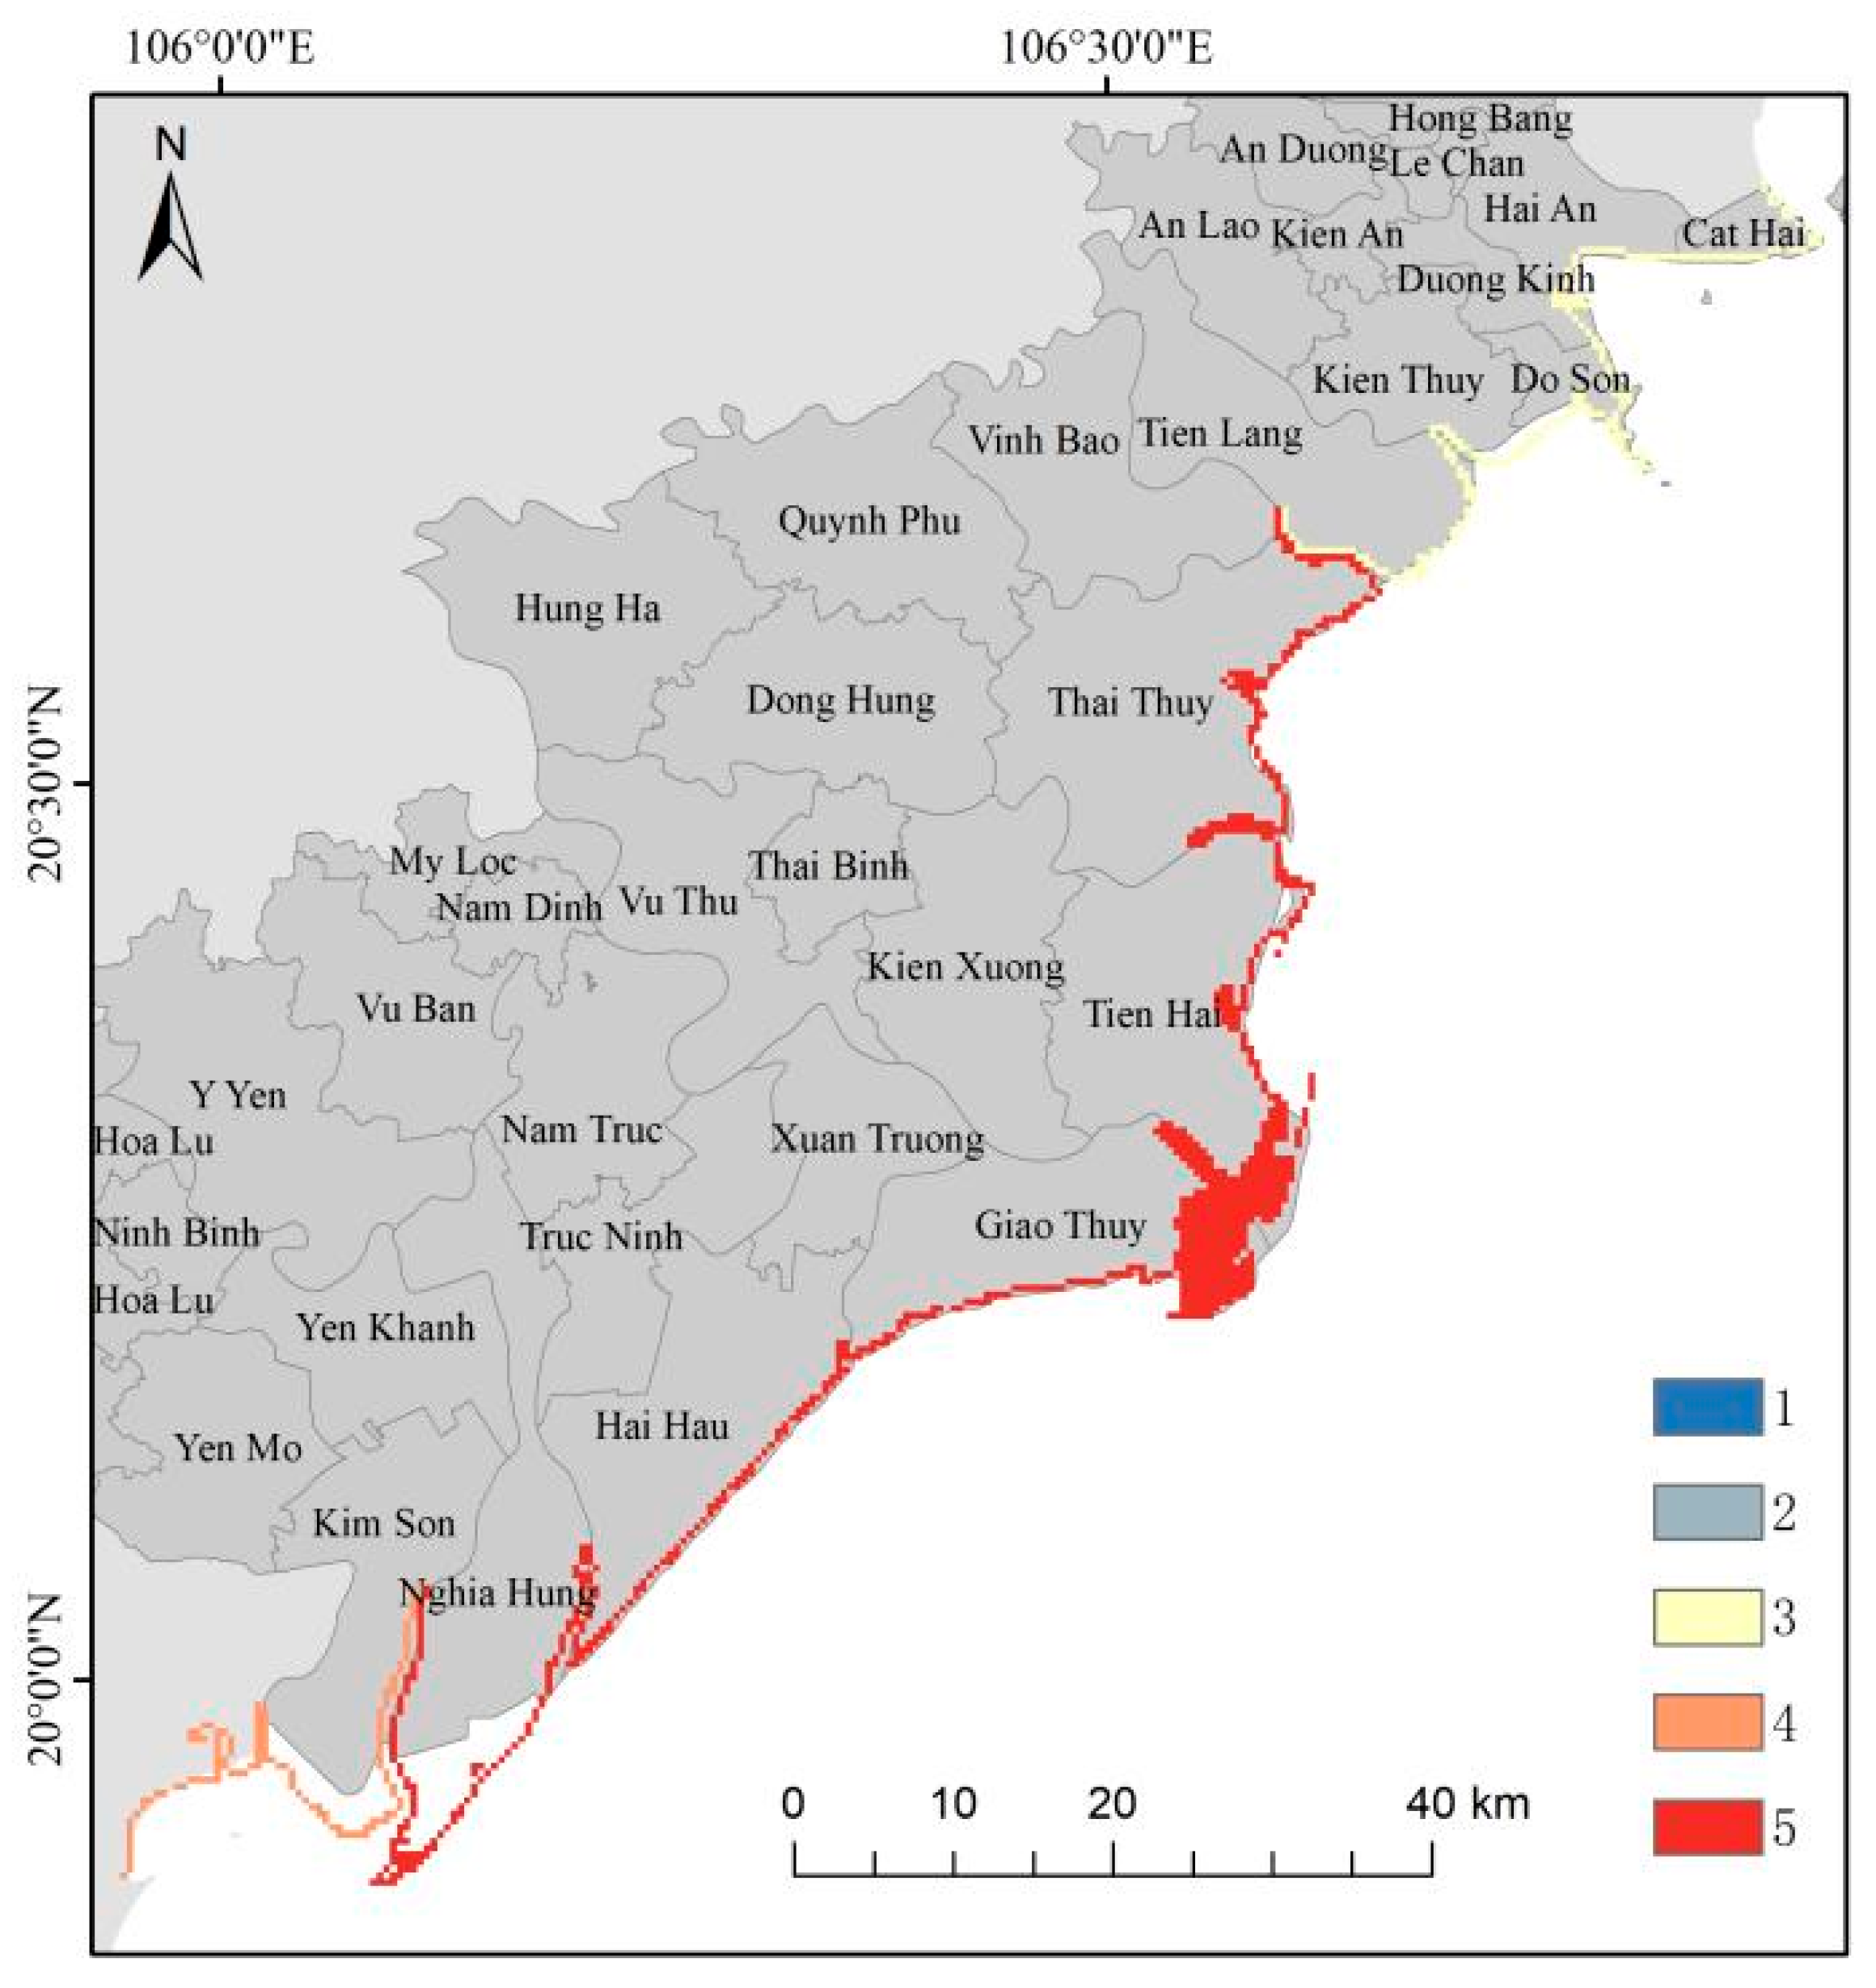
Risk zoning for the coastal erosion of RRD was conducted using the assessed risk results, as illustrated in Figure 8. With the exception of Kien Xuong District, which is classified as a medium-risk zone, all other districts and regions along the RRD coast fall into higher-risk categories. This distribution reflects the complex interplay of regional factors, including land use patterns, erosion dynamics, and socio-geographical conditions.
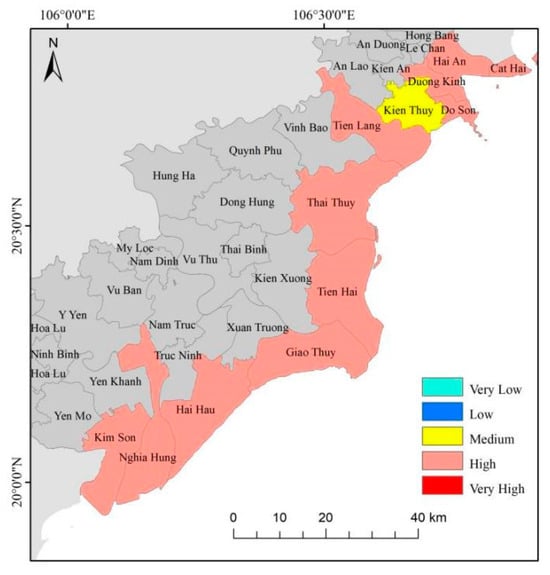
Figure 8.
Coastal erosion risk zoning results in the RRD.
4. Discussion
4.1. Accuracy of the Model and Results
This study established a risk assessment model for zoning coastal erosion risks in the Red River Delta. The results showed that most of the RRD was at high risk, which means that these areas have been greatly affected by erosion and will cause continuous and more serious losses in the future if not controlled. A remote sensing-based study also showed that coastal erosion in the region is very serious, especially in the Tien Hai area. This is consistent with the results of this study in the province [41].
As for the model, the selection of factors is based on principles and covers most of the factors that affect coastal erosion risk. The output of the model is very similar to the results of other studies, reports and field surveys. Therefore, we can consider the evaluation method to be reasonable and relatively accurate. We believe that this evaluation method has not only been successfully applied to RRD but can also be used in other coastal areas to identify and prevent coastal erosion risks. Similarly to most risk assessment models, the accuracy of the output results of this evaluation method depends on the accuracy of the data. It should be pointed out that due to the limitations of data availability, this study lacks resolution in some data sources, especially precipitation data. Adjustments are needed in the future to produce more detailed risk zoning maps.
4.2. Integrated Coastal Zone Management (ICZM) for Coastal Erosion
Coastal areas are geologically sensitive regions, highly vulnerable to both natural and human-induced impacts. Assessing the risk of geological hazards in these areas is crucial for developing effective solutions to prevent natural disasters and for implementing integrated coastal management strategies.
Zoning and risk assessment are the first steps toward effective coastal management. In Vietnam, however, the current policies and legal frameworks for natural resource and environmental protection are insufficient. There is a lack of clear guidelines for managing ocean and island resources and implementing integrated coastal management. The slow pace of national marine spatial planning and the sustainable use of coastal resources has created a legal gap, hindering the effective implementation of comprehensive coastal management and coastal zoning at the local level (Rentschler et al., 2020) [59].
Sustainable development, as defined by Clark [60], ensures the responsible use of resources and the preservation of environmental quality, balancing current needs without compromising those of future generations. Achieving sustainable development requires a stable, balanced approach across the economic, social, and environmental dimensions.
The initial implementation of integrated coastal zone management in Vietnam demonstrates the necessity to raise steps from the national to the regional level, underlining the importance of adopting a systematic approach in the Integrated Coastal Zone Management (ICZM) planning, implementation, and maintenance processes. In order to achieve sustainable development, the Red River Delta’s integrated coastal management must address socioeconomic development challenges as well as environmental preservation. Local needs should also be determined in conjunction with national policies to promote the establishment and implementation of ICZM. The results of the study on coastal erosion risk assessment in the RRD can be actively applied in the implementation of integrated coastal management based on disaster risk management. The assessment points for each impact can be used or used as a reference for developing a framework for action programs to respond to each specific impact.
The RRD coastal areas are rich in natural and cultural resources, supporting significant economic sectors, including tourism, aquaculture, and industry. However, these areas also face high population density and increased human activity, which have negatively impacted coastal resources and the environment. Climate change has further exacerbated natural disasters and environmental challenges. In this context, the demand for sustainable development and integrated coastal management has become more urgent (Rentschler et al., 2020) [59].
In this study, for the coastal erosion risk assessment of the Red River Delta, 17 secondary evaluation indicators were finally screened. Among them, shoreline type represents the sensitivity of different shorelines to coastal erosion. Coastal erosion rate and erosion rate mainly reflect the current disaster situation faced by the study area. The average significant wave height, maximum storm surge water increase and rainfall are all factors that increase coastal erosion due to the influence of climate, such as storm surges and heavy rains. Therefore, these six elements are classified into the risk assessment system. The exposure evaluation system mainly considers vegetation coverage. Coastal wetland vegetation can effectively cut waves and thereby reduce erosion. The farther away from the coast and the higher the coast elevation, the smaller the exposure. In addition, the more people and vulnerable land areas exposed to disaster threats, the higher the exposure. The vulnerability assessment system mainly considers the urban development level in disaster-risk areas and uses economic income as one of the quantitative indicators. The urbanization level and per capita income are negative indicators. The higher the value, the greater the possible economic losses after damage. The level of marine science education, regional environmental governance intensity and government disaster relief capabilities are positive indicators. The larger the value, the more complete the regional disaster prevention measures and capabilities, and the lower the vulnerability.
Assessing the erosion risk of the area for each specific impact through the system of parameters and corresponding weights provides an overview of the potential responses of future impacts while identifying them specifically and accurately, thereby assessing the importance of each parameter on that impact. The research results show that in addition to natural factors, human factors have a very important influence on the stability and sensitivity, as well as on determining the adaptive capacity of the area to the impacts of sea level rise; exploitation of coastal resources is identified as the core factor affecting the stability and vulnerability of the entire area.
4.3. Countermeasures for Coastal Erosion
It can be clearly seen that the application of the coastal erosion risk assessment method has provided a relatively complete foundation for the development of comprehensive prevention and adaptation solutions in the future. Through the system of parameters and corresponding weights, it provides an overview of the potential responses of future impacts while identifying them specifically and accurately, thereby assessing the importance of each parameter on that impact. Based on specific analysis of the assessment results, a policy for the use and management of water resources can be developed in a reasonable manner to minimize related natural disasters. Therefore, the two main groups of solutions proposed according to the “Protection—Adaptation” strategy are proposed as follows: 1—The group of solutions for stabilizing and enhancing the stability of riverbanks and coasts includes river regulation measures, building dikes, riverbank and coast embankments, bank nourishment solutions and conservation plans for coastal sand dunes and coastal protection casuarina forests. These solutions should be deployed along the entire coastline of the study area, focusing on the coastal area between river mouths. 2—The group of solutions for rational use of water resources includes re-planning and rearranging the system of reservoirs and hydroelectric dams to partially or completely restore the natural flow and sediment regime, along with measures to preserve natural forest cover to ensure the ability to retain water and retain soil against erosion. In addition, with the orientation of managing and rationally using coastal resources, education and awareness raising for the community need to be enhanced, focusing on education from schools at all levels. Strengthening the functions of coastal protection systems needs to be implemented with the active participation of local communities to achieve maximum effectiveness. Proposing the establishment of a Special Integrated Coastal Zone Management Department to coordinate efforts, enhance monitoring of estuaries and key areas, and increase investment in scientific research to strengthen the region’s capacity for geological disaster protection.
5. Conclusions
This study aimed to assess the characteristics and risks of coastal geological disasters in the Red River Delta (RRD) in response to climate change. The main findings are as follows:
A comprehensive risk assessment system for coastal erosion hazards was developed. The system utilized seventeen indicators, including shoreline type, erosion rate, storm surge, wave height, rainfall, population density, land vulnerability, and vegetation coverage. Hazard, exposure, and vulnerability were calculated using weighted coefficients, and the final risk value was determined by taking the cubic root of the product of these components.
Currently, the coastal erosion risk in the RRD coastal areas ranges from 0.42 to 0.78, indicating a high overall risk level for coastal erosion disasters. The central and southern coastal areas face higher risks, while the risk is lower in the northern and southern peripheries. In Do Son District, a major coastal defense city, the high coastal erosion risk is attributed to factors such as a significant local erosion rate, high GDP per capita but low levels of scientific, educational, and environmental management capacity, coupled with high population density and limited vegetation coverage. In Thai Binh, high-risk coastal areas are primarily influenced by factors like shoreline types, erosion rates, storm surges, wave height, rainfall, low elevation, poor vegetation cover, and insufficient investment in environmental and scientific sectors. These factors combine to increase both the exposure to coastal erosion and the vulnerability of cultivated land, resulting in an overall higher disaster risk. Similarly, in Nam Dinh, high-risk areas are largely shaped by the regional distribution of arable and vulnerable lands, high population density, silt- and sandy-based shorelines, and low fiscal revenue at the provincial level. These factors contribute to heightened risk, exposure, and vulnerability of land resources, leading to a generally higher disaster risk.
The coastal erosion risk zonation results indicate that except for Kien Xuong District, which falls within a middle-risk zone, the rest of the districts along the RRD coast are classified in higher risk zones. These variations are mainly influenced by regional land use, coastal erosion patterns, and the socio-geographical environment.
Author Contributions
T.H.H.N. and G.W. are the main authors of this study, responsible for the laboratory analysis, data processing, paper writing, and drawing. J.Y. is the main instructor of this study. X.J. assisted with making figures. R.L., W.C., X.H., X.H., V.V.B., D.N.L. and V.P.P. assisted with the data processing methods and paper writing. All authors have read and agreed to the published version of the manuscript.
Funding
Marine geological environment and geological hazard risk assessment in the Yangtze River Delta and the Red River Delta Qingdao Natural Science Foundation ”the impact of land use change in Jiaozhou Bay wetlands on the spatiotemporal pattern of carbon emissions in Qingdao and path optimization.” Asian Cooperation Fund “Cooperative Research on Marine Geological Environment and Disasters in the Yangtze River Delta and Red River Delta” China Land Surveying and Planning Institute Outsourcing Project: “Research on supporting policy mechanisms for marine space management” support this research.
Data Availability Statement
The original contributions presented in the study are included in the article. Further inquiries can be directed to the corresponding author.
Acknowledgments
This work has been carried out in the framework of the Vietnam-China collaboration project Marine geological environment and geological hazard risk assessment in the Yangtze River Delta and the Red River Delta and the Vietnam Academy of Science and Technology project (VAST05.06/23-24). The authors would like to thank both projects.
Conflicts of Interest
The authors declare no conflicts of interest.
Appendix A
Table A1.
Classification criteria for coastal erosion risk assessment indicators section.
Table A1.
Classification criteria for coastal erosion risk assessment indicators section.
| Data Type | Description | Resolution | Data Sources |
|---|---|---|---|
| Shoreline type | Characterize the sensitivity of regional coastal erosion hazards. | - | Based on visual interpretation of Google Satellite Images |
| The degree of coastal erosion | Characterize the extent of regional coastal erosion hazards. | - | Van Phach et al., 2018, Lan et al., 2018 [10,11] |
| Rate of coastal erosion | One of the indicators of strength that characterizes coastal erosion. | - | Van Phach et al., 2018, Lan et al., 2018 [10,11] |
| Storm surge adds maximum water | Hydrodynamic phenomena that can lead to the occurrence or exacerbation of coastal erosion. This study used the results of global extreme storm water enhancement published by Muis et al. (2016) [61] in Nature Communications. | - | Muis et al., 2016 [61] |
| Effective wave height | Hydrodynamic phenomena that can lead to the occurrence or exacerbation of coastal erosion. This study mainly uses annual average data over the four years from 2018 to 2021. | Time resolution: Months Spatial resolution: 0.5° × 0.5° | ERA5 global portfolio wind wave and surge effective wave height and rainfall reanalysis data on the European Centre for Medium-Range Weather Forecasting website. (https://cds.climate.copernicus.eu/cdsapp#!/dataset/reanalysis-era5-single-levels-monthly-means?tab=form, accessed on 10 March 2025) |
| Rainfall | Hydrodynamic phenomena that can lead to the occurrence or exacerbation of coastal erosion. In this study, the monthly average data of daily rainfall over the four years from 2018 to 2021 were averaged annually. | Time resolution: Months Spatial resolution: 0.25° × 0.25° | ERA5 global portfolio wind wave and surge effective wave height and rainfall reanalysis data on the European Centre for Medium-Range Weather Forecasting website. (https://cds.climate.copernicus.eu/cdsapp#!/dataset/reanalysis-era5-single-levels-monthly-means?tab=form, accessed on 10 March 2025) |
| Vegetation cover | The higher the vegetation cover of coastal wetlands, the more effective it is at reducing waves and thus erosion. Based on data availability, vegetation cover data from 2018 were used in this study. | Spatial resolution: 500 m | The University of Maryland website makes data publicly available (http://www.glass.umd.edu/Download.html, accessed on 10 March 2025). |
| Population density | The number of people carrying the disaster risks who would be exposed to the impact of the disaster. In this study, the population density data of the study area in 2020 was selected for analysis. | Spatial resolution: 30 arcseconds (about 1 km at the equator) | The World Pop website makes data publicly available. (https://hub.worldpop.org/geodata/summary?id=49701, accessed on 10 March 2025) |
| Offshore distance | Characterize the distance of the cell from the disaster causing the area. | - | Based on the shoreline data of the 2017 study area, calculated by ArcGIS software 10.8 |
| Coastal elevation | Characterize the distance of the cell from the disaster causing the area. | 15 arc-second | Data source: GEBCO_2022 dataset, unit m |
| Vulnerable land area and land use type | The size of the carrier exposed to the scope of the disaster. It is mainly based on land use type data, obtained through analysis and processing (cultivated land, grassland, artificial land). | Spatial resolution: 30 m | Source: National Basic Geographic Information Center Global Ground Coverage Data Product Website (https://www.ngcc.cn/dlxxzy/gjjcdlxxsjk/, accessed on 10 March 2025) |
| Level of urbanization | Indicates the possible economic loss of the exposed area, characterized by the proportion of urban population to the total population. | Point data | Statistical Yearbook of Hai Phong City, Thai Binh Province, Nam Dinh Province and Ninh Binh Province [45] |
| Per capita income | Indicates the possible economic loss of the exposed area. | Point data | 2020 Statistical Yearbook of Hai Phong City, Thai Binh Province, Nam Dinh Province and Ninh Binh Province [45] |
| Level of marine science education | It shows that the disaster prevention technology capability of the exposed area is characterized by the proportion of marine science and technology investment to GDP. | Point data | 2020 Statistical Yearbook of Hai Phong City, Thai Binh Province, Nam Dinh Province and Ninh Binh Province [45] |
| Regional environmental governance level | Coastal restoration project is one of the environmental governance projects, and the level of regional environmental governance can indicate the disaster restoration situation built or to be built in the exposed area, and the proportion of government environmental protection expenditure to GDP is characterized. | Point data | 2020 Statistical Yearbook of Hai Phong City, Thai Binh Province, Nam Dinh Province and Ninh Binh Province [45] |
| Government capacity to respond to disasters | Indicate the disaster response capacity of the exposed area, characterized by government revenue. | Point data | 2020 Statistical Yearbook of Hai Phong City, Thai Binh Province, Nam Dinh Province and Ninh Binh Province [45] |
Table A2.
Classification criteria for coastal erosion risk assessment indicators section.
Table A2.
Classification criteria for coastal erosion risk assessment indicators section.
| Metric Name | Risk Level | Unit | ||||||
|---|---|---|---|---|---|---|---|---|
| The degree of coastal erosion | 1 | 2 | 3 | - | ||||
| <30% | 30%–70% | >70% | ||||||
| Rate of coastal erosion | Micro degree | Mild | Moderate | Height | Severe | m/a | ||
| r > 0.5 | −0.5 < r ≤ 0.5 | −1 < r ≤ −0.5 | −2 < r ≤ −1 | r ≤ −3 | ||||
| Micro erosion | Erosion | Strong erosion | Severe erosion | |||||
| Sandy coast The backoff rate is S/m·a-1 | S < 1 | 1 ≤ S < 2 | 2 ≤ S < 3 | S ≥ 3 | ||||
| Silty coast The backoff rate is S/m·a-1 | S < 5 | 5 ≤ S < 10 | 10 ≤ S < 15 | S ≥ 15 | ||||
| 1 | 2 | 3 | ||||||
| Silty shoreline | <l | l~10 | ≥10 | |||||
| Sandy shoreline | <0.5 | 0.5~2 | >2 | |||||
| Siltation | Stable | Micro erosion | Erosion | Strong erosion | Severe erosion | |||
| Sandy coast/(m·a-1) | r ≥ +0.5 | −0.5 ≤ r < +0.5 | −0.5 ≥ r > −1 | −1 ≥ r > −2 | −2 ≥ r > −3 | r ≤ −3 | ||
| Silty coast/(m·a-1) | r ≥ +1 | −1 ≤ r < +1 | −1 ≥ r > −5 | −5 ≥ r > −10 | −10 ≥ r > −15 | r ≤ −15 | ||
| 7 | 5 | 3 | 1 | |||||
| >−3.0 | −2.0~−3.0 | −0.5~−2.0 | <−0.5 | |||||
| Low | Lower | Moderate | Higher | High | ||||
| >4 | (−4, 4] | (−10, −4] | (−20, −10] | <−20 | ||||
| 1 | 2 | 3 | ||||||
| >−0.5 | [−2, −0.5] | <−2 | ||||||
| Storm surge adds maximum water | Very low (cm) | Lower | Moderate | High | cm | |||
| [137, 140) | [140, 180) | [180, 220) | [220, 252] | |||||
| 1 | 2 | 3 | 4 | 5 | ||||
| [30 + Ss, + ∞) | [20 + Ss, 30 + Ss) | [10 + Ss, 20 + Ss) | [5 + Ss, 10 + Ss) | [−0, 5 + Ss) | ||||
| Lower | Moderate | High | ||||||
| Less than 3 times | 3–10 times | More than 10 times | ||||||
| 1 | 2 | 3 | ||||||
| <1.5 | [1.5,3] | >3 | ||||||
| Average effective wave height | Very low | Lower | Moderate | High | m | |||
| [0.70, 0.93) | [0.93, 1.20) | [1.20, 1.47) | [1.47, 1.54] | |||||
| 1 | 2 | 3 | 4 | 5 | ||||
| [0, 0.4] | (0.4, 0.8] | (0.8, 1.6] | (1.6, 2.0] | (2, +∞) | ||||
| 1 | 2 | 3 | ||||||
| <1.5 | [1.5, 3] | >3 | ||||||
| Rainfall | High | Moderate | Lower | mm | ||||
| Greater than 2000 | 1000–2000 | Less than 1000 | ||||||
| Shoreline type | 5 | 3 | 1 | - | ||||
| Sandy coast | Bedrock coast | Artificial shoreline | ||||||
| High | Moderate | Lower | ||||||
| Biotic | Sand mud | Bedrock/artificial | ||||||
| Vegetation cover | 1 | 2 | 3 | |||||
| Dense woods | More bushes or grasses | Few or absent | ||||||
| Offshore distance | 1 | 2 | 3 | 4 | 5 | m | ||
| [350, +∞) | [225, 350] | [125, 225] | [50, 125] | [0, 50] | ||||
| Coastal elevation | Very high | High | Moderate | Lower | Very low | m | ||
| <1 | [1, 2] | [2, 4] | [4, 6] | >6 m | ||||
| Number of coastal restorations work | Very high | High | Moderate | Lower | Very low | piece | ||
| <10 | [11, 15] | [16–20] | [21–25] | >25 | ||||
| Type of land use | Micro degree | Minor | Moderate | High | Severe | - | ||
| Fishery | Industry | Port | ||||||
| 1 | 2 | 3 | ||||||
| Natural shoreline | Farmland, salt pans | Marine Engineering | ||||||
| Stable | Average | Severe | ||||||
| Other land uses | Industrial and mining land, forest land, paddy fields, dry land, breeding ponds, etc. | Industrial and mining land, forest land, paddy fields, dry land, breeding ponds, etc. | ||||||
| Lower | Moderate | Higher | ||||||
| Fishery | Industry | Port | ||||||
| population density | 1 | 2 | 3 | person/km2 | ||||
| <200 | [200, 500) | ≥500 | ||||||
| Very low | Low | Moderate | High | Very high | ||||
| [0.17, 0.88) | [0.88, 1.55) | [1.55, 2.22) | [2.22, 2.89) | [2.89, 2.93] | ||||
| 1 | 2 | 3 | 4 | 5 | ||||
| [0; 500) | [500; 1000) | [1000; 2000) | [2000, 4000) | [4000; +∞) | ||||
| 1 | 2 | 3 | ||||||
| <100 | [100~1, 000) | ≥1000 | ||||||
| Level of urbanization | Speed of urbanization | - | ||||||
| Very low | Low | Moderate | High | Very high | ||||
| [0, 1.26) | [1.26, 1.90) | [1.90, 2.54) | [2.54, 3.18) | [3.18, 3.28] | ||||
| 1 | 2 | 3 | ||||||
| <35% | [35%–70%) | ≥70% | ||||||
| Per capita income | GDP per capita ranking | - | ||||||
| 1 | 2 | 3 | ||||||
| 1–27 | 28–54 | 55–81 | ||||||

Figure A1.
Evaluation map of shoreline type.
Figure A1.
Evaluation map of shoreline type.
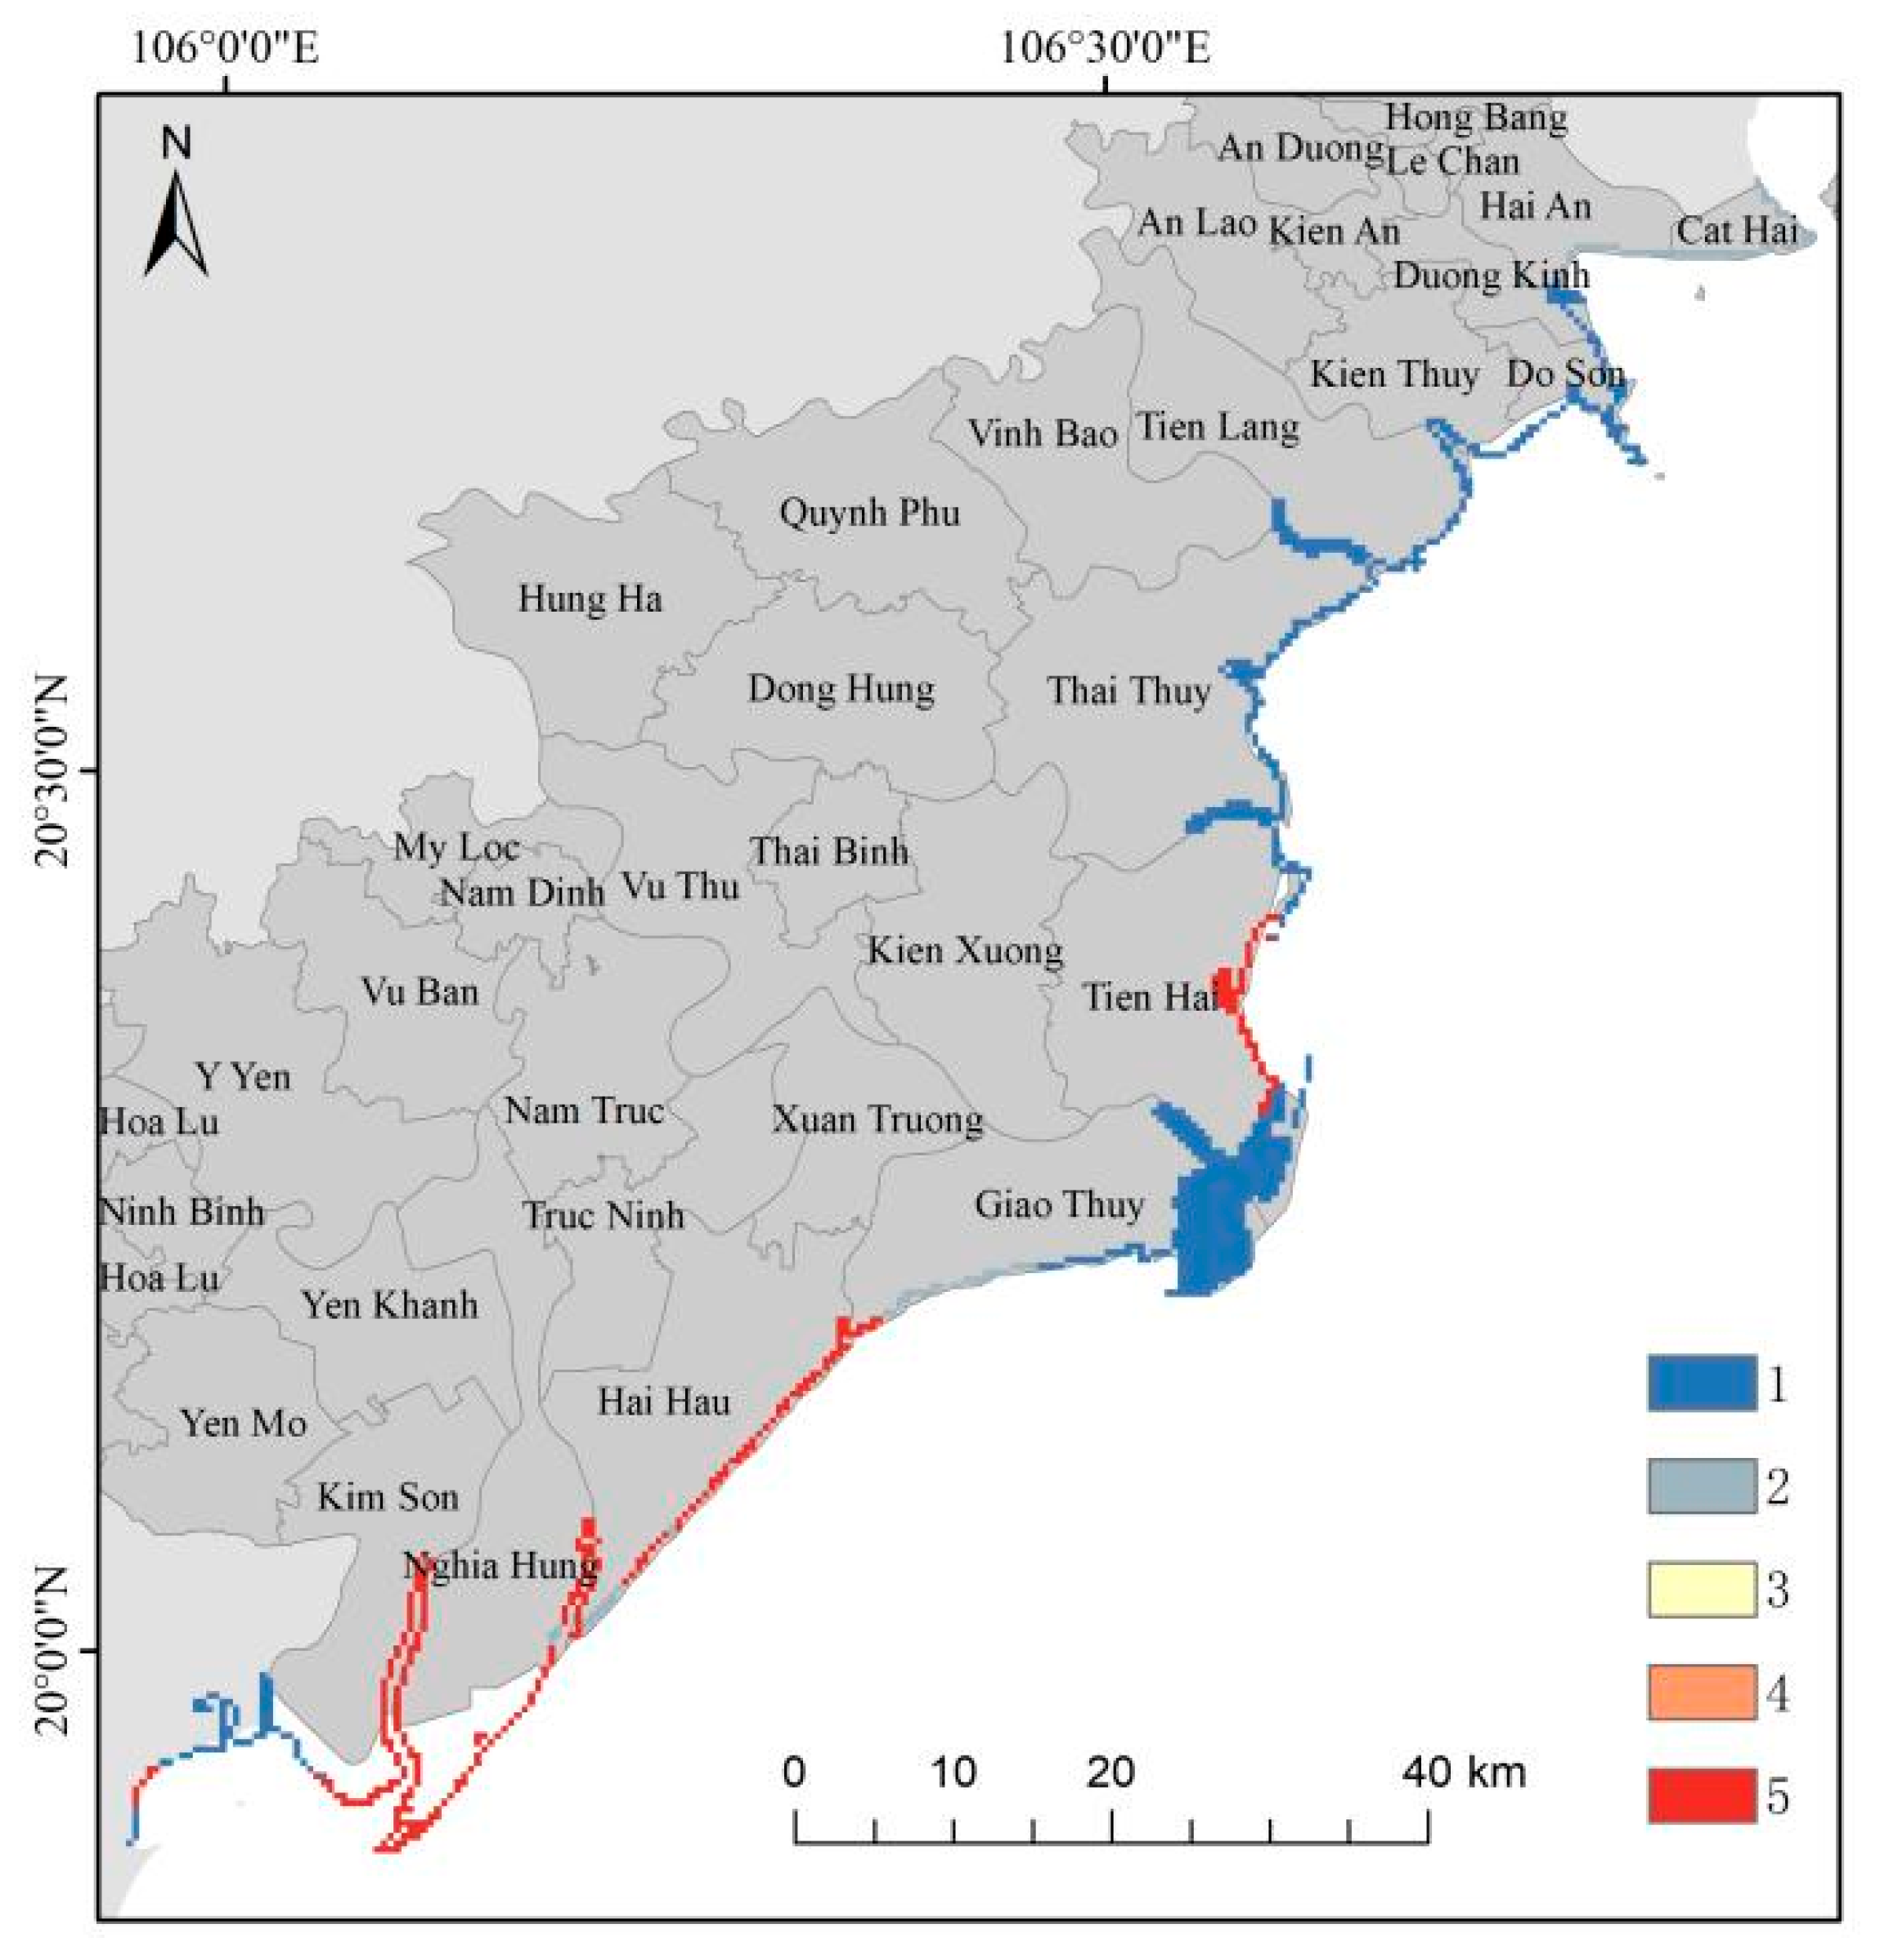
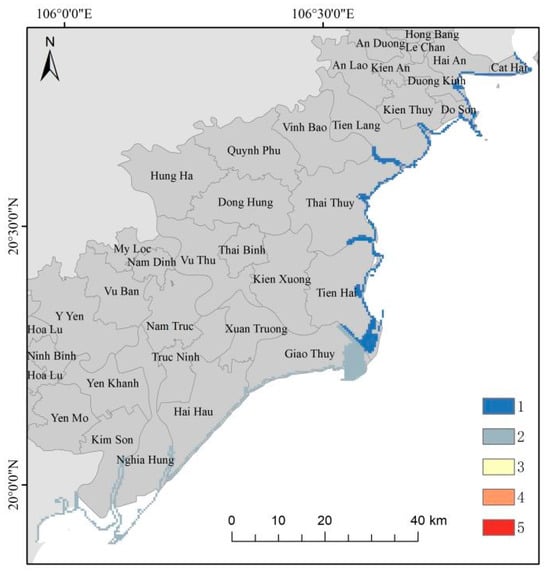
Figure A2.
Evaluation map of coastal erosion degree.
Figure A2.
Evaluation map of coastal erosion degree.
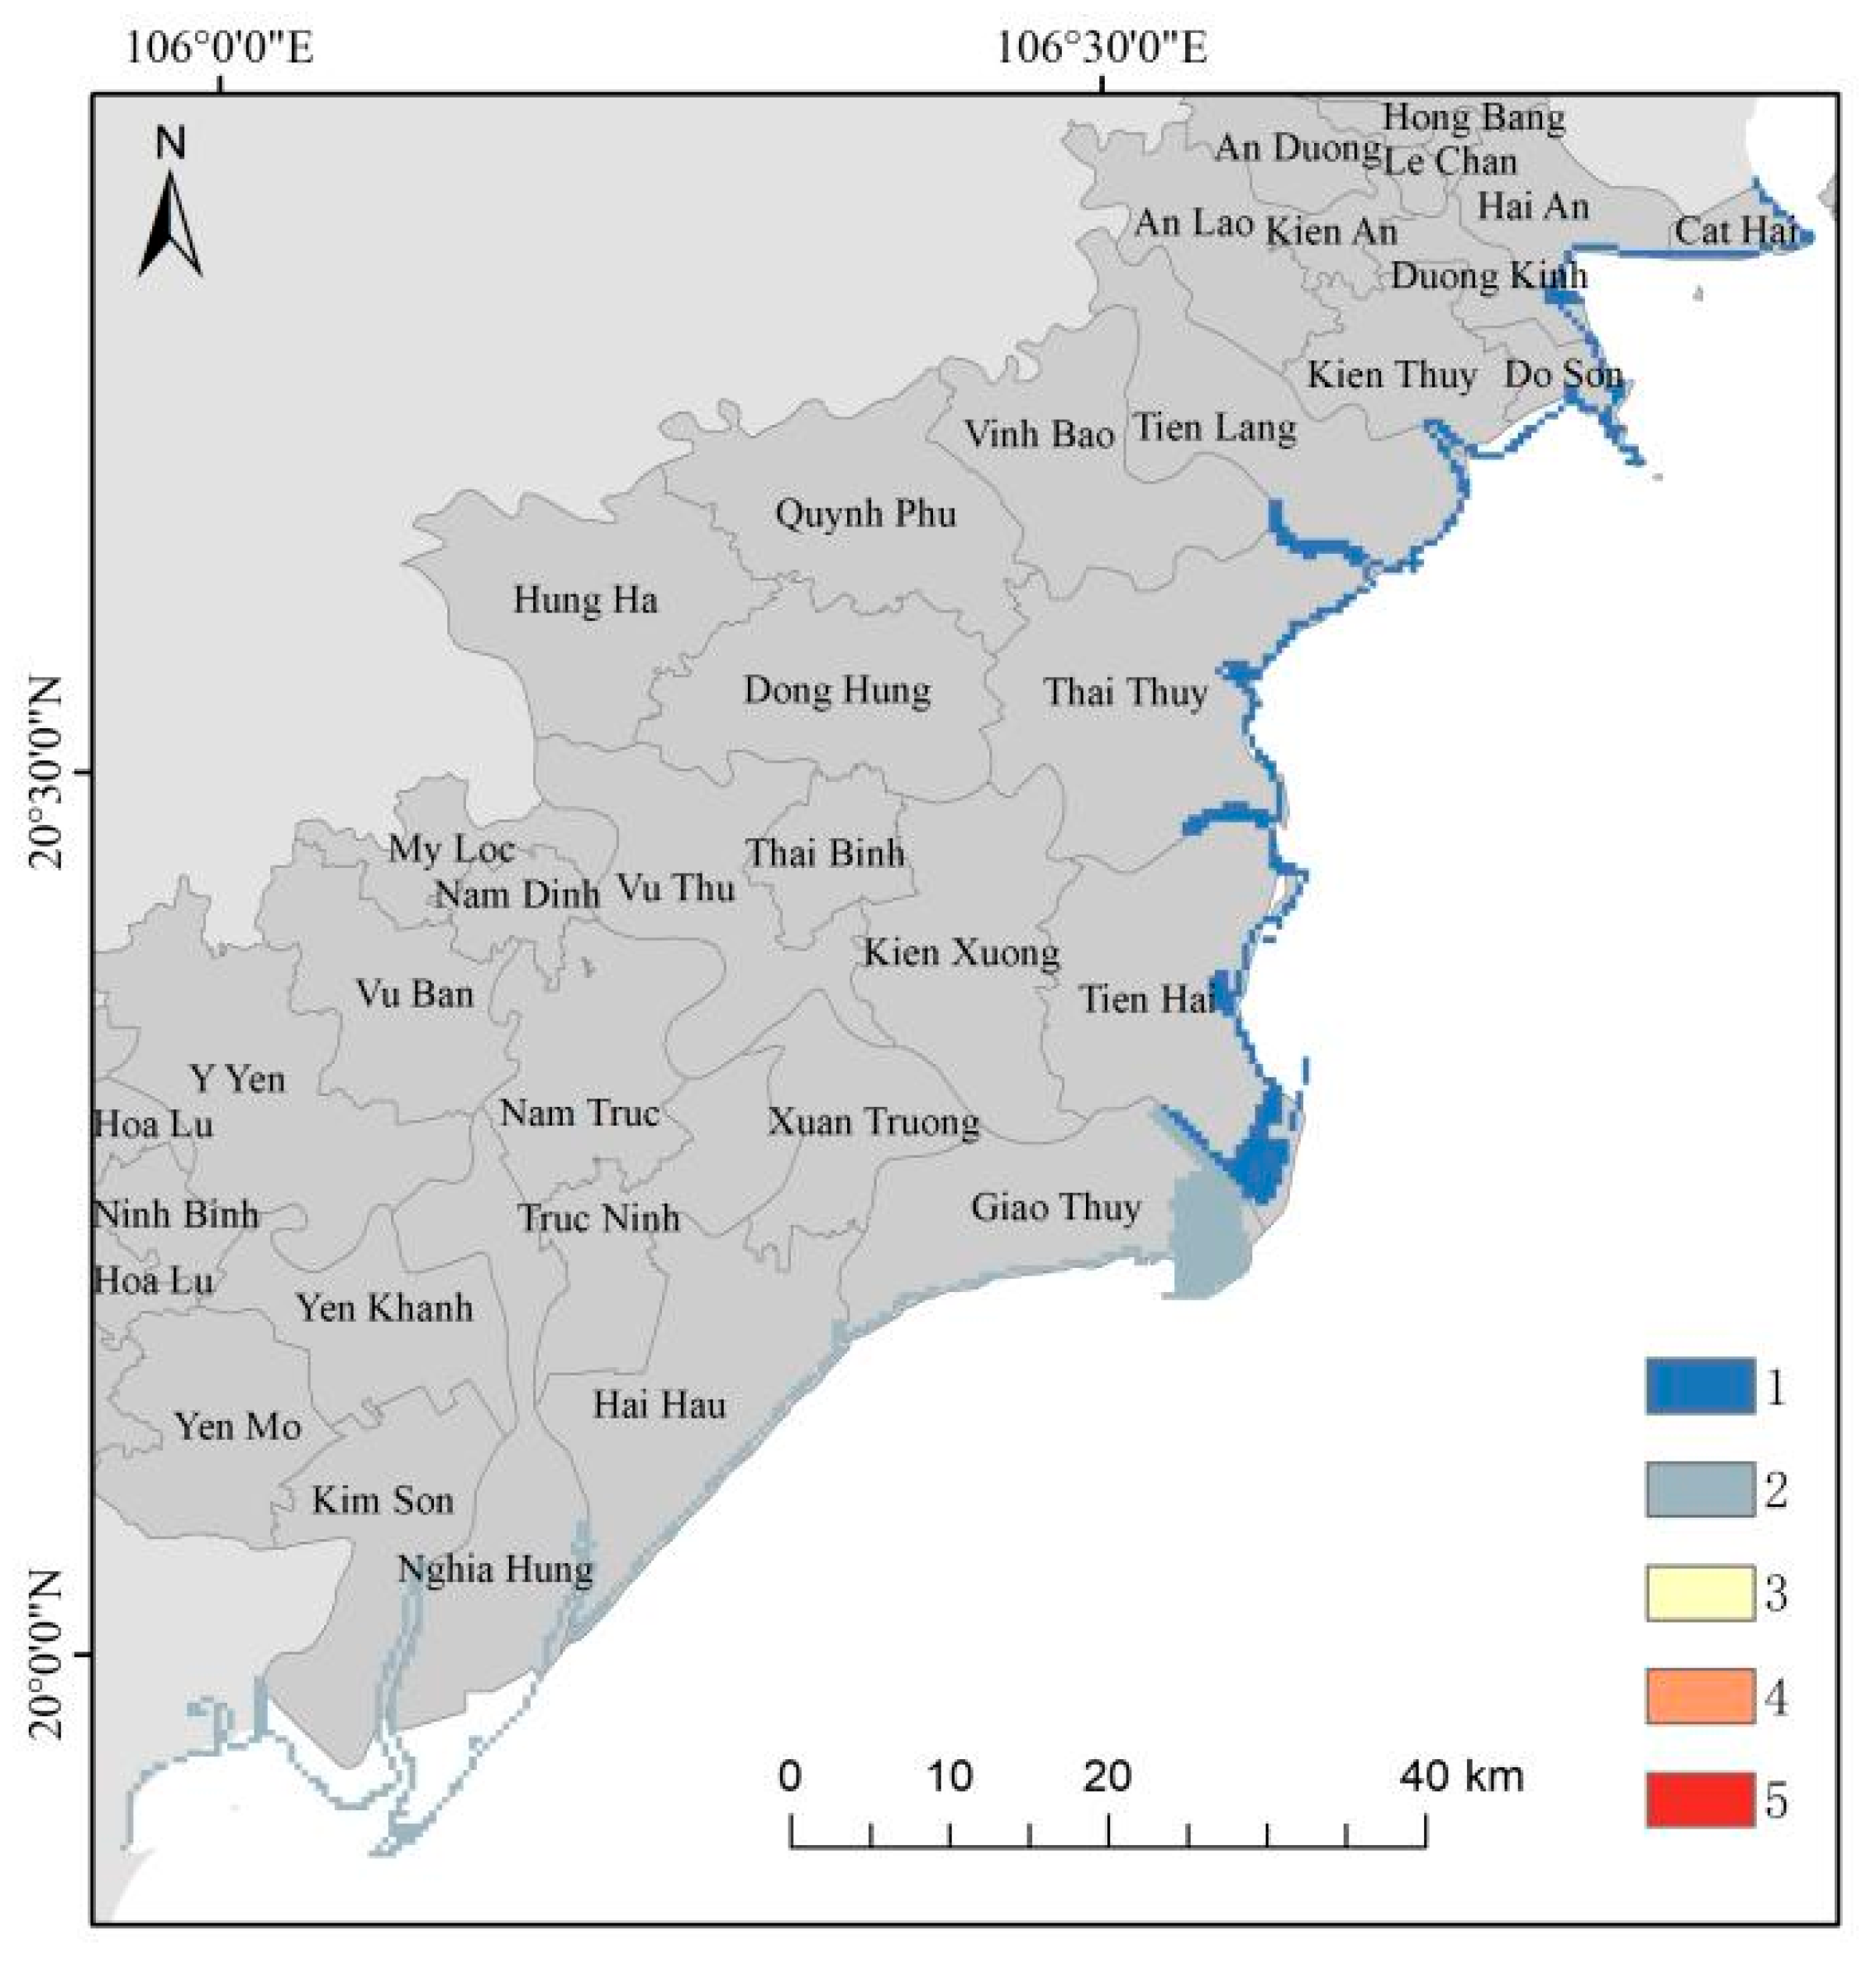
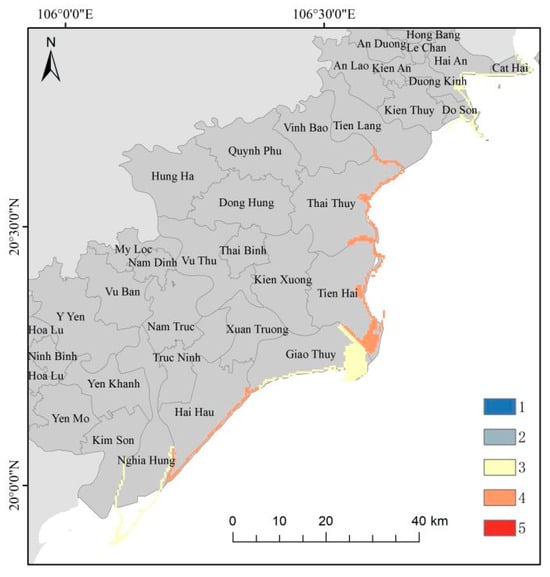
Figure A3.
Evaluation map of coastal erosion rate.
Figure A3.
Evaluation map of coastal erosion rate.
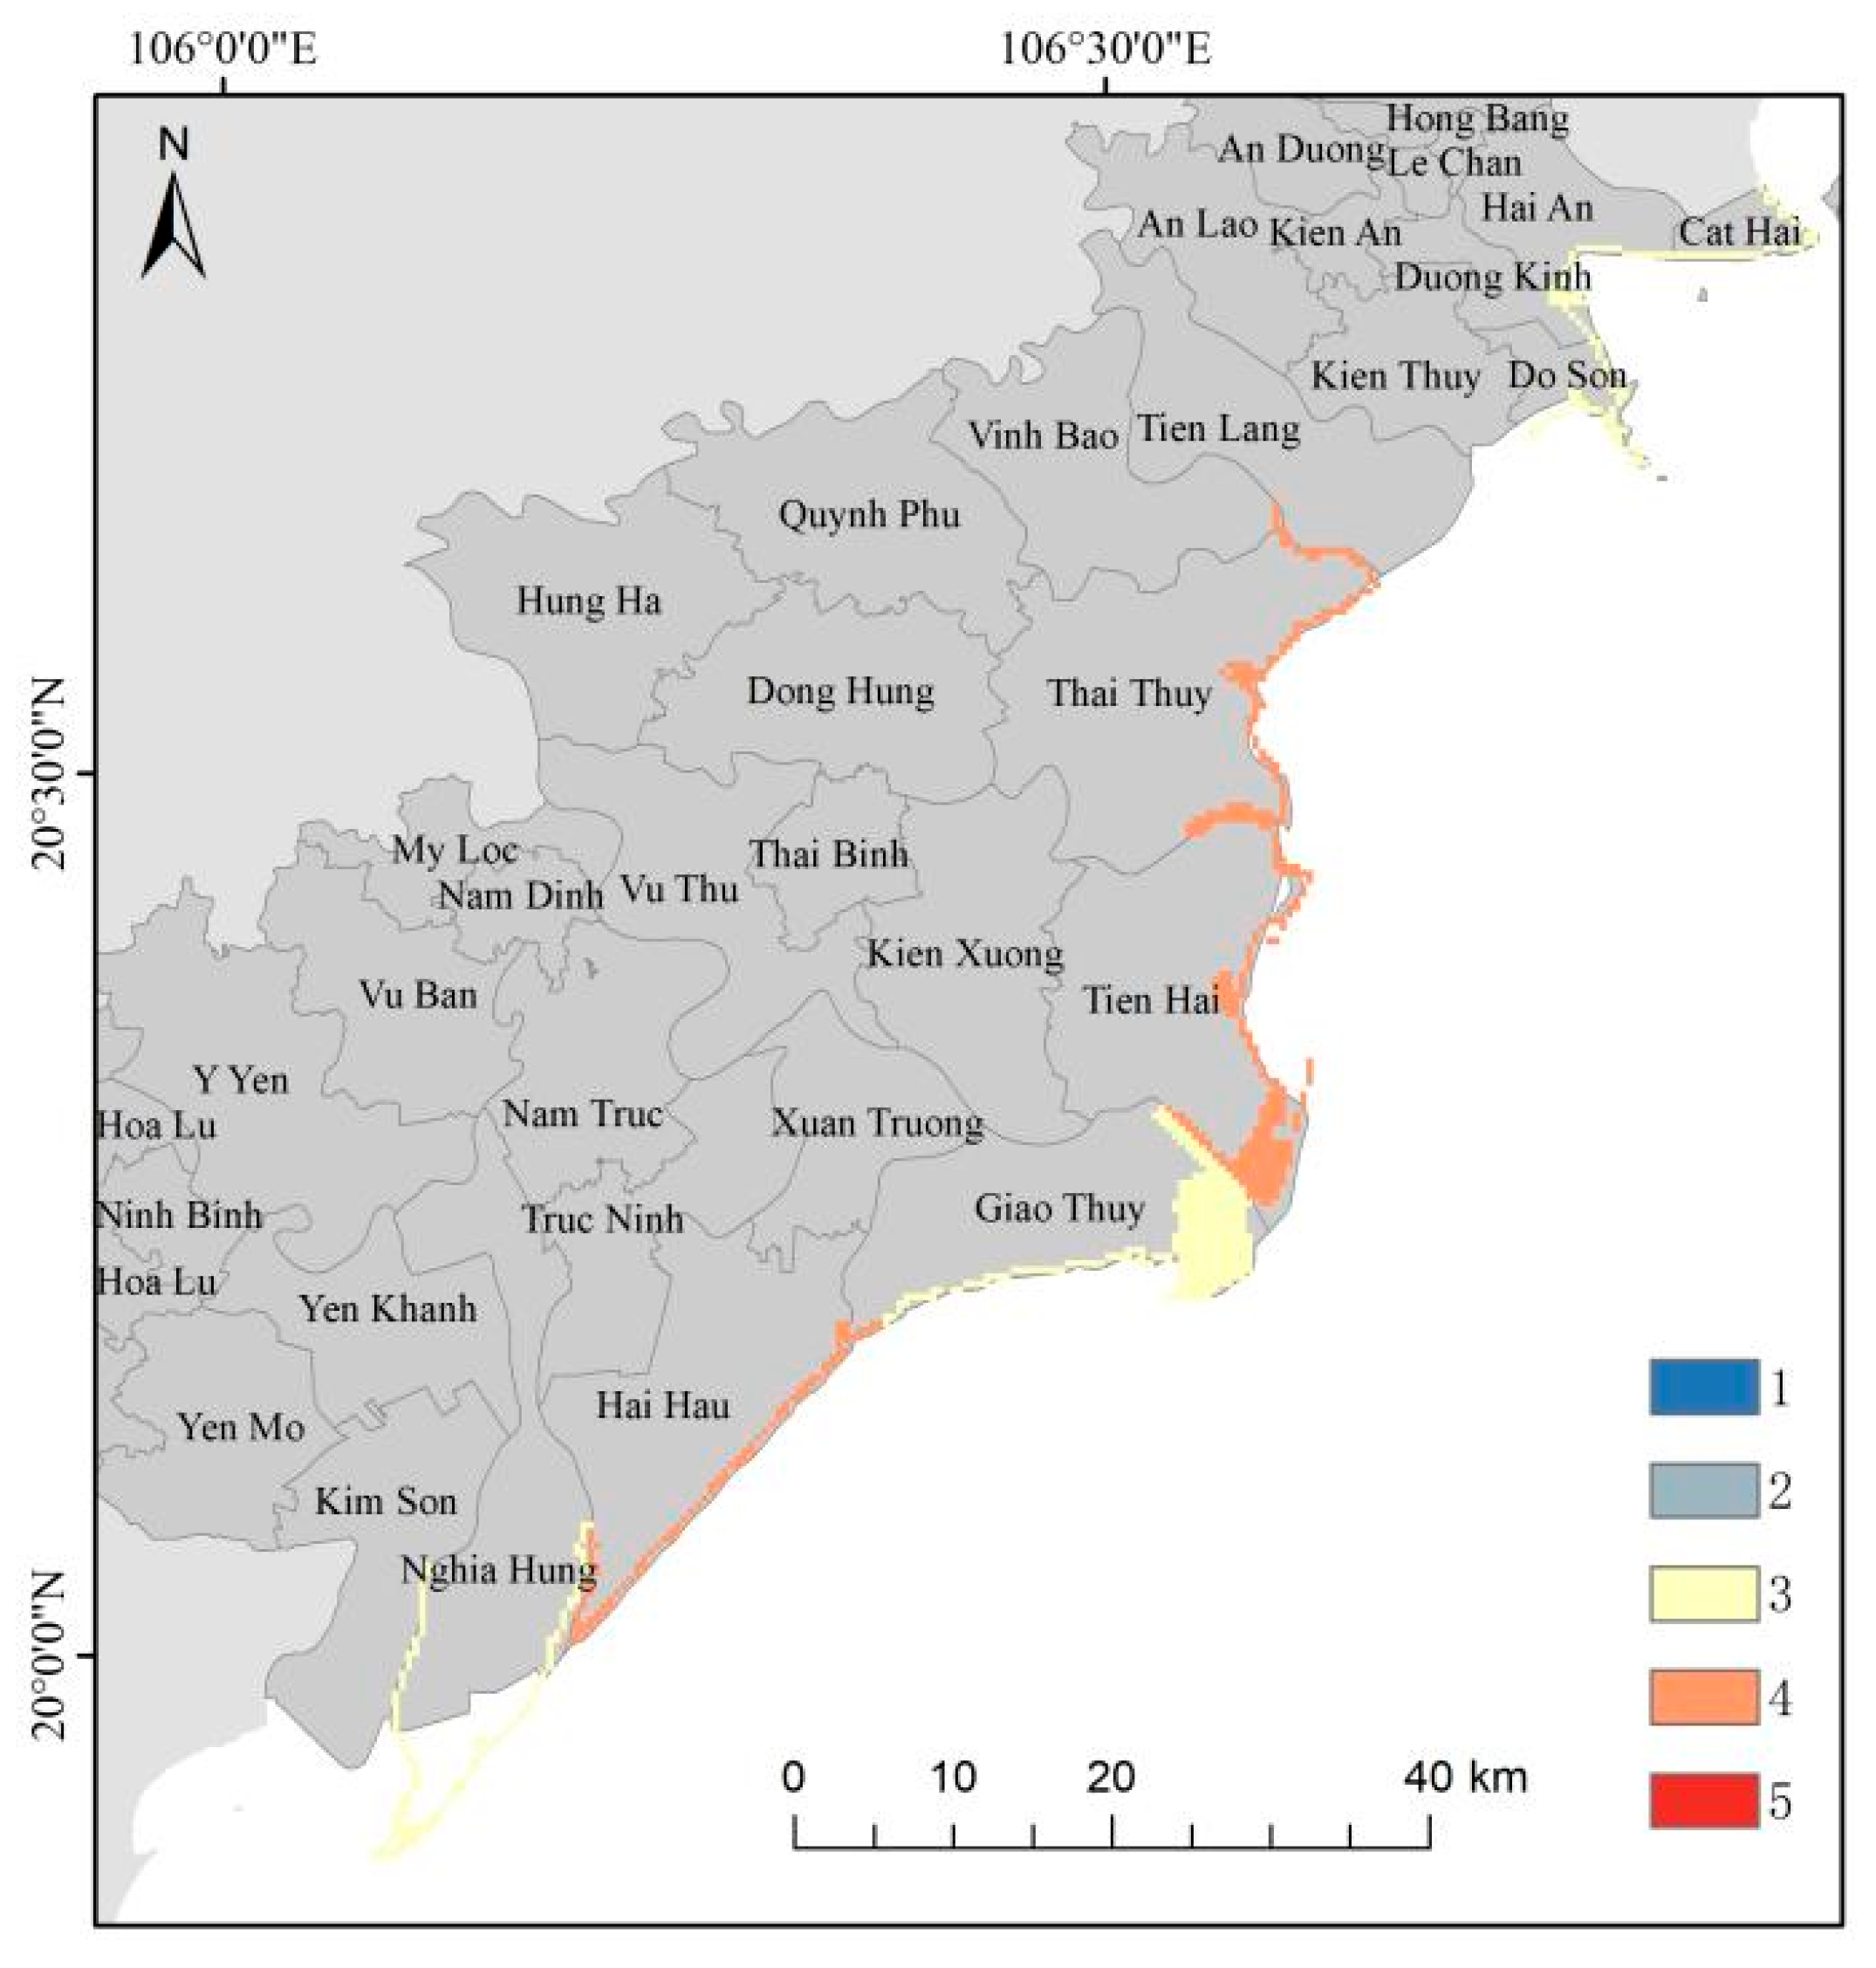
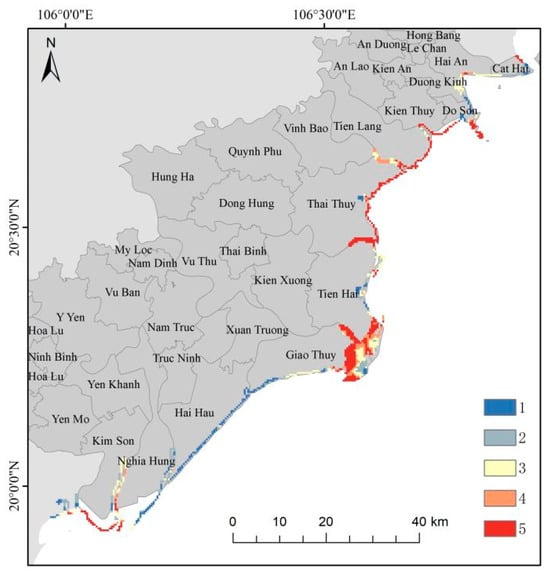
Figure A4.
Evaluation map of maximum storm surge.
Figure A4.
Evaluation map of maximum storm surge.


Figure A5.
Evaluation map of effective wave height.
Figure A5.
Evaluation map of effective wave height.
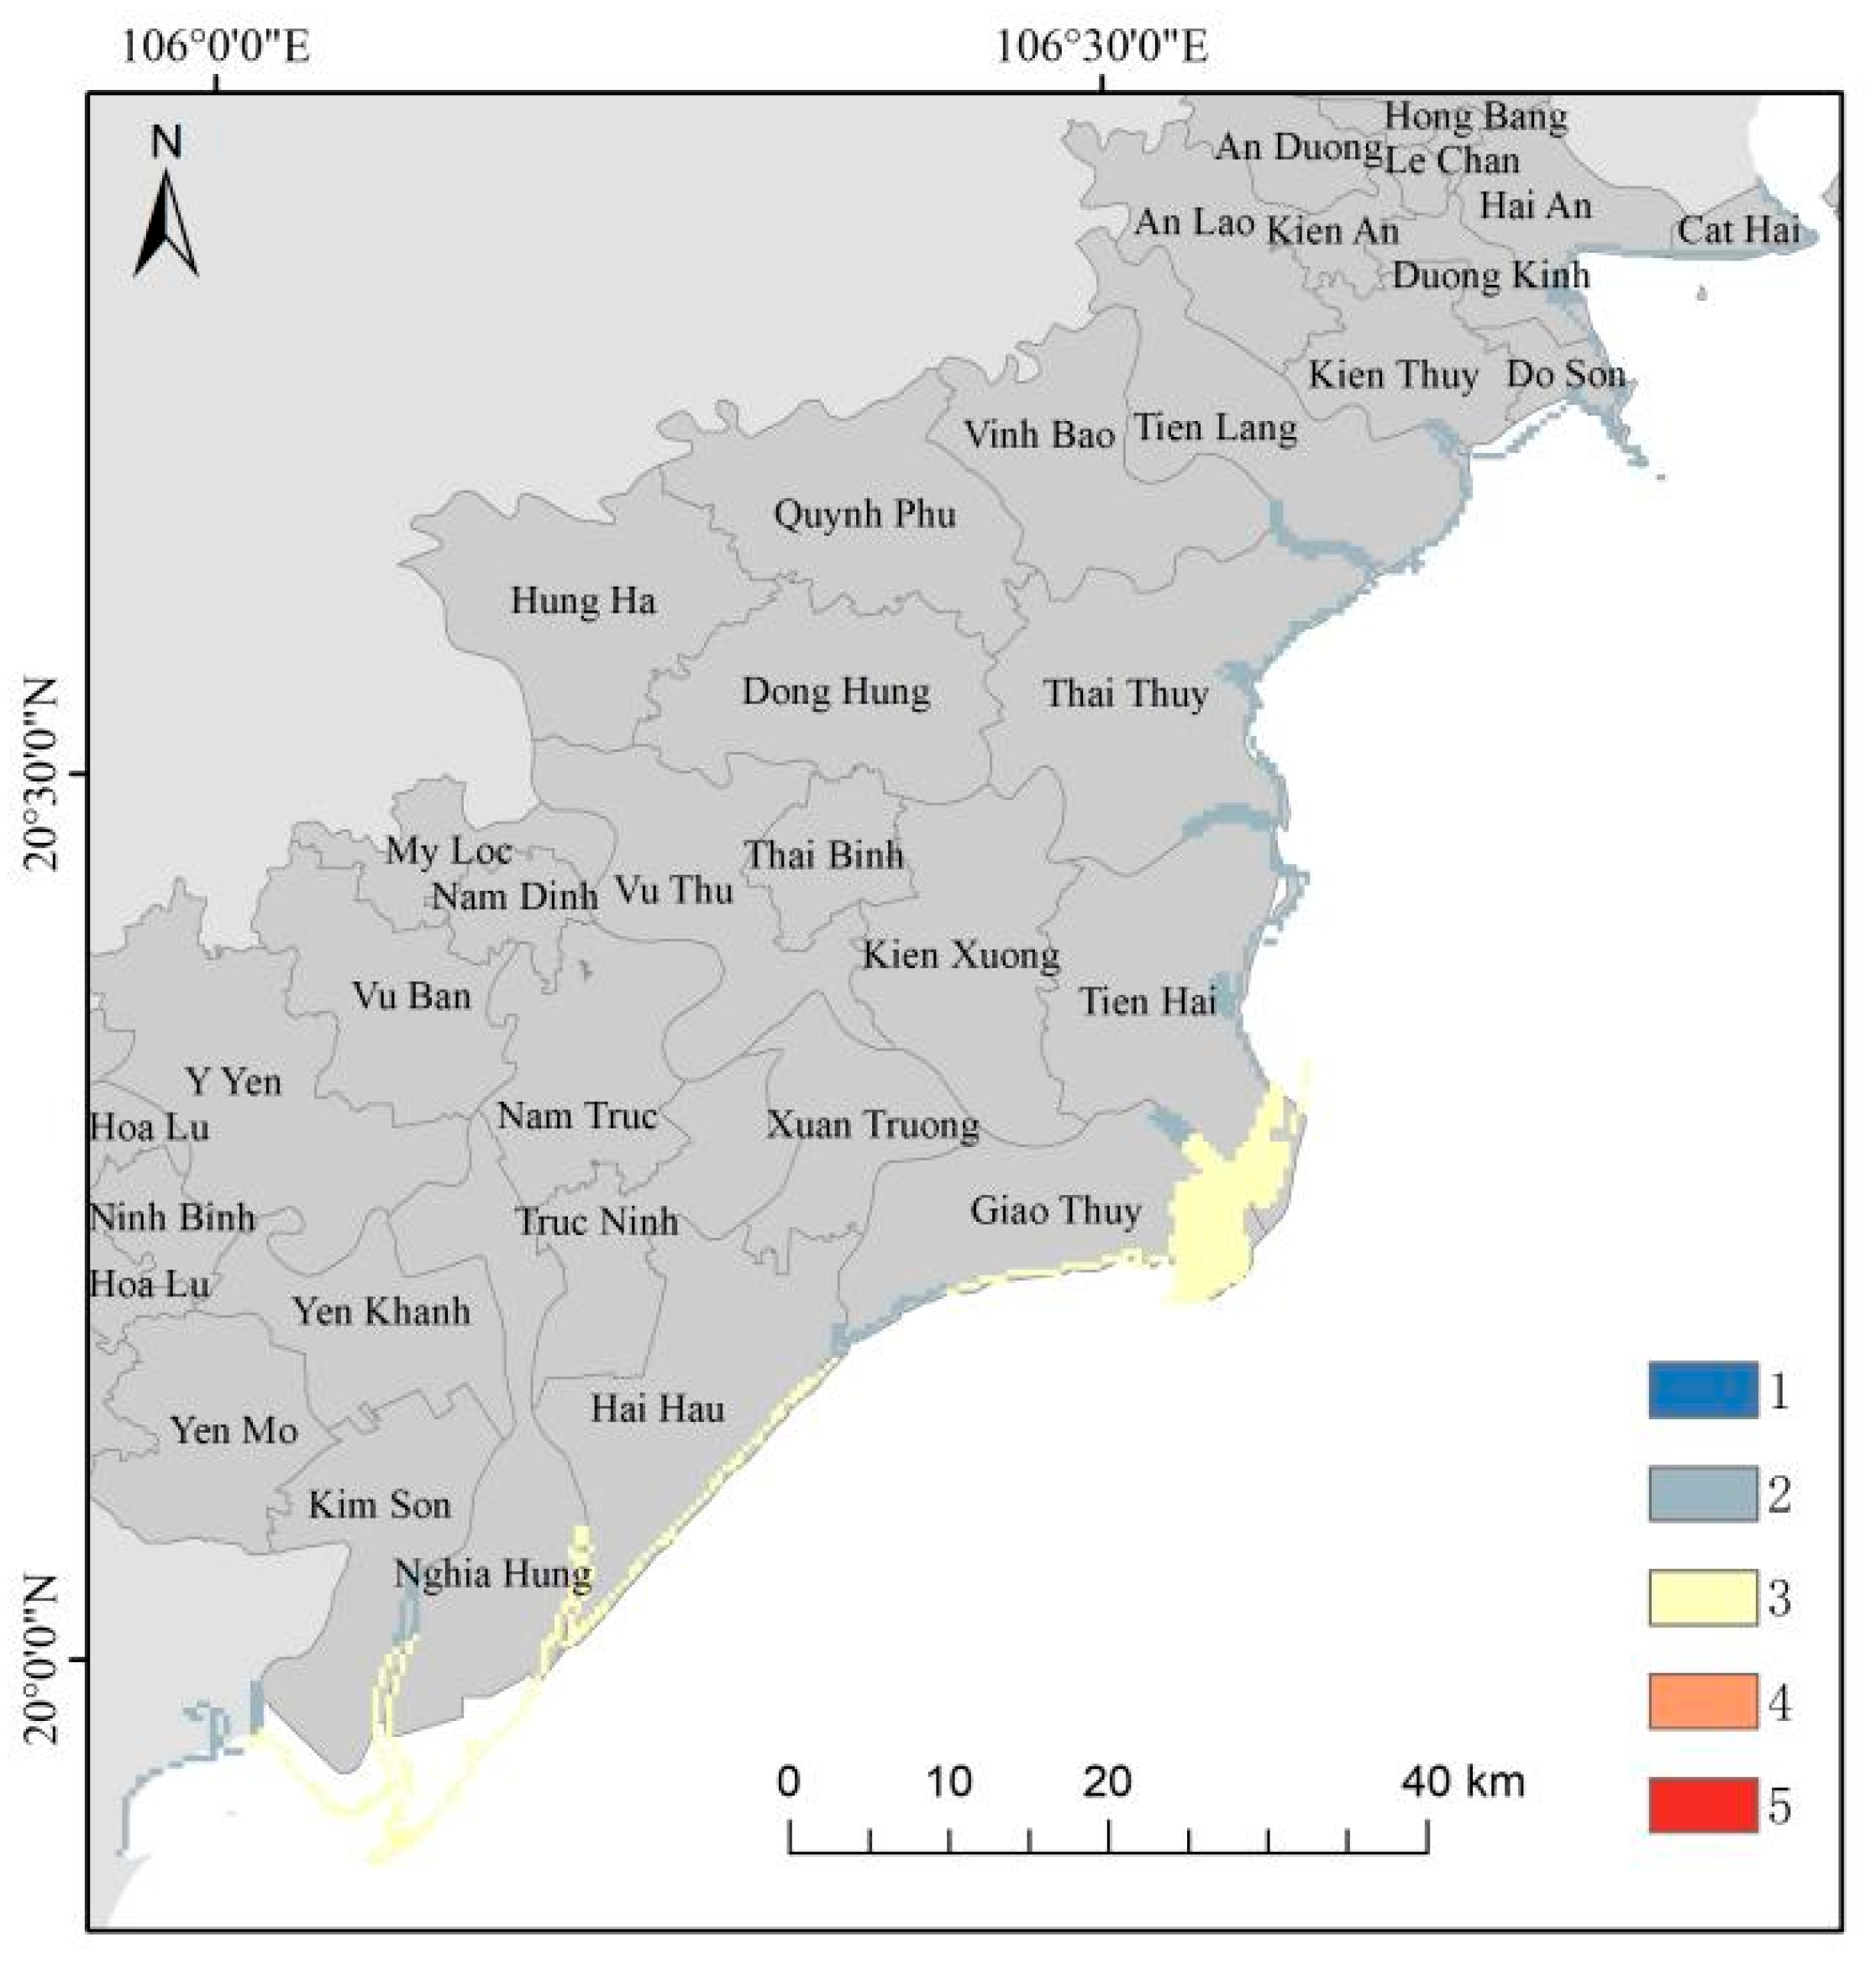
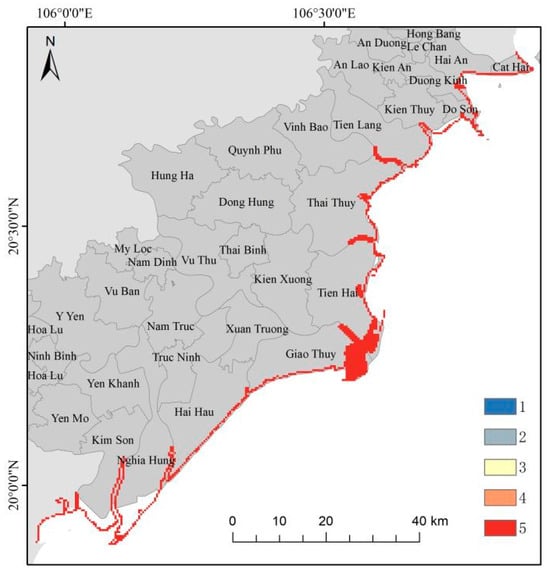
Figure A6.
Evaluation map of rainfall grade.
Figure A6.
Evaluation map of rainfall grade.


Figure A7.
Evaluation map of coastal elevation.
Figure A7.
Evaluation map of coastal elevation.
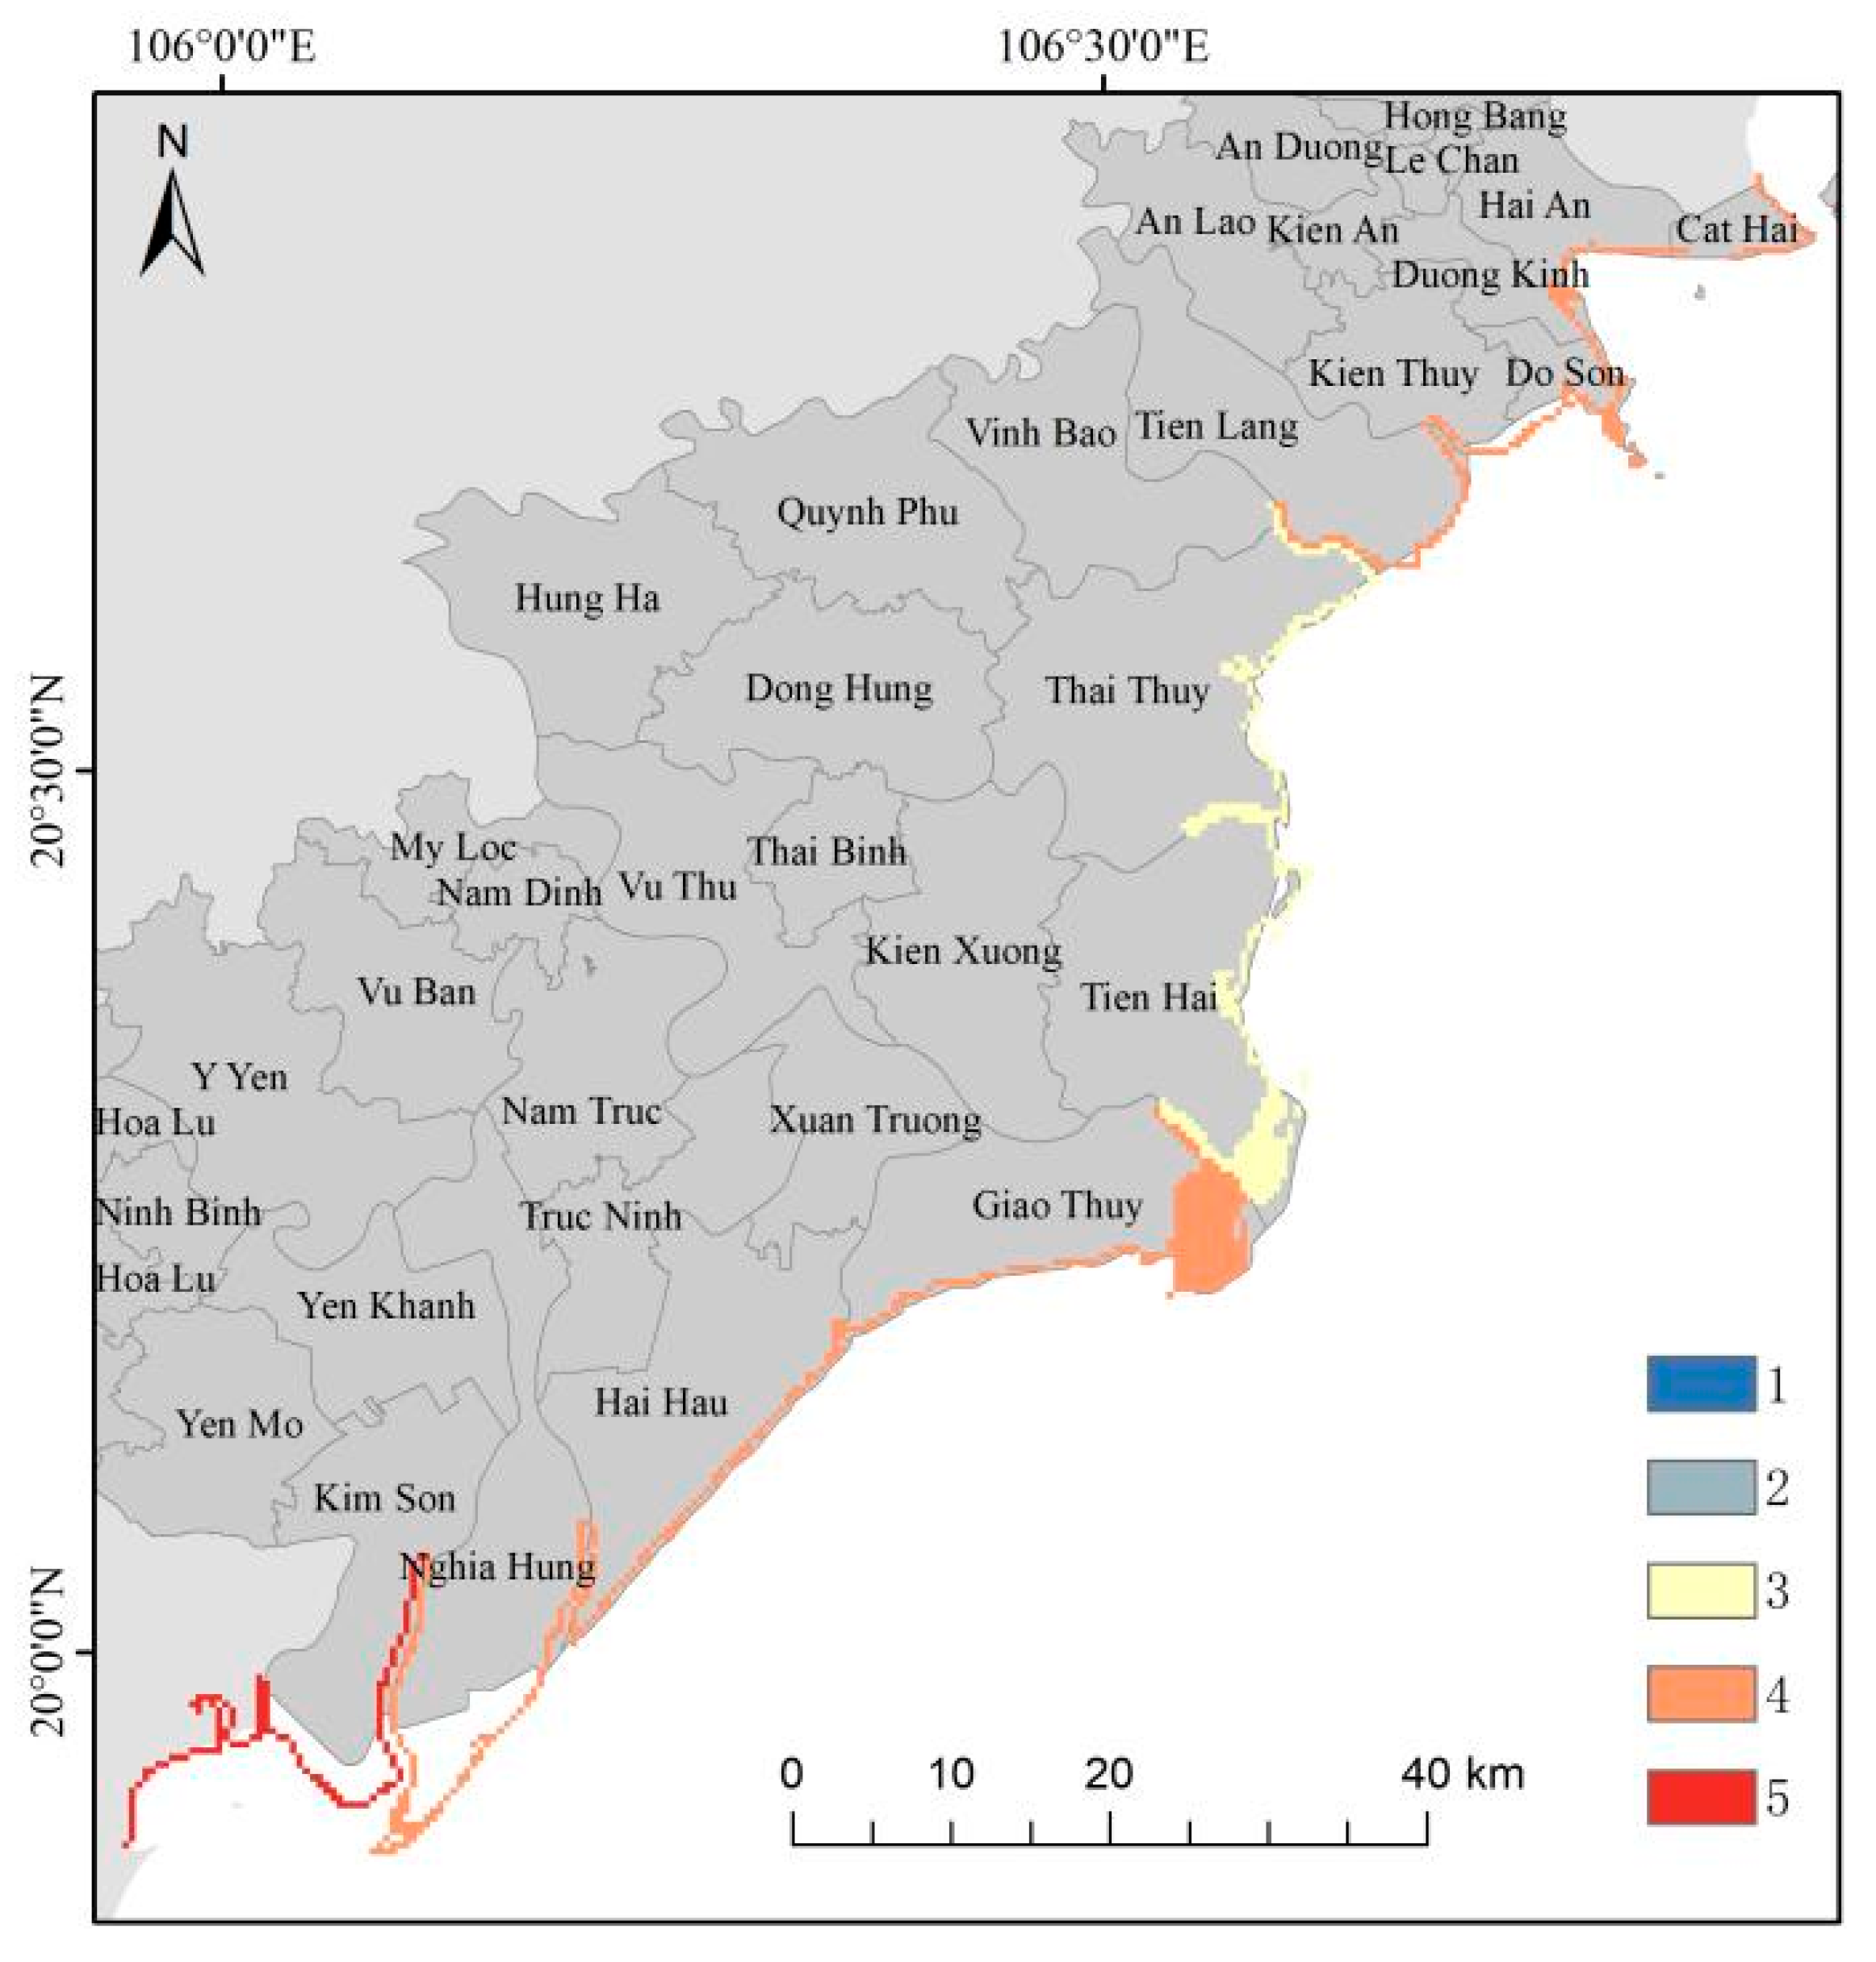
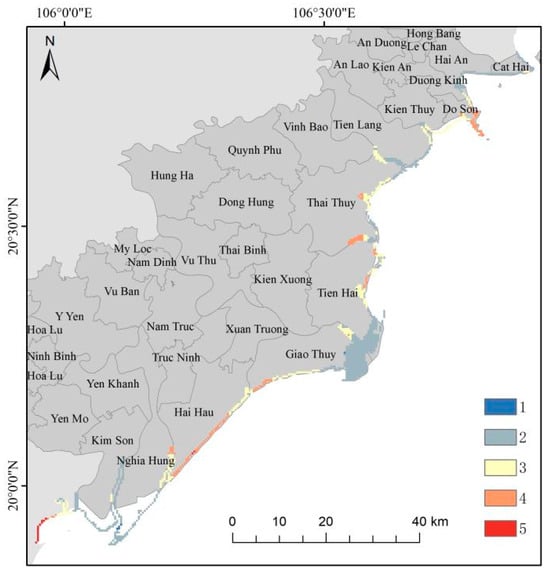
Figure A8.
Evaluation map of population density.
Figure A8.
Evaluation map of population density.

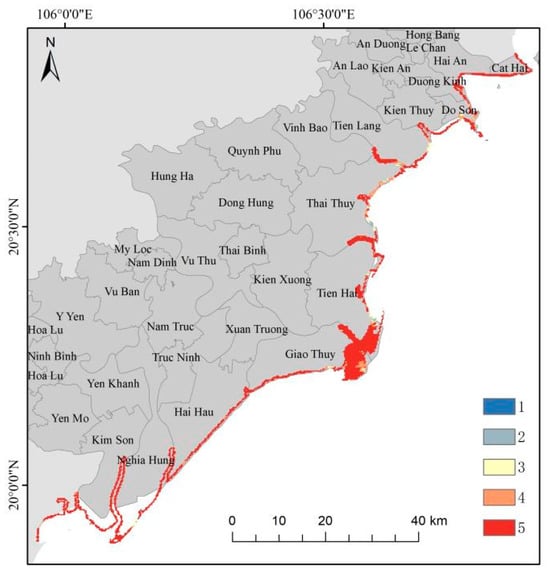
Figure A9.
Evaluation map of vegetation coverage.
Figure A9.
Evaluation map of vegetation coverage.


Figure A10.
Evaluation map of offshore distance.
Figure A10.
Evaluation map of offshore distance.
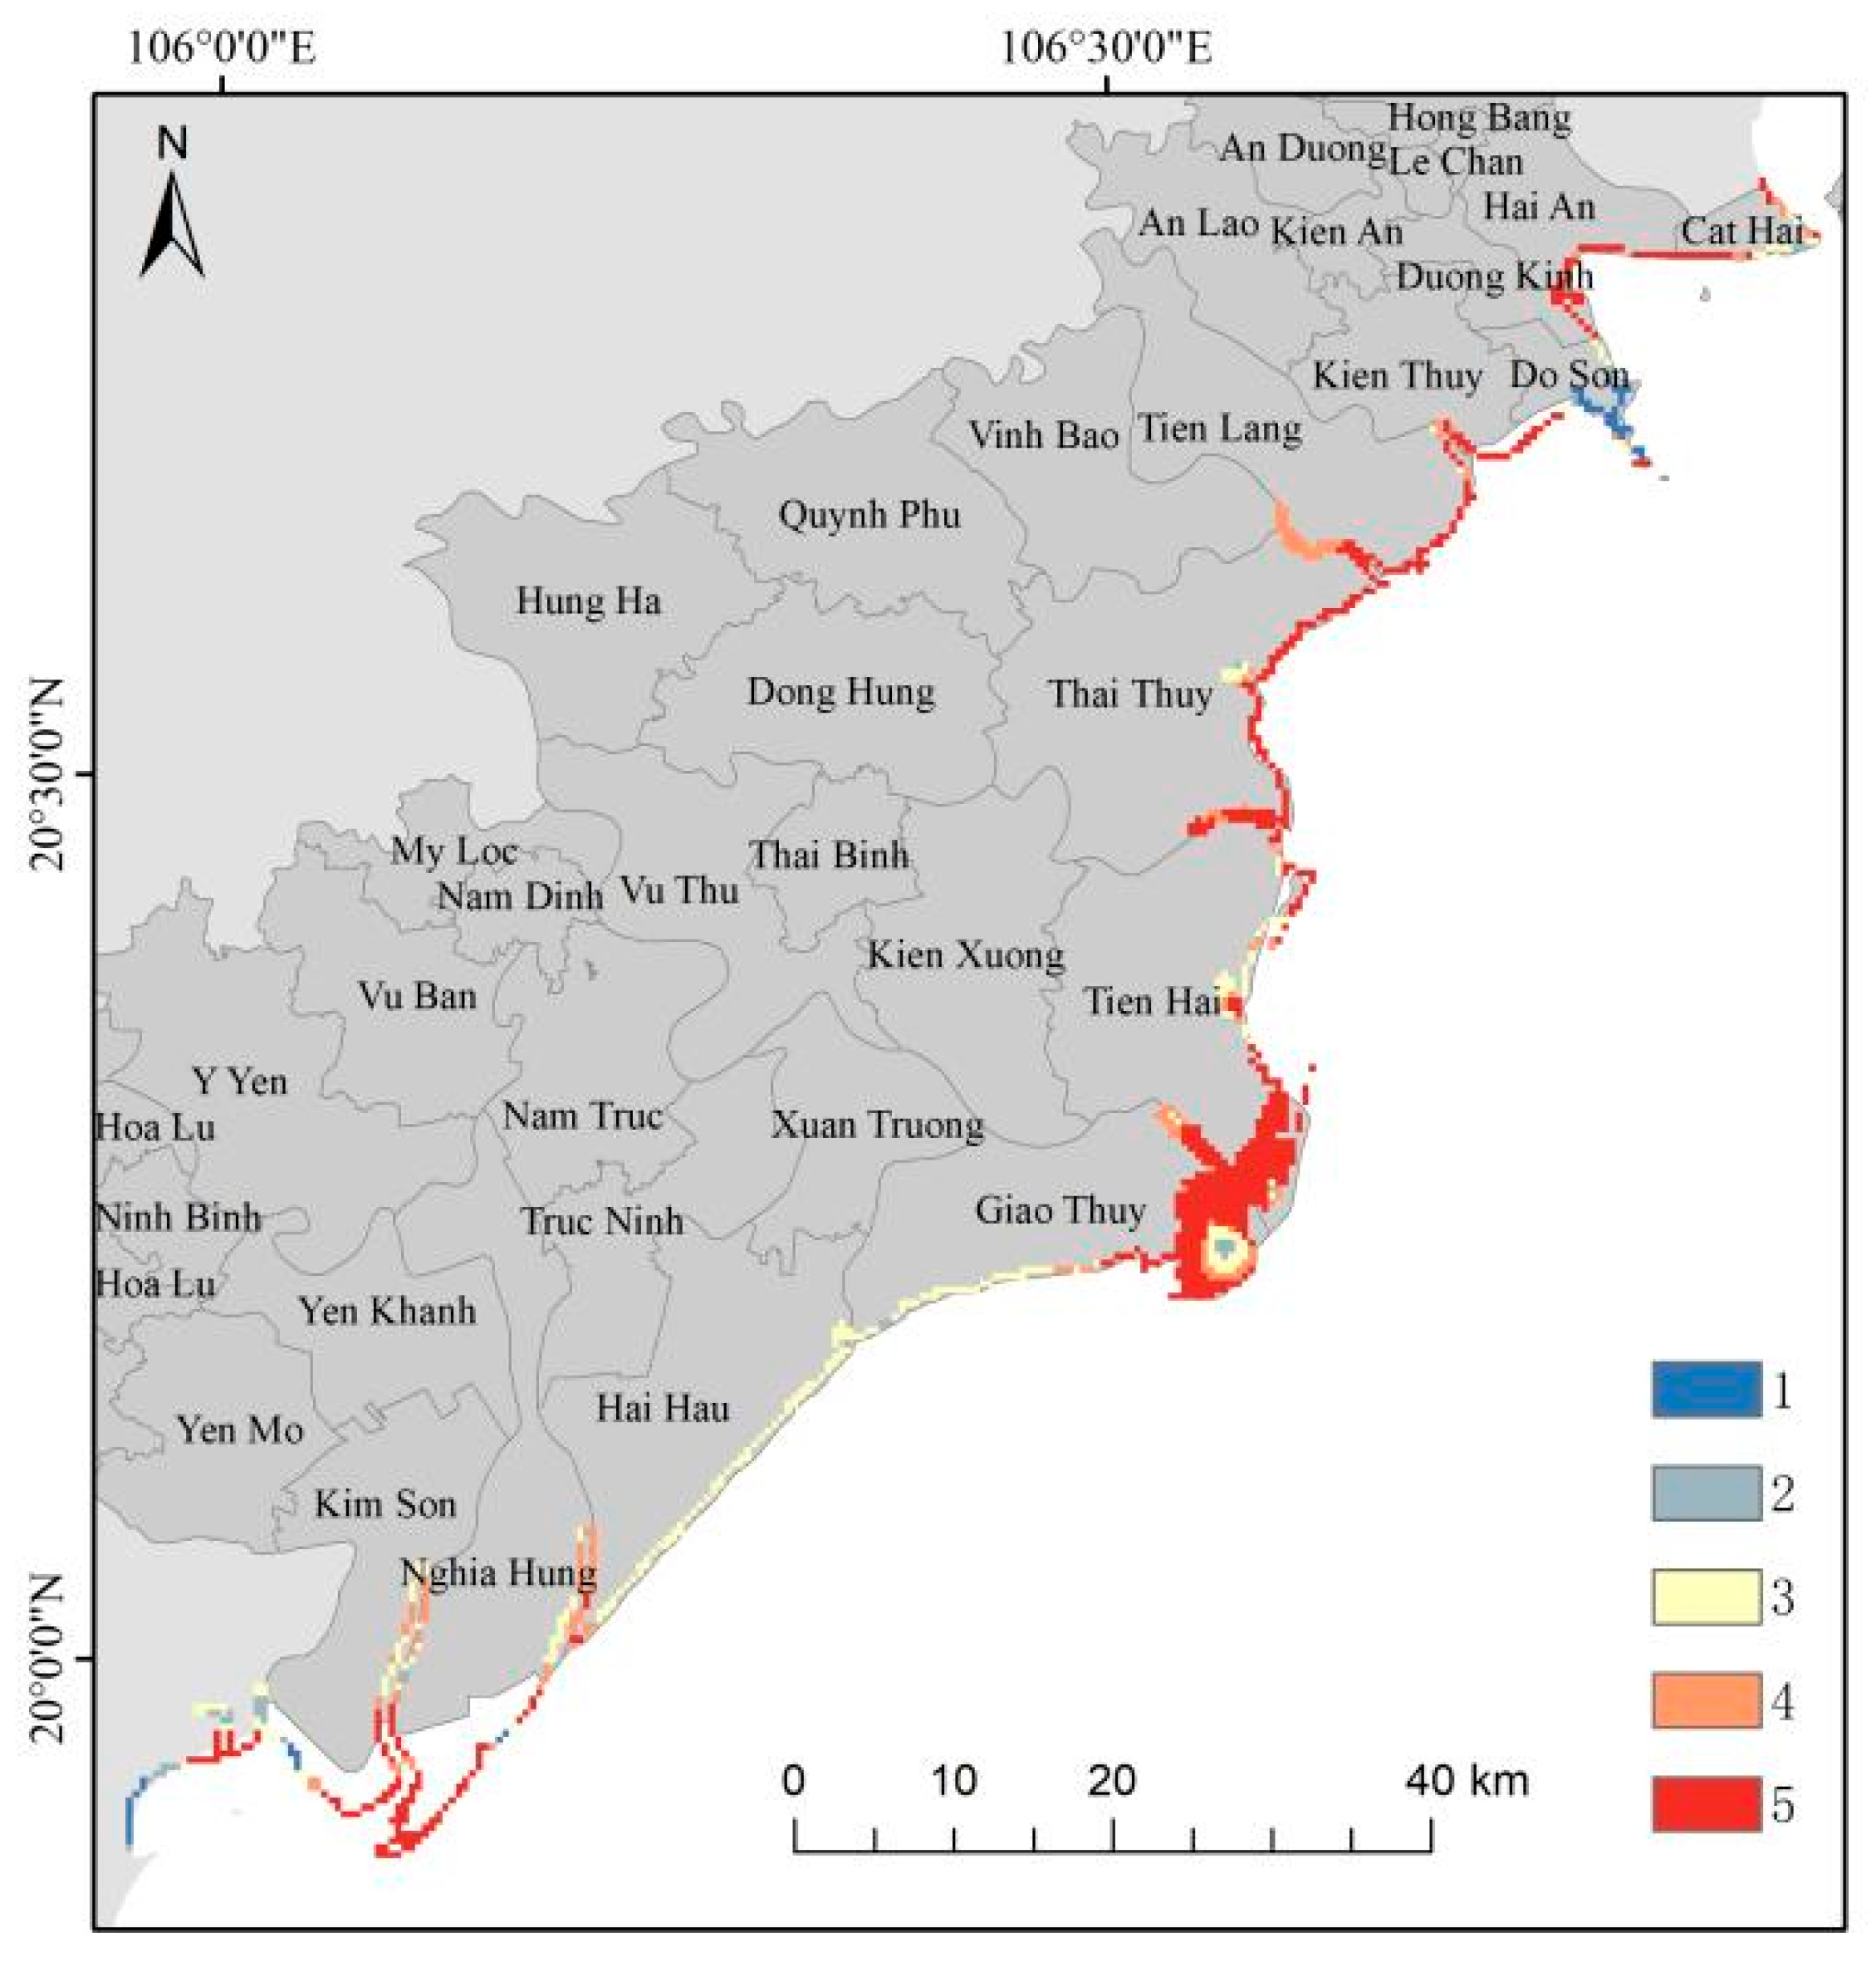
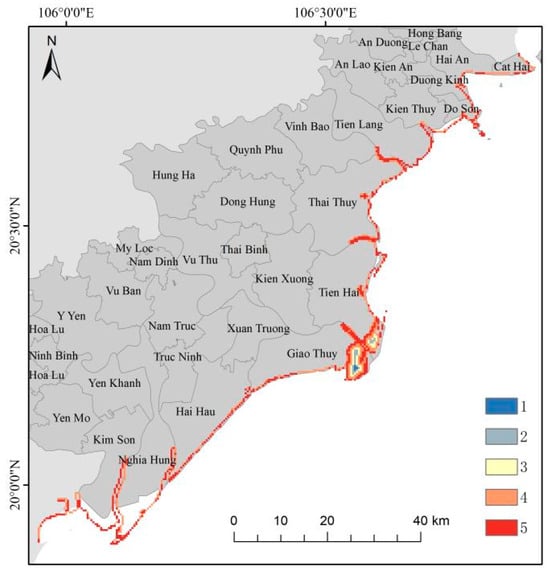
Figure A11.
Evaluation map of proportion of vulnerable land area.
Figure A11.
Evaluation map of proportion of vulnerable land area.

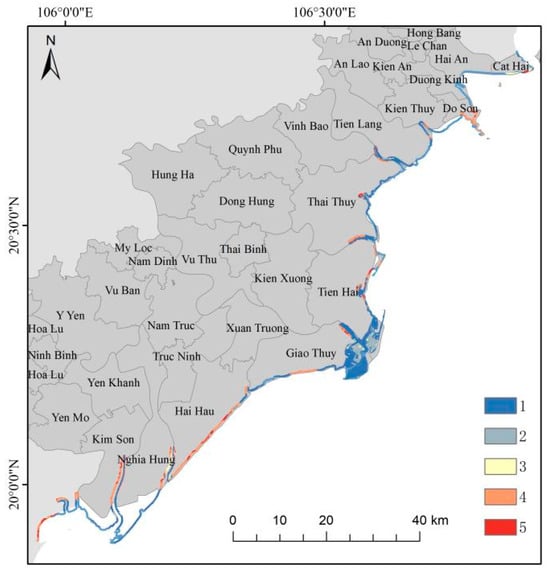
Figure A12.
Evaluation map of land use.
Figure A12.
Evaluation map of land use.


Figure A13.
Evaluation map of urbanization.
Figure A13.
Evaluation map of urbanization.
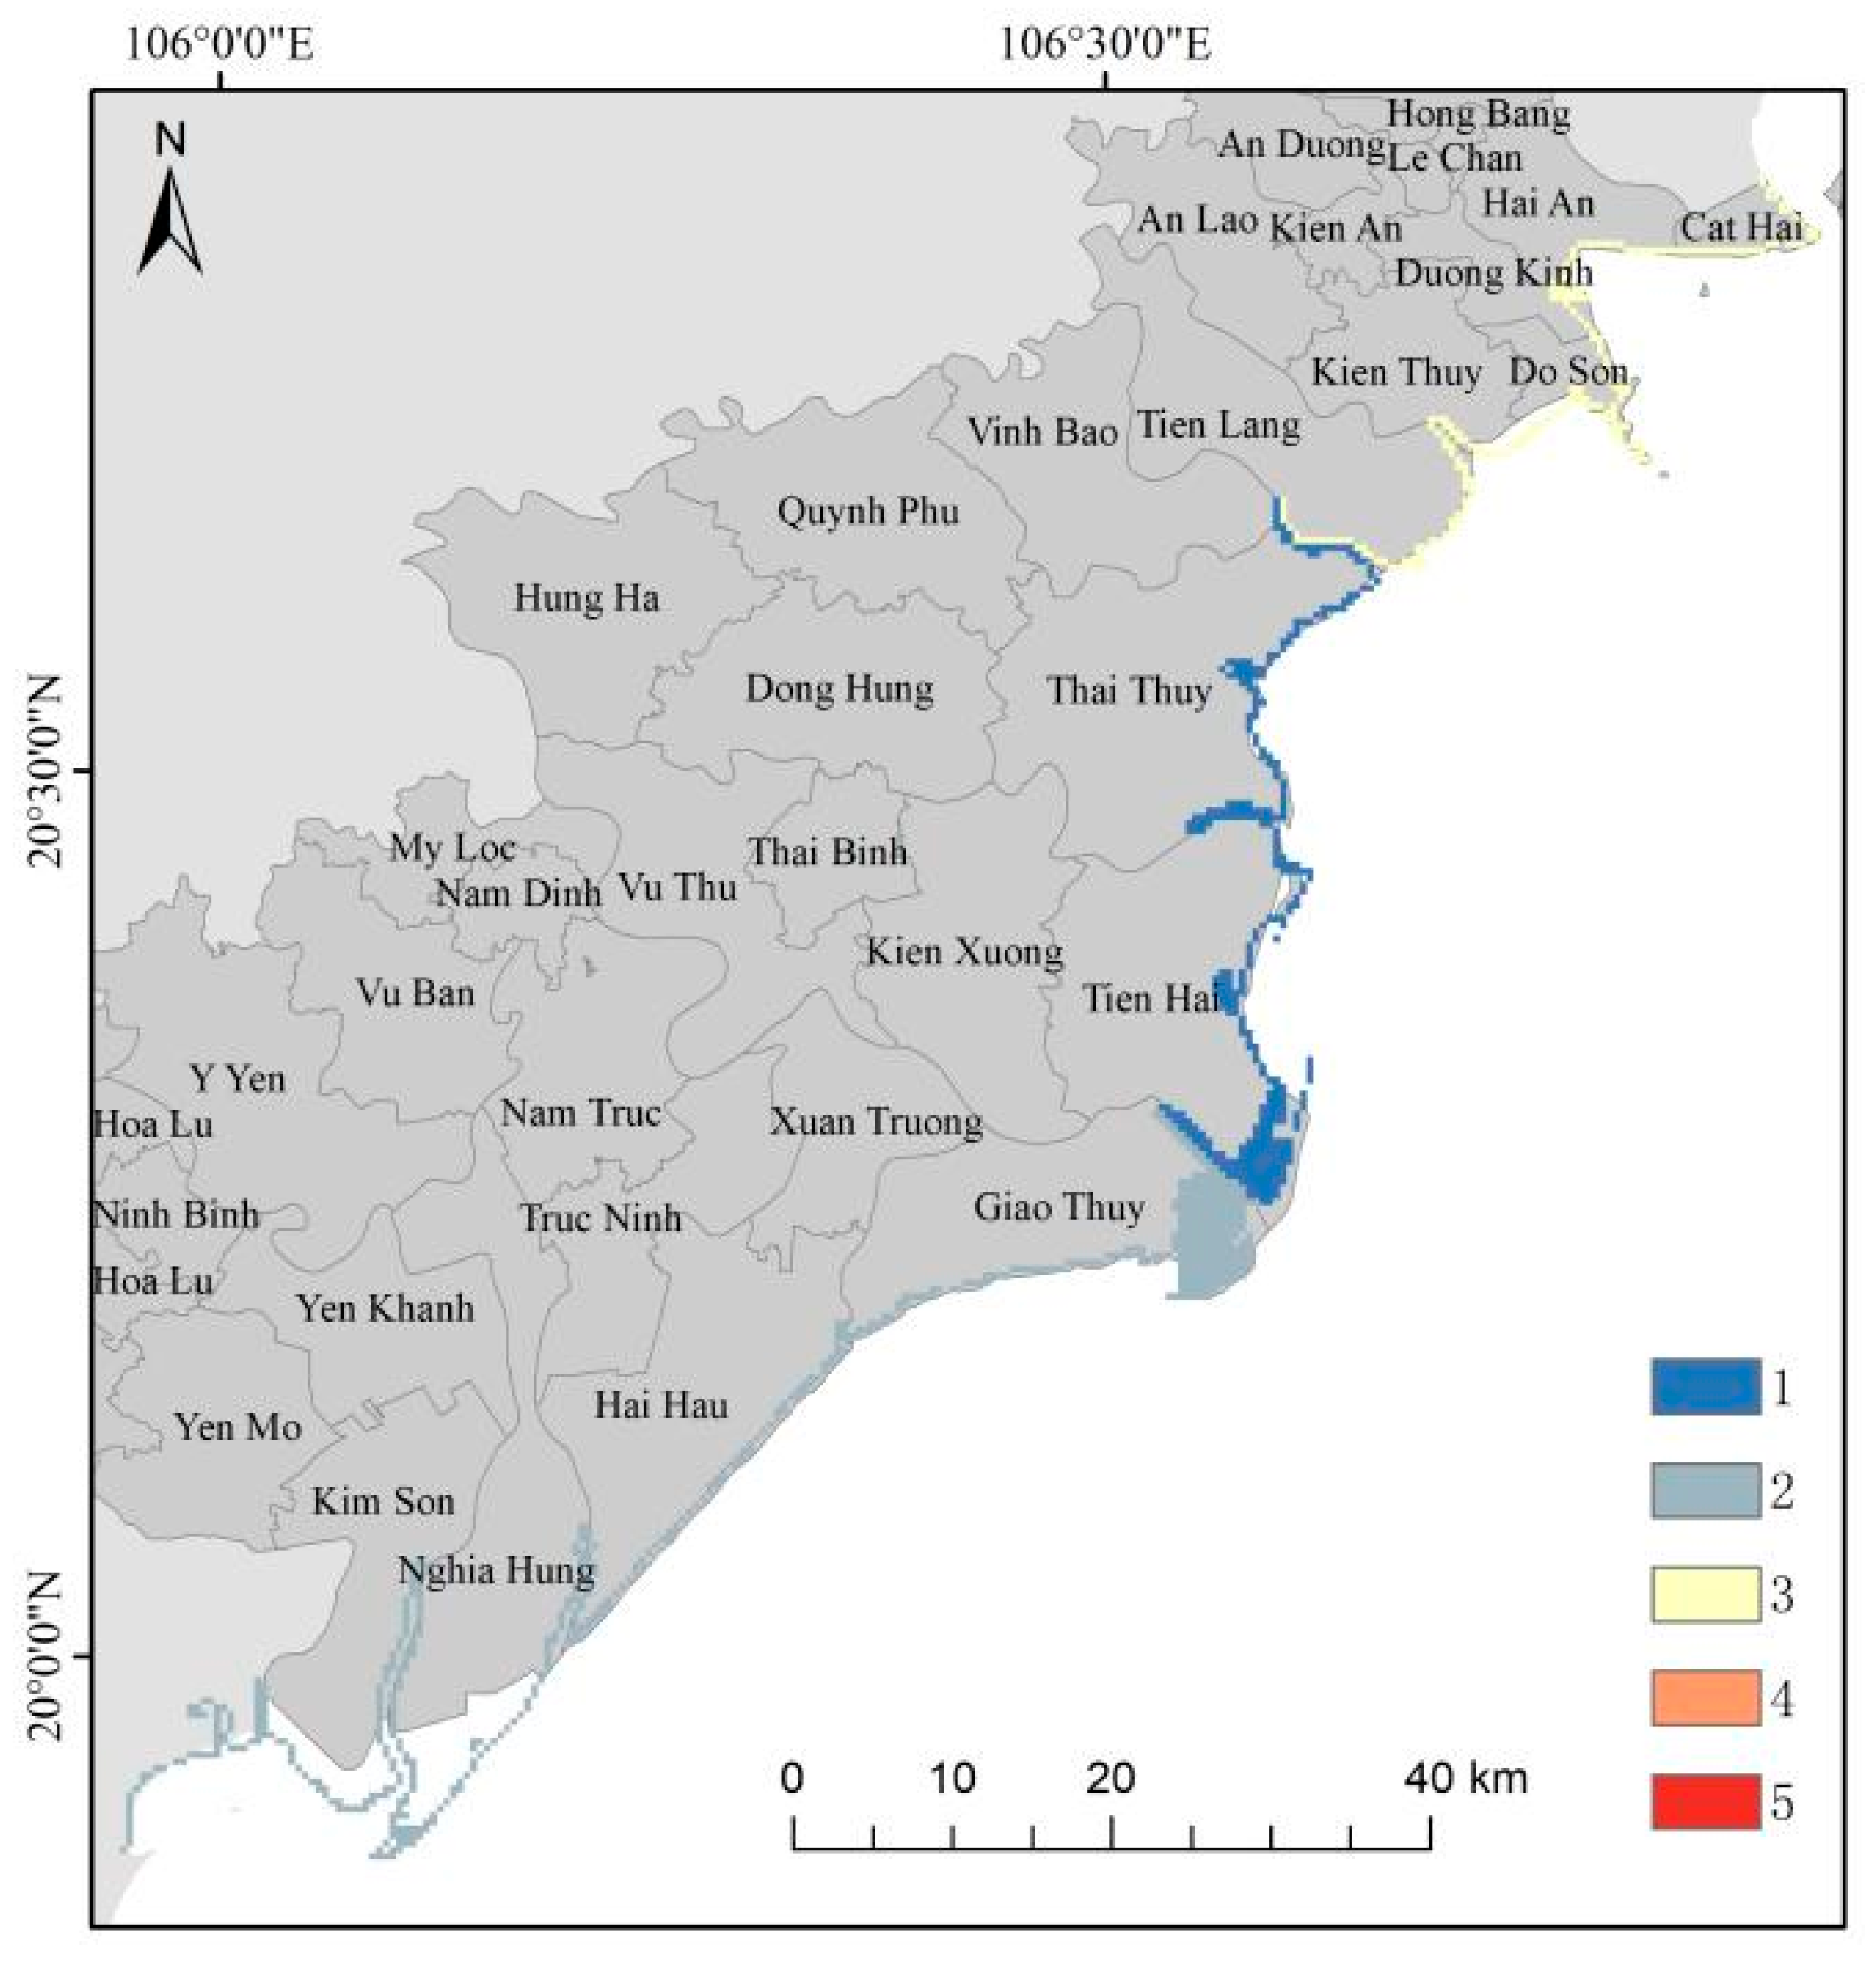

Figure A14.
Evaluation map of the per capita GDP.
Figure A14.
Evaluation map of the per capita GDP.
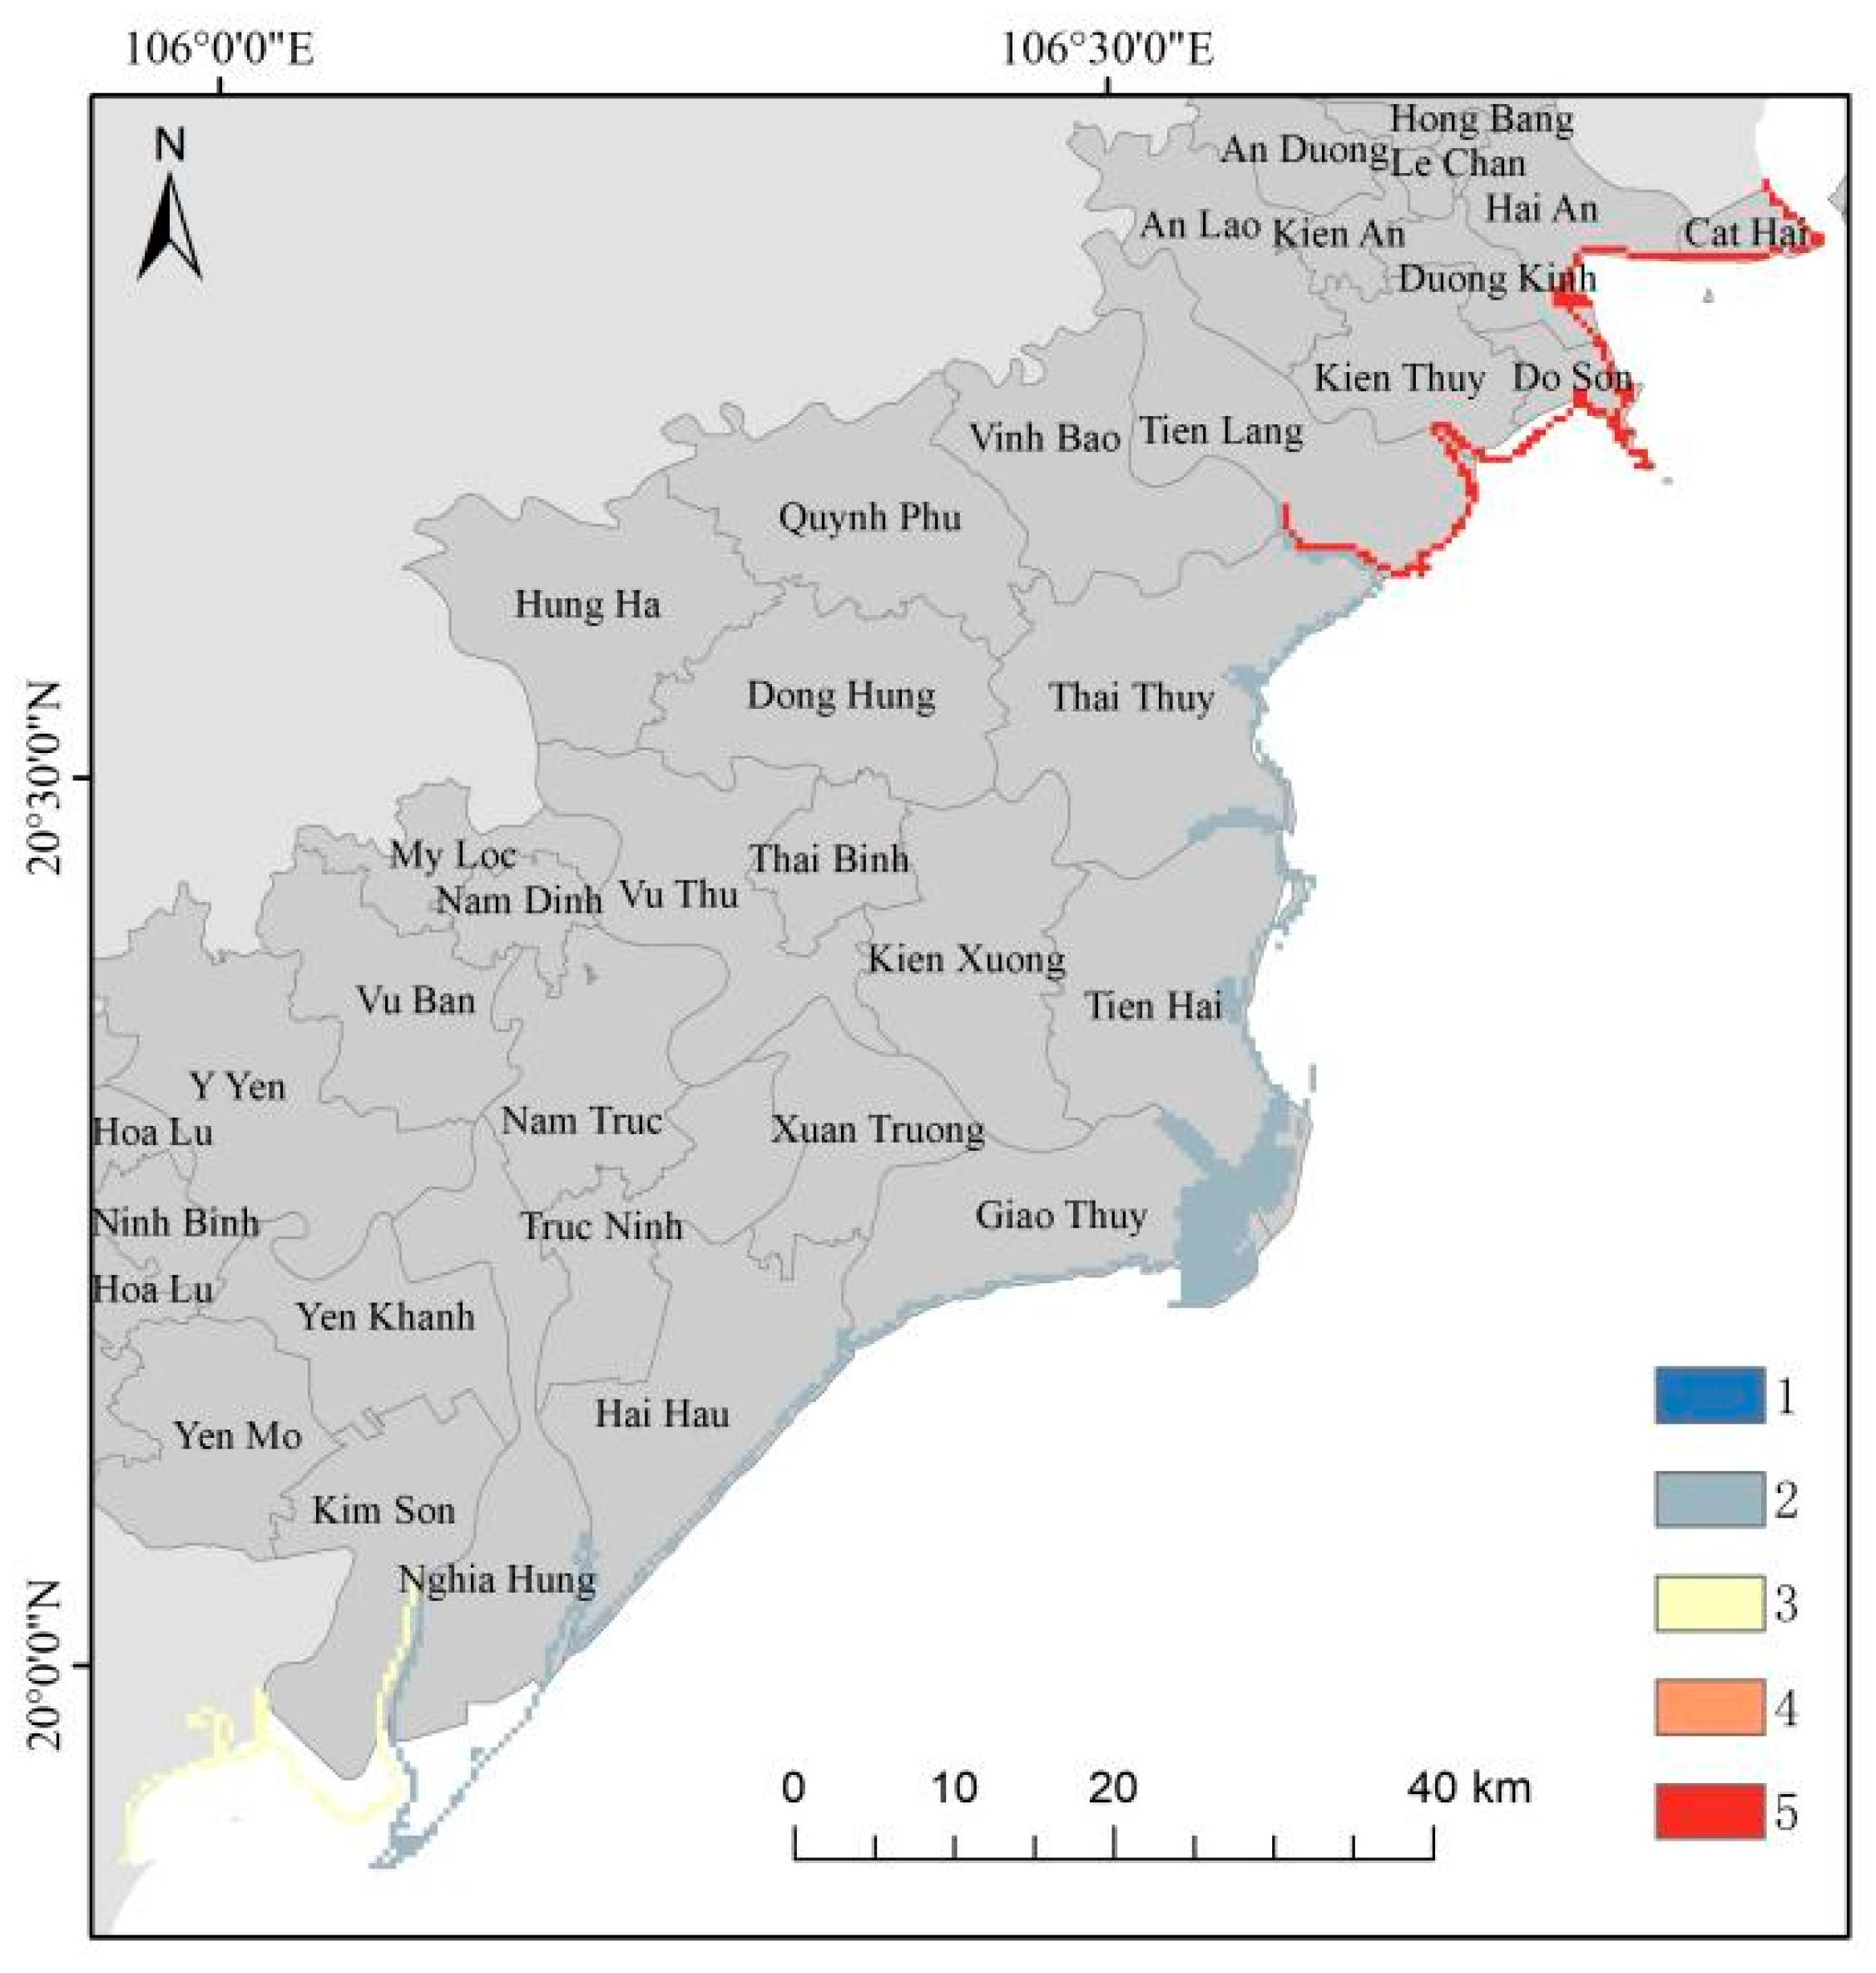
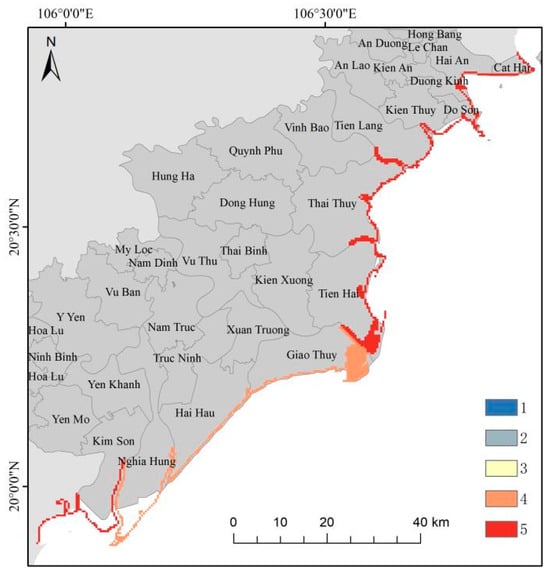
Figure A15.
Evaluation map of environmental governance level.
Figure A15.
Evaluation map of environmental governance level.

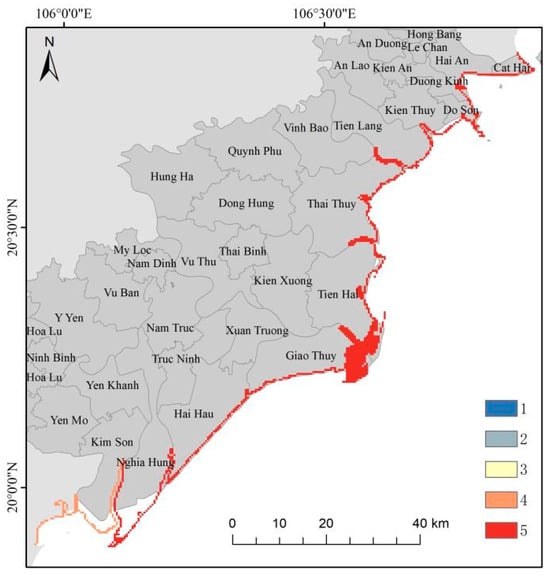
Figure A16.
Evaluation map of marine science and education level.
Figure A16.
Evaluation map of marine science and education level.
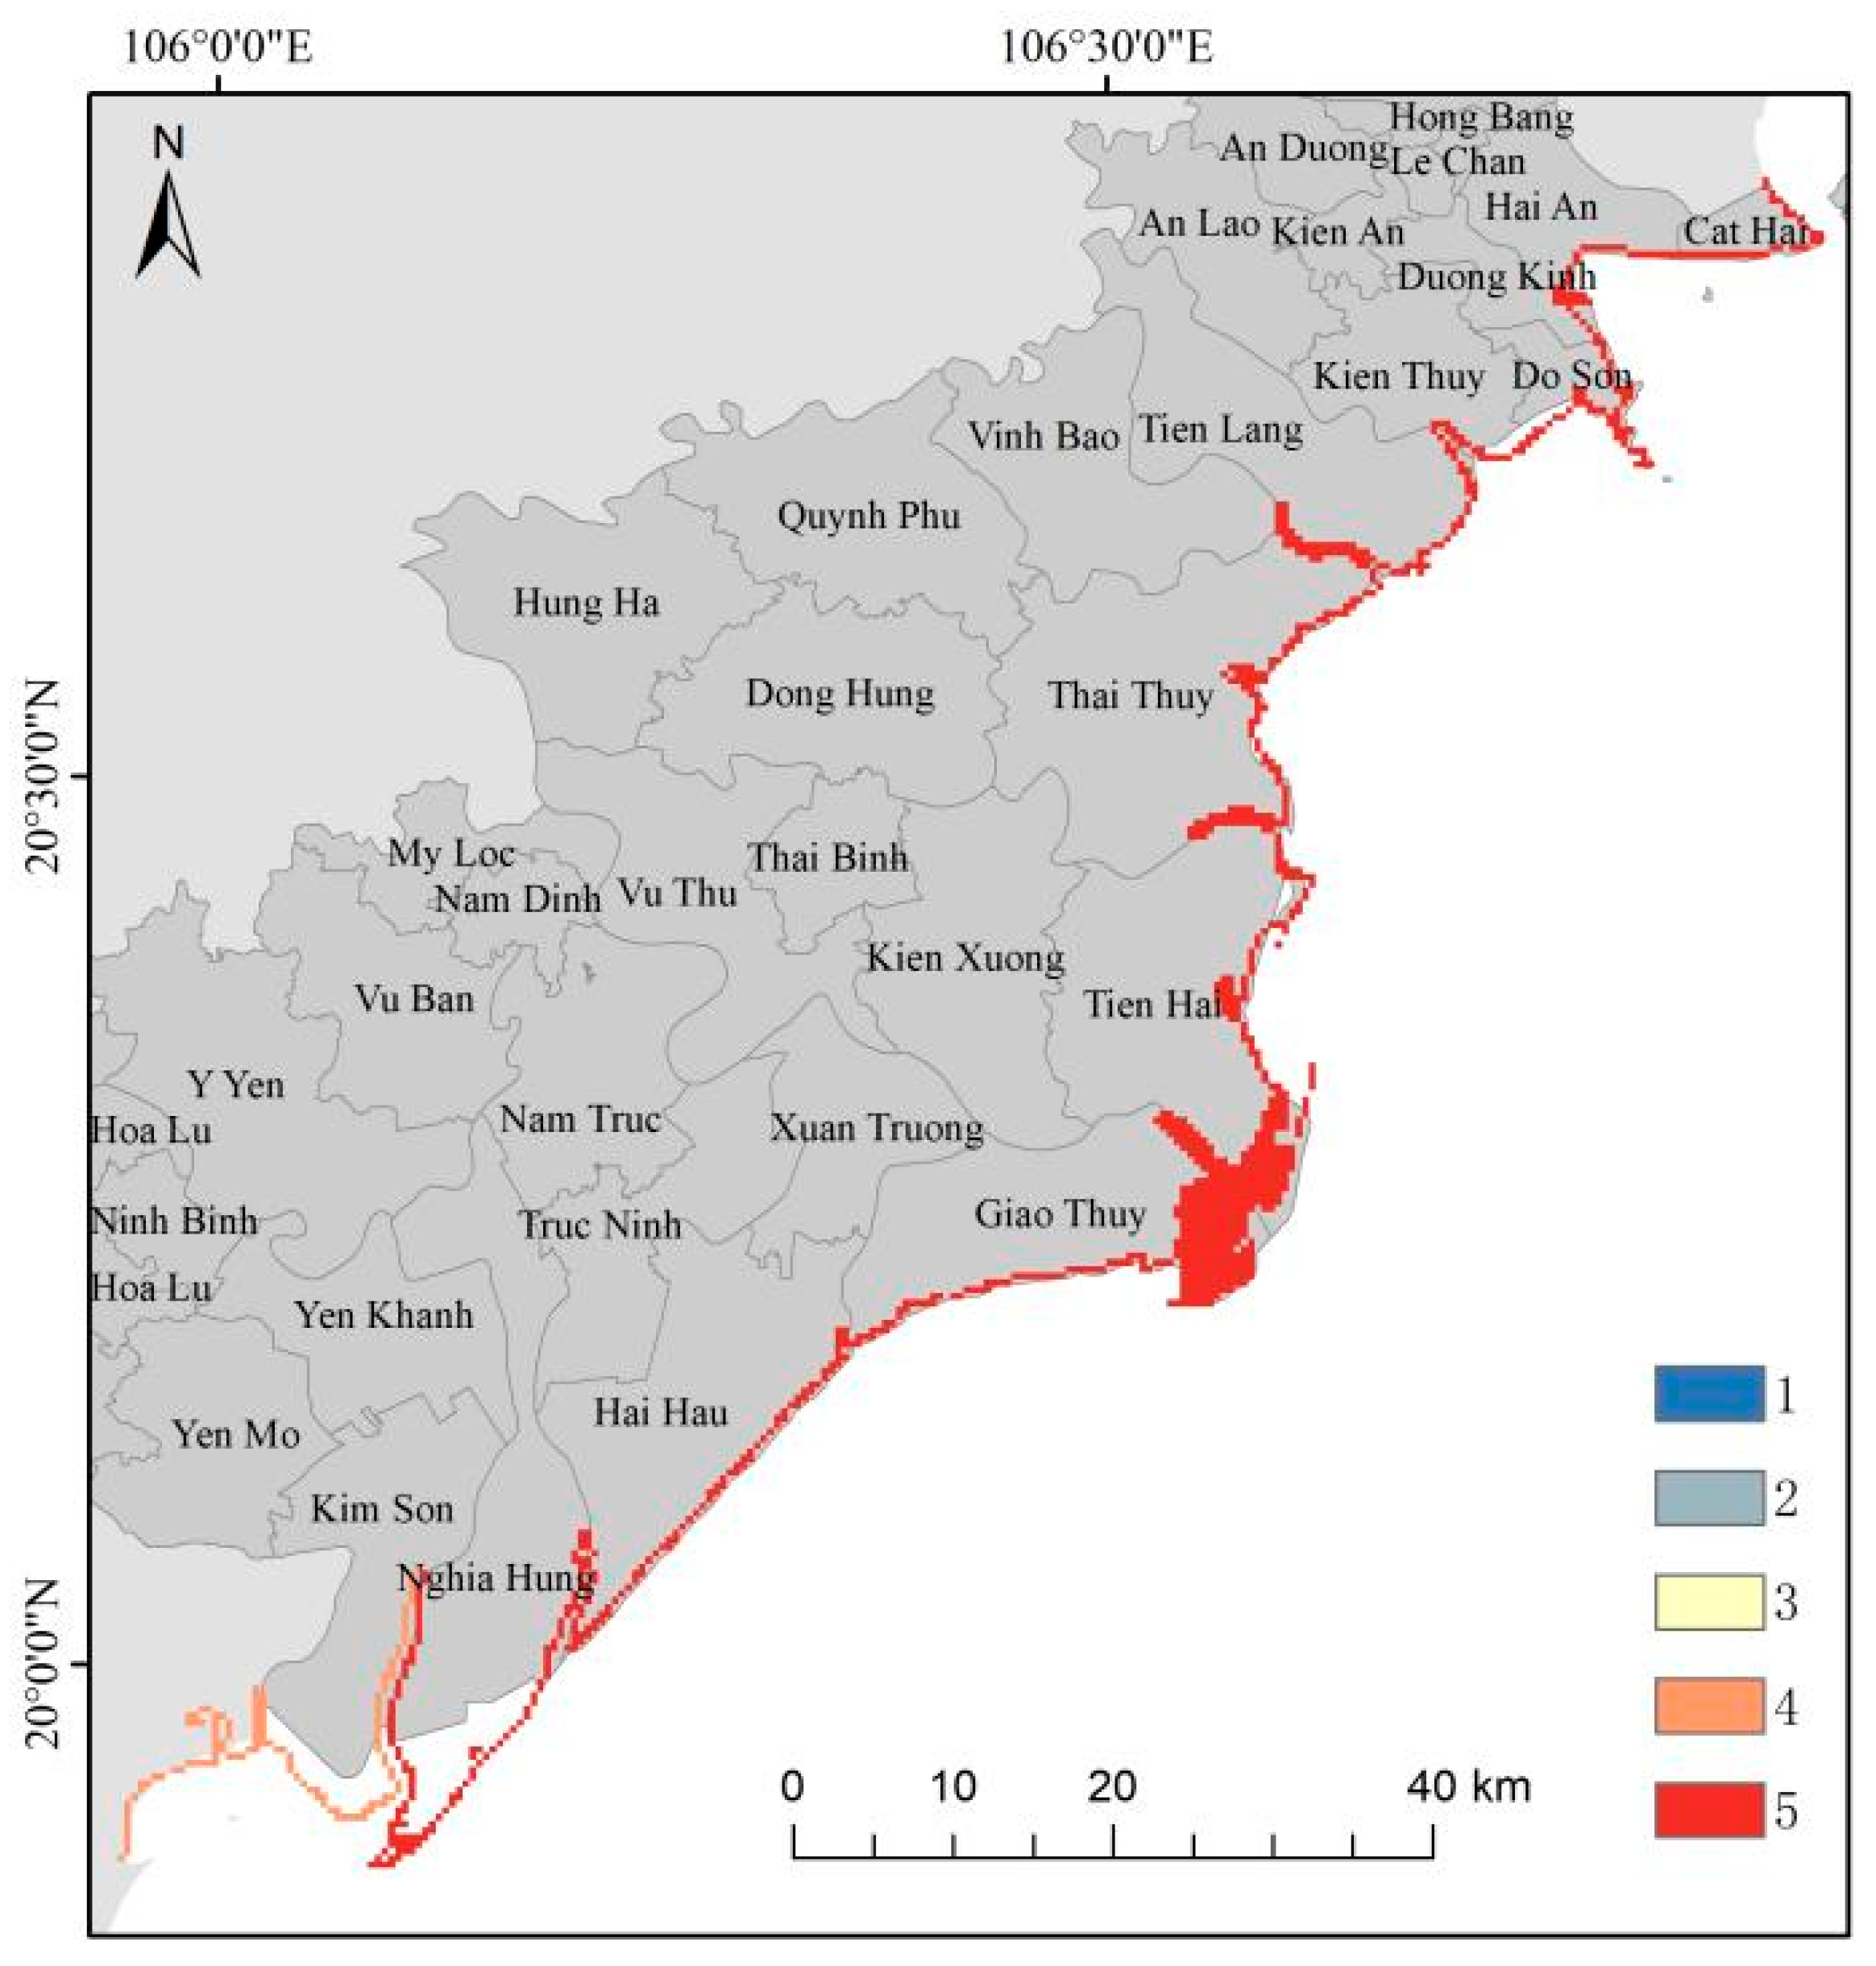
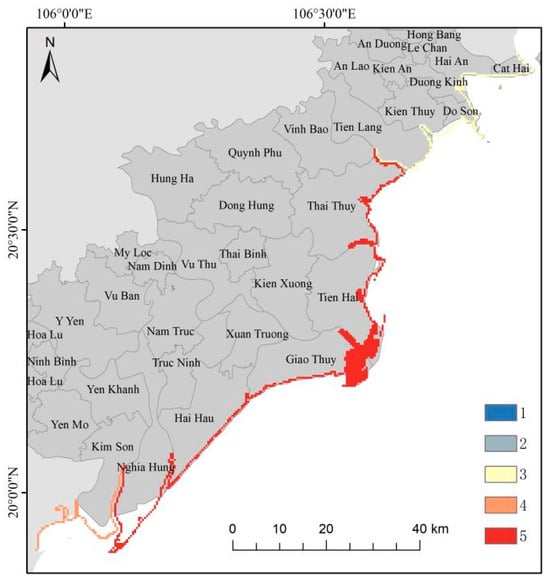
Figure A17.
Evaluation map of the government revenue of coastal erosion disaster.
Figure A17.
Evaluation map of the government revenue of coastal erosion disaster.
References
- Abuodha, P.A.O.; Woodroffe, C.D. Assessing vulnerability to sea-level rise using a coastal sensitivity index: A case study from southeast Australia. J. Coast. Conserv. 2010, 14, 189–205. [Google Scholar] [CrossRef]
- Annan, K. Message on the International Day for Disaster Reduction; United Nations: New York, NY, USA, 2003. [Google Scholar]
- Zhu, Z. Construction and Application of Coastal Erosion Vulnerability Assessment Model. Master’s Thesis, East China Normal University, Shanghai, China, 2019. [Google Scholar]
- Ferreira, A.M.; Coelho, C.; Narra, P. Coastal erosion risk assessment to discuss mitigation strategies: Barra-Vagueira, Portugal. Nat. Hazards 2021, 105, 1069–1107. [Google Scholar] [CrossRef]
- Xu, Z.; Li, Y.; Zhang, T. Research on Coastal Erosion Risk Assessment in Haizhou Bay. Mar. Dev. Manag. 2016, 33, 92–95. [Google Scholar]
- Shen, F.; Dou, S.; Pei, H.; Yu, S.; Han, X.; Chen, S. Research progress on erosion disasters and response strategies in the Great River Delta. J. Nat. Disasters 2022, 31, 12–25. [Google Scholar] [CrossRef]
- Gao, Y. Marine Geological Hazards and Zoning Prevention and Control in Hebei Province. Ocean. Inf. 2008, No. X, 13–15. (In Chinese) [Google Scholar]
- Liu, X.; Shen, F. Fuzzy comprehensive evaluation of coastal erosion vulnerability in the Yangtze River Delta. Resour. Environ. Yangtze River Basin 2010, 19, 196–200. [Google Scholar]
- Wang, Y.; Du, Y.; Huang, J.; Ma, G. Research on the Evaluation Method of Erosion Disaster on the Sandy Coast on the West Side of Liaodong Bay. J. Sch. Disaster Prev. Technol. 2016, 18, 79–86. [Google Scholar]
- Van Phach, P.; Hai, D.N.; Thanh, N.T.; Le Phuong, V.; Dong, M.D.; Anh, L.D.; Son, P.Q.; Lam, D.D.; Cuong, D.H. The Formation and Development of the RRD in the Holocene; Natural Science and Technology Press: Hanoi, Vietnam, 2018; ISBN 978-604-913. [Google Scholar]
- Lan, T.D.; Van Vuong, B.; Hai, D.N.; Thanh, T.D.; Nhon, D.H.; Van Huy, D.; Hanh, N.T.H. The Impact of Humans on the Modern Sedimentary Environment along the RRD Coast; Natural Science and Technology Press: Hanoi, Vietnam, 2018; ISBN 978-604-913-803-4. (In Vietnamese) [Google Scholar]
- World Bank. Vietnam Climate Resilience: Coastal Planning and Adaptation; World Bank: Washington, DC, USA, 2011. [Google Scholar]
- Van Vuong, B.; Ve, N.D.; Luu, N.T.M.; Hanh, N.T.H. Study on Morphological Changes and Functional Zoning for the Rational Use of the Ba Lat Estuary Region, Red River; Project Code: VAST05.06/23-24; Vietnam Academy of Science and Technology: Hanoi, Vietnam, 2024.
- Jiang, W. Analysis and Evaluation of Geological and Environmental Vulnerability on the Southern Coast of Laizhou Bay. Master’s Thesis, First Institute of Oceanography, State Oceanic Administration, Beijing, China, 2008. [Google Scholar]
- Le, T.V.H.; Nguyen, H.N.; Wolanski, E.; Tran, T.C.; Haruyama, S. The combined impact on the flooding in Vietnam’s Mekong River delta of local man-made structures, sea level rise, and dams upstream in the river catchment. Estuar. Coast. Shelf Sci. 2007, 71, 110–116. [Google Scholar] [CrossRef]
- Murali Mani, R.; Ankita, M.; Amrita, S.; Vethamony, P. Coastal vulnerability assessment of Puducherry coast, India, using the analytical hierarchical process. Nat. Hazards Earth Syst. Sci. 2013, 13, 3291–3311. [Google Scholar] [CrossRef]
- Kumar, A.A.; Kunte, P.D. Coastal vulnerability assessment for Chennai, east coast of India using geospatial techniques. Nat. Hazards 2012, 1, 853–872. [Google Scholar] [CrossRef]
- Li, M.; Zhang, R.; Liu, K. A new marine disaster assessment model combining bayesian network with information diffusion. J. Mar. Sci. Eng. 2021, 9, 640. [Google Scholar] [CrossRef]
- Tran, T.M.S.; Nguyen, T.K.C.; Le, H.L.; Tran, V.H.; Pham, T.Q.; Nguyen, T.T.V.; Pham, T.D. Current Status of Mangroves in the Context of Climate Change in Xuan Thuy National Park Buffer Zone, Nam Dinh Province, Vietnam. In Proceedings of the 10th International Conference on Asian and Pacific Coasts (APAC 2019), Hanoi, Vietnam, 25–28 September 2019; Springer: Singapore, 2020; pp. 1221–1226. [Google Scholar]
- Zhou, L. Remote Sensing Monitoring of Coastal Changes and Assessment of Coastal Vulnerability in the Gulf of Thailand. Master’s Thesis, Inner Mongolia Normal University, Hohhot, China, 2018. [Google Scholar]
- Huang, W.-P.; Ye, C.-J.; Hsu, J.-C. Forecasts of the Compound Coastal Erosion Risks Based on Time-Variant Assessment: A Case Study on Yunlin Coast, Taiwan. Sustainability 2022, 14, 14505. [Google Scholar] [CrossRef]
- Bryan, J.B.; Emrich, C.; Cutter, S.L. Erosion Hazard Vulnerability of US Coastal Counties. J. Coast. Res. 2005, 21, 932–942. [Google Scholar]
- Djouder, F.; Boutiba, M. Vulnerability Assessment of Coastal Areas to Sea Level Rise from the Physical and Socioeconomic Parameters: A Case Study from the Gulf Coast of Bejaia, Algeria. Arab. J. Geosci. 2017, 10, 299. [Google Scholar] [CrossRef]
- Yin, J. National assessment of coastal vulnerability to sea-level rise for the Chinese coast. J. Coast. Conserv. 2012, 16, 123–133. [Google Scholar] [CrossRef]
- Theocharidis, C.; Doukanari, M.; Kalogirou, E.; Christofi, D.; Mettas, C.; Kontoes, C.; Hadjimitsis, D.; Argyriou, A.V.; Eliades, M. Coastal Vulnerability Index (CVI) Assessment: Evaluating Risks Associated with Human-Made Activities along the Limassol Coastline, Cyprus. Remote Sens. 2024, 16, 3688. [Google Scholar] [CrossRef]
- Wang, C.; He, Y.; Ma, G.; Wang, W. Research on the Economic Loss Prediction and Vulnerability Risk Zoning of Coastal Erosion Disaster: A Case Study from Liaoning, China. Front. Mar. Sci. 2024, 11, 1431302. [Google Scholar] [CrossRef]
- Nguyen, T.T.; Phan, N.H. Land use changes and mangrove loss in the Red River Delta Biosphere Reserve, Vietnam. J. Coast. Conserv. 2008, 12, 127–135. [Google Scholar]
- Ve, N.D.; Fan, D.; Van Vuong, B.; Lan, T.D. Sediment budget and morphological change in the Red River Delta under increasing human interferences. Mar. Geol. 2021, 431, 106379. [Google Scholar] [CrossRef]
- Vietnam Population Density: Red River Delta (RR). 2025. Available online: https://www.ceicdata.com/en/vietnam/population-density-by-provinces/population-density-red-river-delta-rr (accessed on 26 May 2025).
- Su, Q.; Li, Z.; Li, G.; Zhu, D.; Hu, P. Coastal erosion risk assessment of Hainan Island, China. Acta Oceanol. Sin. 2023, 42, 79–90. [Google Scholar] [CrossRef]
- Hanh, H.Q.; Lebailly, P.; Ton, V.D. Dynamics of agrarian systems and the emerging agricultural land issues during economic transition period in North Vietnam: Evidence from the case of Hai Duong province. In Développement Rural et Petite Paysannerie en Asie du Sud-Est: Leçons D’expériences au Vietnam et au Cambodge = Rural Development and Small Farmers in South East Asia; Centre d’Etudes du Développement: Louvain la Neuve, France, 2015; p. 275. [Google Scholar]
- Chapman, A.D.; Darby, S.E.; Hong, H.M.; Tompkins, E.L.; Van, T.P.D. Adaptation and development trade-offs: Fluvial sediment deposition and the sustainability of rice-cropping in an Giang Province, Mekong Delta. Clim. Dev. 2016, 8, 352–362. [Google Scholar] [CrossRef]
- Yin, H.; Zhang, M.; Li, X.; Wang, H. Land subsidence and relative sea level rise: A case study of the Red River Delta, Vietnam. Environ. Earth Sci. 2020, 79, 141. [Google Scholar]
- Tanaka, S.; Tachikawa, Y.; Takara, K. Runoff characteristics and flood management of the Red River in Vietnam. Hydrol. Process. 2001, 15, 889–903. [Google Scholar]
- Dang, T.H.; Babel, M.S.; Luong, H.T.; Tripathi, N.K. Hydrological effects of climate change and land-use change in a Vietnamese catchment. J. Hydrol. 2010, 400, 198–212. [Google Scholar]
- MRC (Mekong River Commission). Adaptation to Climate Change in the Countries of the Lower Mekong Basin: Regional Synthesis Report; MRC: Swindon, UK, 2009. [Google Scholar]
- Nguyen, V.L.; Ta, T.K.O.; Tateishi, M. Late Holocene depositional environments and coastal evolution of the Mekong River Delta, Southern Vietnam. J. Asian Earth Sci. 2000, 18, 427–439. [Google Scholar] [CrossRef]
- Pham, T.T.; Maskey, S.; Van Griensven, A.; Tran, D.D. Impact of upstream hydropower development on water availability in the lower Red River basin, Vietnam. Hydrol. Res. 2018, 49, 469–486. [Google Scholar]
- Gourou, P. The Farmers in the Tonkin Delta; Tre Publishing House: Ho Chi Minh City, Vietnam, 2014; p. 700. (In Vietnamese) [Google Scholar]
- Nguyen, V.P.; Vu, V.T.; Tran, T.X. Water Resources in Vietnam; Vietnamese Institute of Meteohydrology: Hanoi, Vietnam, 2003. [Google Scholar]
- Thanh, T.D.; Saito, Y.; Huy, D.V.; Cu, N.H.; Chien, D.D. Coastal erosion in Red River Delta: Current status and response. In Mega-Deltas of Asia: Geological Evolution and Human Impact; Chen, Z.Y., Saito, Y., Goodbred, S.L., Jr., Eds.; China Ocean Press: Beijing, China, 2005; pp. 98–106. [Google Scholar]
- Hong, P.N.; San, H.T. Mangroves of Vietnam; IUCN—The World Conservation Union: Bangkok, Thailand, 1993; p. 173. Available online: https://portals.iucn.org/library/node/7084?utm_source (accessed on 26 May 2025).
- Tran, T.T.; Nguyen, V.H. Coastal vegetation and restoration efforts in the Red River Delta. Vietnam. J. Ecol. 2017, 35, 45–54. [Google Scholar]
- Vietnam Institute of Meteorology, Hydrology and Climate Change (IMHEN). Climate Change Scenarios for Vietnam; IMHEN: Hanoi, Vietnam, 2021. [Google Scholar]
- General Statistics Office of Vietnam. Statistical Yearbook of Vietnam; GSO: Hanoi, Vietnam, 2020.
- Asian Development Bank. Climate Risk Country Profile; Asian Development Bank: Manila, Philippines, 2020. [Google Scholar]
- Duc, D.M.; Nhuan, M.T.; Van Ngoi, C.; Nghi, T.; Tien, D.M.; van Weering, T.C.E.; van den Bergh, G.D. Sediment distribution and transport at the nearshore zone of the Red River delta, Northern Vietnam. J. Asian Earth Sci. 2007, 29, 558–565. [Google Scholar] [CrossRef]
- Fang, G.; Kwok, Y.K.; Yu, K.; Zhu, Y. Tidal dynamics in the Gulf of Tonkin and adjacent waters. Cont. Shelf Res. 1999, 19, 1351–1365. [Google Scholar]
- Vinh, V.D.; Thanh, T.D.; Binh, D.T.; Saito, Y. Coastal accretion and erosion in the Red River Delta and the influence of monsoon. Mar. Sci. Technol. 2009, 1 (Suppl. S1), 108–124. [Google Scholar]
- Fan, D.; Nguyen, D.V.; Su, J.; Bui, V.V.; Tran, D.L. Coastal Morphological Changes in the Red River Delta under Increasing Natural and Anthropic Stresses. Coast. Environ. Chang. Increas. Anthropog. Impacts 2019, 2, 51–71. [Google Scholar] [CrossRef]
- Van Vuong, B.; Ve, N.D.; Luu, N.T.M. Study on Changes in Sediment Supply from the Red River System and Their Impacts on the Coastal Zone of the Red River Delta over the Past 100 Years. Project Code: VAST.ĐLT.05/14-15; Vietnam Academy of Science and Technology: Hanoi, Vietnam, 2016. [Google Scholar]
- Van Vuong, B.; Fan, D.; Ve, N.D.; Lan, T.D.; Thanh, T.D.; Van Long, H.; Hanh, N.T.H. Morphological Change in the Northern Red River Delta, Vietnam. J. Ocean. Univ. China 2018, 17, 1272–1280. [Google Scholar] [CrossRef]
- Saito, Y.; Chaimanee, N.; Jarupongsakul, T.; Syvitski, J.P.M. Shrinking megadeltas in Asia: Sea-level rise and sediment reduction impacts from case study of the Chao Phraya Delta. Impr. Newsl. IGBP/IHDP Land Ocean. Interact. Coast. Zone 2007, 2, 3–9. [Google Scholar]
- Chen, C.N.; Yeh, Y.L. Evaluation of Disaster Rescue in Mountain Tribes. J. Taiwan Agric. Eng. 2010, 56, 61–70. (In Chinese) [Google Scholar]
- Lämmle, L.; Perez Filho, A.; Donadio, C.; Arienzo, M.; Ferrara, L.; Santos, C.d.J.; Souza, A.O. Anthropogenic Pressure on Hydrographic Basin and Coastal Erosion in the Delta of Paraíba do Sul River, Southeast Brazil. J. Mar. Sci. Eng. 2022, 10, 1585. [Google Scholar] [CrossRef]
- Lou, S.; Wang, H.; Cai, F. An integrated risk assessment of coastal erosion based on fuzzy set theory along Fujian coast, southeast China. Ocean. Coast. Manag. 2013, 84, 68–76. [Google Scholar]
- IPCC. IPCC Sixth Assessment Report; IPCC: Geneva, Switzerland, 2022; Available online: https://www.ipcc.ch/assessment-report/ar6/ (accessed on 26 May 2025).
- Xu, G.-H.; Liu, H.-B.; Tao, W.; Qi, H.-S. Exploration of Erosion Coastal Management and Protection Technologies to Address Climate Change. Coast. Eng. 2022, 41, 428–440. [Google Scholar]
- Rentschler, J.; de Vries Robbé, S.; Braese, J.; Nguyen, D.H.; van Ledden, M.; Pozueta Mayo, B. Resilient Shores: Vietnam’s Coastal Development Between Opportunity and Disaster Risk; World Bank: Washington, DC, USA, 2020. [Google Scholar]
- Clark, J.R. Coastal Zone Management Handbook. Lewis Publishers: Boca Raton, FL, USA, 1996. [Google Scholar]
- Muis, S.; Verlaan, M.; Winsemius, H.C.; Aerts, J.C.J.H.; Ward, P.J. A global reanalysis of storm surges and extreme sea levels. Nat. Commun. 2016, 7, 11969. [Google Scholar] [CrossRef]

Disclaimer/Publisher’s Note: The statements, opinions and data contained in all publications are solely those of the individual author(s) and contributor(s) and not of MDPI and/or the editor(s). MDPI and/or the editor(s) disclaim responsibility for any injury to people or property resulting from any ideas, methods, instructions or products referred to in the content. |
© 2025 by the authors. Licensee MDPI, Basel, Switzerland. This article is an open access article distributed under the terms and conditions of the Creative Commons Attribution (CC BY) license (https://creativecommons.org/licenses/by/4.0/).