Article

Enhancing Stream Ecosystems Through Riparian Vegetation Management

Department of Forestry and Landscape Architecture, Konkuk University, Gwangjin-Gu, Seoul 05029, Republic of Korea
*
Author to whom correspondence should be addressed.
Land 2025, 14(6), 1248; https://doi.org/10.3390/land14061248
Submission received: 28 April 2025 / Revised: 29 May 2025 / Accepted: 6 June 2025 / Published: 11 June 2025
(This article belongs to the Special Issue Blue-Green Infrastructure and Territorial Planning)

Abstract

:
Land use and land cover changes driven by urbanization and agricultural expansion have increasingly degraded the ecological health of stream ecosystems across watersheds. In Republic of Korea, the Ministry of Environment has designated riparian zones to protect water quality and preserve aquatic ecosystems and continues to implement policies for their management. Given the long-term nature of riparian zone management, providing robust scientific evidence to justify and refine these policies is imperative. In this study, we quantitatively evaluated the role of riparian vegetation on water quality and aquatic ecosystems by using Bayesian Networks. Scenarios were designed to compare the individual effects of riparian vegetation and combined effects of urban and agricultural land use changes. The results indicated that riparian vegetation positively influenced water quality and the benthic macroinvertebrate index at the sub-watershed scale. When riparian vegetation and land use factors were jointly adjusted, scenarios with high riparian vegetation coverage showed improved probabilities of good BMI scores—24.3% under highly agricultural conditions and 27.4% under highly urbanized conditions—highlighting a substantial vegetation effect, particularly in urban areas. This study provides a scientific basis for guiding future riparian restoration and management efforts.

1. Introduction

Streams, as critical components of human society and natural ecosystems, provide essential services, such as water supply, habitat for aquatic organisms, and flood regulation [1,2,3]. However, stream ecosystems have come under increasing pressure from human activities at both local and global scales [4,5,6]. Human activities, such as cultivation, urban development, land intensification, conversion, and deforestation, have drastically altered the availability and quality of water resources [7,8,9]. Anthropogenic pressures on stream ecosystems differ between urban and rural areas. In urban regions, the expansion of impervious surfaces increases stormwater runoff and facilitates the rapid inflow of high pollutant concentrations [10,11,12,13]. Point source discharges from infrastructure further degrade water quality [14]. In contrast, rural areas experience elevated nutrient loading and eutrophication due to non-point source pollution from pesticides, fertilizers, and organic matter associated with agricultural intensification [15]. Land clearing accelerates soil erosion, leading to sediment deposition and simplified stream habitats, ultimately reducing biodiversity [16,17]. Consequently, streams experience a wide range of degradation effects, including deteriorated water quality [18,19], sediment buildup in streambeds [16,20], and extreme fluctuations in flow regimes, such as frequent floods and droughts [21,22]. These changes degrade aquatic habitats [17,23] and compromise the ecological integrity of stream systems [24,25].
Riparian zones, transitional areas adjacent to streams, are critical to buffering the impacts of surrounding land uses and supporting the health of stream ecosystems. Their services include water quality protection, flood mitigation, carbon storage, and the conservation of biodiversity and aquatic habitats [26,27]. Due to their close proximity to streams, riparian zones can mitigate the adverse effects of land use within watersheds [28,29]. In developed regions, where urbanization and agricultural land use intensity lead to higher pollution levels, these zones are particularly critical to maintaining stream ecosystem health. Accordingly, previous studies have examined the ecological benefits provided by riparian vegetation in mitigating the negative impacts of urbanization and agricultural activities—particularly its role in enhancing biological and ecological water quality. Palt et al., (2023) [30] analyzed the relationship between riparian vegetation and benthic macroinvertebrates in both urban and rural settings, demonstrating that riparian vegetation alleviates stressors caused by agriculture and urbanization and significantly improves the ecological status of macroinvertebrates, especially in agriculture-dominated areas. Similarly, Tolkkinen et al., (2021) [31] reported that an increase in woody riparian buffers improved the biological and physicochemical condition of streams in agricultural landscapes. Kupilas et al., (2021) [32], in a study conducted in the Oslo Fjord catchment in Norway, compared urban streams with and without riparian vegetation and found that forested buffer zones served as critical habitats and food sources for fish, thereby increasing fish abundance in urban watersheds. In addition, numerous studies have confirmed that riparian vegetation contributes to water quality improvement and enhances the ecological integrity of stream ecosystems by reducing non-point source pollution from urban and agricultural areas, reconnecting fragmented forest networks, and moderating stream temperatures [33,34,35,36].
In Korea, the Ministry of Environment has implemented comprehensive policies for managing riparian zones, which act as vital buffers for urban stream ecosystems. These policies focus on restricting new developments, restoring previously developed areas, and enhancing riparian vegetation to improve water quality, support aquatic biodiversity, and enhance the ecological health of urban streams. As a result, enhancing riparian vegetation through policies, regulations, and legislation has become a key strategy for local and national authorities to maintain water quality and ensure the ecological integrity of streams in developed watersheds [34]. International examples, such as the Clean Water Act in the United States and the EU Water Framework Directive, further emphasize the policy importance of riparian buffers. These frameworks promote riparian restoration and land use control as legal instruments for improving watershed health and biodiversity conservation [37,38]. Despite this global recognition, the majority of existing research has focused primarily on the quantity or presence of riparian vegetation. However, recent studies point to the necessity of examining how land use composition within riparian zones modulates these benefits [39,40]. For instance, in urban watersheds like São Paulo, impervious cover and untreated wastewater overwhelmed riparian buffers’ effectiveness [41], while in Patagonian agricultural regions, extensive pesticide and fertilizer application reduced buffer functionality despite their presence [42].
Traditional methods often oversimplify ecological dynamics and fail to capture key nonlinear interactions and spatial variability essential to understanding ecosystem responses [43,44,45]. In contrast, Bayesian Networks (BNs) can flexibly model complex, conditional relationships with probabilistic uncertainty, making them ideal for environmental systems with multiple interacting stressors [46,47,48]. For example, Gericke et al., (2020) [49] evaluated multiple land use scenarios—such as “riparian buffer expansion” and “agricultural management”—to simulate water quality outcomes. Similarly, Sperotto et al., (2019) [50] predicted pollutant flows in response to urban development by using a scenario-based BN. These tools allow planners to test and optimize policy strategies by simulating how land cover changes influence aquatic indicators under uncertain or competing conditions.
Therefore, this study estimated a BN model to evaluate the effects of riparian land uses and land covers on stream ecosystems by using water quality parameters and biological indicators, with a focus on the role of riparian vegetation. Especially, this study examined how stream ecosystems respond to different scenarios of riparian vegetation. Securing vegetated areas within riparian zones is a widely adopted strategy for preserving water quality and the biological integrity of streams. However, in many cases, such strategies are developed without sufficient consideration of the optimal locations for riparian vegetation. Given that riparian zones are often under the greatest pressure precisely where their function is most needed, such as highly urbanized or agriculturally intensive landscapes, understanding the variability in effectiveness across land use compositions becomes crucial. The findings of this study can provide valuable insights for policymakers, stream managers, and land use planners to develop more optimized strategies for riparian vegetation management.

2. Materials and Methods
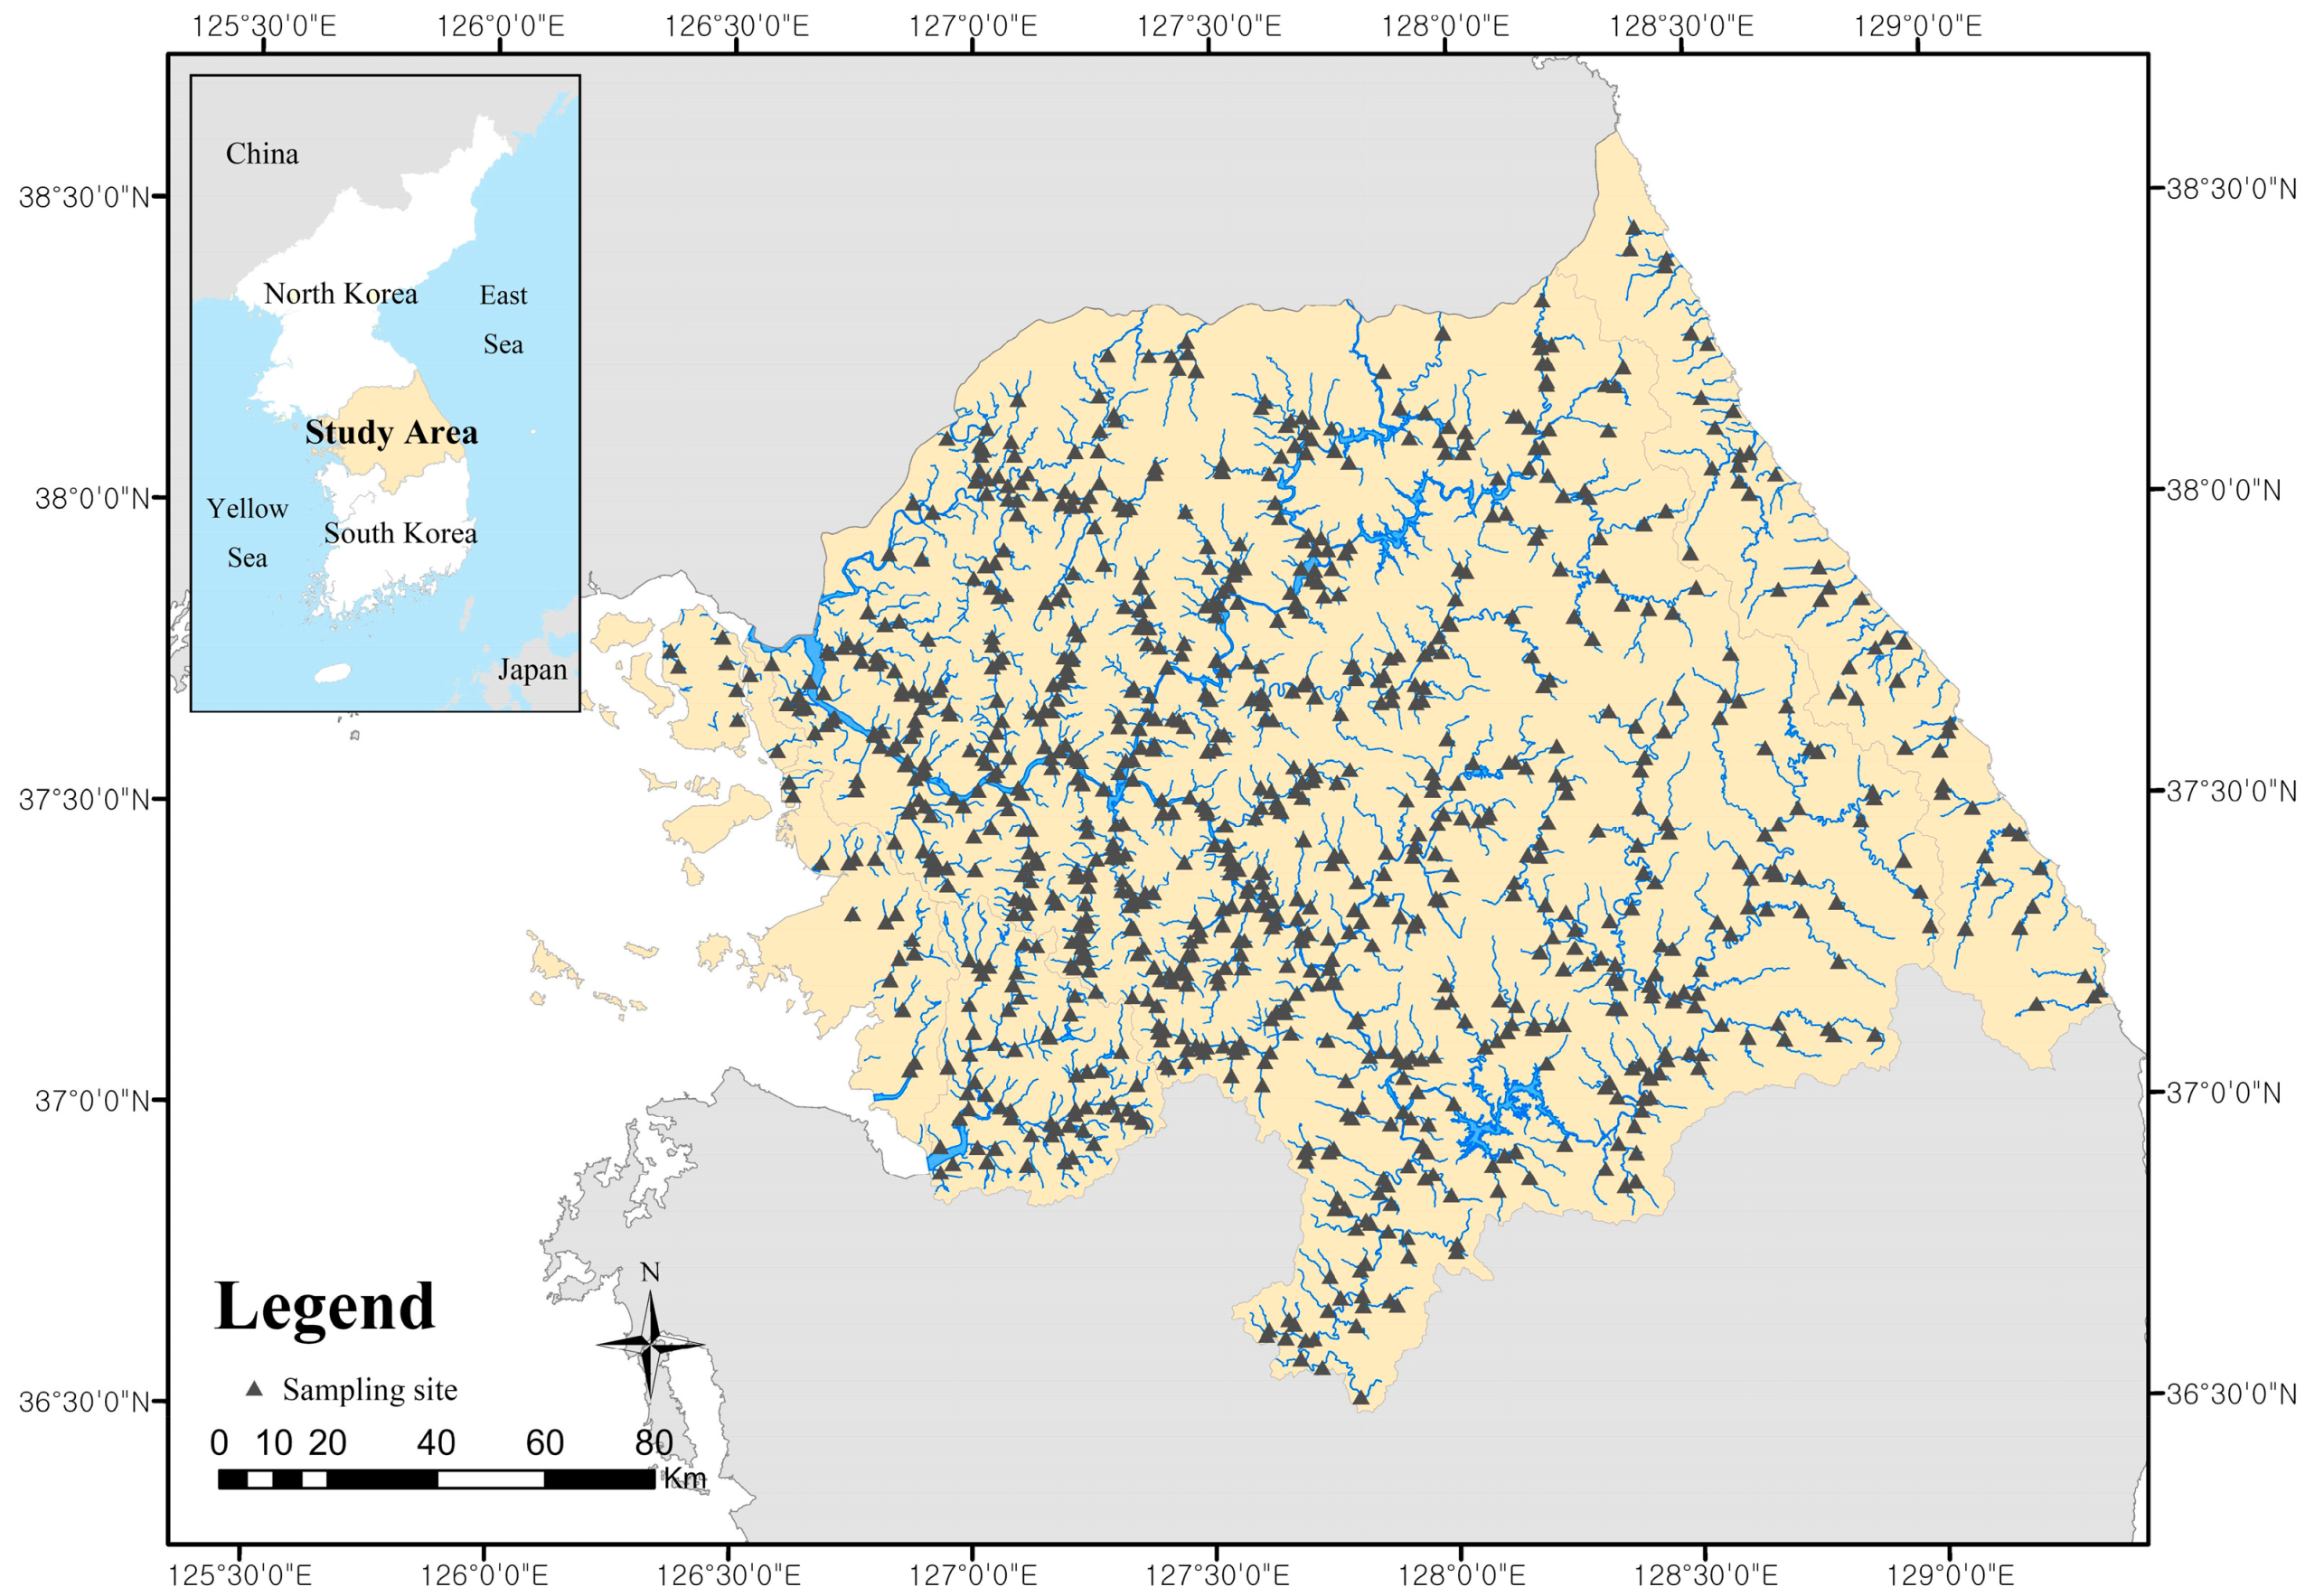
2.1. Study Area

The Korean Ministry of Environment (MOE) has designated four National Watershed Management Regions (NWMRs) to support integrated river basin management. This hierarchical framework enables the development of comprehensive national water management plans, facilitates long-term river monitoring, and establishes a legally grounded system for sustainable water governance. This study focused on the Han River NWMR, which is the largest watershed in Korea, covering an area of 41,947 km2 (Figure 1). It encompasses highly developed and cultivated areas, including numerous cities of varying sizes, notably Seoul, the capital of Republic of Korea (Han River Basin Environmental Office, 2019) [51]. From 2016 to 2020, the average annual temperature and the average annual rainfall in the study areas were 12.7 °C and 936.14 mm, respectively (Meteorological Administration, https://data.kma.go.kr/cmmn/main.do, accessed on 28 April 2025). The study area belongs to a typical monsoon climate zone with dry seasons in spring (March–May) and fall (September–November) and the wet season in summer (June–August). Republic of Korea is in a monsoon climate zone with strong seasonality, receiving over half of its annual rainfall in just a few months. This intense, short-term rainfall causes rapid runoff, increasing pollutant inflow from domestic wastewater, agricultural chemicals, and industrial effluents. Consequently, turbidity and nutrient levels rise, oxygen decreases, and eutrophication worsens, degrading benthic habitats and disrupting stream ecosystem balance [52,53].
The Han River, located within the study area, is one of Korea’s major rivers, flowing through the central region of the Korean Peninsula. The river is fed by two main tributaries, the South Han River and the North Han River, which originate in the eastern mountainous areas and flow westward through the densely urbanized regions of Republic of Korea. The Han River is the main drinking water source for approximately 26 million people, half of the total population of Korea. However, because of urbanization, the study area has a high population density and non-point sources of pollution.

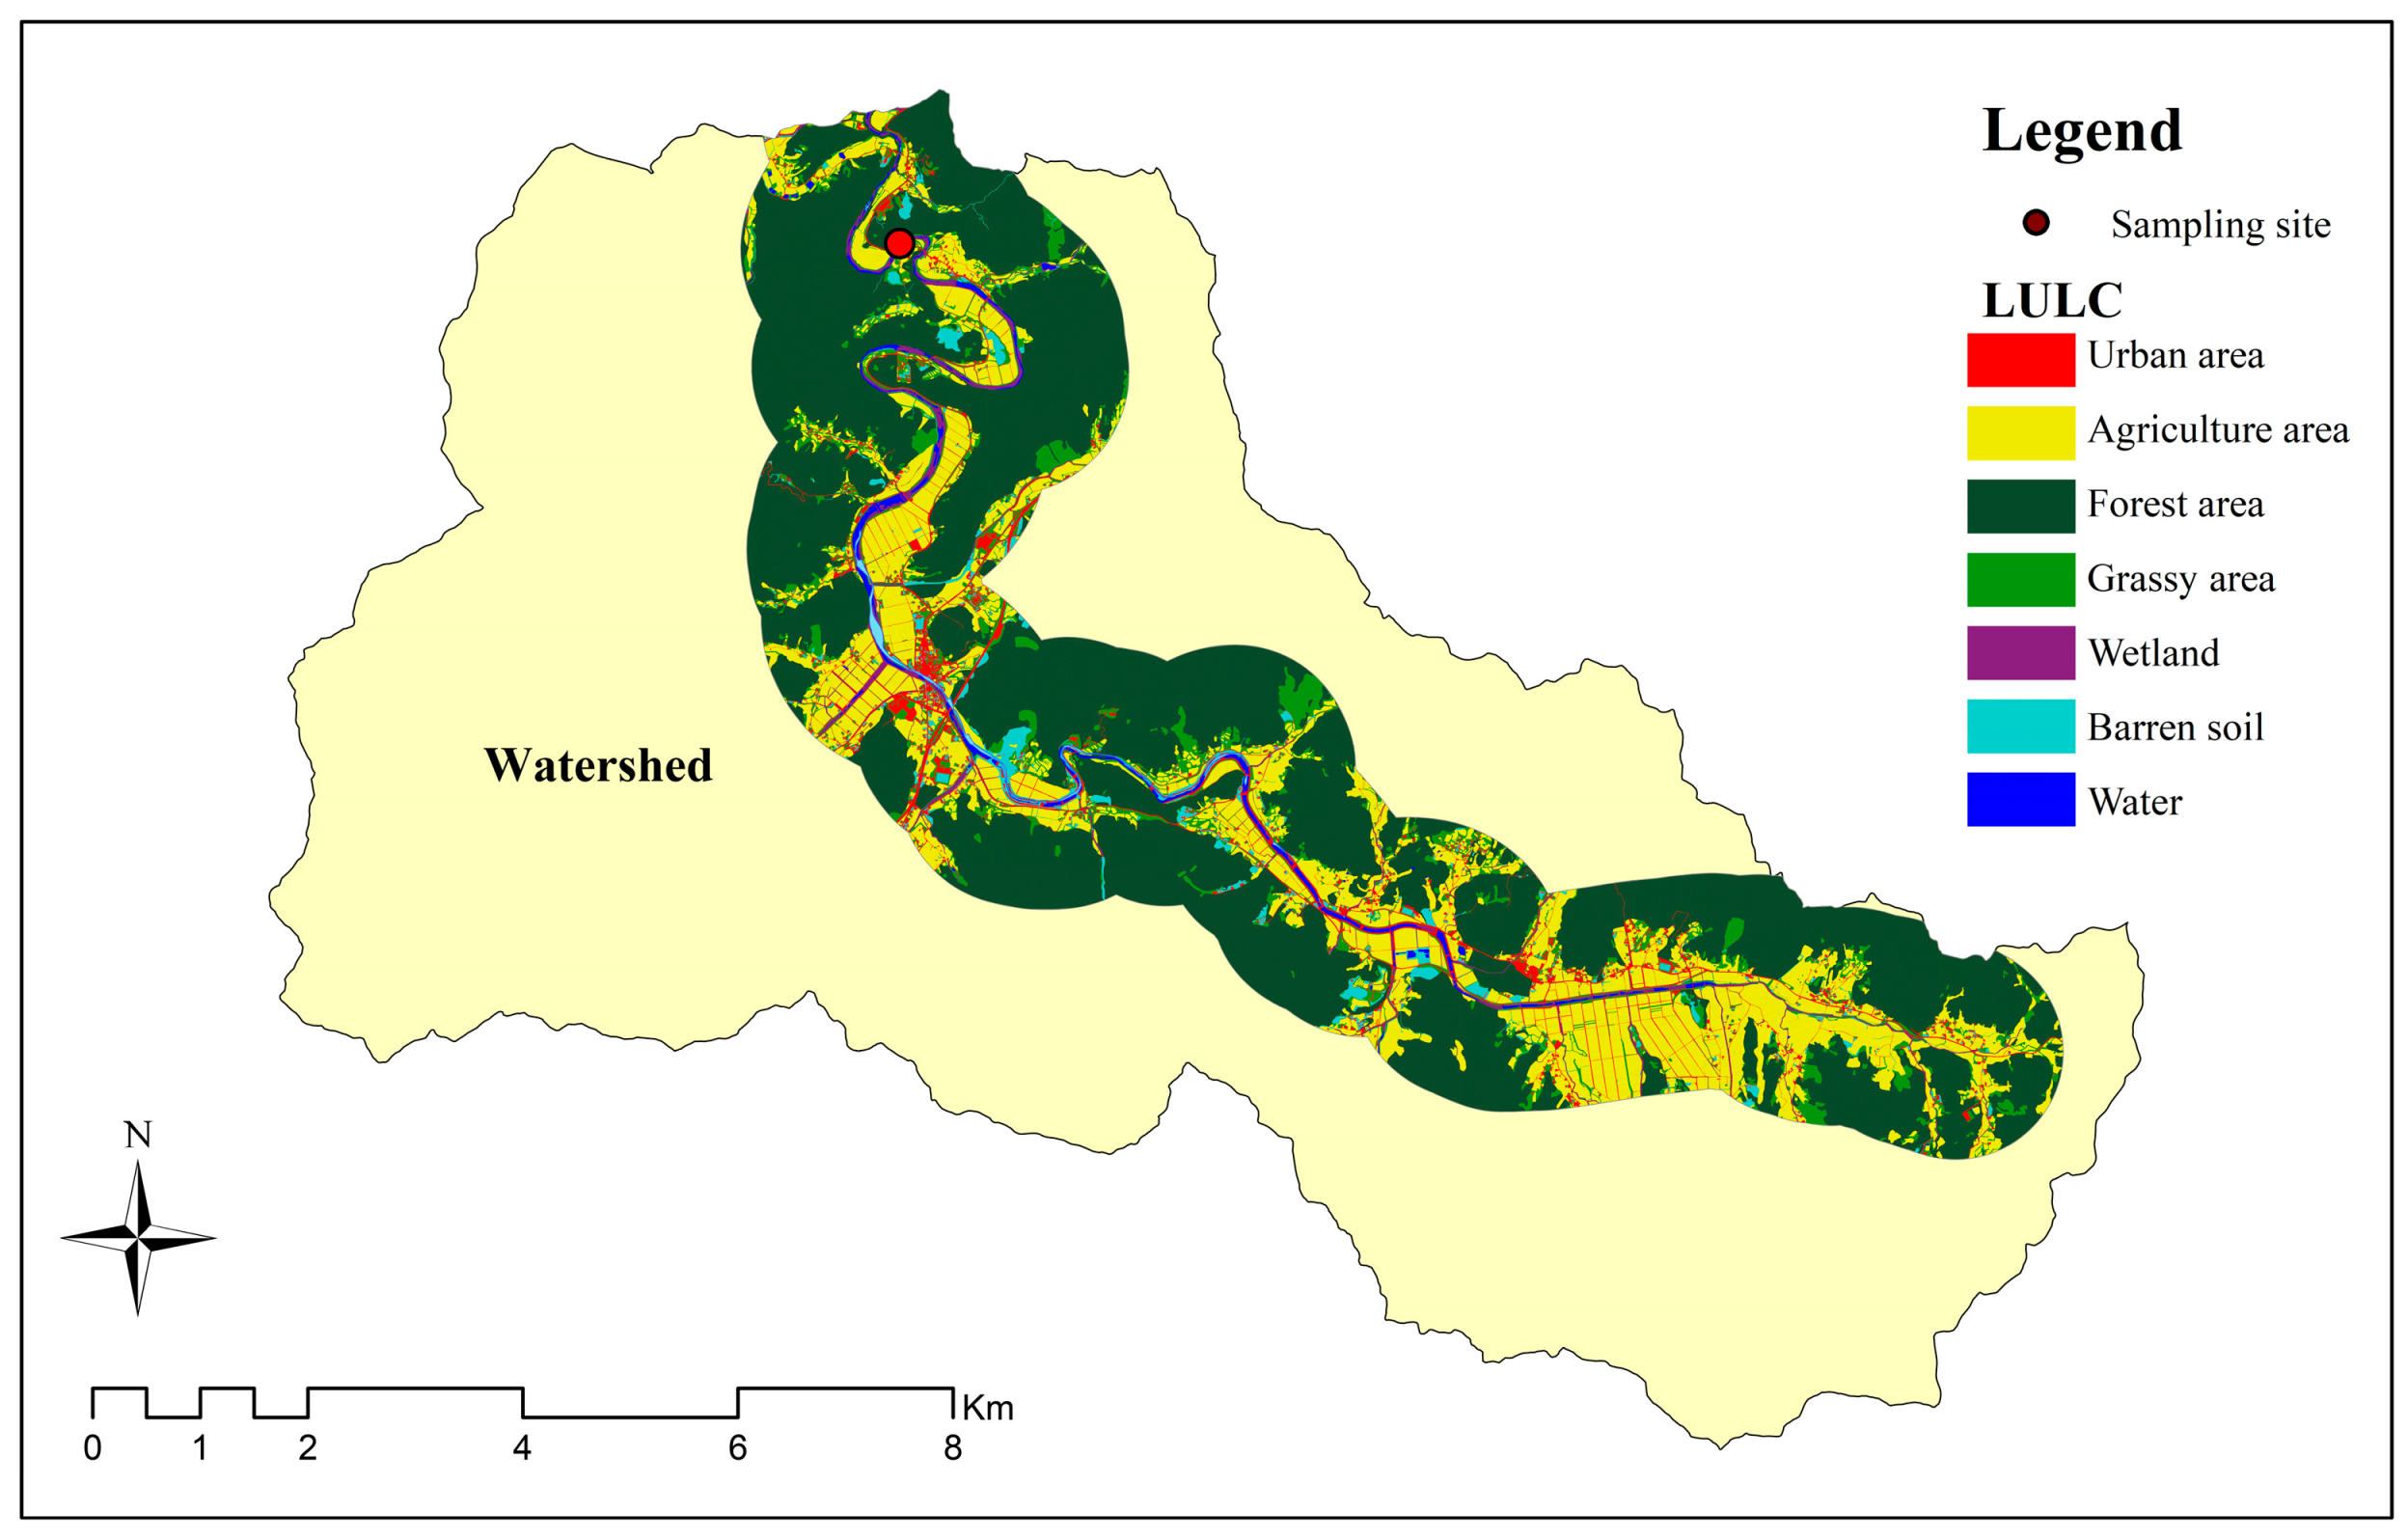
2.2. Stream Monitoring Data and Riparian Zones

Under the National Aquatic Ecology Monitoring Program (NAEMP), the Korean Ministry of Environment (MOE) monitors water quality, the ecological integrity of streams (e.g., diatom, benthic macroinvertebrate, and fish), and the stream environment (e.g., water flow speed, substrate, geomorphological characteristics, and land uses in flood plain). The NAEMP releases annual monitoring reports and datasets which are widely used in stream and watershed management by local and national authorities (NIER, 2022, https://water.nier.go.kr, accessed on 28 April 2025). This study investigated three water quality parameters, namely, Biological Oxygen Demand (BOD), total nitrogen (TN), and total phosphorus (TP), and the benthic macroinvertebrate index (BMI) in the Han River NWMR (862 sampling sites) from 2019 to 2021. The water quality indicators were chosen as they are key indicators of organic and nutrient pollution in aquatic ecosystems, and benthic macroinvertebrates were selected because of their sensitivity to environmental changes, making them reliable indicators of long-term ecological conditions. The BMI was developed based on the method by Zelinka and Marvan (1961) [54] and significantly modified to reflect the characteristics of streams in Korea [55,56]. The indicator, ranging from 0 to 100, is sensitive to the richness, frequency, and ecological resistance of various benthic macroinvertebrate species [56].
Although regulations on riparian zone width vary, the Korean Ministry of Environment (MOE) defines riparian zones as areas within 1 km of streamlines. While the legal definition of riparian zones—stated in the Act on the Improvement of Water Quality and Support for Residents of the Han River Basin (Act No. 20172, 30 January 2024)—applies only to specific stretches of the Han River Basin (e.g., from the Paldang Dam to the Jojeongji Dam in Chungju, the Bukhan River, and the Gyeongan Stream), this study applied a uniform 1 km buffer to the entire basin to ensure spatial consistency in analysis. Additionally, the riparian zone for each sampling point was defined by using both longitudinal and lateral boundaries. The longitudinal extent was delineated by the watershed boundary associated with each point, regardless of the upstream or downstream direction. Laterally, the riparian zone extended 1 km from each side of the stream, resulting in a total width of 2 km (Figure 2). To compute the proportion of land use and land cover (LULC) areas within riparian zones, 1 km buffer polygons were created from the national stream shapefile for all sampling sites in the study area by using ArcMap 10.6. In this study, riparian vegetation was defined by using the LULC classification provided by the Korean Ministry of Environment. Specifically, land cover types categorized as forest and grassy were considered riparian vegetation. Although the water quality and biological indicator data span the period from 2019 to 2021, the 2021 LULC data were applied across all years. This approach was based on the assumption that there were no substantial changes in riparian LULC during this period, enabling the use of the most recent dataset to ensure spatial and temporal consistency in the analysis. These riparian zones were spatially matched to the sub-watersheds influencing each sampling site to ensure alignment with the hydrological context, and the proportion of each LULC type within the riparian zones was calculated for each sampling site. This process resulted in 746 valid datasets out of the initial 862 sampling sites in the study area, and 116 sampling sites were excluded from the dataset because of missing LULC, water quality parameters, or biological indicator values.

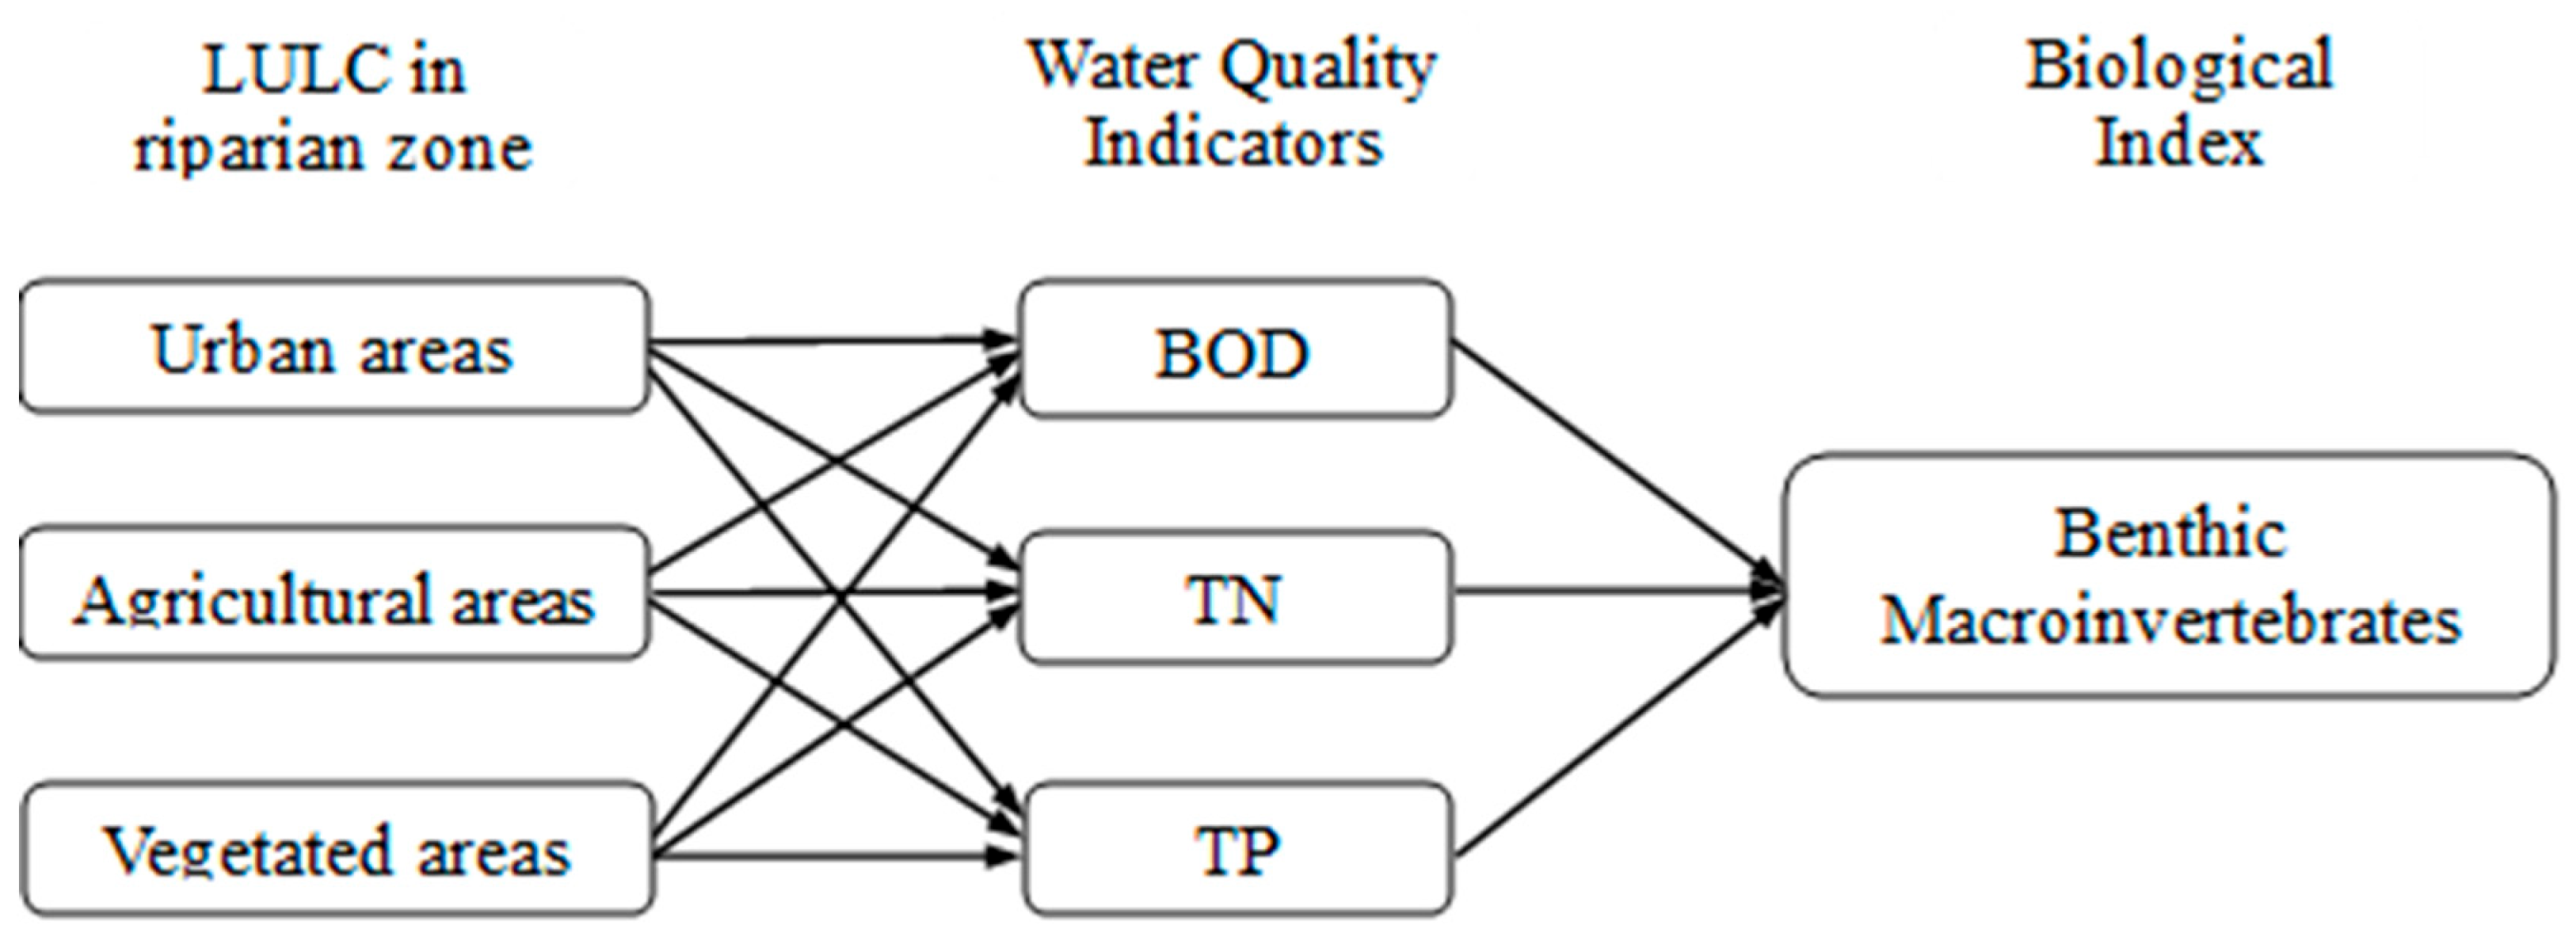
2.3. Estimation of Bayesian Network (BN) Models

BN models use conditional probabilities to represent the relationships between random variables that affect the outcomes. This model consists of two components: a directed acyclic graph (DAG) and a conditional probability table (CPT). The DAG defines interrelationships between the variables in a network, with each node representing the probability of a possible state. Based on Bayes’ theorem, the probability distribution for the states of a particular node “x” depends on the realized states of its parent nodes [57]. The CPT quantifies the strength of the relationships between variables [58,59,60].
To estimate the BN model, we used the Netica software (Version 7.01) tool developed by Norsys (Norsys Software Corp., Vancouver, BC, Canada, https://www.norsys.com/tutorials/netica/nt_toc_A.htm, accessed on 28 April 2025). The discretization of variables is a necessary process when estimating BN models because BNs typically operate with discrete variables, whereas real-world data often contain continuous values [61]. We discretized the observed variables into two categories, “above” and “below,” based on their mean values and defined two corresponding scenarios: “high” and “low.” Parameter learning in the BN was performed to calculate the CPT for each node [62]. The Netica program offers two algorithms for BN learning, depending on the presence of latent variables: the Expectation Maximization algorithm for models with latent variables and the Gradient algorithm for models without latent variables [63,64]. In this study, we used the Gradient algorithm because the model did not include any latent variables.
The BN model, shown in Figure 3, includes three major LULC types in riparian zones—urban, agricultural, and vegetated—that directly influence water quality. The model uses three water quality indicators (BOD, TN, and TP) that affect the BMI. This BN model visually represents the causal relationships among variables, providing a framework for predicting stream biological conditions based on the effects of LULC on water quality. This model also offers insights for optimizing riparian land use for effective environmental management and policymaking.

2.4. Scenario-Based Analysis of Riparian Zone Management

In this study, scenarios were developed to estimate the changes in stream ecosystems in different riparian vegetation management scenarios. The scenario approach can significantly contribute to decision making by evaluating changes in variables of interest (e.g., water quality and biological indicators) based on resource management scenarios (e.g., land use and riparian vegetation). By comparing the current management plan (i.e., current scenario) with alternative scenarios, changes in ecological conditions in each scenario can be estimated. In addition, we analyzed the ecosystem changes through scenario predictions, assessing both the individual effects of vegetation changes in the riparian zones and the combined effects resulting from simultaneous changes in vegetation and LULC. In this study, we considered two LULC scenarios comparable to the current state, namely, “high vegetation” and “low vegetation”, which represent an increase or decrease in riparian vegetation, respectively. For each scenario, a specific node state was set to 100% probability to perform model simulations. In the scenario, when the state of a specific node is fixed at 100%, other nodes within the same parent node maintain their previously learned data distributions. This approach aimed to analyze how riparian vegetation, whether high or low, affects stream ecosystems in urban and agricultural streams.

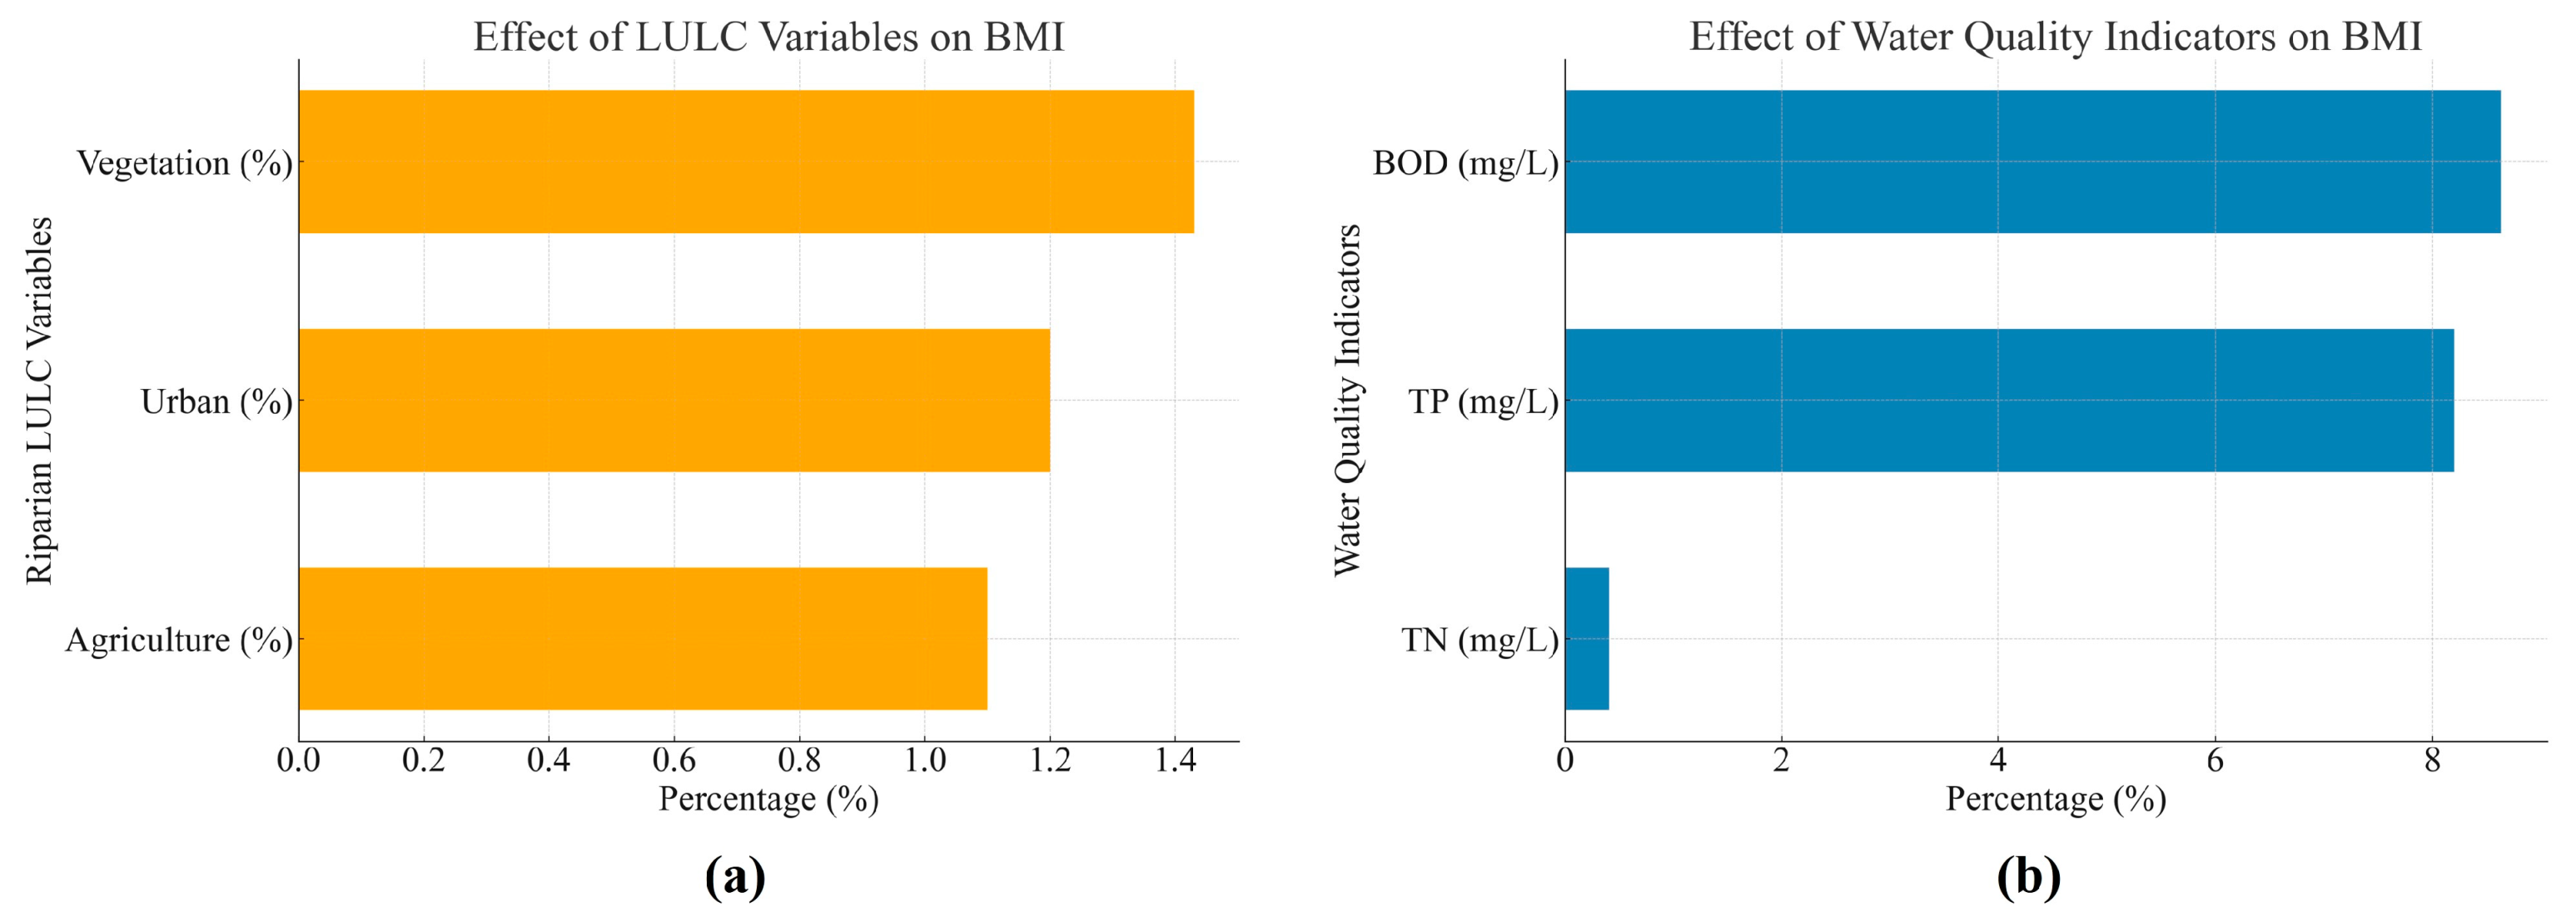
2.5. Sensitivity Analysis and Model Evaluation in BNs

Sensitivity analysis is used to evaluate the effect of changes in input variables on the output of a system or model. This approach helps in understanding model behavior and identifying key variables influencing the results. In environmental and ecological modeling, it is used to assess the sensitivity of environmental variables in predicting outcomes such as pollution levels or ecology [65,66]. In BNs, sensitivity analysis evaluates the impact of higher-order variables (e.g., biological index) by analyzing how changes in the probability or state of variables (e.g., riparian zone LULC and water quality index) influence the overall probability distribution of the network [62,67,68,69]. In addition, the sphericity payoff (SP) is a metric to evaluate the accuracy of a BN model by accounting for prediction uncertainty [70,71]. The SP ranges from 0 to 1, where values closer to 1 indicate higher model accuracy.

3. Results

3.1. Descriptive Statistics

Among the descriptive statistics for each variable (Table 1), riparian LULC proportions exhibited considerable variability. The average urban land cover ratio was 11.50% (±14.57), indicating substantial regional differences in the degree of urbanization. Urban areas ranged from a minimum of 0.19% to a maximum of 89.43%, suggesting that some riparian zones were almost entirely urbanized. The average proportion of agricultural land was 19.28% (±15.99), also reflecting a wide distribution of data. The minimum value of 0.00% indicates areas with no agricultural activity, while the maximum value of 83.71% highlights zones dominated by intensive farming. Vegetation accounted for the highest average proportion at 50.38% (±25.82), with values ranging from 0.00 to 96.48%, suggesting substantial spatial variation in vegetation coverage across sites.
Regarding water quality and biological indicators related to stream conditions, the average BOD concentration was 2.54 mg/L (±1.7), indicating significant variation in organic pollution. TN averaged 2.72 mg/L (±1.9), with values ranging from 0.2 to 19.1 mg/L, reflecting high variability in nitrogen levels. TP had a relatively low mean of 0.04 mg/L (±0.05) but ranged from 0.01 to 0.56 mg/L, indicating localized phosphorus enrichment. The BMI averaged 70.5 (±21.3), ranging from 15.1 to 97.6, indicating substantial regional differences in stream ecological health.

3.2. Estimated Bayesian Network Model and Model Performance

The LULC and water quality variables were discretized into two categories, less than average and more than average, based on their respective mean values. For the BMI, the target variable, the five grades defined by the Korean Ministry of Environment were grouped into two categories: grades A and B (non-damaged) and grades C, D, and E (damaged). The low category (0–65) included grades C, D, and E, while the high category (65–100) included grades A and B. The ranges for each variable state are shown in Table 2.
The Bayesian model included seven nodes, with the BMI defined as the target variable. The model demonstrated strong predictive performance, achieving an SP of 0.82. This SP value indicates the model’s accuracy under posterior inference, evaluated by using observed case inputs. The BN-predicted outcomes under current conditions are presented in Figure 4. This initial model serves as a baseline scenario for assessing the influence of various factors on the BMI. Additionally, the model captures the probabilistic relationships between riparian land use types (urban, agricultural, and vegetated), key water quality indicators (BOD, TN, and TP), and the benthic macroinvertebrate index (BMI). This baseline configuration enables the scenario-based prediction of BMI responses to changes in land use patterns.
The sensitivity analysis of the BN model revealed that among the water quality indicators, BOD and TP had the greatest influence on the BMI, accounting for 8.8% and 8.1% of the variance reduction, respectively. In contrast, TN showed a minimal effect, contributing less than 0.5% to the variance reduction. Among the riparian land use variables, riparian vegetation exhibited the highest importance (1.35%), followed by urban (1.2%) and agricultural (1.0%) land uses. These results suggest that BOD and TP are critical stressors that strongly affect benthic macroinvertebrate health, while riparian vegetation plays a significant supporting role in mitigating ecological degradation (Figure 5).

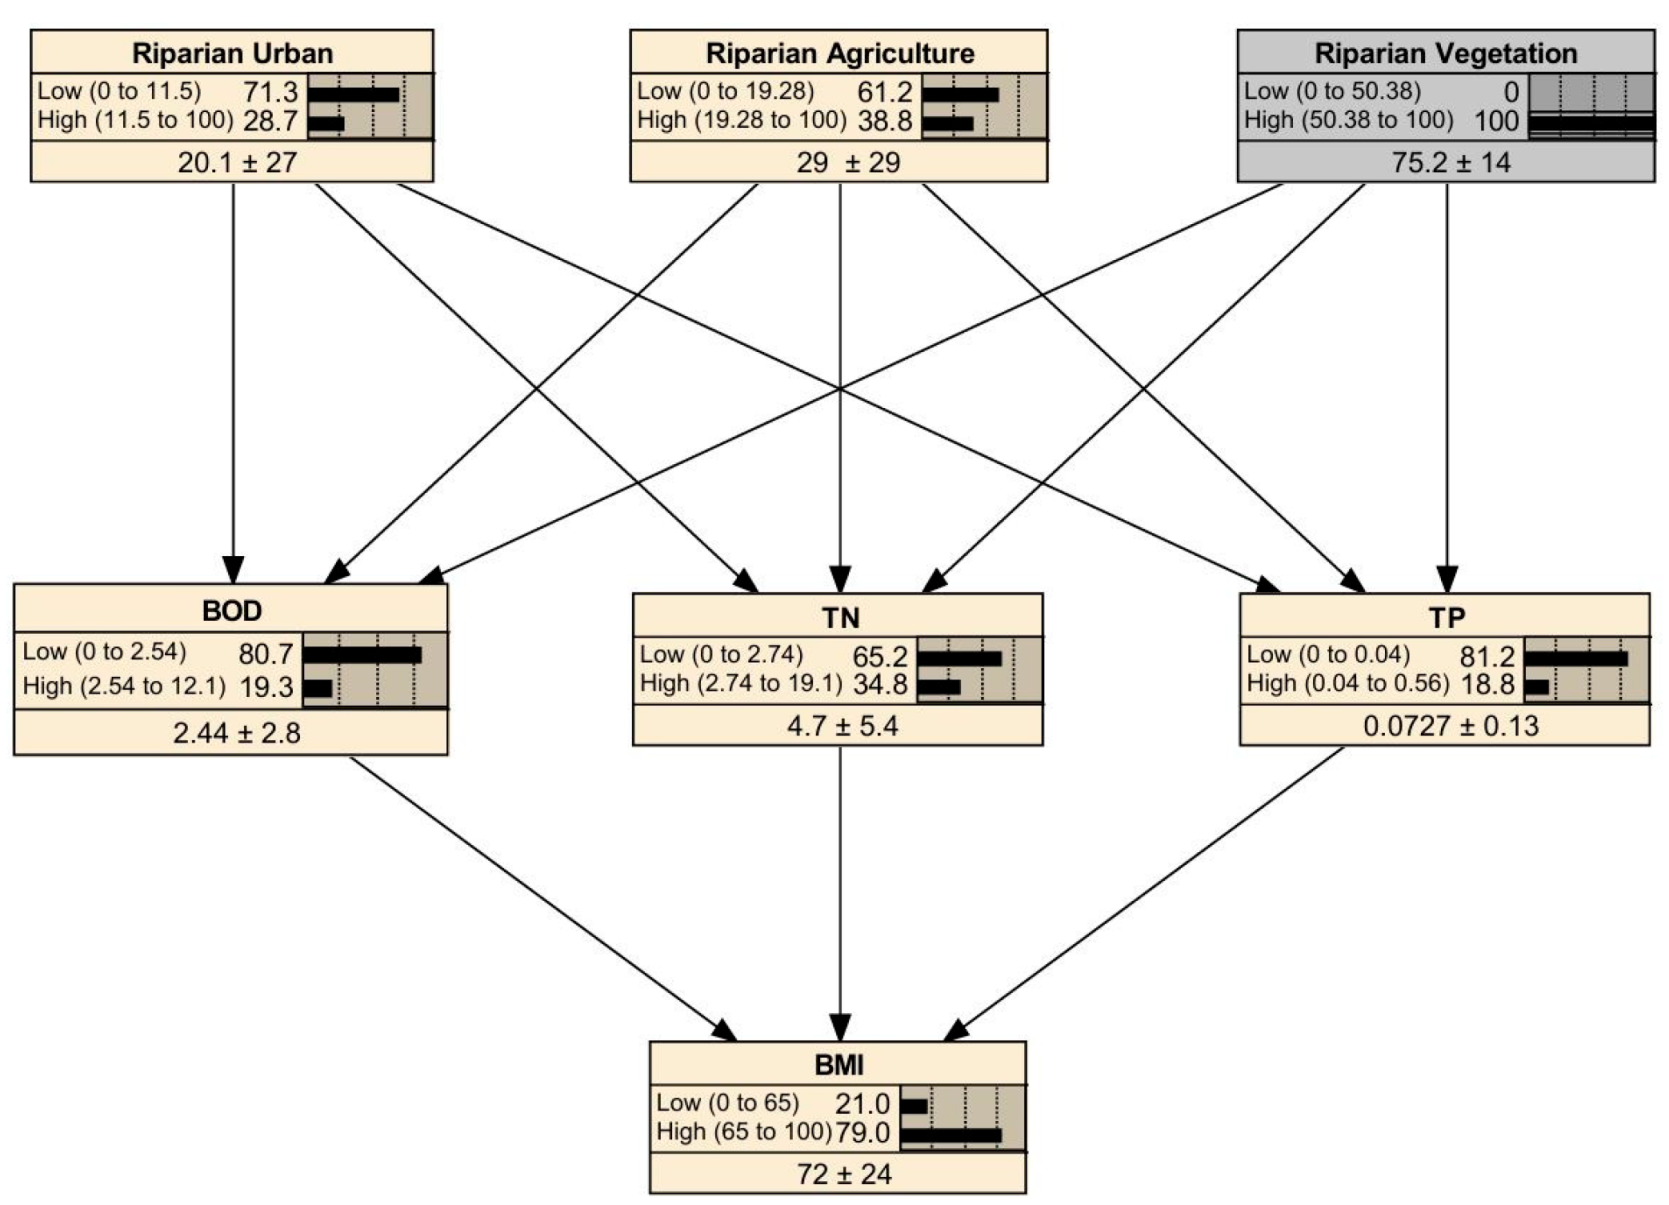
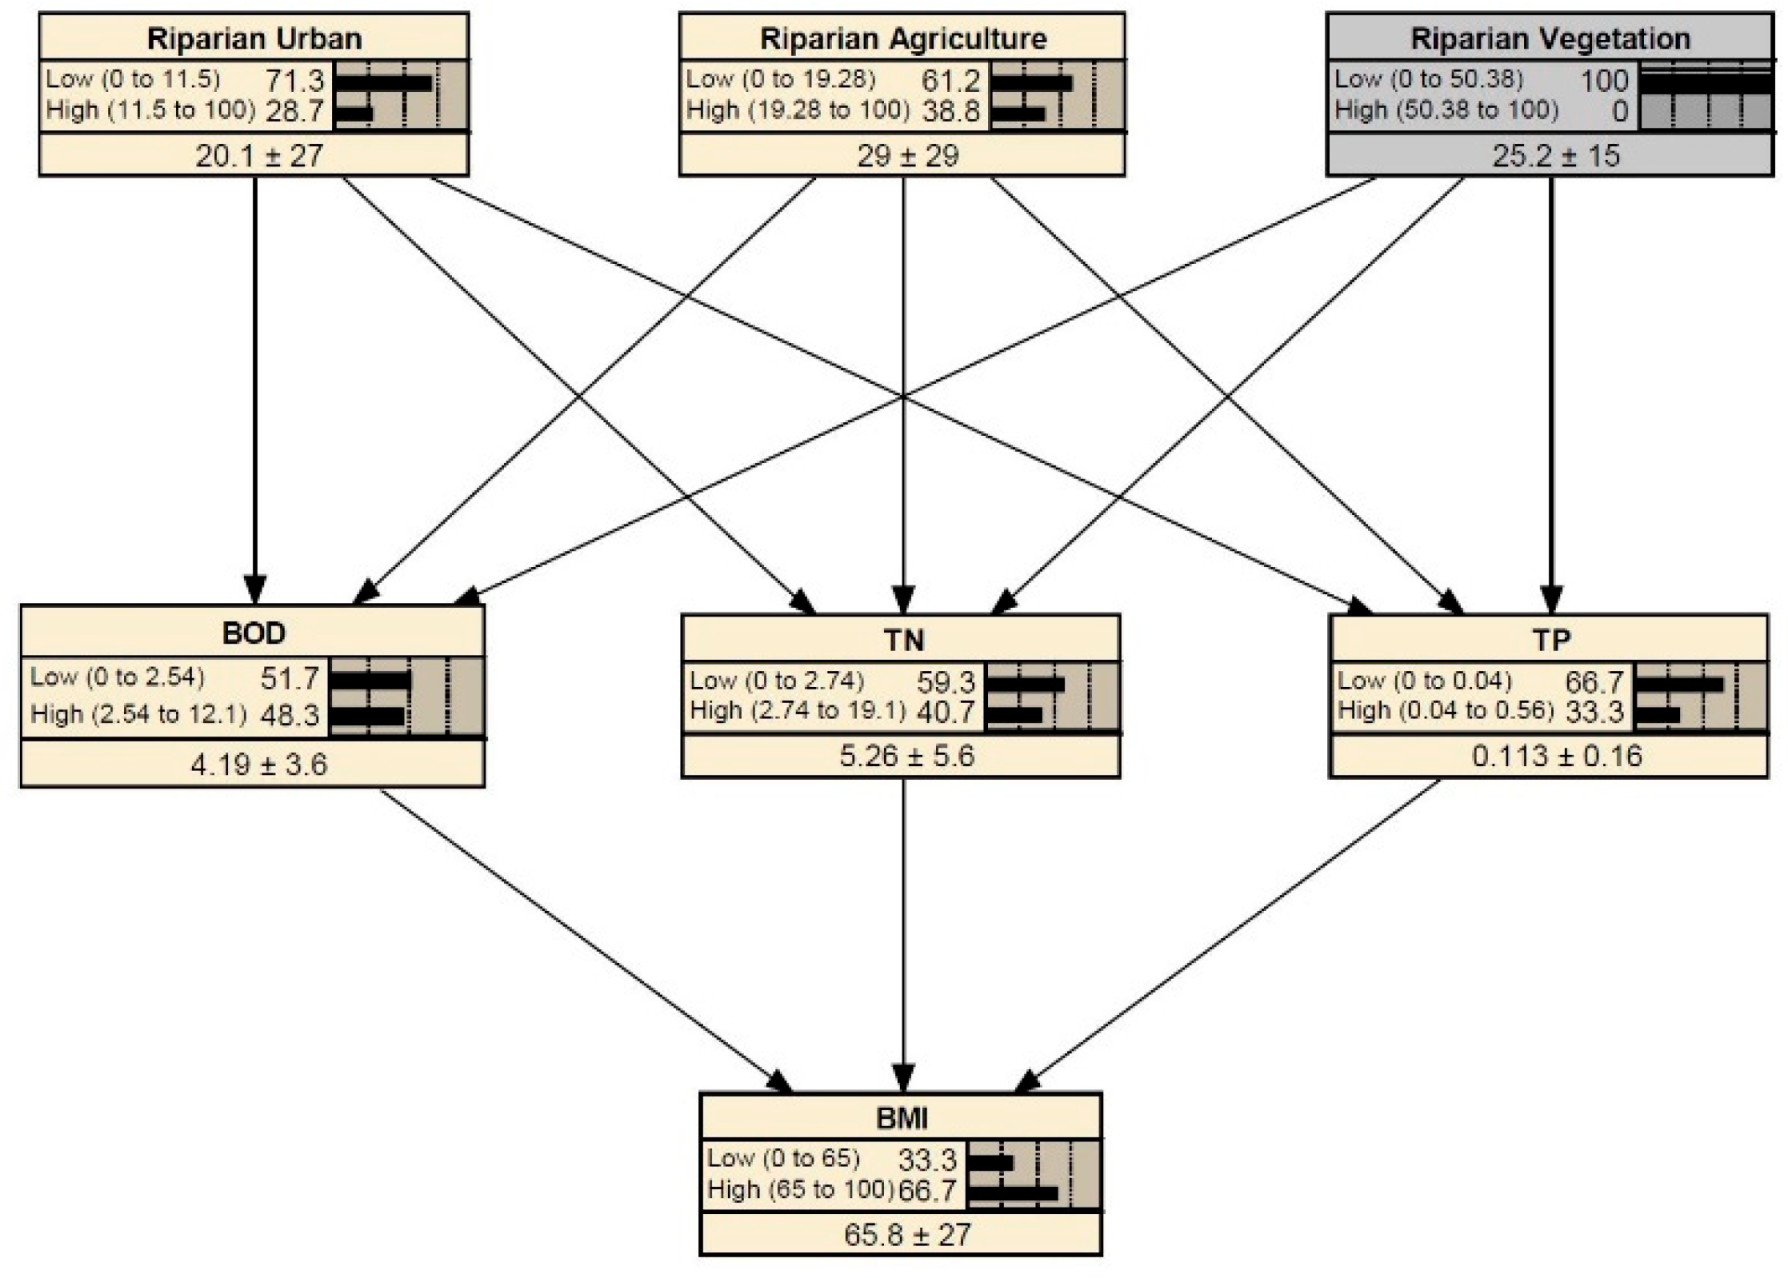
3.3. Scenario Analysis Results: High and Low Riparian Vegetation

We analyzed the outcomes under different scenarios of riparian vegetation change. Specifically, we established two scenarios: one representing low riparian vegetation and one representing high riparian vegetation. First, in the high vegetation scenario, we examined the predicted water quality and BMI outcomes when the probability of vegetation cover being high (ranging from 50.38% to 100%) was set to 100% (Figure 6). Under this scenario, the probability of BOD being low (indicating good water quality) was very high at 80.7%, while the probability of BOD being high was 19.3%. Similarly, the probability of TN being low was relatively high at 65.2%, compared to 34.8% for high TN. For TP, the probability of a low value was also high at 81.2%, with a probability of 18.8% for high TP. Conversely, the probability of BMI being high (indicating healthy benthic macroinvertebrate conditions) was substantial at 79.0%, compared to 21.0% for low BMI. Since lower water quality values and higher biological index scores indicate better stream ecosystem health, the results suggest that high riparian vegetation has a positive impact on the stream ecosystem in this scenario.
The low-riparian vegetation scenario assumed a 100% probability of riparian vegetation coverage ranging from 0 to 50.38% (Figure 7). In this BN, the riparian vegetation node is fixed to the “Low” state, while riparian urban and agricultural uses remain at their current (learned) distributions. Under this scenario, the probability of BOD being low (indicating good water quality) was relatively low at 51.7%, while the probability of BOD being high was 48.3%. Similarly, the probability of TN being low decreased to 59.3%, with 40.7% for high TN. For TP, the probability of a low value was significantly reduced to 66.7%, while the probability of a high value increased to 33.3%. Conversely, the probability of BMI being high (indicating healthy benthic macroinvertebrate conditions) decreased to 66.7%, with the probability of BMI being low rising to 33.3%. These results suggest that reduced riparian vegetation coverage adversely affects both water quality and the BMI, thereby impairing overall stream ecosystem health.
Compared to the low riparian vegetation scenario (vegetation cover < 50.38%, Figure 7), the probability of improved stream ecosystem health increased overall under the high riparian vegetation scenario (vegetation cover ≥ 50.38%, Figure 6). The probability of BOD, TN, and TP being low (indicating good water quality) increased by 29.0%, 5.9%, and 14.5 %, respectively. In addition, the probability of BMI being high (indicating healthy benthic macroinvertebrate conditions) increased by 12.3%. These results suggest that richer riparian vegetation improves both water quality and biological conditions, thereby enhancing stream ecosystem health.

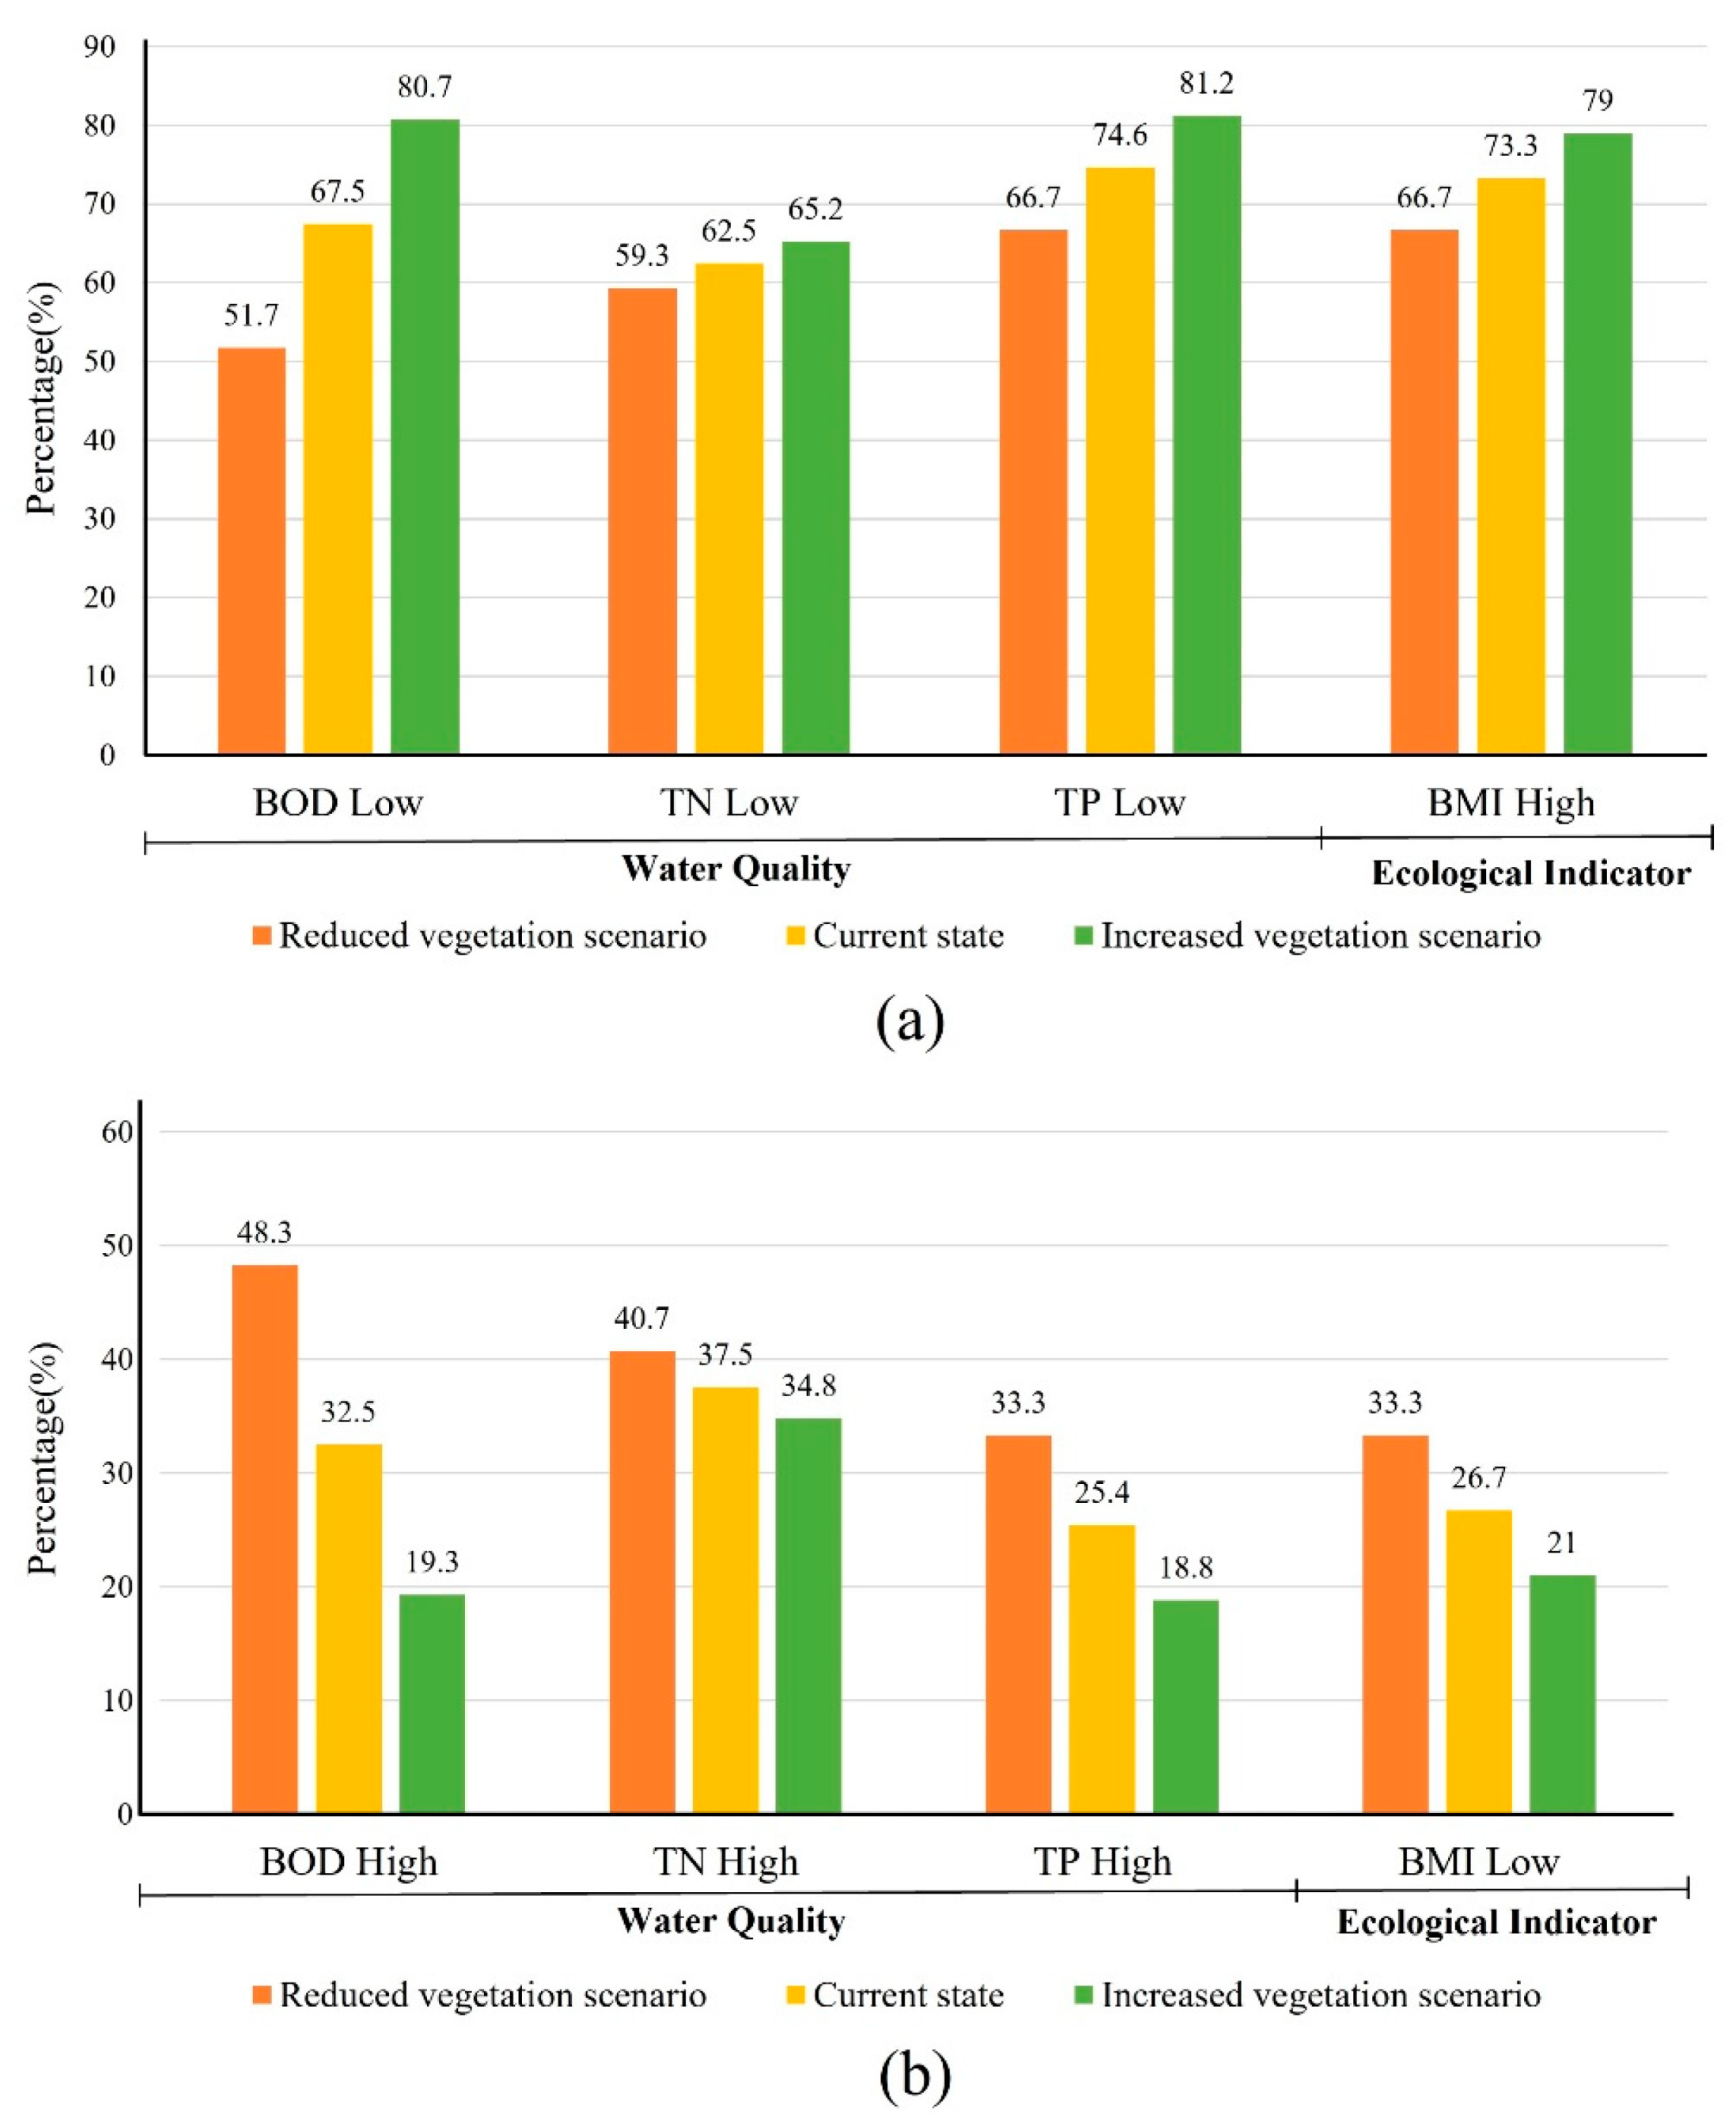
3.4. Comparison of Scenario Analysis Results with Current State

This section compares the outcomes of the scenario analyses (high- and low-vegetation scenarios) with the current state to evaluate the impact of changes in riparian vegetation on stream conditions (Figure 8). Reduced riparian vegetation negatively impacted water quality and the condition of benthic macroinvertebrates. Compared with the current state, the probability of low BOD decreased from 67.5 to 51.7%, while high BOD increased from 32.5 to 48.3%. Similarly, the probability of low TN decreased slightly from 62.5 to 59.3%, while high TN increased from 37.5 to 40.7%. For TP, the probability of low values decreased from 74.6 to 66.7%, and high values increased from 25.4 to 33.3%. Likewise, the probability of a high BMI decreased from 73.3 to 66.7%, while that of a low BMI increased from 26.7 to 33.3%.
Conversely, increasing riparian vegetation enhanced water quality and improved benthic macroinvertebrate conditions. In this scenario, the probability of low BOD increased from 67.5 to 80.7%, while high BOD decreased from 32.5 to 19.3%. The probability of low TN increased from 62.5 to 65.2%, and high TN decreased from 37.5 to 34.8%. For TP, the probability of low values improved from 74.6 to 81.2%, while high values decreased from 25.4 to 18.8%. Similarly, the probability of a high BMI increased from 73.3 to 79.0%, while that of a low BMI decreased from 26.7 to 21.0%.

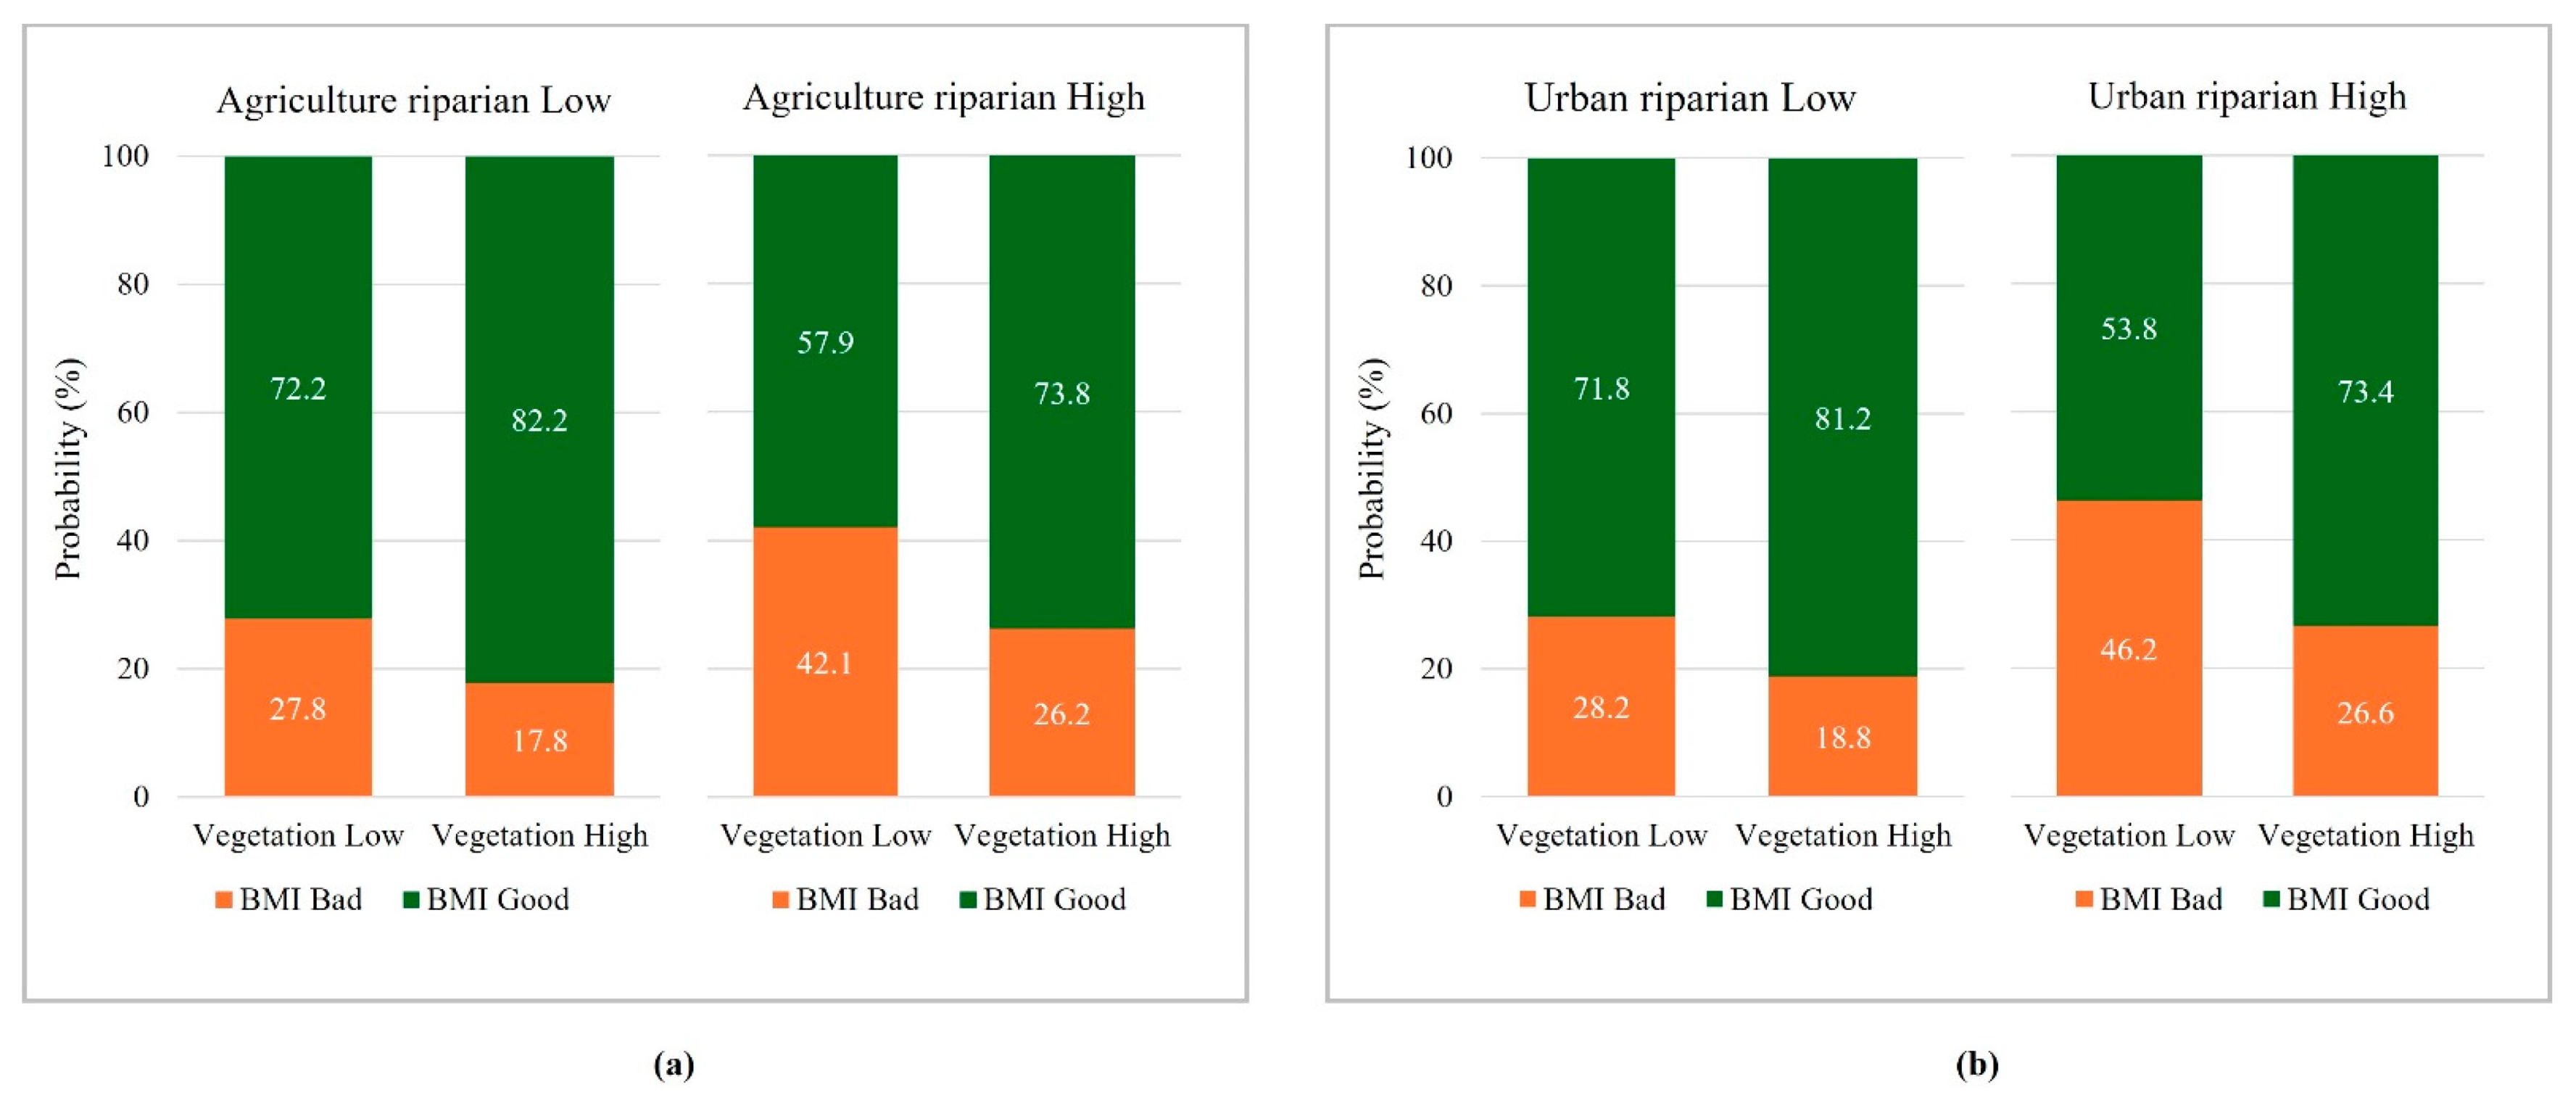
3.5. Comparison of Effects of Improving Riparian Vegetation in Urban and Agricultural Areas

To construct the land use scenarios, the levels of urbanization and agriculturalization within the riparian zones were classified as either “low” or “high” based on the discretization values presented in Table 2. Riparian vegetation was then cross-classified with these categories to form scenario combinations. For instance, the urbanization-based scenarios included (1) high urban proportion with high riparian vegetation, (2) high urban proportion with low vegetation, (3) low urban proportion with high vegetation, and (4) low urban proportion with low vegetation. A similar approach was applied to agricultural land. These combinations were used to analyze the interactive effects of land use intensity and riparian vegetation on stream conditions.
A graph was created to compare the outcomes of four scenario combinations (1–4), integrating riparian vegetation levels with urbanization and agricultural intensity levels (Figure 9). As the percentage of vegetation increases in urban riparian zones, the BMI improves significantly. In particular, an increase in the vegetation percentage in highly urbanized riparian zones has a greater impact on the BMI. When the vegetation percentage is low, the probability of the BMI being “good” is 53.8%; however, as the vegetation percentage increases, it reaches 73.4%, showing an improvement of 19.6%. On the other hand, in less urbanized riparian zones, the probability of the BMI being “good” increases by only 9.4%. An increase in vegetation percentage in agricultural riparian zones positively impacts the BMI, though its effect is relatively smaller compared with urban riparian zones. In highly agricultural riparian zones, the BMI “good” status increased from 57.9% with low vegetation to 73.8% with high vegetation, showing an improvement of 15.9%. In contrast, in less agricultural riparian zones, the BMI “good” condition increased by only 10.0%, reflecting smaller improvements.
Furthermore, to assess the individual and combined effects of riparian vegetation and land use changes, we compared scenarios in which (1) only riparian vegetation varied while land use remained fixed and (2) both vegetation and land use changed simultaneously. The greatest improvement in stream health, as measured by the probability of a “good” BMI condition, was observed when both riparian vegetation and land use improved together. In urban riparian areas, transitioning from a high-urbanization–low-vegetation scenario to a low-urbanization–high-vegetation scenario increased the probability of a good BMI condition by 27.4 percentage points (from 53.8 to 81.2%). In agricultural areas, shifting from high-agriculture–low-vegetation to low-agriculture–high-vegetation led to a 24.3 percentage point increase (from 57.9 to 82.2%). When only riparian vegetation was increased while keeping land use constant (i.e., no change in urban or agricultural extent), the improvements were smaller but still meaningful: Under constant agricultural land, increasing vegetation increased the probability of a good BMI from 79.0 to 82.2% (+3.2%). Under constant urban land, the probability increased from 78.0 to 81.2% (+3.2%). These results suggest that while enhancing riparian vegetation alone is beneficial, integrating vegetation restoration with land use management yields greater ecological gains.

3.6. Effects of Riparian Vegetation on Water Quality Indicators in Urban and Agricultural Areas

To assess the effects of riparian vegetation on water quality, we compared the probabilities of “Good” and “Bad” conditions for BOD, TN, and TP in four scenarios: low/high agricultural riparian area with low/high vegetation (Figure 10) and low/high urbanization riparian area with low/high vegetation (Figure 11). The results show a consistent increase in the probability of “Good” water quality status with higher riparian vegetation levels across all indicators.
BOD responded most sensitively to vegetation enhancement. Under the less agricultural riparian scenario (Figure 10), the probability of BOD Good increased markedly from 58.1 to 86.7% (+28.6%). A similar improvement was observed under the highly agricultural riparian condition, with BOD Good increasing from 41.6 to 71.2% (+29.6%). In both cases, BOD Bad fell below 30% when vegetation was high, indicating that riparian vegetation plays a strong role in mitigating organic pollution.
TN showed a smaller but still consistent positive response to vegetation. In the less agricultural riparian zone condition, TN good increased slightly from 68.3 to 71.4% (+3.1%), while under the high condition, the increase was from 45.1 to 55.3% (+10.2%). However, even under high vegetation, the TN Bad probability remained as high as 44.7%, indicating a relatively low sensitivity of TN to vegetation changes compared with BOD and TP.
TP demonstrated clear improvements with vegetation enhancement. TP Good increased from 74.8 to 88.7% under less agricultural riparian zone conditions (+13.9%) and from 53.8 to 69.4% under high conditions (+15.6%). In both cases, TP bad dropped below 30% with high vegetation. Among the three water quality variables, TP was the second most responsive to vegetation after BOD.
Overall, the analysis confirms that higher riparian vegetation coverage significantly improves water quality in agricultural riparian areas, particularly by reducing organic and phosphorus-related pollutants. While TN showed more limited changes, all three indicators responded in a direction consistent with improved water quality in increased-vegetation scenarios.
In urban riparian zones, increased riparian vegetation similarly improved water quality; however, the degree of response varied slightly from that observed in agricultural areas (Figure 11).
Among the three indicators, BOD showed the most pronounced improvement. Under low urban pressure, the probability of BOD being in good condition rose from 55.9 to 85.4%, marking an increase of 29.5 percentage points. A comparable change was observed under high urban pressure, where BOD good increased from 41.6 to 71.2% (+29.6%). TP also exhibited a consistent positive response. Under low urban pressure, the probability of TP being classified as good rose from 75.6 to 84.5% (+8.9%), and under high pressure, it increased from 53.8 to 69.4% (+15.6%). These results underscore the beneficial effect of riparian vegetation on phosphorus reduction, even in highly urbanized landscapes. TN, on the other hand, showed relatively limited improvement. Under low urban pressure, TN good increased marginally from 66.1 to 67.8% (+1.7%), while under high urban pressure, the increase was more substantial—from 45.1 to 55.3% (+10.2%). Despite the improvements, the high proportion of TN Bad under urban conditions suggests that nitrogen is less responsive to vegetation alone and may require additional management interventions.

4. Discussion

Our findings demonstrate that increased riparian vegetation is associated with decreased pollutant concentrations in water and a reduced probability of benthic macroinvertebrate impairment. This highlights the critical role of riparian vegetation in improving water quality and supporting aquatic ecosystem health. Numerous studies have established the importance of riparian vegetation in regulating water quality and maintaining diverse benthic macroinvertebrate assemblages (e.g., [72,73,74]). Acting as a natural buffer between upland areas and streams, riparian vegetation mitigates the impact of non-point source pollution not only through direct nutrient and contaminant uptake but also via indirect mechanisms, such as organic matter input, hydrological flow modulation, and soil stabilization [75]. These processes collectively contribute to the reduction in sediment and pollutant loading [76], the stabilization of streambanks, and ultimately the enhancement in stream habitat conditions necessary for the persistence of aquatic biota [34].
Well-preserved riparian zones have been shown to support more diverse and functionally rich benthic macroinvertebrate communities. For example, Azrina et al., (2006) [77] observed significantly higher richness in upstream reaches with intact riparian buffers compared with disturbed downstream sites. Nguyen et al., (2023) [78] further supported these findings through multivariate modeling in German headwater streams, identifying riparian vegetation and phosphorus concentration as the most influential predictors of macroinvertebrate richness and functional composition. Their results indicated that in forested riparian areas with high dissolved oxygen and low phosphorus, the probability of ecological degradation dropped by over 40%.
In our study, an increase in the proportion of urban and agricultural land use within riparian zones corresponded with water quality degradation and higher probabilities of benthic macroinvertebrate impairment. These findings suggest that the deterioration of water quality and benthic community health may be directly influenced by the degradation or loss of riparian vegetation due to anthropogenic pressures. This study revealed that enhancing riparian vegetation leads to significant improvements in water quality indicators such as BOD, TN, and TP in agricultural areas, whereas in urban settings, the most notable effect was observed in the enhancement in the BMI. Consistent with our findings, Nguyen et al., (2023) [78] reported that riparian vegetation restoration in urban areas primarily benefited macroinvertebrate community richness, while agricultural areas exhibited more pronounced improvements in chemical water quality parameters.
In agricultural areas, riparian vegetation acts as a vital buffer against non-point source pollution by intercepting surface runoff containing excess nutrients and sediments before they reach adjacent streams [79]. This buffering function is particularly effective in regions characterized by permeable soils and gentle slopes which facilitate the filtration and retention of pollutants. For instance, in the Geum River watershed in Republic of Korea, Calderon and An (2016) [80] found that when riparian vegetation cover exceeded 25%, the concentrations of total nitrogen and phosphorus were reduced by over 30%. Similarly, Jargal et al., (2024) [81] observed that increasing riparian vegetation coverage by 30% in the Han River Basin resulted in reductions in TN of 42% and in TP of 38%, demonstrating the vegetation’s role in mitigating eutrophication risks. In northeastern China, Li et al., (2022) [82] showed that expanding riparian buffer width by 20 m in farmlands reduced TN concentrations by up to 35%, underscoring the spatial sensitivity of buffer effectiveness in relation to land use intensity and slope gradients.
In urban areas, riparian vegetation plays a pivotal role in enhancing habitat complexity and providing refuge for aquatic organisms, thereby improving the BMI. A study conducted in urban streams in Tennessee (USA) found that even a 15% increase in riparian vegetation led to significant improvements in macroinvertebrate diversity indices, underscoring the ecological value of vegetated buffers in densely urbanized catchments [83]. These findings highlight that even in heavily modified urban landscapes, riparian vegetation can partially offset the adverse effects of urbanization by stabilizing stream banks, reducing thermal stress, and contributing organic matter that supports diverse macroinvertebrate communities.

5. Conclusions

This study demonstrates the pivotal role of riparian land use, particularly vegetation cover, in shaping stream water quality and biological health. A scenario-based analysis using a Bayesian Network (BN) model revealed that increased riparian vegetation led to significant improvements in water quality indicators (i.e., BOD, TN, and TP) and enhanced the benthic macroinvertebrate index (BMI), indicating improved ecological conditions. In contrast, low-vegetation scenarios were associated with notable declines in both water quality and biological health. The positive effects of riparian vegetation were especially evident in sub-watersheds with high levels of urbanization and agricultural land use, highlighting the importance of protecting riparian zones and enhancing vegetation cover as part of restoration efforts in these developed areas. The BN scenario analysis provided a quantitative and transparent framework to evaluate potential improvements, offering probabilistic evidence for riparian vegetation management strategies.
However, this study adopted a simplified classification of riparian vegetation based on general land cover types and aggregated LULC into three major categories to reduce model complexity. As such, the ecological heterogeneity of different vegetation types and land uses may not be fully captured. Future studies should consider incorporating more detailed vegetation structures and land use typologies to refine ecological interpretations. Nonetheless, this research study serves as a scientific basis for understanding how riparian vegetation influences stream ecosystems, particularly under varying land use conditions. By quantifying these relationships through a probabilistic modeling approach, the study provides foundational evidence that supports the ecological rationale for riparian vegetation restoration. As such, it contributes to the broader goal of improving watershed resilience and ecological function, offering a valuable reference for future restoration-oriented studies in Korean and similar stream systems.

Author Contributions

Conceptualization, J.-W.L., S.-W.L., and S.-R.P.; methodology, software, validation, formal analysis, investigation, resources, data curation, and writing—original draft preparation, J.-Y.G.; writing—review and editing, S.-W.L., Y.P., and S.-R.P.; visualization, J.-Y.G.; supervision, project administration, and funding acquisition, S.-R.P. All authors have read and agreed to the published version of the manuscript.

Funding

This research received no external funding.

Data Availability Statement

Data will be made available upon request.

Acknowledgments

This work was supported by the Basic Science Research Program through the National Research Foundation of Korea (NRF), funded by the Ministry of Education under grant 2022R1l1A1A01070904 and the Korea Forest Service (Korea Forestry Promotion Institute) under grant FTIS 2021331A00-2223-AA01. This paper was also supported by the Konkuk University Researcher Fund in 2023.

Conflicts of Interest

The authors declare no conflicts of interest.

References

  1. Johnson, B.L.; Richardson, W.B.; Naimo, T.J. Past, Present, and Future Concepts in Large River Ecology. Bioscience 1995, 45, 134–141. [Google Scholar] [CrossRef]
  2. Wetzel, R.G. Limnology: Lake and River Ecosystems; Gulf Professional Publishing: San Diego, CA, USA, 2001; ISBN 0127447601. [Google Scholar]
  3. Elosegi, A.; Sabater, S. Effects of Hydromorphological Impacts on River Ecosystem Functioning: A Review and Suggestions for Assessing Ecological Impacts. Hydrobiologia 2013, 712, 129–143. [Google Scholar] [CrossRef]
  4. Bonansea, M.; Ledesma, C.; Rodriguez, M.C. Assessing the Impact of Land Use and Land Cover on Water Quality in the Watershed of a Reservoir. Appl. Ecol. Environ. Res. 2016, 14, 447–456. [Google Scholar] [CrossRef]
  5. Tang, Z.; Engel, B.A.; Pijanowski, B.C.; Lim, K.J. Forecasting Land Use Change and Its Environmental Impact at a Watershed Scale. J. Environ. Manag. 2005, 76, 35–45. [Google Scholar] [CrossRef]
  6. Alberti, M.; Marzluff, J.M. Ecological Resilience in Urban Ecosystems: Linking Urban Patterns to Human and Ecological Functions. Urban Ecosyst. 2004, 7, 241–265. [Google Scholar] [CrossRef]
  7. Meneses, B.M.; Reis, R.; Vale, M.J.; Saraiva, R. Land Use and Land Cover Changes in Zêzere Watershed (Portugal)—Water Quality Implications. Sci. Total Environ. 2015, 527–528, 439–447. [Google Scholar] [CrossRef]
  8. Cuo, L. Land Use/Cover Change Impacts on Hydrology in Large River Basins. In Terrestrial Water Cycle and Climate Change; Geophysical Monograph Series; Wiley: Hoboken, NJ, USA, 2016; pp. 103–134. ISBN 9781118971772. [Google Scholar]
  9. Näschen, K.; Diekkrüger, B.; Evers, M.; Höllermann, B.; Steinbach, S.; Thonfeld, F. The Impact of Land Use/Land Cover Change (LULCC) on Water Resources in a Tropical Catchment in Tanzania under Different Climate Change Scenarios. Sustainability 2019, 11, 7083. [Google Scholar] [CrossRef]
  10. Shuster, W.D.; Bonta, J.; Thurston, H.; Warnemuende, E.; Smith, D.R. Impacts of Impervious Surface on Watershed Hydrology: A Review. Urban Water J. 2005, 2, 263–275. [Google Scholar] [CrossRef]
  11. Şimşek Uygun, B.; Albek, M. Determination Effects of Impervious Areas on Urban Watershed. Environ. Sci. Pollut. Res. 2015, 22, 2272–2286. [Google Scholar] [CrossRef]
  12. Alamdari, N.; Claggett, P.; Sample, D.J.; Easton, Z.M.; Yazdi, M.N. Evaluating the Joint Effects of Climate and Land Use Change on Runoff and Pollutant Loading in a Rapidly Developing Watershed. J. Clean. Prod. 2022, 330, 129953. [Google Scholar] [CrossRef]
  13. Yuan, L.; Sinshaw, T.; Forshay, K.J. Review of Watershed-Scale Water Quality and Nonpoint Source Pollution Models. Geosciences 2020, 10, 25. [Google Scholar] [CrossRef] [PubMed]
  14. Chang, D.; Lai, Z.; Li, S.; Li, D.; Zhou, J. Critical Source Areas’ Identification for Non-Point Source Pollution Related to Nitrogen and Phosphorus in an Agricultural Watershed Based on SWAT Model. Environ. Sci. Pollut. Res. 2021, 28, 47162–47181. [Google Scholar] [CrossRef]
  15. Giri, S.; Qiu, Z.; Zhang, Z. Assessing the Impacts of Land Use on Downstream Water Quality Using a Hydrologically Sensitive Area Concept. J. Environ. Manag. 2018, 213, 309–319. [Google Scholar] [CrossRef] [PubMed]
  16. Papotto, J.; Rodrigues, L.J.; Siebert, E.M.; Wagner, E.J.; Goldsmith, S.T. Spatial Controls on Riverbed Sediment Chemistry in Three Anthropogenically Modified Tropical Mountainous Watersheds. Int. J. Environ. Sci. Technol. 2022, 19, 9–26. [Google Scholar] [CrossRef]
  17. Malmqvist, B.; Rundle, S. Threats to the Running Water Ecosystems of the World. Environ. Conserv. 2002, 29, 134–153. [Google Scholar] [CrossRef]
  18. Zampella, R.A.; Procopio, N.A.; Lathrop, R.G.; Dow, C.L. Relationship of Land-Use/Land-Cover Patterns and Surface-Water Quality in the Mullica River Basin. J. Am. Water Resour. Assoc. 2007, 43, 594–604. [Google Scholar] [CrossRef]
  19. Li, S.; Gu, S.; Liu, W.; Han, H.; Zhang, Q. Water Quality in Relation to Land Use and Land Cover in the Upper Han River Basin, China. Catena 2008, 75, 216–222. [Google Scholar] [CrossRef]
  20. Nilawar, A.P.; Waikar, M.L. Use of SWAT to Determine the Effects of Climate and Land Use Changes on Streamflow and Sediment Concentration in the Purna River Basin, India. Environ. Earth Sci. 2018, 77, 783. [Google Scholar] [CrossRef]
  21. Liu, Y.; Wu, G.; Fan, X.; Gan, G.; Wang, W.; Liu, Y. Hydrological Impacts of Land Use/Cover Changes in the Lake Victoria Basin. Ecol. Indic. 2022, 145, 109580. [Google Scholar] [CrossRef]
  22. Gaur, S.; Bandyopadhyay, A.; Singh, R. From Changing Environment to Changing Extremes: Exploring the Future Streamflow and Associated Uncertainties Through Integrated Modelling System. Water Resour. Manag. 2021, 35, 1889–1911. [Google Scholar] [CrossRef]
  23. Meyer, J.L.; Sale, M.J.; Mulholland, P.J.; Poff, N.L. Impacts of Climate Change on Aquatic Ecosystem Functioning and Health. JAWRA J. Am. Water Resour. Assoc. 1999, 35, 1373–1386. [Google Scholar] [CrossRef]
  24. Crook, D.A.; Lowe, W.H.; Allendorf, F.W.; Erős, T.; Finn, D.S.; Gillanders, B.M.; Hadwen, W.L.; Harrod, C.; Hermoso, V.; Jennings, S.; et al. Human Effects on Ecological Connectivity in Aquatic Ecosystems: Integrating Scientific Approaches to Support Management and Mitigation. Sci. Total Environ. 2015, 534, 52–64. [Google Scholar] [CrossRef] [PubMed]
  25. Sobhani, P.; Esmaeilzadeh, H.; Barghjelveh, S.; Sadeghi, S.M.M.; Marcu, M.V. Habitat Integrity in Protected Areas Threatened by Lulc Changes and Fragmentation: A Case Study in Tehran Province, Iran. Land 2022, 11, 6. [Google Scholar] [CrossRef]
  26. Allan, D.; Erickson, D.; Fay, J. The Influence of Catchment Land Use on Stream Integrity across Multiple Spatial Scales. Freshw. Biol. 1997, 37, 149–161. [Google Scholar] [CrossRef]
  27. Brauman, K.A.; Daily, G.C.; Duarte, T.K.; Mooney, H.A. The Nature and Value of Ecosystem Services: An Overview Highlighting Hydrologic Services. Annu. Rev. Environ. Resour. 2007, 32, 67–98. [Google Scholar] [CrossRef]
  28. González, E.; Felipe-Lucia, M.R.; Bourgeois, B.; Boz, B.; Nilsson, C.; Palmer, G.; Sher, A.A. Integrative Conservation of Riparian Zones. Biol. Conserv. 2017, 211, 20–29. [Google Scholar] [CrossRef]
  29. Tabacchi, E.; Lambs, L.; Guilloy, H.; Planty-Tabacchi, A.-M.; Muller, E.; Décamps, H. Impacts of Riparian Vegetation on Hydrological Processes. Hydrol. Process. 2000, 14, 2959–2976. [Google Scholar] [CrossRef]
  30. Palt, M.; Hering, D.; Kail, J. Context-specific Positive Effects of Woody Riparian Vegetation on Aquatic Invertebrates in Rural and Urban Landscapes. J. Appl. Ecol. 2023, 60, 1010–1021. [Google Scholar] [CrossRef]
  31. Tolkkinen, M.; Vaarala, S.; Aroviita, J. The Importance of Riparian Forest Cover to the Ecological Status of Agricultural Streams in a Nationwide Assessment. Water Resour. Manag. 2021, 35, 4009–4020. [Google Scholar] [CrossRef]
  32. Kupilas, B.; Burdon, F.J.; Thaulow, J.; Håll, J.; Mutinova, P.T.; Forio, M.A.E.; Witing, F.; Rîșnoveanu, G.; Goethals, P.; McKie, B.G. Forested Riparian Zones Provide Important Habitat for Fish in Urban Streams. Water 2021, 13, 877. [Google Scholar] [CrossRef]
  33. Connolly, N.M.; Pearson, R.G.; Loong, D.; Maughan, M.; Brodie, J. Water Quality Variation along Streams with Similar Agricultural Development but Contrasting Riparian Vegetation. Agric. Ecosyst. Environ. 2015, 213, 11–20. [Google Scholar] [CrossRef]
  34. Singh, R.; Tiwari, A.K.; Singh, G.S. Managing Riparian Zones for River Health Improvement: An Integrated Approach. Landsc. Ecol. Eng. 2021, 17, 195–223. [Google Scholar] [CrossRef]
  35. Xu, H.; Cai, C.; Du, H.; Guo, Y. Responses of Water Quality to Land Use in Riparian Buffers: A Case Study of Huangpu River, China. GeoJournal 2021, 86, 1657–1669. [Google Scholar] [CrossRef]
  36. Yirigui, Y.; Lee, S.-W.; Nejadhashemi, A.P.; Herman, M.R.; Lee, J.-W. Relationships between Riparian Forest Fragmentation and Biological Indicators of Streams. Sustainability 2019, 11, 2870. [Google Scholar] [CrossRef]
  37. European Commission. Directive 2000/60/EC of the European Parliament and of the Council Establishing a Framework for Community Action in the Field of Water Policy. EC Dir. 2000, 23, 1–73. [Google Scholar]
  38. United States Environmental Protection Agency. Overview of the Clean Water Act; United States Environmental Protection Agency: Washington, DC, USA, 2025. [Google Scholar]
  39. Wahl, C.; Neils, A.; Hooper, D. Impacts of Land Use at the Catchment Scale Constrain the Habitat Benefits of Stream Riparian Buffers. Freshw. Biol. 2013, 58, 2310–2324. [Google Scholar] [CrossRef]
  40. Fierro, P.; Bertrán, C.; Tapia, J.; Hauenstein, E.; Peña-Cortés, F.; Vergara, C.; Cerna, C.; Vargas-Chacoff, L. Effects of Local Land-Use on Riparian Vegetation, Water Quality, and the Functional Organization of Macroinvertebrate Assemblages. Sci. Total Environ. 2017, 609, 724–734. [Google Scholar] [CrossRef]
  41. Tromboni, F.; Dodds, W.K. Relationships Between Land Use and Stream Nutrient Concentrations in a Highly Urbanized Tropical Region of Brazil: Thresholds and Riparian Zones. Environ. Manag. 2017, 60, 30–40. [Google Scholar] [CrossRef]
  42. Miserendino, M.L.; Casaux, R.; Archangelsky, M.; Di Prinzio, C.Y.; Brand, C.; Kutschker, A.M. Assessing Land-Use Effects on Water Quality, in-Stream Habitat, Riparian Ecosystems and Biodiversity in Patagonian Northwest Streams. Sci. Total Environ. 2011, 409, 612–624. [Google Scholar] [CrossRef]
  43. Rosenfeld, J.S. Developing Flow–Ecology Relationships: Implications of Nonlinear Biological Responses for Water Management. Freshw. Biol. 2017, 62, 1305–1324. [Google Scholar] [CrossRef]
  44. Zhang, F.; Chen, Y.; Wang, W.; Jim, C.Y.; Zhang, Z.; Tan, M.L.; Liu, C.; Chan, N.W.; Wang, D.; Wang, Z.; et al. Impact of Land-Use/Land-Cover and Landscape Pattern on Seasonal in-Stream Water Quality in Small Watersheds. J. Clean. Prod. 2022, 357, 131907. [Google Scholar] [CrossRef]
  45. Tu, J. Spatially Varying Relationships between Land Use and Water Quality across an Urbanization Gradient Explored by Geographically Weighted Regression. Appl. Geogr. 2011, 31, 376–392. [Google Scholar] [CrossRef]
  46. Keshtkar, A.R.; Salajegheh, A.; Sadoddin, A.; Allan, M.G. Application of Bayesian Networks for Sustainability Assessment in Catchment Modeling and Management (Case Study: The Hablehrood River Catchment). Ecol. Model. 2013, 268, 48–54. [Google Scholar] [CrossRef]
  47. Qian, S.S.; Kennen, J.G.; May, J.; Freeman, M.C.; Cuffney, T.F. Evaluating the Impact of Watershed Development and Climate Change on Stream Ecosystems: A Bayesian Network Modeling Approach. Water Res. 2021, 205, 117685. [Google Scholar] [CrossRef]
  48. Weil, K.K.; Cronan, C.S.; Meyer, S.R.; Lilieholm, R.J.; Danielson, T.J.; Tsomides, L.; Owen, D. Predicting Stream Vulnerability to Urbanization Stress with Bayesian Network Models. Landsc. Urban Plan. 2018, 170, 138–149. [Google Scholar] [CrossRef]
  49. Gericke, A.; Nguyen, H.H.; Fischer, P.; Kail, J.; Venohr, M. Deriving a Bayesian Network to Assess the Retention Efficacy of Riparian Buffer Zones. Water 2020, 12, 617. [Google Scholar] [CrossRef]
  50. Sperotto, A.; Molina, J.L.; Torresan, S.; Critto, A.; Pulido-Velazquez, M.; Marcomini, A. Water Quality Sustainability Evaluation under Uncertainty: A Multi-Scenario Analysis Based on Bayesian Networks. Sustainability 2019, 11, 4764. [Google Scholar] [CrossRef]
  51. Ministry of Environment. Han River Basin Water Environment Management Plan (‘16~‘25); Ministry of Environment: Sejong, Republic of Korea, 2019. [Google Scholar]
  52. Naik, S.; Mishra, R.K.; Sahu, K.C.; Lotliker, A.A.; Panda, U.S.; Mishra, P. Monsoonal Influence and Variability of Water Quality, Phytoplankton Biomass in the Tropical Coastal Waters—A Multivariate Statistical Approach. Front. Mar. Sci. 2020, 7, 648. [Google Scholar] [CrossRef]
  53. Shukla, B.K.; Gupta, A.; Sharma, P.K.; Bhowmik, A.R. Pollution Status and Water Quality Assessment in Pre-Monsoon Season: A Case Study of Rural Villages in Allahabad District, Uttar Pradesh, India. Mater. Today Proc. 2020, 32, 824–830. [Google Scholar] [CrossRef]
  54. Zelinka, M.; Marvan, P. Zur Präzisierung der biologischen Klassifikation der Reinheit fließender Gewässer. Arch. Hydrobiol. 1961, 57, 389–407. [Google Scholar]
  55. Won, D.H.; Jun, Y.C.; Kwon, S.J.; Hwang, S.J.; Ahn, K.G.; Lee, J.K. Development of Konan Saprobic Index Using Benthic Macroinvertebrates and Its Application to Biological Stream Environment Assessment. J. Korean Soc. Water Environ. 2006, 22, 768–783. [Google Scholar]
  56. Kong, D.; Son, S.-H.; Hwang, S.-J.; Won, D.H.; Kim, M.C.; Park, J.H.; Jeon, T.S.; Lee, J.E.; Kim, J.H.; Kim, J.S. Development of Benthic Macroinvertebrates Index (BMI) for Biological Assessment on Stream Environment. J. Korean Soc. Water Environ. 2018, 34, 183–201. [Google Scholar]
  57. Puga, J.L.; Krzywinski, M.; Altman, N. Points of Significance: Bayes’ Theorem. Nat. Methods 2015, 12, 277–278. [Google Scholar] [CrossRef]
  58. Ben-Gal, I. Bayesian Networks. In Encyclopedia of Statistics in Quality and Reliability; Wiley: Chichester, UK, 2007; ISBN 9780470061572. [Google Scholar]
  59. Needham, C.J.; Bradford, J.R.; Bulpitt, A.J.; Westhead, D.R. Inference in Bayesian Networks. Nat. Biotechnol. 2006, 24, 51–53. [Google Scholar] [CrossRef] [PubMed]
  60. Pearl, J. Bayesian Networks; UCLA Cognitive Systems Laboratory: Los Angeles, CA, USA, 2011. [Google Scholar]
  61. Jensen, F.V.; Nielsen, T.D. Bayesian Networks and Decision Graphs, 2nd ed.; Springer: New York, NY, USA, 2007. [Google Scholar]
  62. Pourhaji, S.; Moattar, M.H. Developing a Pieces of Data Allocation Method in Distributed Databases Using Bayesian Networks. In Proceedings of the 2015 International Congress on Technology, Communication and Knowledge (ICTCK), Mashhad, Iran, 11–12 November 2015; pp. 117–122. [Google Scholar]
  63. Kersting, K.; Landwehr, N. Scaled Conjugate Gradients for Maximum Likelihood: An Empirical Comparison with the EM Algorithm. In Advances in Bayesian Networks; Gámez, J.A., Moral, S., Salmerón, A., Eds.; Springer: Berlin/Heidelberg, Germany, 2004; pp. 235–254. ISBN 978-3-540-39879-0. [Google Scholar]
  64. Almond, R.G. An IRT-Based Parameterization for Conditional Probability Tables. In Proceedings of the Twelfth UAI Conference on Bayesian Modeling Applications Workshop, Amsterdam, The Netherlands, 6–10 July 2015; CEUR-WS.org: Aachen, Germany, 2015; Volume 1565, pp. 14–23. [Google Scholar]
  65. Biek, R.; Funk, W.C.; Maxell, B.A.; Mills, L.S. What Is Missing in Amphibian Decline Research: Insights from Ecological Sensitivity Analysis. Conserv. Biol. 2002, 16, 728–734. [Google Scholar] [CrossRef]
  66. Cariboni, J.; Gatelli, D.; Liska, R.; Saltelli, A. The Role of Sensitivity Analysis in Ecological Modelling. Ecol. Model. 2007, 203, 167–182. [Google Scholar] [CrossRef]
  67. Kenett, R.S. Bayesian Networks: Theory, Applications and Sensitivity Issues. Encycl. Semant. Comput. Robot. Intell. 2017, 1, 1630014. [Google Scholar] [CrossRef]
  68. Li, C.; Mahadevan, S. Sensitivity Analysis of a Bayesian Network. ASCE-ASME J. Risk Uncertain. Eng. Syst. Part B Mech. Eng. 2018, 4, 011003. [Google Scholar] [CrossRef]
  69. Laskey, K.B. Sensitivity Analysis for Probability Assessments in Bayesian Networks. IEEE Trans. Syst. Man, Cybern. 1995, 25, 901–909. [Google Scholar] [CrossRef]
  70. Gray, A. Construction and Assessment of Classification Rules; University of Manchester: Manchester, UK, 1998. [Google Scholar]
  71. Marcot, B.G. Metrics for Evaluating Performance and Uncertainty of Bayesian Network Models. Ecol. Model. 2012, 230, 50–62. [Google Scholar] [CrossRef]
  72. Sweeney, B.W.; Newbold, J.D. Streamside Forest Buffer Width Needed to Protect Stream Water Quality, Habitat, and Organisms: A Literature Review. JAWRA J. Am. Water Resour. Assoc. 2014, 50, 560–584. [Google Scholar] [CrossRef]
  73. Mayer, P.M.; Reynolds Jr, S.K.; McCutchen, M.D.; Canfield, T.J. Meta-analysis of Nitrogen Removal in Riparian Buffers. J. Environ. Qual. 2007, 36, 1172–1180. [Google Scholar] [CrossRef] [PubMed]
  74. Sargac, J.; Johnson, R.K.; Burdon, F.J.; Truchy, A.; Rîşnoveanu, G.; Goethals, P.; McKie, B.G. Forested Riparian Buffers Change the Taxonomic and Functional Composition of Stream Invertebrate Communities in Agricultural Catchments. Water 2021, 13, 1028. [Google Scholar] [CrossRef]
  75. Dosskey, M.G.; Vidon, P.; Gurwick, N.P.; Allan, C.J.; Duval, T.P.; Lowrance, R. The Role of Riparian Vegetation in Protecting and Improving Chemical Water Quality in Streams 1. JAWRA J. Am. Water Resour. Assoc. 2010, 46, 261–277. [Google Scholar] [CrossRef]
  76. Zhou, X.; Helmers, M.J.; Asbjornsen, H.; Kolka, R.; Tomer, M.D. Perennial Filter Strips Reduce Nitrate Levels in Soil and Shallow Groundwater after Grassland-to-cropland Conversion. J. Environ. Qual. 2010, 39, 2006–2015. [Google Scholar] [CrossRef]
  77. Azrina, M.Z.; Yap, C.K.; Rahim Ismail, A.; Ismail, A.; Tan, S.G. Anthropogenic Impacts on the Distribution and Biodiversity of Benthic Macroinvertebrates and Water Quality of the Langat River, Peninsular Malaysia. Ecotoxicol. Environ. Saf. 2006, 64, 337–347. [Google Scholar] [CrossRef]
  78. Nguyen, H.H.; Kiesel, J.; Peters, K.; Hering, D.; Sinclair, J.S.; Haase, P. Stream Macroinvertebrate Community Metrics Consistently Respond to a Spatiotemporal Disturbance Gradient but Composition Is More Context-Dependent. Landsc. Ecol. 2023, 38, 3133–3151. [Google Scholar] [CrossRef]
  79. Akter, S.; Li, X.; Dzakpasu, M.; Ifon, B.E.; Manirakiza, B.; Muyembe, D.K.; Zhang, Y.; Huang, J.; Guadie, A. Nutrient and Sediment Retention by Riparian Vegetated Buffer Strips: Impacts of Buffer Length, Vegetation Type, and Season. Agric. Ecosyst. Environ. 2024, 369, 109050. [Google Scholar]
  80. Calderon, M.S.; An, K.-G. An Influence of Mesohabitat Structures (Pool, Riffle, and Run) and Land-Use Pattern on the Index of Biological Integrity in the Geum River Watershed. J. Ecol. Environ. 2016, 40, 13. [Google Scholar] [CrossRef]
  81. Jargal, N.; Kim, J.-E.; Ariunbold, B.; An, K.-G. Ecological River Health Assessments, Based on Fish Ordination Analysis of Ecological Indicator Entities and the Biological Integrity Metrics, Responding to the Chemical Water Pollution. Environ. Sci. Pollut. Res. 2024, 31, 28306–28320. [Google Scholar] [CrossRef]
  82. Li, S.; Zhang, J.; Jiang, P.; Zhang, L. Linking Land Use with Riverine Water Quality: A Multi-Spatial Scale Analysis Relating to Various Riparian Strips. Front. Environ. Sci. 2022, 10, 1013318. [Google Scholar] [CrossRef]
  83. Atwell, A.K.; Schorr, M.S. Correlations of Catchment Landscape Features with Instream Environmental Conditions and Benthic Macroinvertebrate Assemblages in the Lookout Creek System (Tennessee River Drainage). Southeast. Nat. 2023, 22, 459–480. [Google Scholar] [CrossRef]
Figure 1. Study Area: The boundary of the Han River National Watershed Management Region (NWMR) and locations of stream condition monitoring sites.
Land 14 01248 g001
Figure 2. Example of a sampling site and the land use and land cover (LULC) within a 1 km riparian buffer zone of the watershed.
Land 14 01248 g002
Figure 3. Conceptual causal relationships between the LULC in riparian zones, water quality, and the biological index in the Bayesian Network model.
Land 14 01248 g003
Figure 4. Bayesian Network model representing the current state of the stream ecosystem based on observed data. Each node includes conditional probabilities for categorical variables and the mean ± standard deviation for continuous variables, based on the dataset.
Land 14 01248 g004
Figure 5. Sensitivity analysis results of the Bayesian Network model showing the relative influence of predictor variables on the benthic macroinvertebrate index (BMI). (a) Effects of riparian land use variables (vegetation, urban, and agriculture) on the BMI. (b) Effects of water quality indicators (BOD, TP, and TN) on the BMI. The values represent the percentage of variance reduction in the target variable (BMI), indicating the importance of each predictor.
Land 14 01248 g005
Figure 6. Probability changes in water quality parameters (BOD, TN, and TP) and the BMI in the high-riparian vegetation scenario. Each node includes conditional probabilities for categorical variables and the mean ± standard deviation for continuous variables, based on the dataset. Gray nodes represent variables fixed at 100% probability in this scenario.
Land 14 01248 g006
Figure 7. Probability changes in water quality parameters (BOD, TN, and TP) and the BMI in the low-riparian vegetation scenario. Each node includes conditional probabilities for categorical variables and the mean ± standard deviation for continuous variables, based on the dataset. Gray nodes represent variables fixed at 100% probability in this scenario.
Land 14 01248 g007
Figure 8. These graphs compare the posterior probabilities of stream condition indicators (BOD, TN, TP, and BMI) in two vegetation scenarios (reduced and increased) with the current state based on observation data. (a) The probability of a good ecological condition and (b) the probability of a bad ecological condition.
Land 14 01248 g008
Figure 9. Effects of riparian vegetation increase on BMI in (a) agricultural and (b) urban riparian zones, comparing low and high vegetation coverage.
Land 14 01248 g009
Figure 10. Changes in water quality indicators (BOD, TN, and TP) according to the level of vegetation (Vegetation Low vs. High) under agricultural riparian conditions. Each indicator is classified into the probability of “Good” and “Bad” statuses.
Land 14 01248 g010
Figure 11. Changes in water quality indicators (BOD, TN, and TP) according to vegetation level (Vegetation Low vs. High) under urban riparian conditions. Each indicator is classified into the probability of “Good” and “Bad” statuses.
Land 14 01248 g011
Table 1. Descriptive statistics of riparian LULC, water quality indicators, and biological indicators.
ClassificationVariableMeanS.D.MinMax
Percentage of
Riparian LULC
Urban (%)11.5014.570.1989.43
Agriculture (%)19.2815.990.0083.71
Vegetation (%)50.3825.820.0096.48
Water Quality
Indicators
BOD (mg/L)2.541.710.6012.05
TN (mg/L)2.741.890.1619.09
TP (mg/L)0.040.050.010.56
Biological IndicatorsBMI (0–100)70.4621.2515.1097.60
Table 2. Discretized variables for riparian land cover (urban, agricultural, and vegetated), water quality, and benthic macroinvertebrate index (BMI).
CategoryVariableDiscretization ValueValue Description
Percentage of
Riparian LULC
Urban (%)Low0 to 11.5
High11.5 to 100
Agriculture (%)Low0 to 19.28
High19.28 to 100
Vegetation (%)Low0 to 50.38
High50.38 to 100
Water Quality
Indicators
BOD (mg/L)Low0 to 2.54
High2.54 to 12.1
TN (mg/L)Low0 to 2.74
High2.74 to 19.1
TP (mg/L)Low0 to 0.04
High0.04 to 0.56
Biological IndicatorsBMI (0–100)Low0 to 65
High65 to 100
Disclaimer/Publisher’s Note: The statements, opinions and data contained in all publications are solely those of the individual author(s) and contributor(s) and not of MDPI and/or the editor(s). MDPI and/or the editor(s) disclaim responsibility for any injury to people or property resulting from any ideas, methods, instructions or products referred to in the content.

