

Urban Renewal Strategy Guided by Rail Transit Development Based on the “Node–Place–Revenue” Model: Case Study of Shenyang Metro Line 1


Abstract
1. Introduction
2. Materials and Methods
2.1. Previous Literature
2.2. Research Method
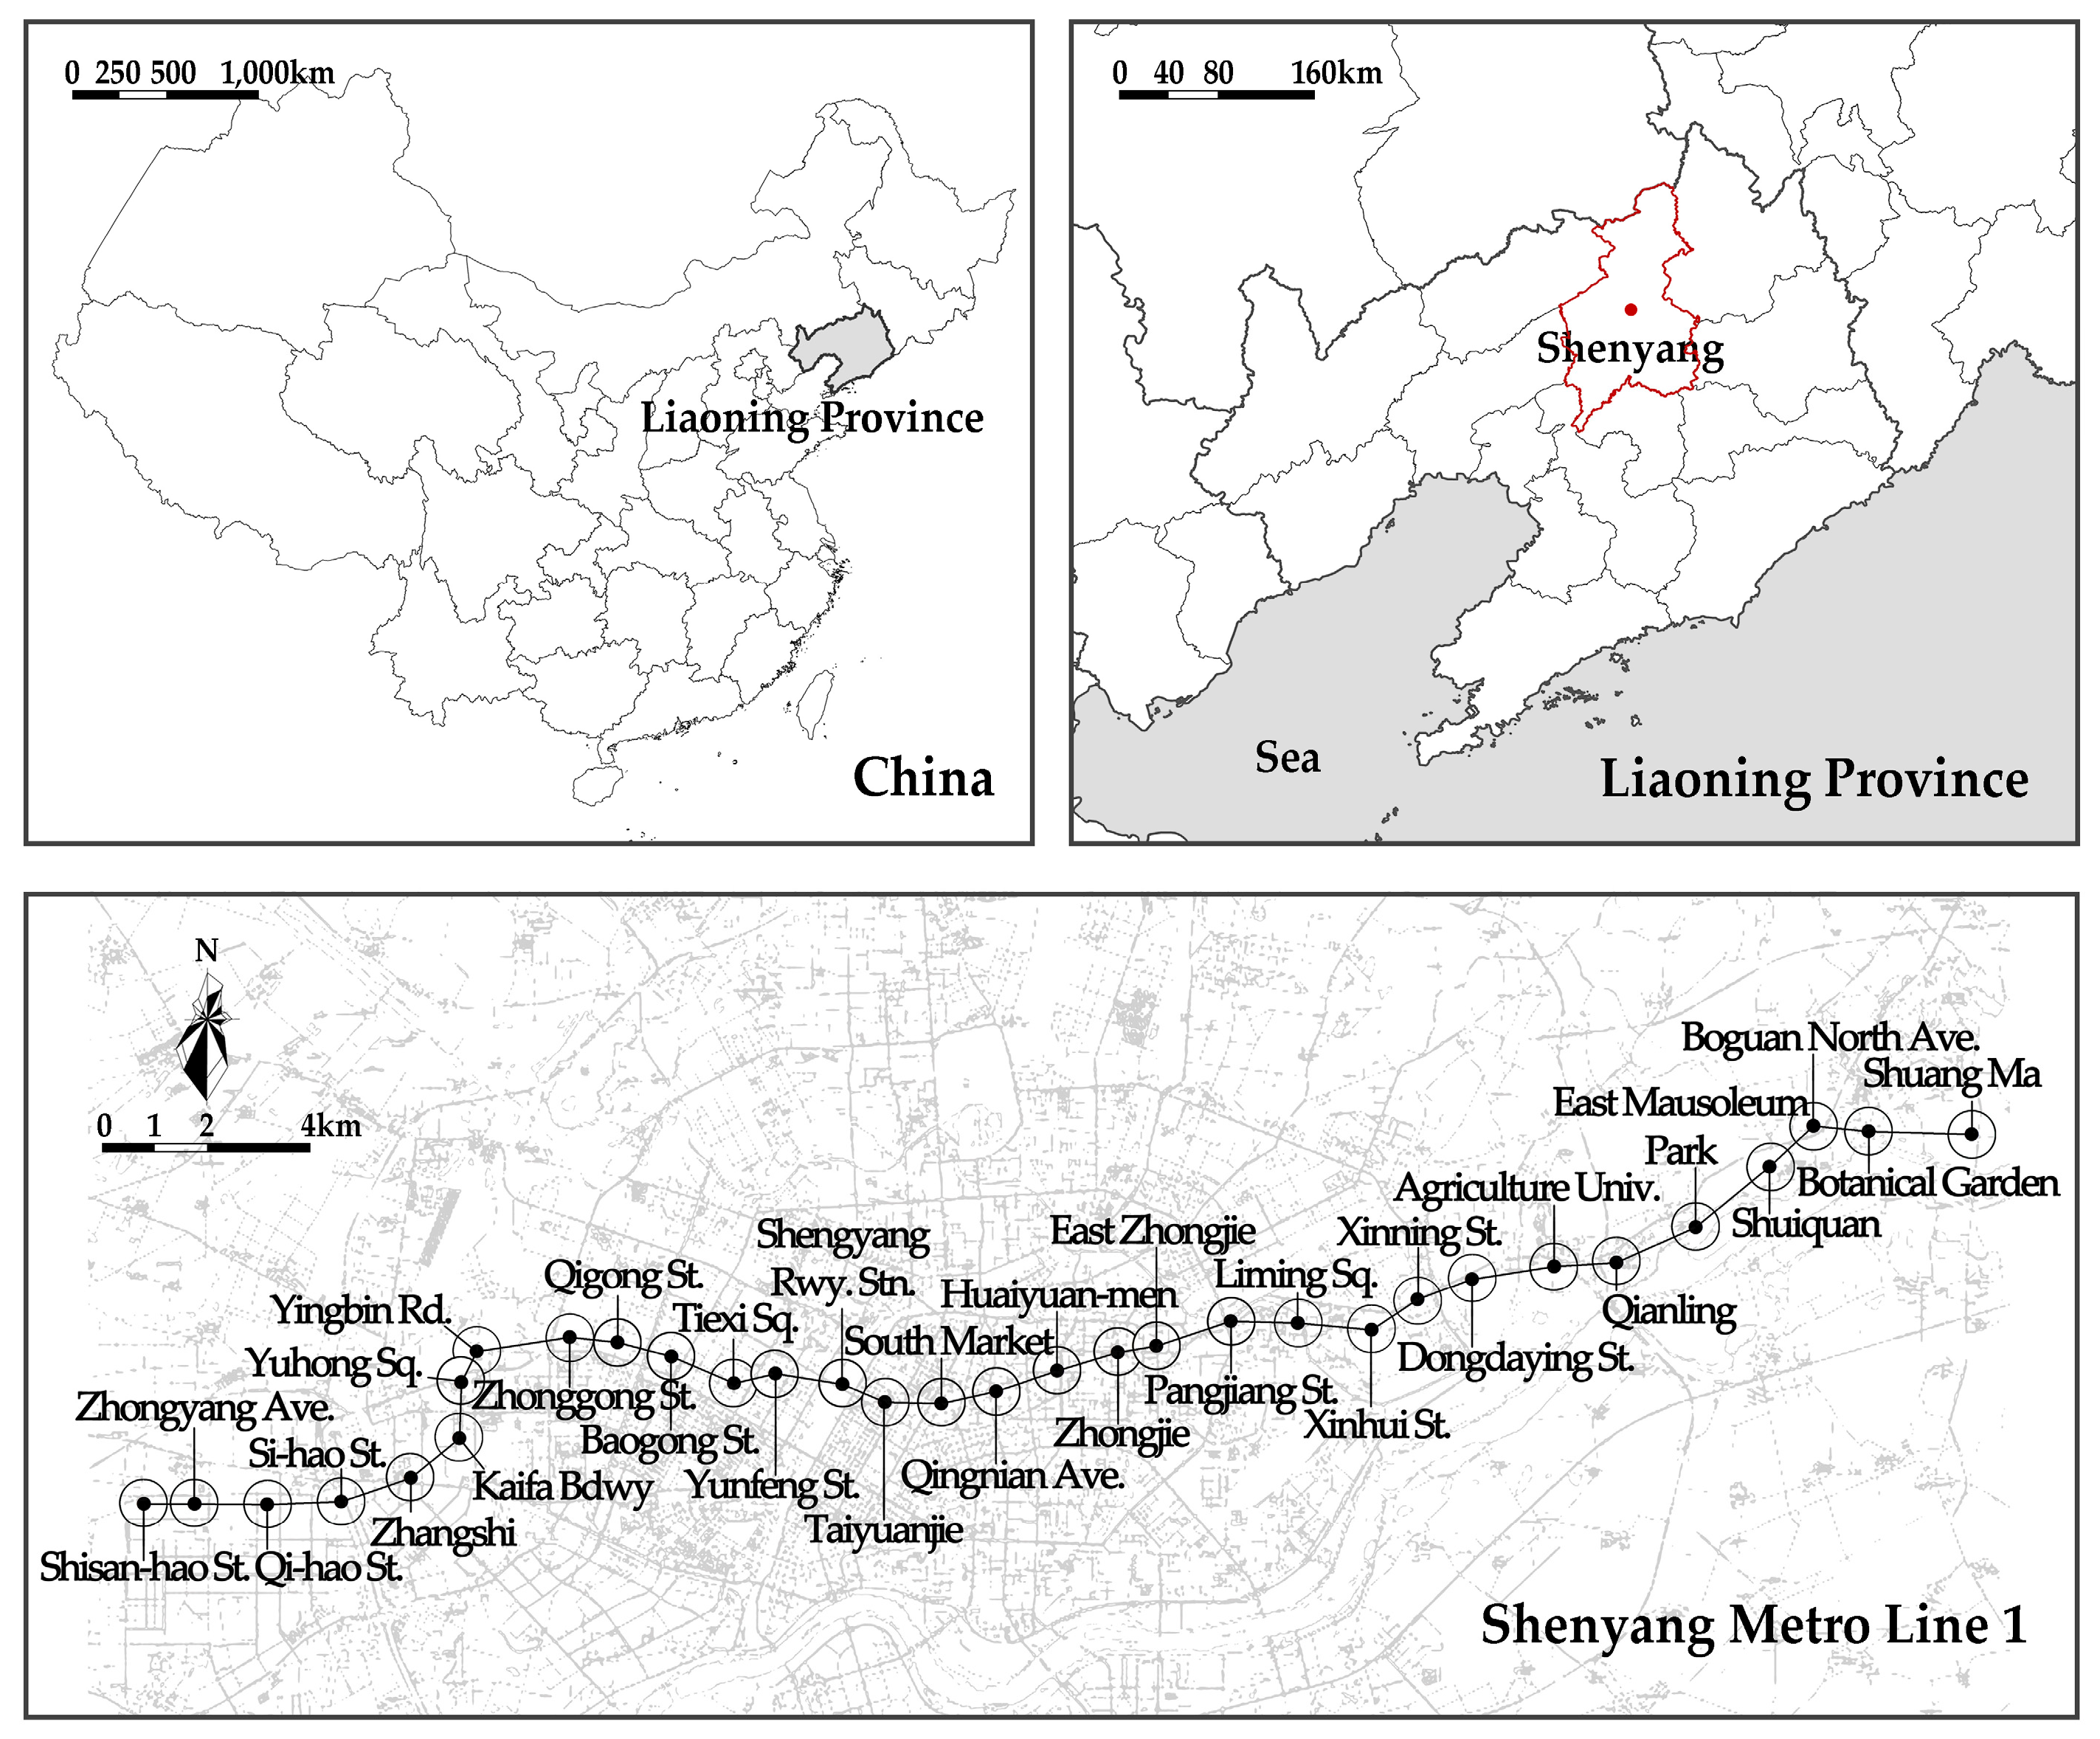
2.2.1. Research Object and Scope
2.2.2. Data Sources
2.2.3. Indicator Selection and Processing
- Nodal value reflects the transportation service function and value presented by metro stations as urban transportation nodes. The number of station entrances and exits (N1) (Reusser et al. [45]), the number of directions served by the station (N2) (Reusser et al. [45]), and the number of bus stops in the station domain (N3) (Reusser et al. [45], Kim et al. [46]), ease of bus transfer (N4) (Bertolini et al. [47]), and accessibility to the city center (N5) (Kim et al. [46], Bertolini et al. [47]) are five indicators.
- Place value reflects whether the built environment of the station area where the metro station is located is conducive to urban renewal. Building development intensity (P1) (Kim et al. [46]), building density (P2) (Lu et al. [48]), a functional mix of land use (P3) (Reusser et al. [45], Lu et al. [48]), number of place facilities (P4) (Lu et al. [48]), and population density (P5) (Reusser et al. [45]) are five indicators.
- Revenue value reflects the ability of the land and property value added generated in the process of urban renewal to feed back the investment in rail transit construction in the form of rent or sales profit in the future. Two indicators, land premium benefit (I1) (Salat et al. [7]) and property premium benefit (I2) (Salat et al. [7]), have been selected.
2.2.4. Site Clustering Method
3. Results
3.1. Indicator Results
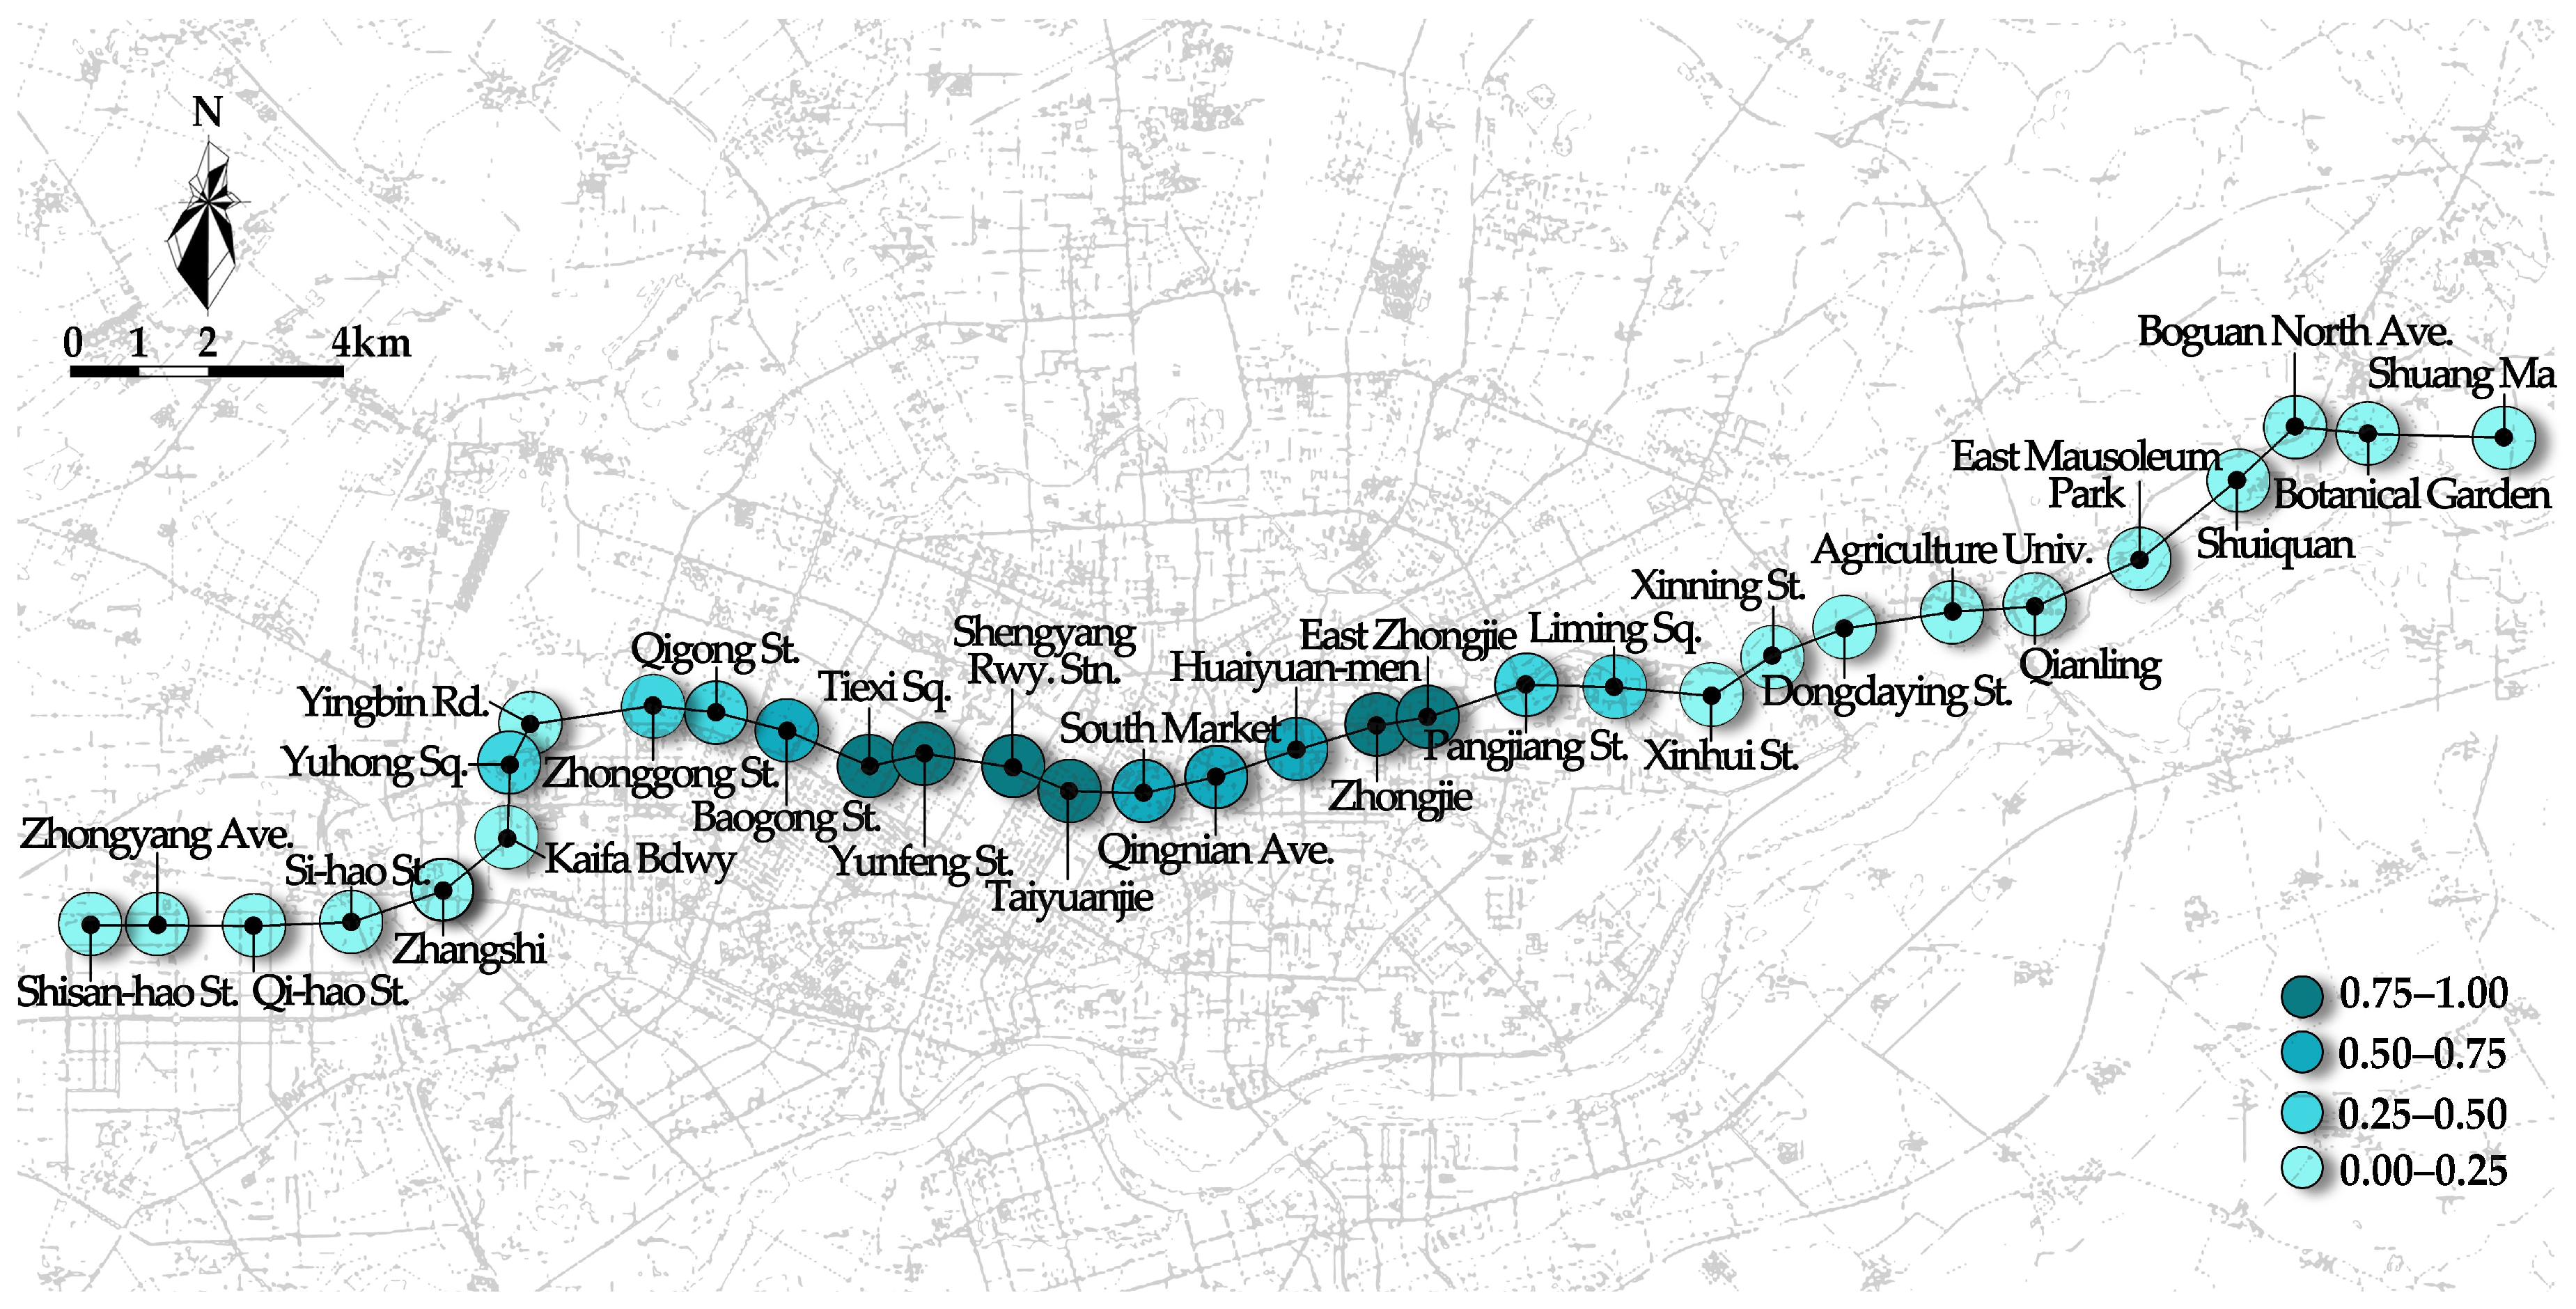
3.1.1. Node Value
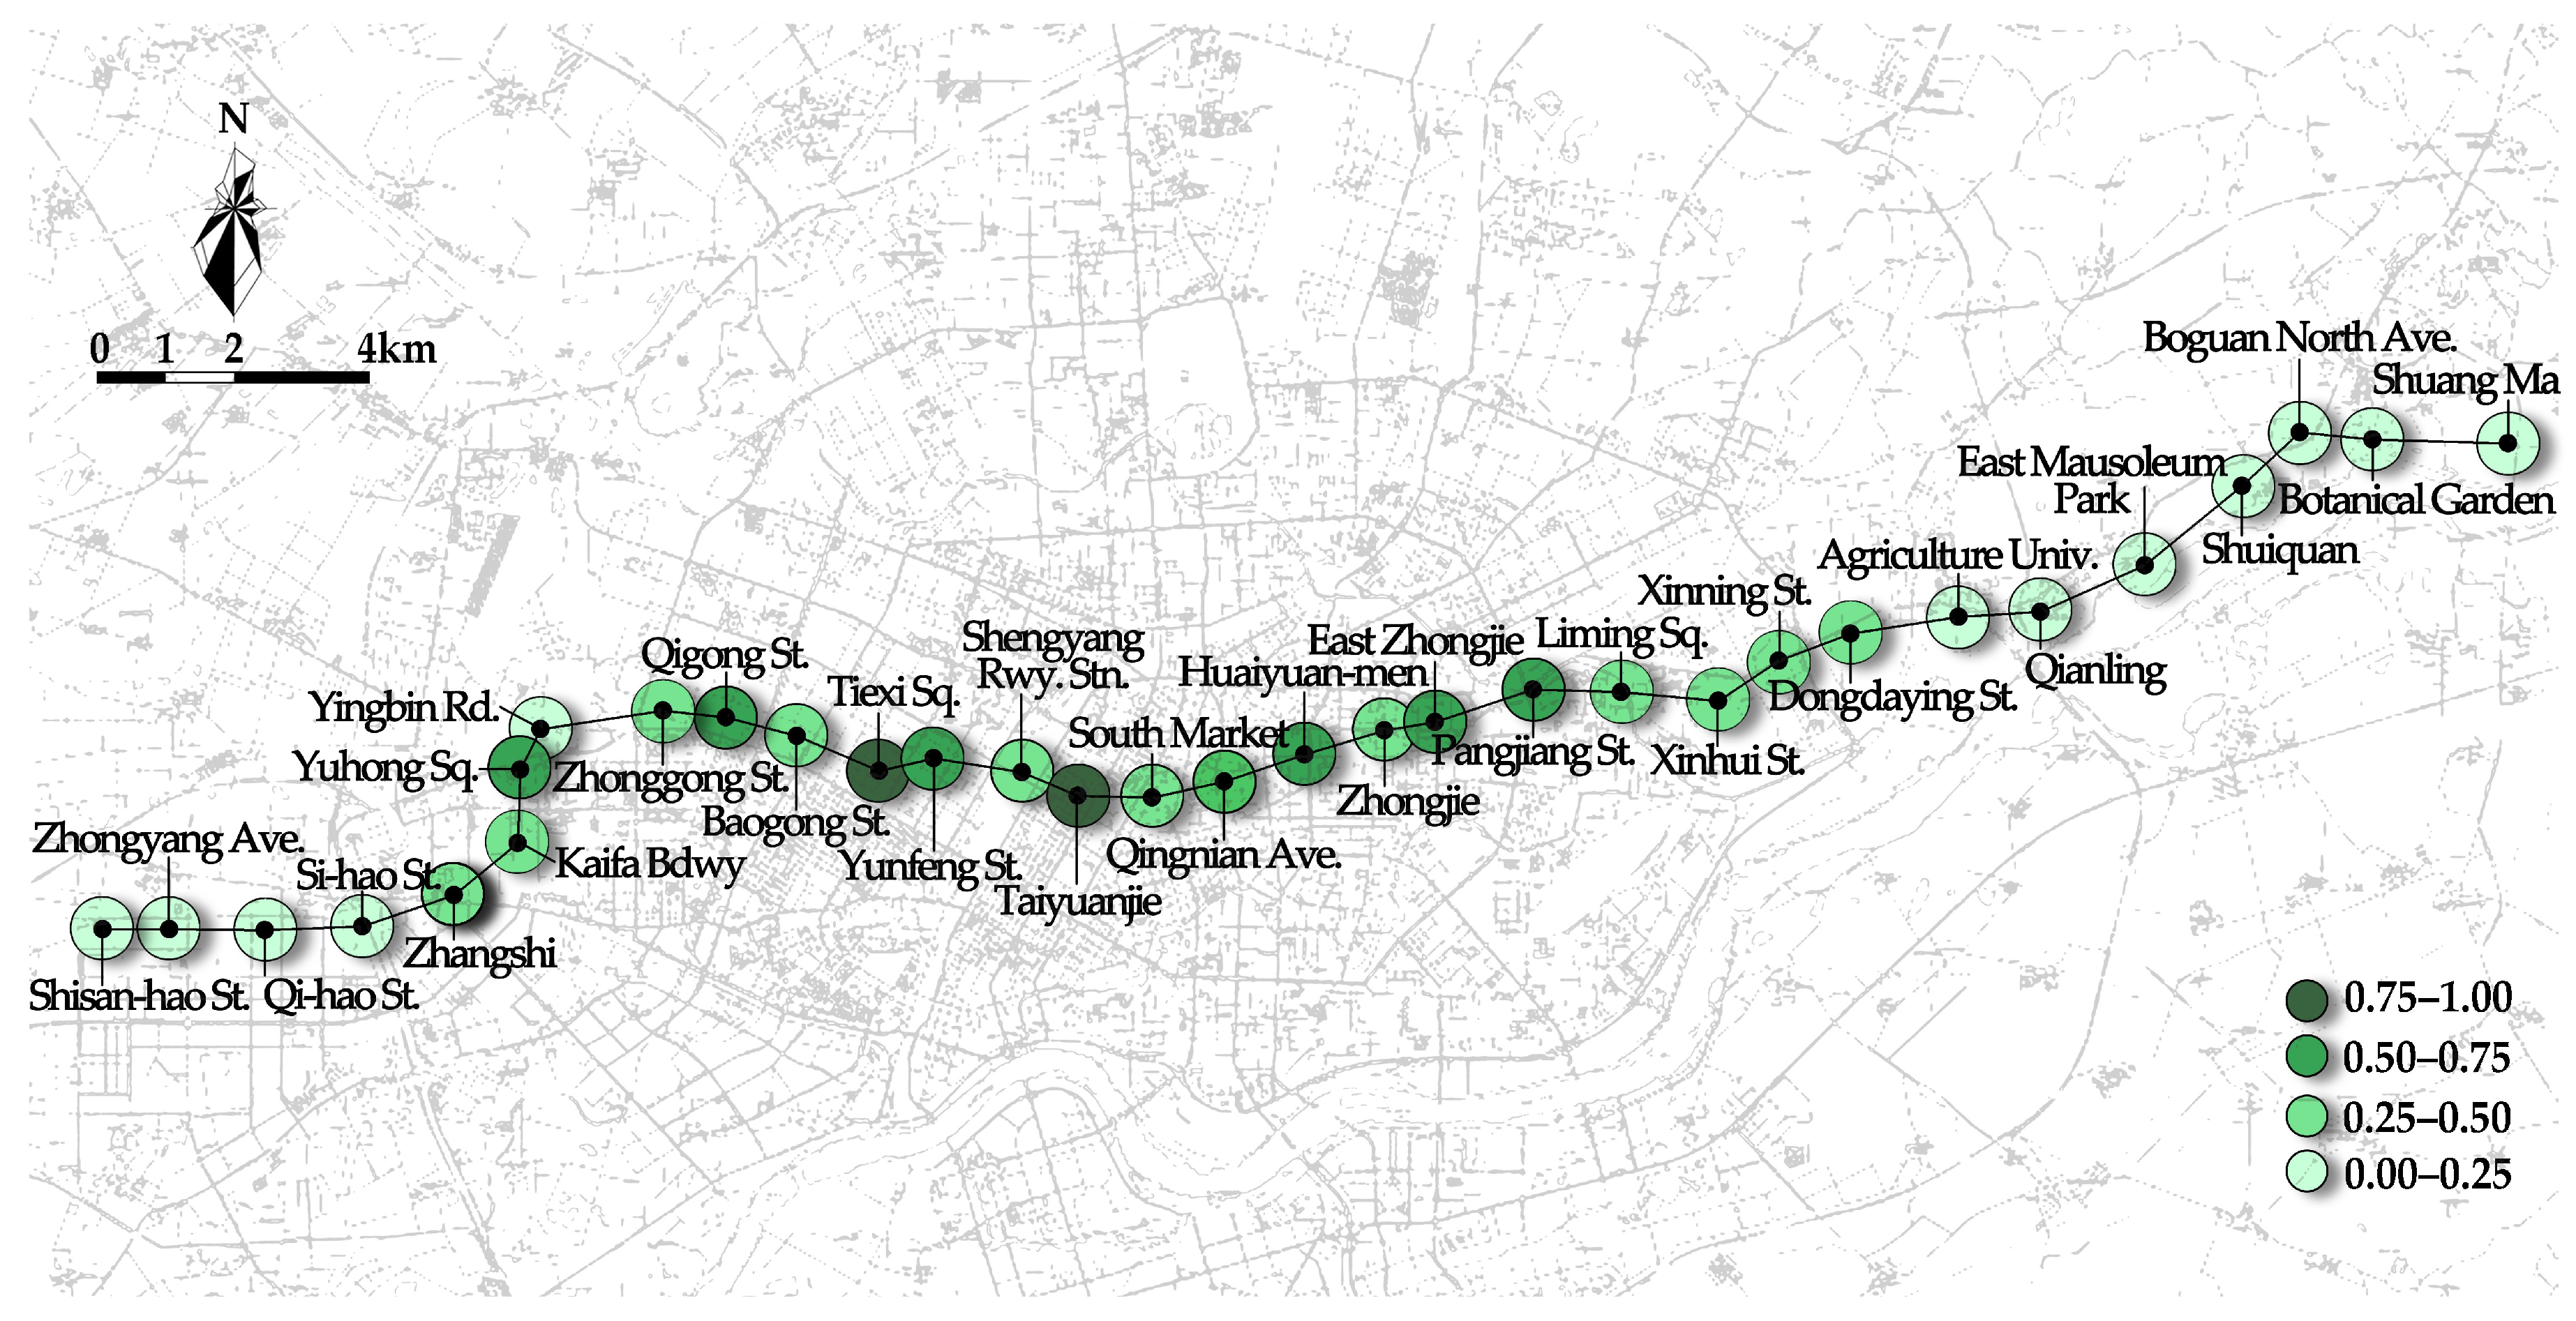
3.1.2. Place Value
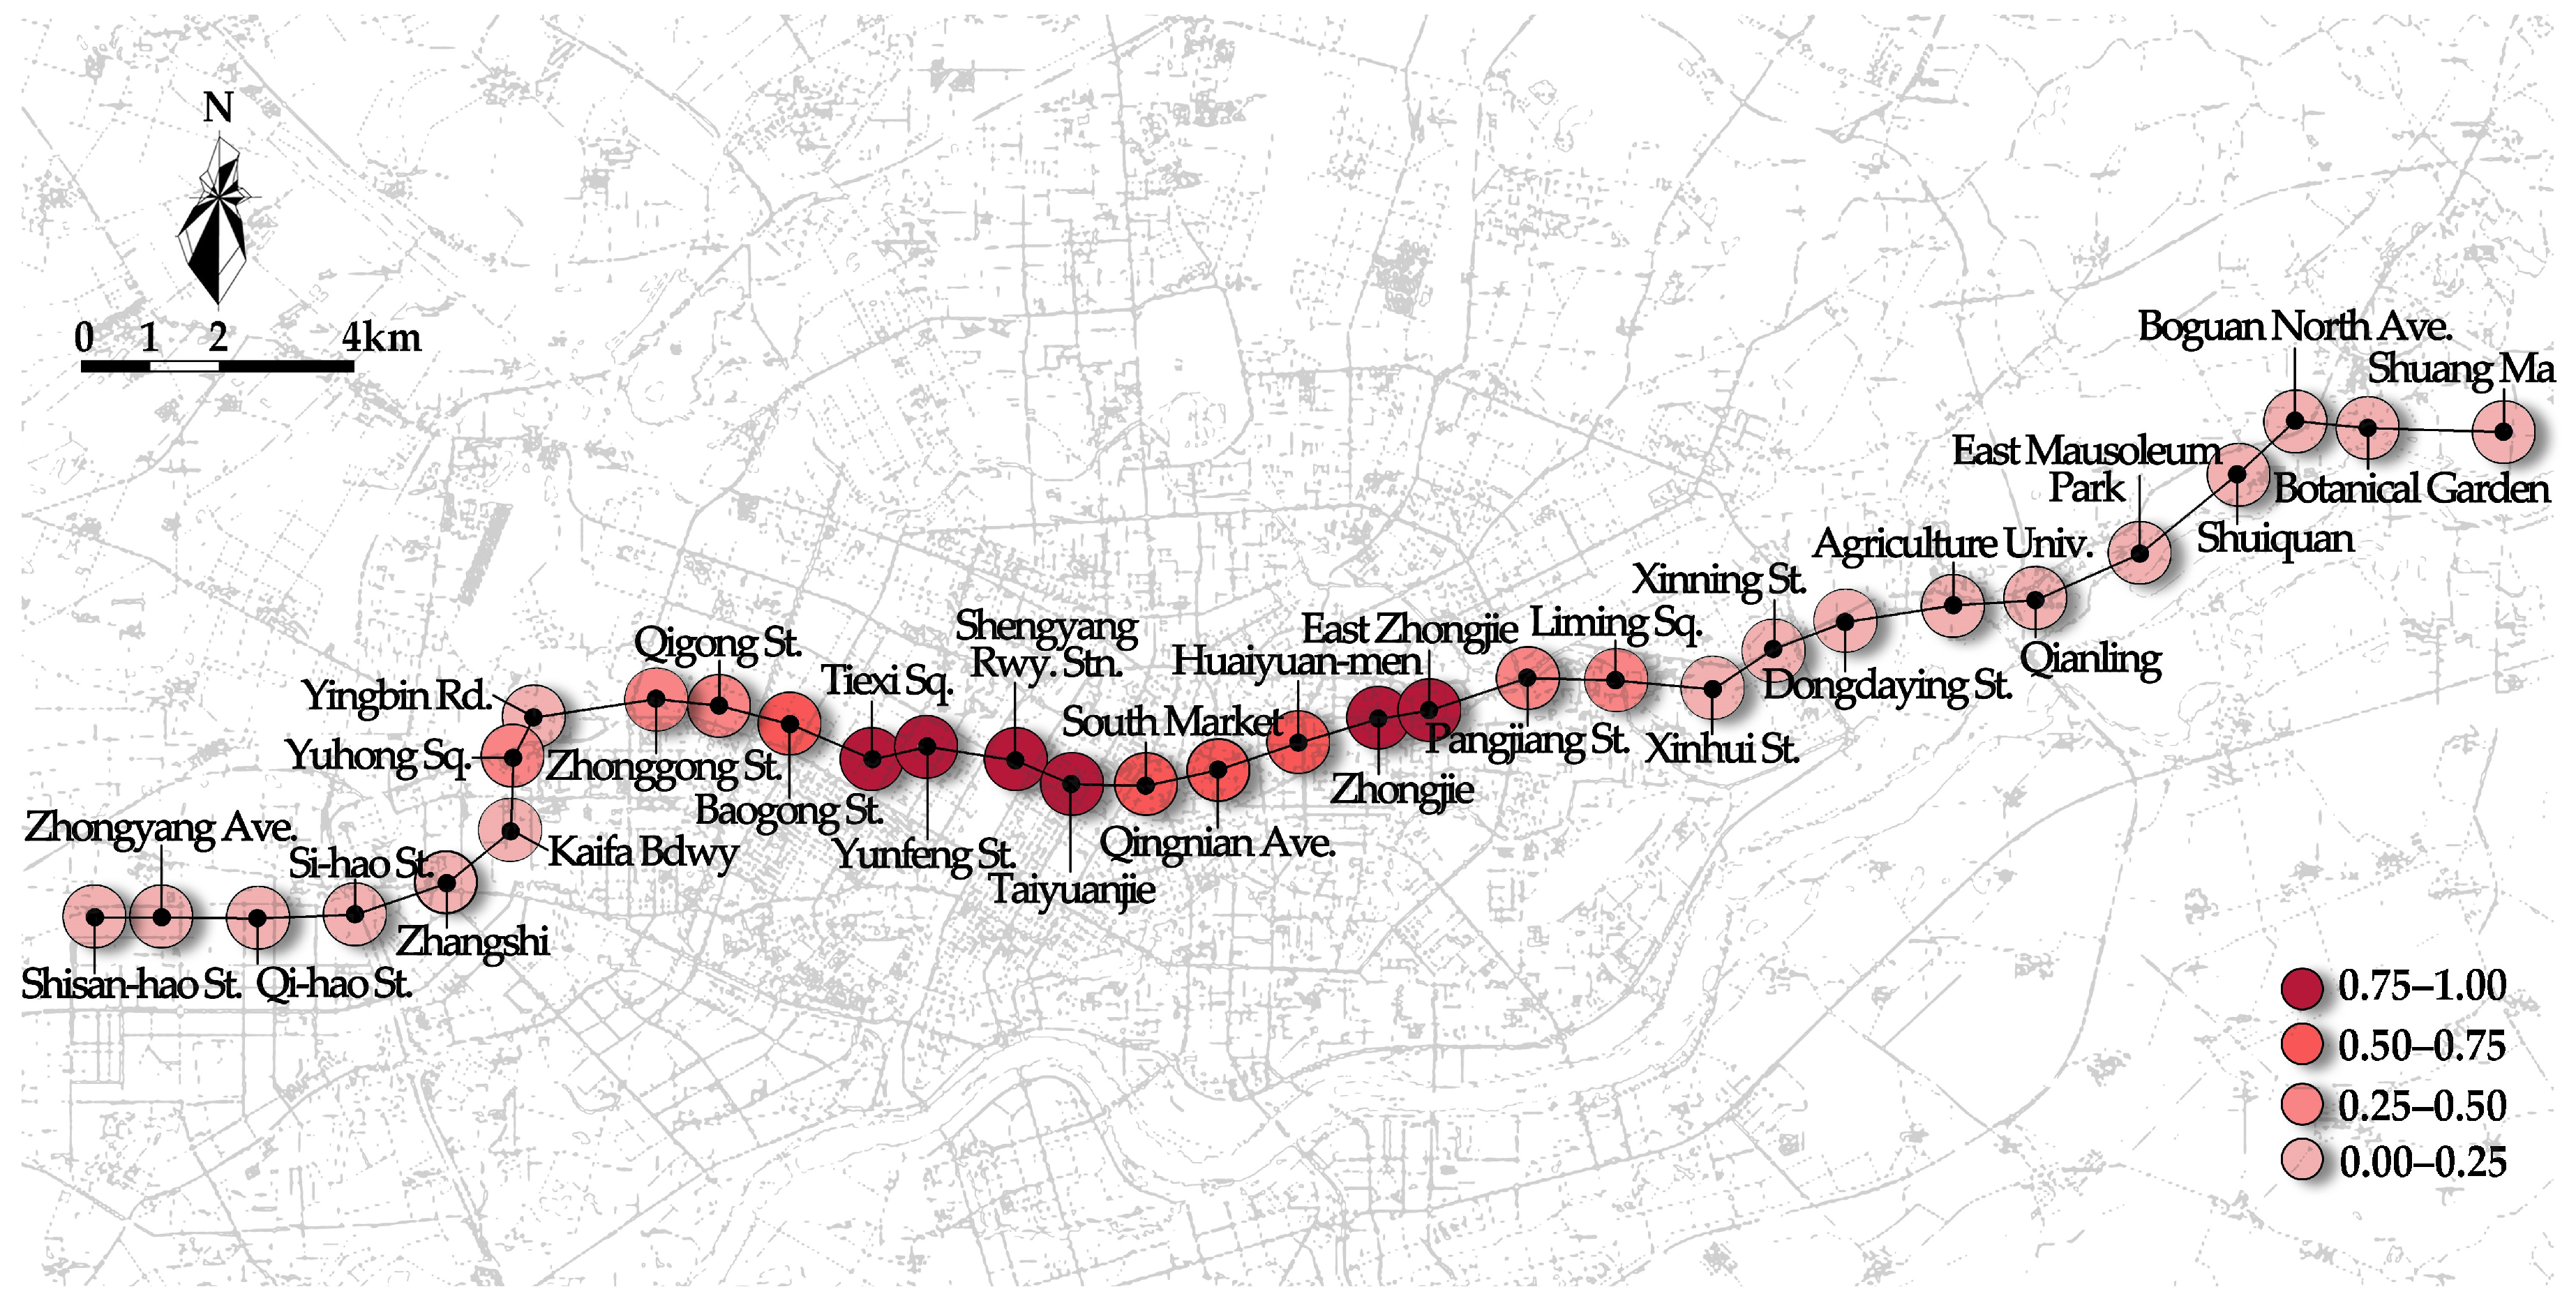
3.1.3. Revenue Value
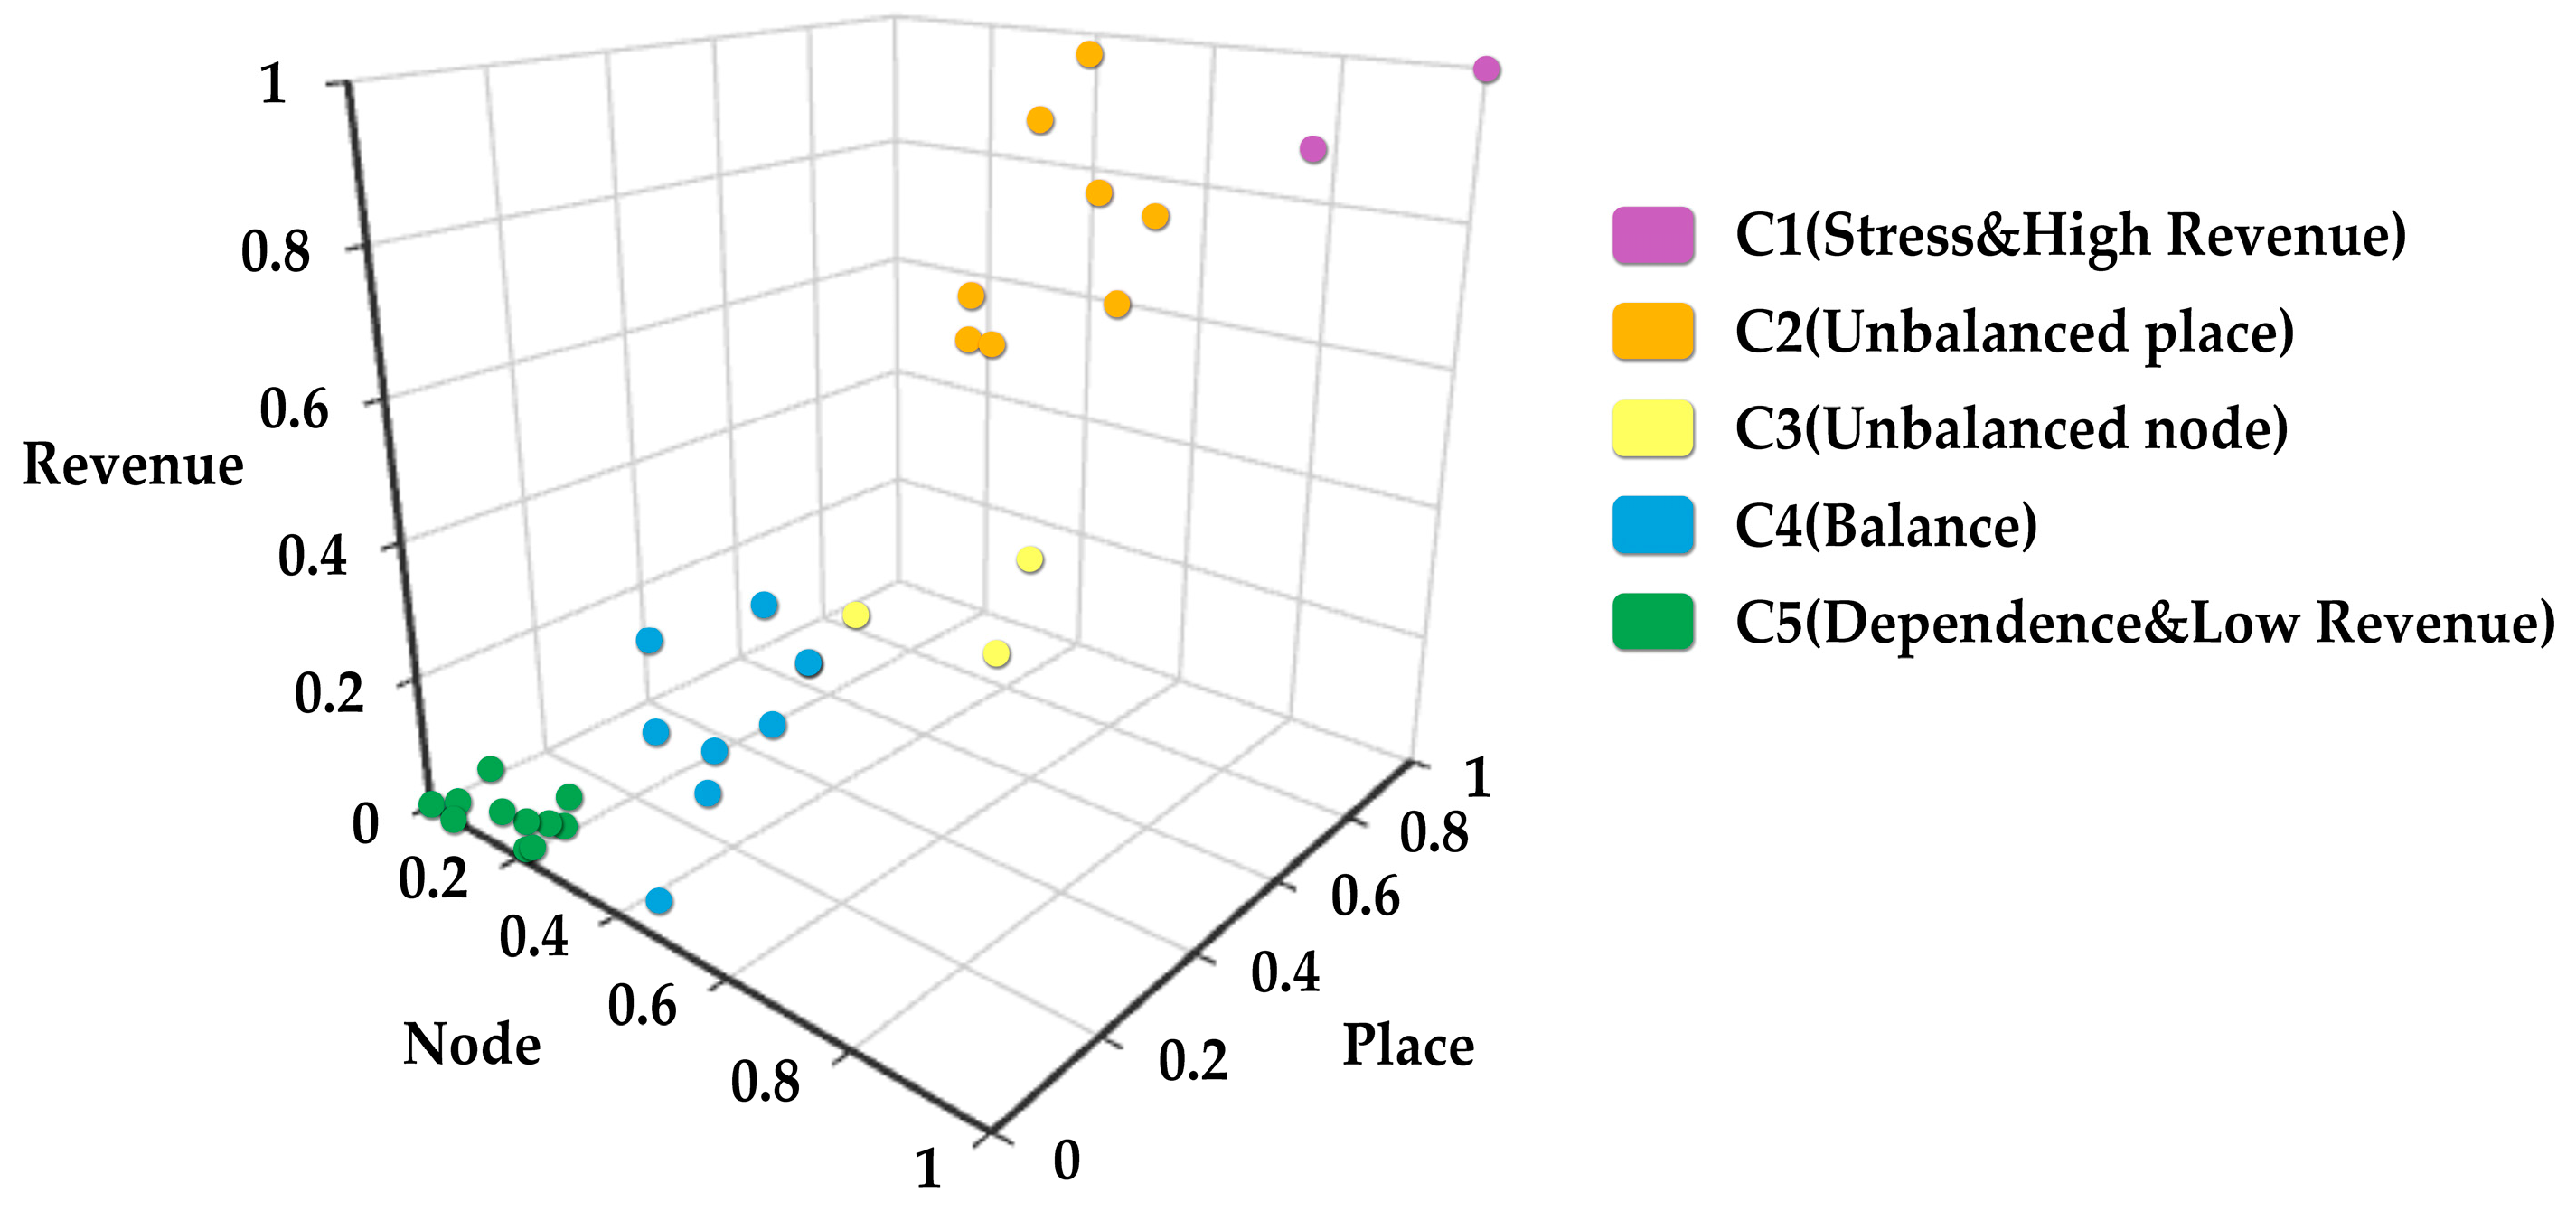
3.2. Cluster Results
3.2.1. Stress and High Revenue
3.2.2. Unbalanced Place
3.2.3. Unbalanced Node
3.2.4. Balance
3.2.5. Dependence and Low Revenue
4. Discussion
4.1. The Spatial Differentiation Characteristics of Multidimensional Value in Station Domain
4.2. Characteristics and Update Potential Evaluation of Station Domain Clustering
4.3. Differentiated Update Strategy for Site Domain Types
4.4. Limitations
5. Conclusions
- A three-dimensional evaluation system of TOD-guided urban renewal was constructed at the theoretical level. By interpreting the mechanism of rail-TOD-guided urban renewal, it was transformed into three dimensions and 12 indicators, among which the node dimension reflected the transportation service function and value of the subway station as an urban transportation node, the place dimension reflected whether the built environment of the station area where the subway station was located was conducive to urban renewal, and the revenue dimension demonstrated the economic and social benefits generated by urban renewal that could feed back into the investment in rail transit construction.
- We developed a quantitative analysis framework for urban renewal guided by rail TOD at the methodological level. Based on multi-source data, the node value, place value, and revenue value of 32 Shenyang Metro Line 1 stations were quantified. The K-means clustering method was applied to divide the stations into five categories: pressure and high revenue, unbalanced place, unbalanced node, balanced, and dependence and low revenue. The different types of stations exhibited significant spatial differentiation characteristics, providing a scientific basis for the development of differentiated renewal strategies.
- At the practical level, differentiated regeneration strategies were proposed. Based on the differences in the characteristics of five types of stations—stress and high revenue, balanced, unbalanced node, unbalanced place, and dependence and low revenue—it was proposed that targeted regeneration strategies can be explored from the perspectives of precise dissolution, node upgrading, function expansion, endogenous optimization, and infill and quality improvement. We also incorporated the exploration of policy instruments, synergistic mechanisms, and dynamic effectiveness indicators to enhance the relevance of the proposed strategies.
Author Contributions
Funding
Data Availability Statement
Acknowledgments
Conflicts of Interest
Abbreviations
| TOD | Transit-oriented development |
| NP | Node–Place |
| NPR | Node–Place–Revenue |
| LULM | Land-Use and Transportation Model |
| AHP | Analytic Hierarchy Process |
| POI | Point of interest |
| GIS | Geographic information system |
Appendix A
Appendix A.1

| Number | Station Name | Administrative District | Platform Type | Transfer Route |
|---|---|---|---|---|
| 1 | Shisan-hao St. | Tiexi District | Underground Side | - |
| 2 | Zhongyang Ave. | |||
| 3 | Qi-hao St. | |||
| 4 | Si-hao St. | |||
| 5 | Zhangshi | Underground Island | ||
| 6 | Kaifa Bdwy | Yu Hong District | ||
| 7 | Yuhong Sq. | |||
| 8 | Yingbin Rd. | |||
| 9 | Zhonggong St. | Tiexi District | ||
| 10 | Qigong St. | |||
| 11 | Baogong St. | |||
| 12 | Tiexi Sq. | Shenyang Metro Line 9 | ||
| 13 | Yunfeng St. | - | ||
| 14 | Shengyang Rwy. Stn. | Heping District | Shenyang Metro Line 5 (Planned) | |
| 15 | Taiyuanjie | Shenyang Metro Line 4 | ||
| 16 | South Market | - | ||
| 17 | Qingnian Ave. | Shenhe District | Shenyang Metro Line 2 | |
| 18 | Huaiyuan-men | - | ||
| 19 | Zhongjie | Shenyang Metro Line 6 (Planned) | ||
| 20 | East Zhongjie | Dadong District | - | |
| 21 | Pangjiang St. | Shenyang Metro Line 10 | ||
| 22 | Liming Sq. | Underground Side | - | |
| 23 | Xinhui St. | Shenhe District | Eastern Extension (Not Yet Opened) | |
| 24 | Xinning St. | |||
| 25 | Dongdaying St. | |||
| 26 | Agriculture Univ. | |||
| 27 | Qianling | Hunnan District | ||
| 28 | East Mausoleum Park | |||
| 29 | Shuiquan | |||
| 30 | Boguan North Ave. | |||
| 31 | Botanical Garden | |||
| 32 | Shuang Ma |
Appendix A.2

Appendix B
| Station Name | N1 | N2 | N3 | N4 | N5 | P1 | P2 | P3 | P4 | P5 | R1 | R2 |
|---|---|---|---|---|---|---|---|---|---|---|---|---|
| Shisan-hao St. | 0.50 | 0.00 | 0.12 | 0.31 | 0.00 | 0.03 | 0.21 | 0.70 | 0.01 | 0.37 | 0.00 | 0.50 |
| Zhongyang Ave. | 0.50 | 0.33 | 0.21 | 0.04 | 0.04 | 0.13 | 0.44 | 0.89 | 0.03 | 0.37 | 0.09 | 0.41 |
| Qi-hao St. | 0.50 | 0.33 | 0.33 | 0.04 | 0.11 | 0.01 | 0.13 | 0.87 | 0.03 | 0.49 | 0.08 | 0.45 |
| Si-hao St. | 0.50 | 0.33 | 0.17 | 0.23 | 0.17 | 0.12 | 0.30 | 0.87 | 0.04 | 0.60 | 0.05 | 0.46 |
| Zhangshi | 0.50 | 0.33 | 0.67 | 0.27 | 0.24 | 0.51 | 1.00 | 1.00 | 0.12 | 0.49 | 0.16 | 0.54 |
| Kaifa Bdwy | 0.26 | 0.33 | 0.67 | 0.23 | 0.30 | 0.39 | 0.67 | 1.00 | 0.16 | 0.54 | 0.22 | 0.50 |
| Yuhong Sq. | 0.26 | 0.33 | 0.79 | 0.77 | 0.37 | 0.45 | 0.62 | 0.91 | 0.34 | 0.51 | 0.33 | 0.38 |
| Yingbin Rd. | 0.26 | 0.33 | 0.37 | 0.04 | 0.41 | 0.35 | 0.74 | 0.89 | 0.23 | 0.31 | 0.16 | 0.18 |
| Zhonggong St. | 0.26 | 0.33 | 0.46 | 0.27 | 0.49 | 0.38 | 0.56 | 0.93 | 0.31 | 0.43 | 0.23 | 0.33 |
| Qigong St. | 0.26 | 0.33 | 0.96 | 0.58 | 0.54 | 0.57 | 0.56 | 0.91 | 0.43 | 0.40 | 0.46 | 0.23 |
| Baogong St. | 0.26 | 0.33 | 0.83 | 0.23 | 0.59 | 0.65 | 0.80 | 0.87 | 0.62 | 0.40 | 0.52 | 0.27 |
| Tiexi Sq. | 1.00 | 1.00 | 0.92 | 1.00 | 0.65 | 0.82 | 0.79 | 0.87 | 1.00 | 0.40 | 0.74 | 0.15 |
| Yunfeng St. | 0.00 | 0.33 | 1.00 | 0.19 | 0.69 | 0.84 | 0.73 | 0.96 | 0.81 | 0.71 | 0.70 | 0.35 |
| Shengyang Rwy. Stn. | 1.00 | 0.33 | 0.71 | 0.00 | 0.77 | 0.87 | 0.73 | 0.93 | 0.89 | 0.49 | 0.77 | 0.13 |
| Taiyuanjie | 0.26 | 1.00 | 1.00 | 0.62 | 0.81 | 1.00 | 0.76 | 1.00 | 0.89 | 0.60 | 1.00 | 0.13 |
| South Market | 0.00 | 0.33 | 0.92 | 0.00 | 0.86 | 0.81 | 0.84 | 0.96 | 0.67 | 0.66 | 0.56 | 0.21 |
| Qingnian Ave. | 0.50 | 1.00 | 0.67 | 0.12 | 0.91 | 0.66 | 0.71 | 0.91 | 0.63 | 0.46 | 0.76 | 0.17 |
| Huaiyuan-men | 0.26 | 0.33 | 0.92 | 0.42 | 0.97 | 0.74 | 0.85 | 0.89 | 0.70 | 0.34 | 0.75 | 0.07 |
| Zhongjie | 0.76 | 0.33 | 0.75 | 0.00 | 1.00 | 0.71 | 0.84 | 0.87 | 0.98 | 0.54 | 0.71 | 0.08 |
| East Zhongjie | 0.50 | 0.33 | 0.96 | 0.35 | 0.99 | 0.73 | 0.82 | 0.89 | 0.80 | 0.77 | 0.70 | 0.44 |
| Pangjiang St. | 0.26 | 1.00 | 0.83 | 0.12 | 0.92 | 0.49 | 0.68 | 0.91 | 0.33 | 0.40 | 0.41 | 0.30 |
| Liming Sq. | 0.50 | 0.33 | 0.71 | 0.23 | 0.86 | 0.43 | 0.66 | 0.87 | 0.27 | 0.37 | 0.25 | 0.35 |
| Xinhui St. | 0.26 | 0.33 | 0.50 | 0.08 | 0.79 | 0.42 | 0.84 | 1.00 | 0.16 | 0.54 | 0.34 | 0.61 |
| Xinning St. | 0.50 | 0.33 | 0.54 | 0.38 | 0.66 | 0.42 | 0.66 | 1.00 | 0.21 | 0.49 | 0.39 | 0.45 |
| Dongdaying St. | 0.26 | 0.33 | 0.25 | 0.58 | 0.66 | 0.23 | 0.60 | 0.96 | 0.02 | 0.29 | 0.12 | 0.22 |
| Agriculture Univ. | 0.26 | 0.33 | 0.08 | 0.27 | 0.60 | 0.18 | 0.49 | 1.00 | 0.07 | 0.29 | 0.12 | 0.16 |
| Qianling | 0.26 | 0.33 | 0.12 | 0.27 | 0.55 | 0.22 | 0.37 | 1.00 | 0.04 | 0.23 | 0.10 | 0.10 |
| East Mausoleum Park | 0.26 | 0.33 | 0.17 | 0.19 | 0.47 | 0.00 | 0.01 | 0.57 | 0.01 | 0.00 | 0.01 | 0.00 |
| Shuiquan | 0.50 | 0.33 | 0.04 | 0.00 | 0.36 | 0.10 | 0.18 | 0.43 | 0.06 | 0.66 | 0.07 | 1.00 |
| Boguan North Ave. | 0.50 | 0.33 | 0.00 | 0.00 | 0.28 | 0.12 | 0.17 | 0.39 | 0.00 | 0.43 | 0.07 | 0.53 |
| Botanical Garden | 0.26 | 0.33 | 0.04 | 0.00 | 0.21 | 0.19 | 0.28 | 0.46 | 0.01 | 1.00 | 0.03 | 0.94 |
| Shuang Ma | 0.26 | 0.00 | 0.00 | 0.00 | 0.11 | 0.00 | 0.00 | 0.00 | 0.00 | 0.00 | 0.00 | 0.79 |
References
- Cao, K.; Deng, Y.; Song, C. Exploring the drivers of urban renewal through comparative modeling of multiple types in Shenzhen. Cities 2023, 137, 104294. [Google Scholar] [CrossRef]
- Suzuki, H.; Cervero, R.; Iuchi, K. Transforming Cities with Transit: Transit and Land-Use Integration for Sustainable Urban Development; World Bank Publications: Washington, DC, USA, 2013. [Google Scholar]
- Xu, W.; Guthrie, A.; Fan, Y.; Li, Y. Transit-oriented development in China: Literature review and evaluation of TOD potential across 50 Chinese cities. J. Transp. Land Use 2017, 10, 743–762. [Google Scholar] [CrossRef]
- Wang, L.; Xia, H. A Comprehensive Review of the Development Characteristics and Future Trends of TOD in Chinese Urban Rail Transit. Urban Rail Transit 2024, 10, 335–349. [Google Scholar] [CrossRef]
- Chinese Ministry of Housing and Urban-Rural Development. Guidelines for Planning and Design of Areas Along the Urban Rail Transit; Chinese Ministry of Housing and Urban-Rural Development: Beijing, China, 2015.
- Hua, X.Y.; Cheng, L.; Bai, H. Thinking on application of transit oriented development in Chinese cities. Transp. Stand. 2009, 200, 80–84. [Google Scholar]
- Salat, S.; Ollivier, G. Transforming the Urban Space Through Transit-Oriented Development: The 3V Approach; World Bank: Washington, DC, USA, 2017. [Google Scholar]
- Sharma, R.; Newman, P. Can land value capture make PPP’s competitive in fares? A Mumbai case study. Transp. Policy 2018, 64, 123–131. [Google Scholar] [CrossRef]
- Li, X.; Yuan, J.; Liu, X.; Ke, Y.; Jia, S. Identifying critical influencing factors of the value creation of urban rail transit PPP projects in China. Buildings 2022, 12, 1080. [Google Scholar] [CrossRef]
- Douglas, G.C. Rail transit identification and neighbourhood identity. Exploring the potential for ‘community-supportive transit’. J. Urban Des. 2010, 15, 175–193. [Google Scholar] [CrossRef]
- Ibeas, Á.; Cordera, R.; dell’Olio, L.; Coppola, P.; Dominguez, A. Modelling transport and real-estate values interactions in urban systems. J. Transp. Geogr. 2012, 24, 370–382. [Google Scholar] [CrossRef]
- Calthorpe, P. The Next American Metropolis: Ecology, Community, and the American Dream; Princeton Architectural Press: Princeton, NJ, USA, 1993; ISBN 1-878271-68-7. [Google Scholar]
- Cervero, R.; Kockelman, K. Travel demand and the 3Ds: Density, diversity, and design. Transp. Res. Part D 1997, 2, 199–219. [Google Scholar] [CrossRef]
- Ewing, R.; Cervero, R. Travel and the Built Environment. J. Am. Plan. Assoc. 2010, 76, 265–294. [Google Scholar] [CrossRef]
- Jamme, H.-T.; Rodriguez, J.; Bahl, D.; Banerjee, T. A twenty-five-year biography of the TOD concept: From design to policy, planning, and implementation. J. Plan. Educ. Res. 2019, 39, 409–428. [Google Scholar] [CrossRef]
- Aston, L.; Currie, G.; Pavkova, K. Does transit mode influence the transit-orientation of urban development?—An empirical study. Transp. Geogr. 2016, 55, 83–91. [Google Scholar] [CrossRef]
- Stover, V.G. Transportation and Land Development—Transportation Research Board Special Report; National Academy of Science: Washington, DC, USA, 1987. [Google Scholar]
- Handy, S. Smart growth and the transportation-land use connection: What does the research tell us? Int. Reg. Sci. Rev. 2025, 28, 146–167. [Google Scholar] [CrossRef]
- Frank, L.D. Land Use and Transportation Interaction: Implications on Public Health and Quality of Life. Plan. Educ. Res. 2000, 20, 6–22. [Google Scholar] [CrossRef]
- Dittmar, H. A broader context for transportation planning: Not just an end in itself. J. Am. Plan. Assoc. 1995, 61, 7–13. [Google Scholar] [CrossRef]
- Olawepo, R.A. Perspectives on urban renewal and transportation development in Lagos: Implications for urban development in Nigeria. Afr. Res. Rev. 2010, 4, 273–287. [Google Scholar] [CrossRef]
- Shin, Y. Urban Regeneration Strategies of local Metropolitan Cities’ Railway Stations and the Surroundings in Japan. J. Asia 2011, 14, 79–99. [Google Scholar]
- Dai, P.; Fu, H.; Yang, X.; Han, S.; Fu, G.; Wang, Y. Exploring the urban renewal strategy based on transit-oriented development concept—A case study of Japan and Hong Kong. Front. Mater. 2023, 10, 1098027. [Google Scholar] [CrossRef]
- Sho, K.; Zhu, J. Are Urban Renewal Projects in Taipei City Transit Oriented? Jpn. Archit. Rev. 2025, 8, e70016. [Google Scholar] [CrossRef]
- Mocák, P.; Matlovicova, K.; Matlovic, R.; Pénzes, J.; Pachura, P.; Mishra, P.K.; Kostilnikova, K.; Demková, M. 15-minute City Concept as a Sustainable Urban Development Alternative: A Brief Outline of Conceptual Frameworks and Slovak Cities as a Case. Folia Geogr. 2022, 64, 69–89. [Google Scholar]
- Moreno, C.; Allam, Z.; Chabaud, D.; Gall, C.; Pratlong, F. Introducing the “15-Minute City”: Sustainability, resilience and place identity in future post-pandemic cities. Smart Cities 2021, 4, 93–111. [Google Scholar] [CrossRef]
- Bertolini, L.; Spit, T. Cities on Rails: The Redevelopment of Railway Stations and Their Surroundings; Routledge: London, UK, 1998; ISBN 1135811253. [Google Scholar]
- Lyu, G.; Bertolini, L.; Pfeffer, K. Developing a TOD typology for Beijing metro station areas. Transp. Geogr. 2016, 55, 40–50. [Google Scholar] [CrossRef]
- Vale, D.S.; Viana, C.M.; Pereira, M. The extended node-place model at the local scale: Evaluating the integration of land use and transport for Lisbon’s subway network. Transp. Geogr. 2018, 69, 282–293. [Google Scholar] [CrossRef]
- Cao, Z.; Asakura, Y.; Tan, Z. Coordination between node, place, and ridership: Comparing three transit operators in Tokyo. Transp. Res. Part D 2020, 87, 102518. [Google Scholar] [CrossRef]
- Rodriguez, D.A.; Kang, C.D. A typology of the built environment around rail stops in the global transit-oriented city of Seoul, Korea. Cities 2020, 100, 102663. [Google Scholar] [CrossRef]
- Turbay, A.L.; Pereira, R.H.; Firmino, R. The equity implications of TOD in Curitiba. Case Stud. Transp. Policy 2024, 16, 101211. [Google Scholar] [CrossRef]
- Mulley, C.; Tsai, C.H.P. When and how much does new transport infrastructure add to property values? Evidence from the bus rapid transit system in Sydney, Australia. Transp. Policy 2016, 51, 15–23. [Google Scholar] [CrossRef]
- Cervero, R.; Murakami, J. Rail and property development in Hong Kong: Experiences and extensions. Urban Stud. 2009, 46, 2019–2043. [Google Scholar] [CrossRef]
- Yang, L.; Chen, Y.; Xu, N.; Zhao, R.; Chau, K.W.; Hong, S. Place-varying impacts of urban rail transit on property prices in Shenzhen, China: Insights for value capture. Sustain. Cities Soc. 2020, 58, 102140. [Google Scholar] [CrossRef]
- Mittal, J.; Berson, S. Sustainable Urbanism in Developing Countries, 3rd ed.; CRC Press: Boca Raton, FL, USA, 2022; pp. 143–165. [Google Scholar]
- Yi, Z.; Zhang, Z.; Wang, H. Measuring metro station area’s TODness: An exploratory study of Shenyang based on multi-source urban data. Trans. GIS 2024, 28, 623–653. [Google Scholar] [CrossRef]
- Wu, W.; Divigalpitiya, P. Assessment of Accessibility and Activity Intensity to Identify Future Development Priority TODs in Hefei City. Land 2022, 11, 1590. [Google Scholar] [CrossRef]
- Zhao, J.; Deng, W.; Song, Y.; Zhu, Y. What influences Metro station ridership in China? Insights from Nanjing. Cities 2013, 35, 114–124. [Google Scholar] [CrossRef]
- Chen, H.; Zhao, K.; Zhang, Z.; Zhang, H.; Lu, L. Methods for the Performance Evaluation and Design Optimization of Metro Transit-Oriented Development Sites Based on Urban Big Data. Land 2024, 13, 1233. [Google Scholar] [CrossRef]
- OpenStreetMap. Available online: https://www.openstreetmap.org (accessed on 4 May 2025).
- Amap. Available online: https://www.amap.com (accessed on 4 May 2025).
- Lianjia. Available online: https://bj.lianjia.com (accessed on 4 May 2025).
- Swguancha. Available online: https://www.swguancha.com (accessed on 4 May 2025).
- Reusser, D.E.; Loukopoulos, P.; Stauffacher, M.; Scholz, R.W. Classifying railway stations for sustainable transitions–balancing node and place functions. Transp. Geogr. 2008, 16, 191–202. [Google Scholar] [CrossRef]
- Kim, J.S.; Shin, N. Planning for Railway Station Network Sustainability Based on Node–Place Analysis of Local Stations. Sustainability 2021, 13, 4778. [Google Scholar] [CrossRef]
- Bertolini, L.; Le Clercq, F.; Kapoen, L. Sustainable accessibility: A conceptual framework to integrate transport and land use plan-making. Two test-applications in the Netherlands and a reflection on the way forward. Transp. Policy 2005, 12, 207–220. [Google Scholar] [CrossRef]
- Lu, X.; Wang, J.; Zhang, Z.; Hu, X.; Guo, H. Evaluation and classification of Beijing rail microcenter subway stations based on extended node-place model. Sci. Technol. Rev. 2023, 41, 41–51. [Google Scholar]
- Saardchom, N. The validation of analytic hierarchy process (AHP) scoring model. Int. J. Liab. Sci. Enq. 2012, 5, 163–179. [Google Scholar] [CrossRef]
- Li, J.; Shen, Z.; Ma, J.; Hao, Y.; Zeng, R.; Lin, Z. Evaluation of Sustainable Development Potential of Railway Station Areas in Guangzhou Metropolitan Area: Based on the Extended “Node–Place–Support” Model. Land 2025, 14, 369. [Google Scholar] [CrossRef]
- Teng, L.; Zhong, C.; Cai, D. Study on the Spatial Type Differentiation of Guangzhou Metro TOD Zones: Based on” Node-Place-Linkage” Coupling Model. Econ. Geogr. 2023, 42, 103–111. [Google Scholar]
- Guo, R.; Song, X.; Li, P.; Wu, G.; Guo, Z. Large-Scale and Refined Green Space Identification-Based Sustainable Urban Renewal Mode Assessment. Math. Probl. Eng. 2020, 2020, 2043019. [Google Scholar] [CrossRef]
- Yang, L.; Song, X. TOD typology based on urban renewal: A classification of metro stations for Ningbo city. Urban Rail Transit 2021, 7, 240–255. [Google Scholar] [CrossRef] [PubMed]
- Arthur, D.; Vassilvitskii, S. K-Means++: The Advantages of Careful Seeding; Stanford University: Stanford, CA, USA, 2006. [Google Scholar]
- Yang, W.; Yan, W.; Chen, L.; Li, H. From city center to suburbs: Developing a timeline-based TOD assessment model to explore the dynamic changes in station areas of Tokyo metropolitan area. Environ. Plan. B Urban Anal. City Sci. 2024, 52, 214–230. [Google Scholar] [CrossRef]
- Zhang, S.; Huang, Z.; Zhao, K. Research on the Coordinated Development of “Node-Place” in Intercity Railway Station Areas: A Case Study of the Guangdong–Hong Kong–Macao Greater Bay Area, China. ISPRS Int. J. Geo-Inf. 2025, 14, 121. [Google Scholar]
- Zhang, Y.; Qin, M. Applying “Node-Place-Value (NPV)” Model on the Renewal of Suburban Areas Along Rail Transit Lines. In Proceedings of the 2024 2nd International Conference on Big Data and Privacy Computing (BDPC), Macau, China, 10–12 January 2024; pp. 148–153. [Google Scholar]
- Zhu, K.; Chen, W.; Zhang, Y. Development Coordination of Chinese Megacities Using the Node–Place–Value Model: A Case Study of Changsha. Urban Sci. 2025, 9, 121. [Google Scholar] [CrossRef]
- Yang, Y.; Zhong, C.; Gao, Q.L. An extended node-place model for comparative studies of transit-oriented development. Transp. Res. Part D Transp. Environ. 2022, 113, 103514. [Google Scholar] [CrossRef]
- Dou, M.; Wang, Y.; Dong, S. Integrating network centrality and node-place model to evaluate and classify station areas in Shanghai. ISPRS Int. J. Geo-Inf. 2021, 10, 414. [Google Scholar] [CrossRef]
- Nemroudi, R.; Ortuño, A.; Flor, M.; Guirao, B. Application of the Node–Place Model in Algiers (Algeria). Sustainability 2024, 16, 6428. [Google Scholar] [CrossRef]
- Dai, P.; Bi, L.; Cen, S.; Fu, G.; Fang, H.; Wang, Y. Research on the Coupling Relationship Between Park and Metro Station Space in Qingdao. Sustainability 2025, 17, 3029. [Google Scholar] [CrossRef]
- Reggiani, M. Urban Regeneration Strategies and Place Development in Contemporary Tokyo: The Case of Shibuya Station Area. J. Place Manag. Dev. 2022, 15, 40–54. [Google Scholar] [CrossRef]


| Name | Field | Source |
|---|---|---|
| Rail Transit Station Data | Station Name, Latitude, and Longitude | Open street map [41] |
| Rail Transit Line Data | Line Name, Latitude, and Longitude | Amap [42] |
| Bus Station Data | Station Name, Latitude, and Longitude | Amap |
| Bus Line Data | Line Name, Latitude, and Longitude | Amap |
| POIs Around Stations | Name, Category, Latitude, and Longitude | Open street map |
| Building Data | Height, Type, Area, Location | Open street map |
| Land Use Data | Type, Area | Open street map |
| Real Estate Data | Name, Price | Lianjia [43] |
| Population Data | Population, Location | Swguancha [44] |
| Target Layer | Indicator Layer | Indicator Description | Weight | Attribute |
|---|---|---|---|---|
| Node Value | Number of Station Entrances/Exits (N1) | The number of entrances and exits at the station. | 0.14 | Forward direction |
| Number of Service Directions (N2) | Terminal stations have 1 direction; additional transfer lines increase number of directions by 2. | 0.32 | Forward direction | |
| Number of Bus Stops in the Area (N3) | The count of bus stops within the station’s vicinity. | 0.22 | Forward direction | |
| Bus Transfer Convenience (N4) | The number of bus transfer routes within 200 m of the station. | 0.26 | Forward direction | |
| Accessibility to City Center (N5) | Distance from each station to the city center (Zhongjie). | 0.07 | Positive direction | |
| Place Value | Building Development Intensity (P1) | The ratio of total building floor area to the total land area. | 0.13 | Forward direction |
| Building Density (P2) | The ratio of building footprint area to the total land area. | 0.12 | Forward direction | |
| Land Use Function Mix (P3) | Calculated using the entropy method for POI land use mix. () | 0.31 | Forward direction | |
| Number of Facilities (P4) | The count of POIs within the station area. | 0.25 | Forward direction | |
| Population Density (P5) | The ratio of the population in the station area to the total land area. | 0.19 | Forward direction | |
| Revenue Value | Land Premium Benefit (R1) | Calculated based on empirical values from urban rail transit premium effect assessments. | 0.53 | Forward direction |
| Property Premium Benefit (R2) | The ratio of average housing prices within 500 m to those within 500–800 m of the station. | 0.47 | Forward direction |
| Cluster | Centroid | Cluster Distribution | ||||||
|---|---|---|---|---|---|---|---|---|
| Node | Place | Revenue | Number of Cases (Units) | Proportion (%) | ||||
| Average Value | Standard Deviation | Average Value | Standard Deviation | Average Value | Standard Deviation | |||
| Cluster 1 | 0.91 | 0.13 | 0.95 | 0.08 | 0.95 | 0.08 | 2.00 | 0.06 |
| Cluster 2 | 0.50 | 0.11 | 0.76 | 0.13 | 0.76 | 0.13 | 8.00 | 0.25 |
| Cluster 3 | 0.66 | 0.12 | 0.37 | 0.06 | 0.37 | 0.06 | 3.00 | 0.09 |
| Cluster 4 | 0.39 | 0.09 | 0.19 | 0.09 | 0.19 | 0.09 | 8.00 | 0.25 |
| Cluster 5 | 0.14 | 0.09 | 0.03 | 0.02 | 0.03 | 0.02 | 11.00 | 0.34 |
| Station Type | Stress and High Revenue | Unbalanced Place | Unbalanced Node | Balance | Dependence and Low Revenue |
|---|---|---|---|---|---|
| Key Characteristics | Urban core with high pedestrian and vehicular traffic, peak land value | Urban centers with strong place functions but weak node functions | City center fringe, with strong transportation but weak service functions | Suburban areas with a balanced work and residence profile but with demand for upgrading | Urban fringe, lagging in development, low financial returns but high social demand |
| Renewal Strategy | Precise deconcentration | Node upgrades | Function expansion | Endogenous optimization | Infill quality improvement |
| Policy Tools | Congestion charging, plot ratio transfer, air rights sale | Microcirculation public transportation subsidy | Functional replacement tax deduction, temporary land use permit | Incremental tax financing and flexible control of mixed land use | Land allocation + franchising, tax exemption period + small and micro loans |
| Stakeholder Collaboration Mechanism | Developer: Underground Link Construction (Hong Kong) Rail Company: Integrated Interchange Hub (Shanghai) | Neighborhood Council: Slow Path Optimization (Shanghai) Bus Company: Microcirculation Routes (Singapore) | Artists: Public Space Revitalization (Tokyo) Community: Shared Facility Operation (Beijing) | Merchants Union: Street Renewal (Barcelona) Transportation Bureau: Bus Optimization (Chengdu) | Government: subsidized schools/hospitals (Guangzhou) Social organizations: tourism training (Kyoto) |
| Performance Metrics | Short-term: 20% reduction in congestion Long-term: commercial rents balanced with commuter efficiency | Short-term: 30% increase in feeder satisfaction Long-term: ≥40% share of non-commuter commercial revenue | Short-term: 50% increase in non-commuter traffic Long-term: destination station conversion rate achieved | Short-term: job-to-life ratio of 1.2 to 1.0 Long-term: 30% increase in business diversity index | Short-term: 200 new jobs Long-term: ≥30% of earnings from specialty industries |
Disclaimer/Publisher’s Note: The statements, opinions and data contained in all publications are solely those of the individual author(s) and contributor(s) and not of MDPI and/or the editor(s). MDPI and/or the editor(s) disclaim responsibility for any injury to people or property resulting from any ideas, methods, instructions or products referred to in the content. |
© 2025 by the authors. Licensee MDPI, Basel, Switzerland. This article is an open access article distributed under the terms and conditions of the Creative Commons Attribution (CC BY) license (https://creativecommons.org/licenses/by/4.0/).
Share and Cite
Lu, X.; Zhu, M.; Li, Z.; Li, Q.; Huang, S. Urban Renewal Strategy Guided by Rail Transit Development Based on the “Node–Place–Revenue” Model: Case Study of Shenyang Metro Line 1. Land 2025, 14, 1214. https://doi.org/10.3390/land14061214
Lu X, Zhu M, Li Z, Li Q, Huang S. Urban Renewal Strategy Guided by Rail Transit Development Based on the “Node–Place–Revenue” Model: Case Study of Shenyang Metro Line 1. Land. 2025; 14(6):1214. https://doi.org/10.3390/land14061214
Chicago/Turabian StyleLu, Xu, Mengqin Zhu, Zeting Li, Qingyu Li, and Shan Huang. 2025. "Urban Renewal Strategy Guided by Rail Transit Development Based on the “Node–Place–Revenue” Model: Case Study of Shenyang Metro Line 1" Land 14, no. 6: 1214. https://doi.org/10.3390/land14061214
APA StyleLu, X., Zhu, M., Li, Z., Li, Q., & Huang, S. (2025). Urban Renewal Strategy Guided by Rail Transit Development Based on the “Node–Place–Revenue” Model: Case Study of Shenyang Metro Line 1. Land, 14(6), 1214. https://doi.org/10.3390/land14061214