Article

An Assessment of the N Load from Animal Farms in Saline Wetland Catchments in the Ebro Basin, NE Spain

1
Estación Experimental de Aula Dei, EEAD-CSIC, Ave. Montañana 1005, 50059 Zaragoza, Spain
2
Department of Chemistry, Physics, Environmental and Soil Sciences, University of Lleida, Ave. Alcalde Rovira Roure 191, 25198 Lleida, Spain
*
Author to whom correspondence should be addressed.
Land 2025, 14(6), 1170; https://doi.org/10.3390/land14061170
Submission received: 15 April 2025 / Revised: 21 May 2025 / Accepted: 28 May 2025 / Published: 29 May 2025
(This article belongs to the Special Issue New Advance in Intensive Agriculture and Soil Quality)

Abstract

:
Inland saline wetlands in the Ebro Basin (Spain) are protected by international regulations but are also threatened by the expansion of animal farms. We studied the input–output budgets of N from animal farms in four catchments of wetlands in the central Ebro Basin designated as Nitrate Vulnerable Zones. We used the N produced in animal farms as inputs and the N extracted by the crops on which manures and slurries are applied as outputs in each catchment. The balances considered the regulations concerning the slope of land where animal excreta may be applied and the doses of application. At a detailed scale, we applied the Water Erosion Prediction Program (WEPP) to the Farnaca catchment to assess the runoff and nutrients arriving to its wetland. While the Bujaraloz-Sástago basin showed a high excess of N load, in the Gallocanta basin, N extraction by crops was significantly higher than the N produced by the animal farms. Despite this lack of surplus of N from animal excreta, the groundwaters in the Gallocanta catchment are polluted by nitrates. The emphasis on N from animal farms in plans to prevent water pollution is missing the role of mineral fertilizers as the sources of pollution in basins with small N loads from animal farms. Agricultural plots in the Farnaca catchment produce significant amounts of sediments and nutrients that eventually pollute the wetland. Modelling approaches at detailed scales are required to assess the flows of materials to individual wetlands.

1. Introduction

Wetlands are sensitive to agricultural and livestock activities and are especially susceptible to the use of agrochemicals in agriculture and to farming activities within their catchments [1,2]. The Nitrates Directive (91/676/EEC) (ND) on the protection of water against pollution caused by nitrates from agricultural sources indicates the need to designate and review the areas susceptible to such pollution. In Spain, about 24% of the territory, which represents about 62% of the Utilized Agricultural Area (UAA), is declared as vulnerable under the ND [3]. Inadequate management of organic waste (slurry) causes pollution of water bodies with nitrates [4]; and there is no available quantitative information about the management of the manure produced by livestock farms, especially pig farms, at the catchment scale.
The European Union has a large livestock population concentrated in certain Member States, notably Spain, France, and Germany. The livestock sector in Spain has great importance in the agricultural economy. Although there has been a decrease in the number of farms during the last two decades, Spain remains first in the EU in terms of pig population, which amounts to over 33 million in 2023, and represents about 25% of the EU’s pig population [5].
Usually, manure is applied in the land close to the source farm and at high rates [6,7]. The manure composition of organics is highly variable because it involves factors such as the amount of water used and/or the slurry storage system. Fertilizers and animal manures benefit crop production; though if managed inappropriately, they cause environmental problems [8,9]. Particularly, the nitrogen and phosphorous present in manure and used as fertilizer, may be delivered to the water bodies by surface and subsurface water flows being the critical factor for the growth of algal blooms and cyanobacteria and severely contributing to water eutrophication [10,11,12]. There are few available studies about nonpoint pollution of inland wetlands in semi-arid environments [13,14,15]. Moreover, semi-arid wetlands have a limited capacity to mitigate the effects of agrochemical pollution due to the scarce coverage of natural vegetation that may act as a buffer and the fluctuating hydrology with seasonal desiccation.
We selected four semi-arid wetlands in the central Ebro Basin (NE Spain) declared natural protected areas under different designations such as Ramsar sites, nature reserves or Natura 2000 sites in Europe. The wetlands are Saladas de Alcañiz-Calanda, Gallocanta Lake, Saladas de Sástago-Bujaraloz, and Sariñena Lake. As other saline lakes, they are considered as key ecosystems with unique features [16,17,18]. Nevertheless, these saline wetlands are threatened by agricultural intensification [19,20,21] and the ecosystem services they provide are unknown. These wetlands are located in Nitrate Vulnerable Areas and, in the last years, the Administration in charge of their water monitoring has reported a poor water quality status (http://chebro.es/ (accessed on 27 May 2025)). The wetlands selected represent a gradient of agricultural intensification, water salinity, and quality in terms of eutrophication state [22].
The main objectives of this study are (1) to determine the livestock pressure in the watershed of selected semi-arid wetlands in the Ebro Basin (NE Spain), where changes in water quality have been documented, and (2) to model water, sediment, and nutrient fluxes entering the wetlands at a detailed scale, focusing specifically on the Farnaca microbasin within the Saladas de Sástago-Bujaraloz wetland system (Ebro Basin, NE Spain). Specific objectives are (i) to obtain the nitrogen production from livestock census, (ii) to elaborate the crop maps for the basins, and (iii) to estimate the balance of nitrogen.

2. Materials and Methods
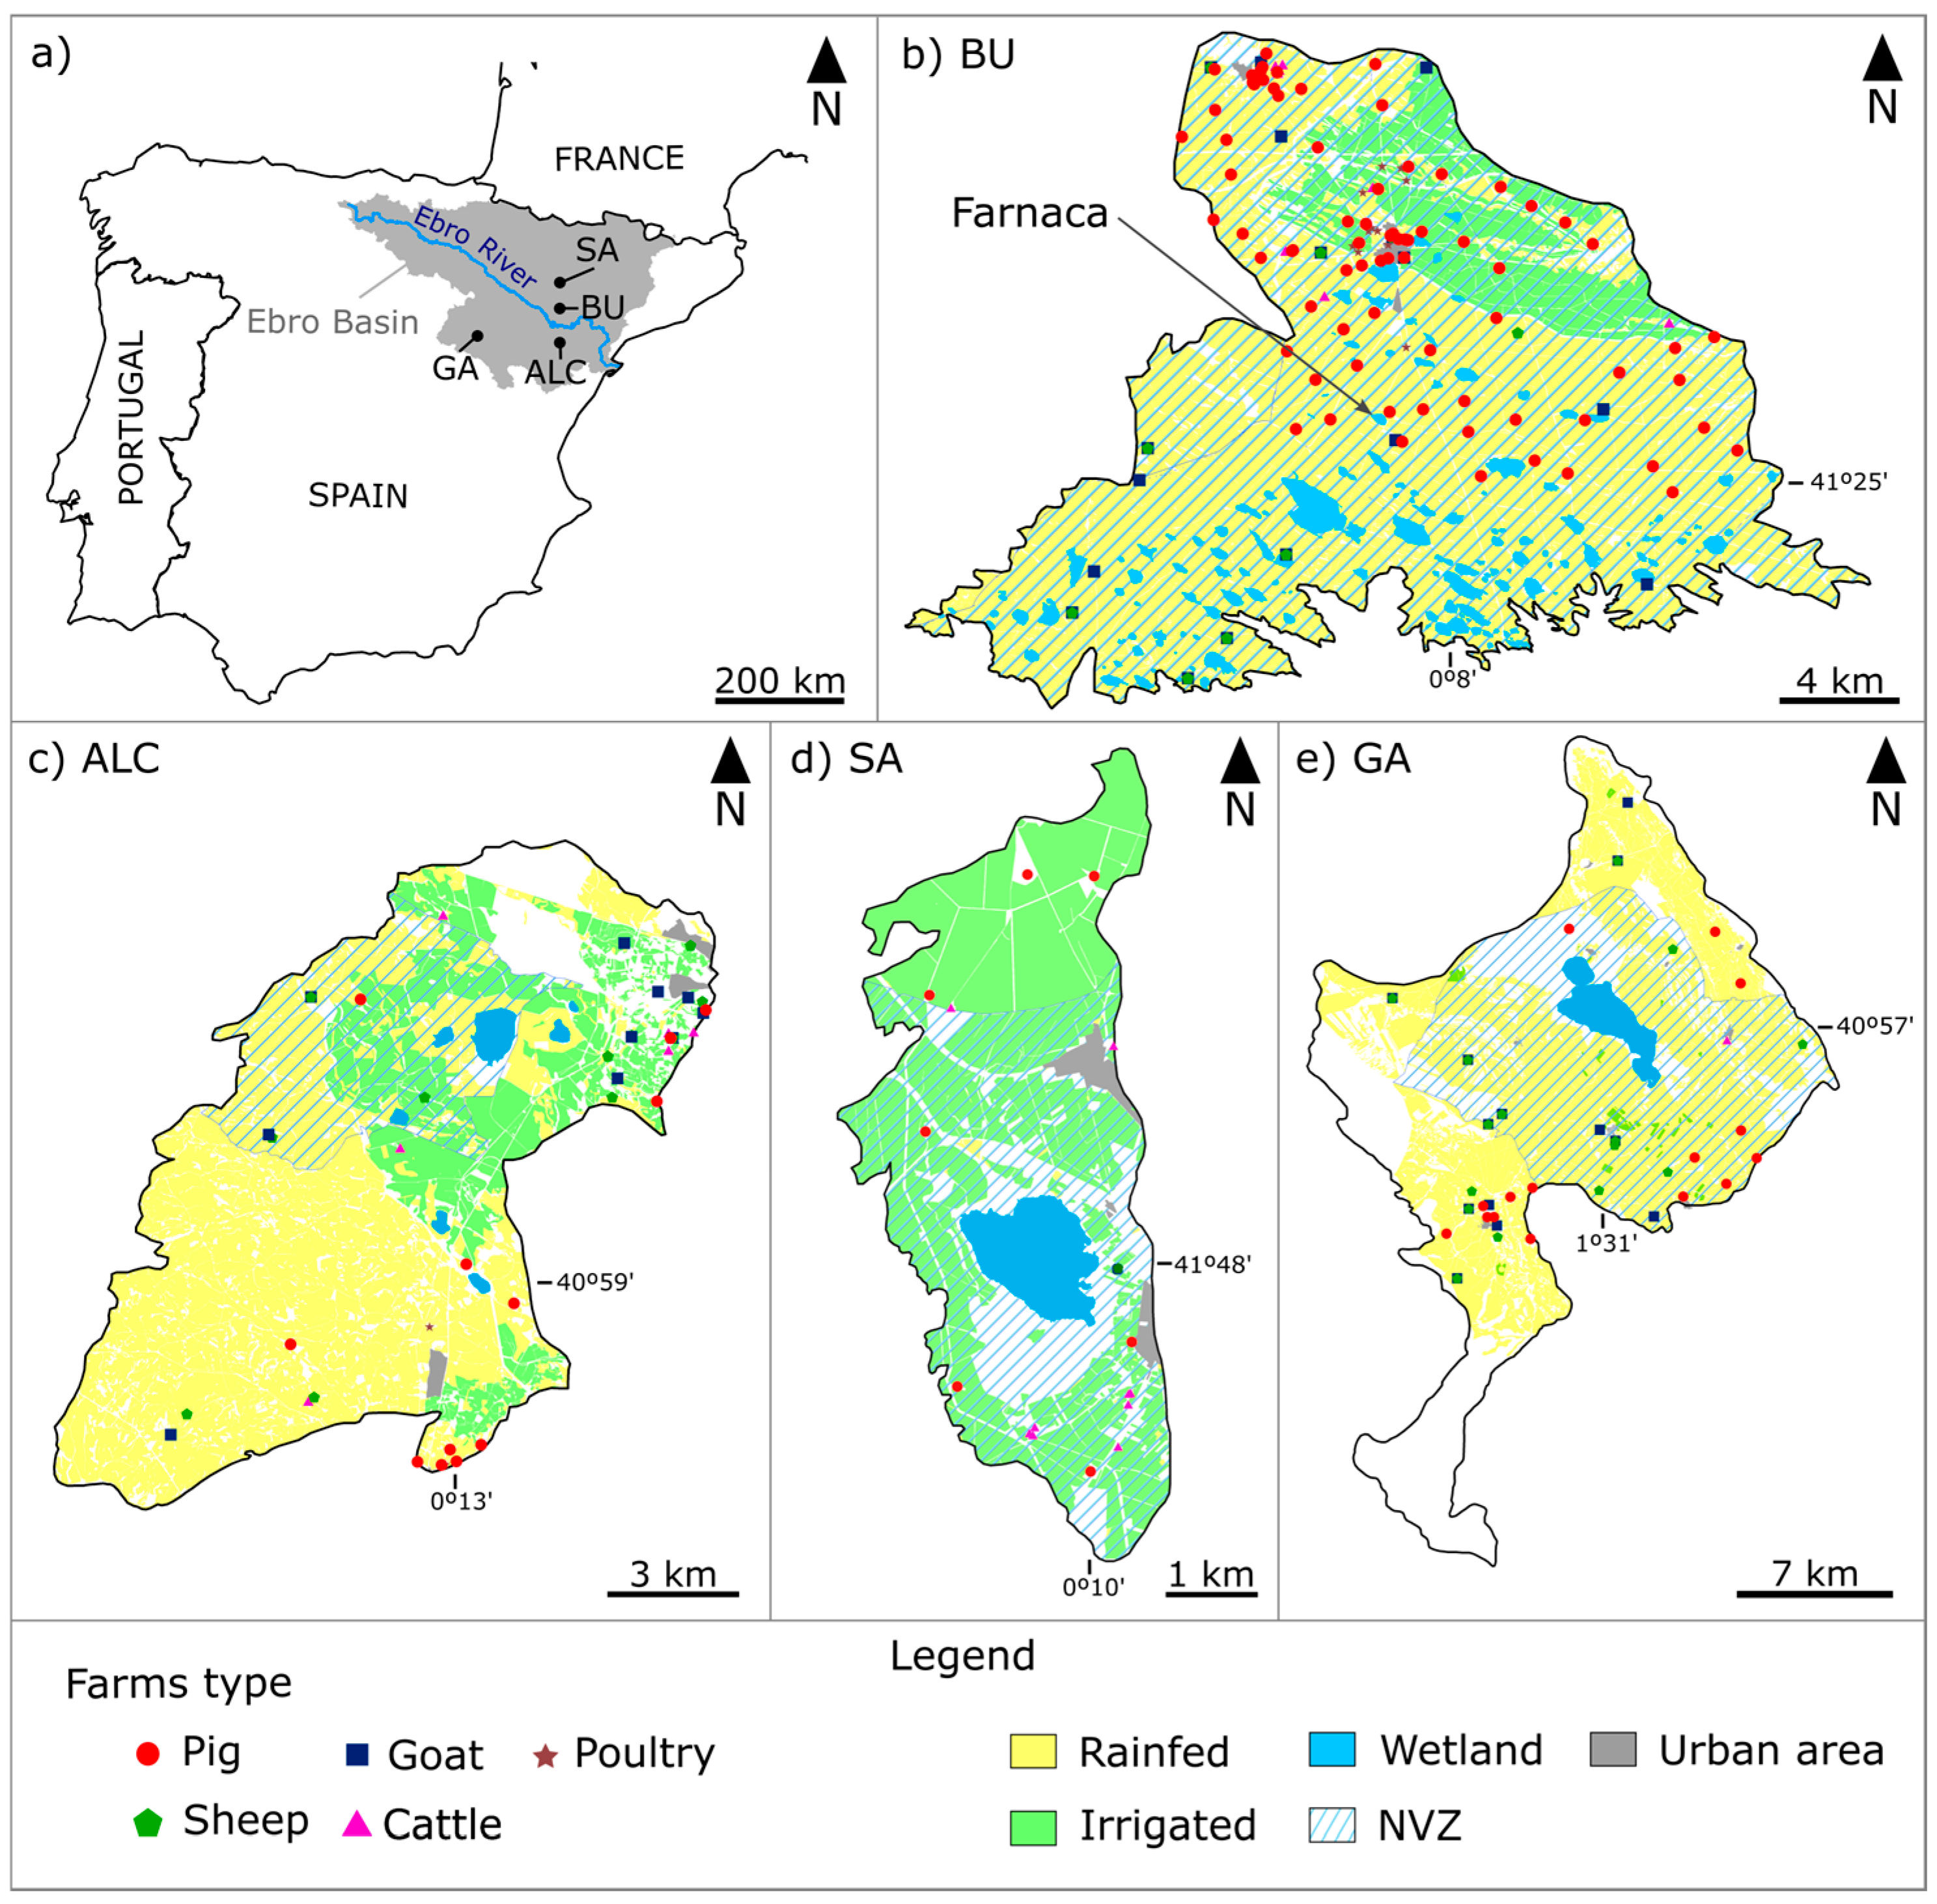
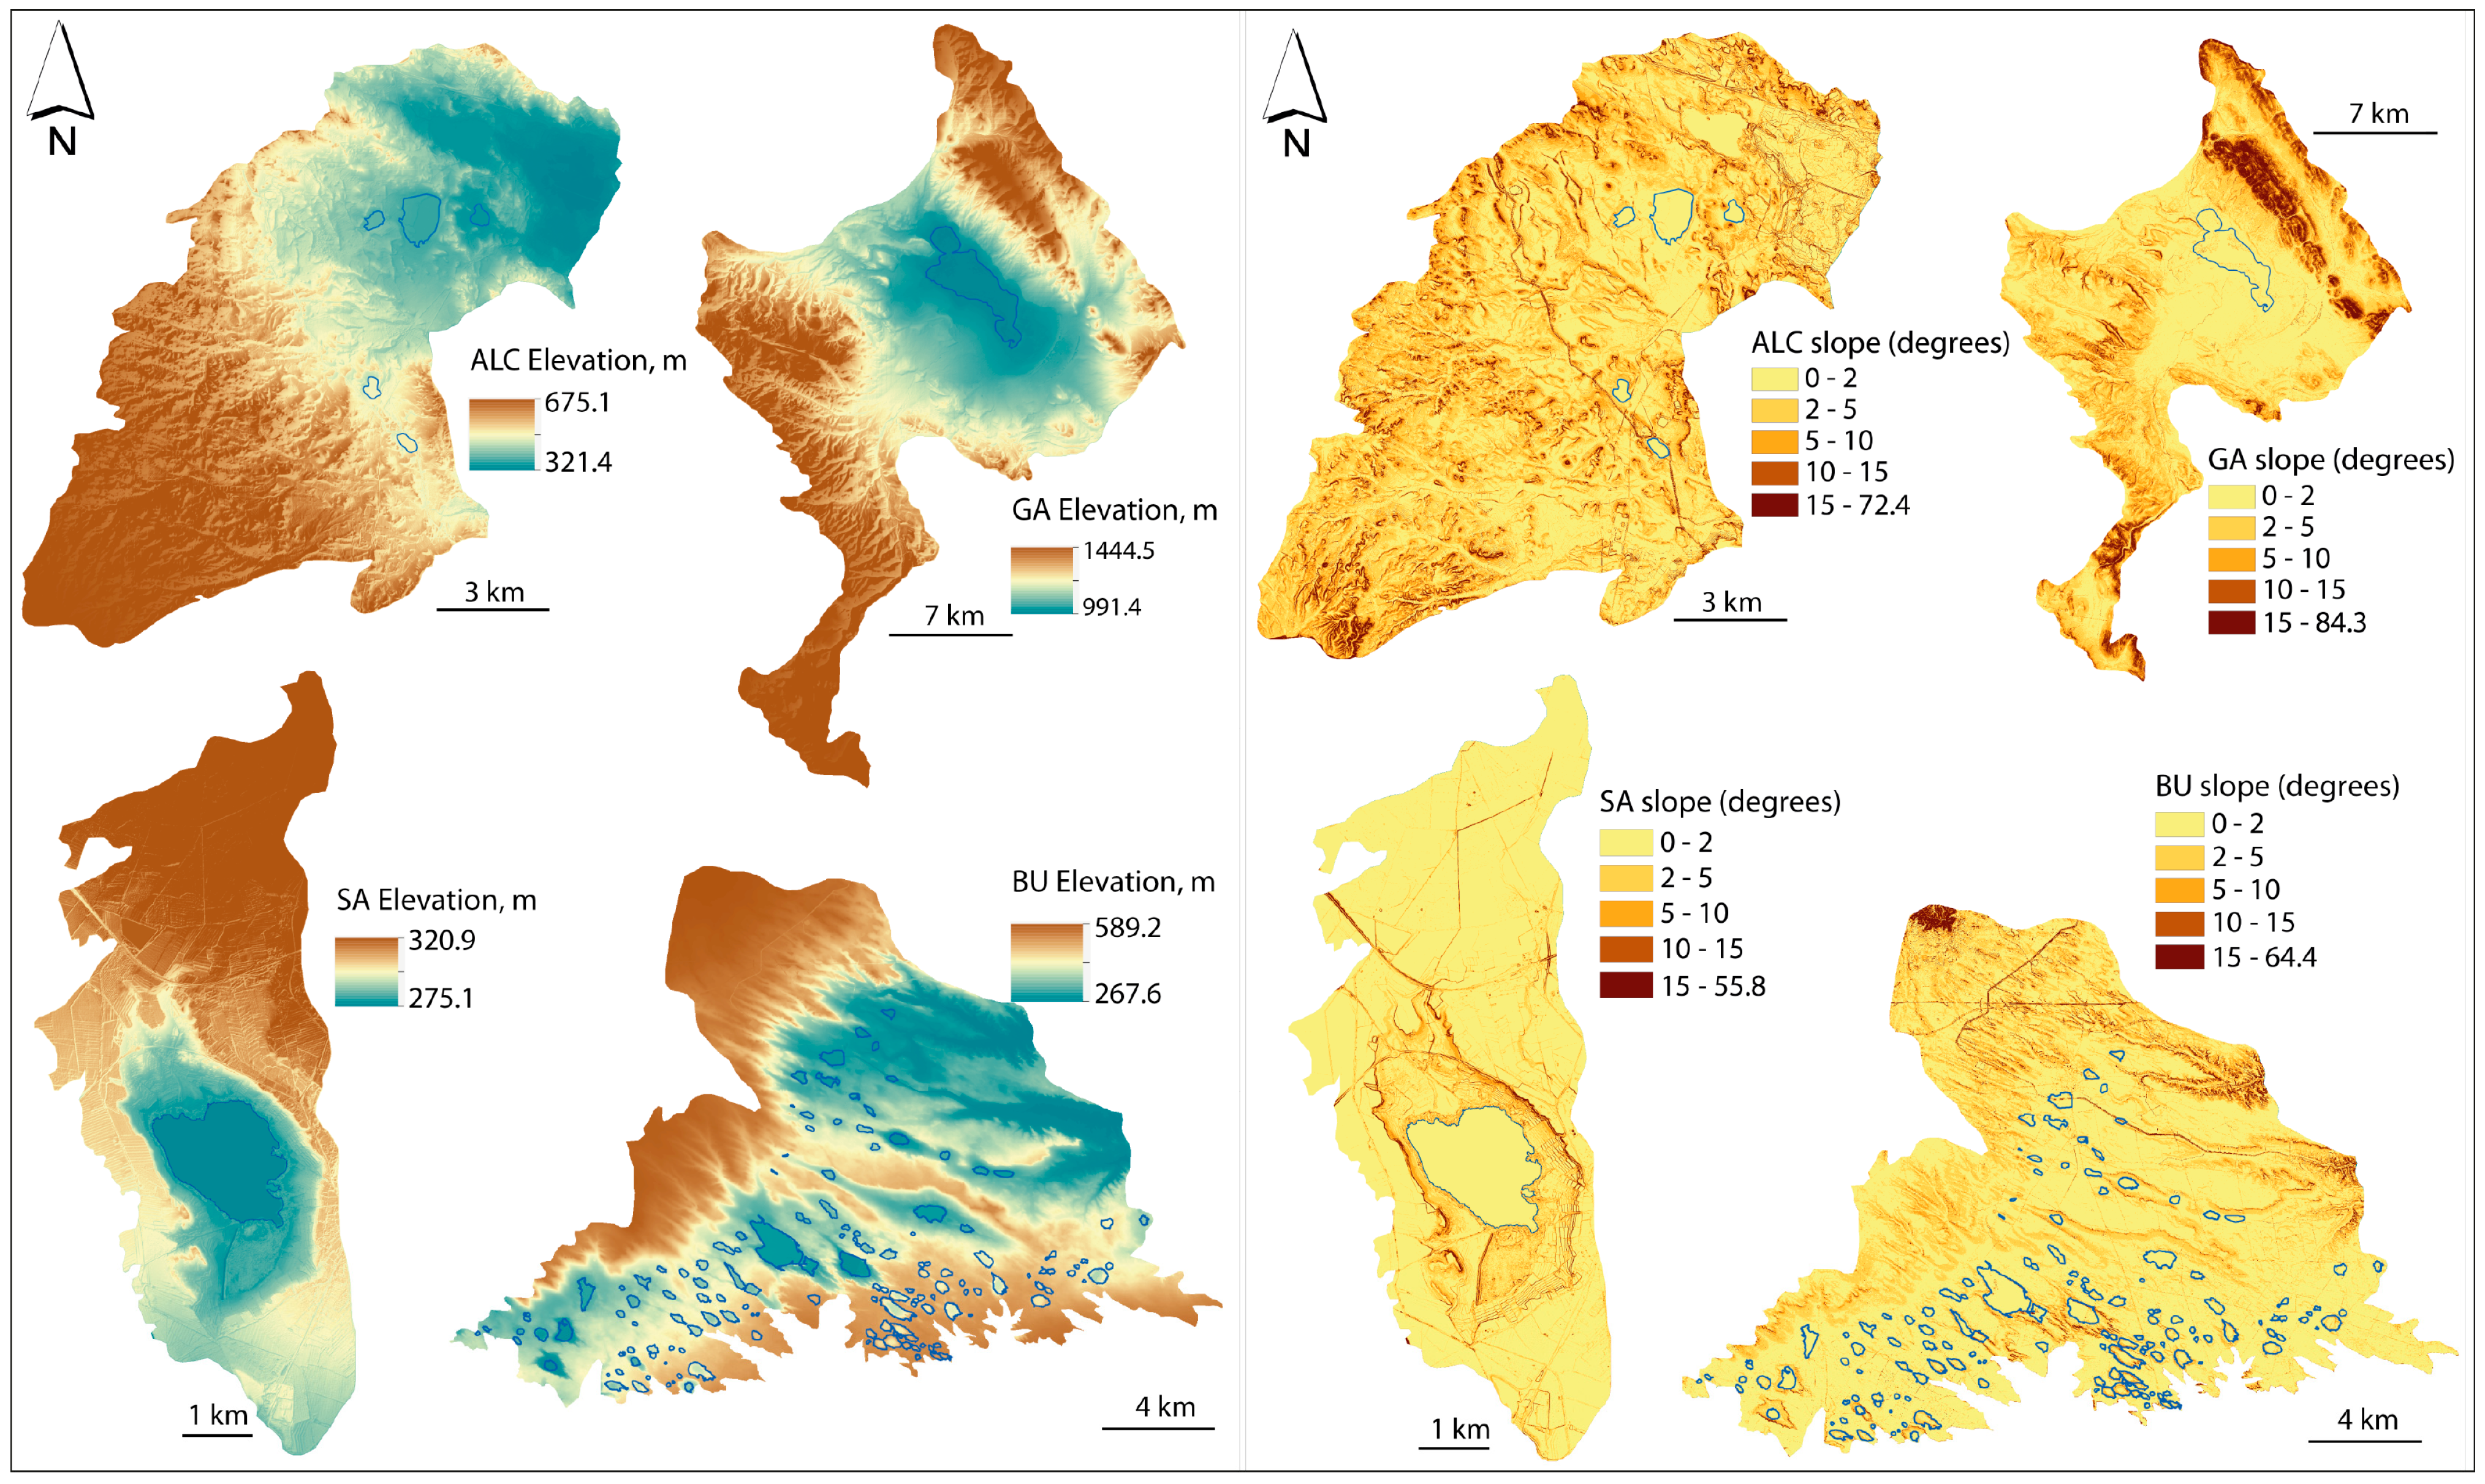
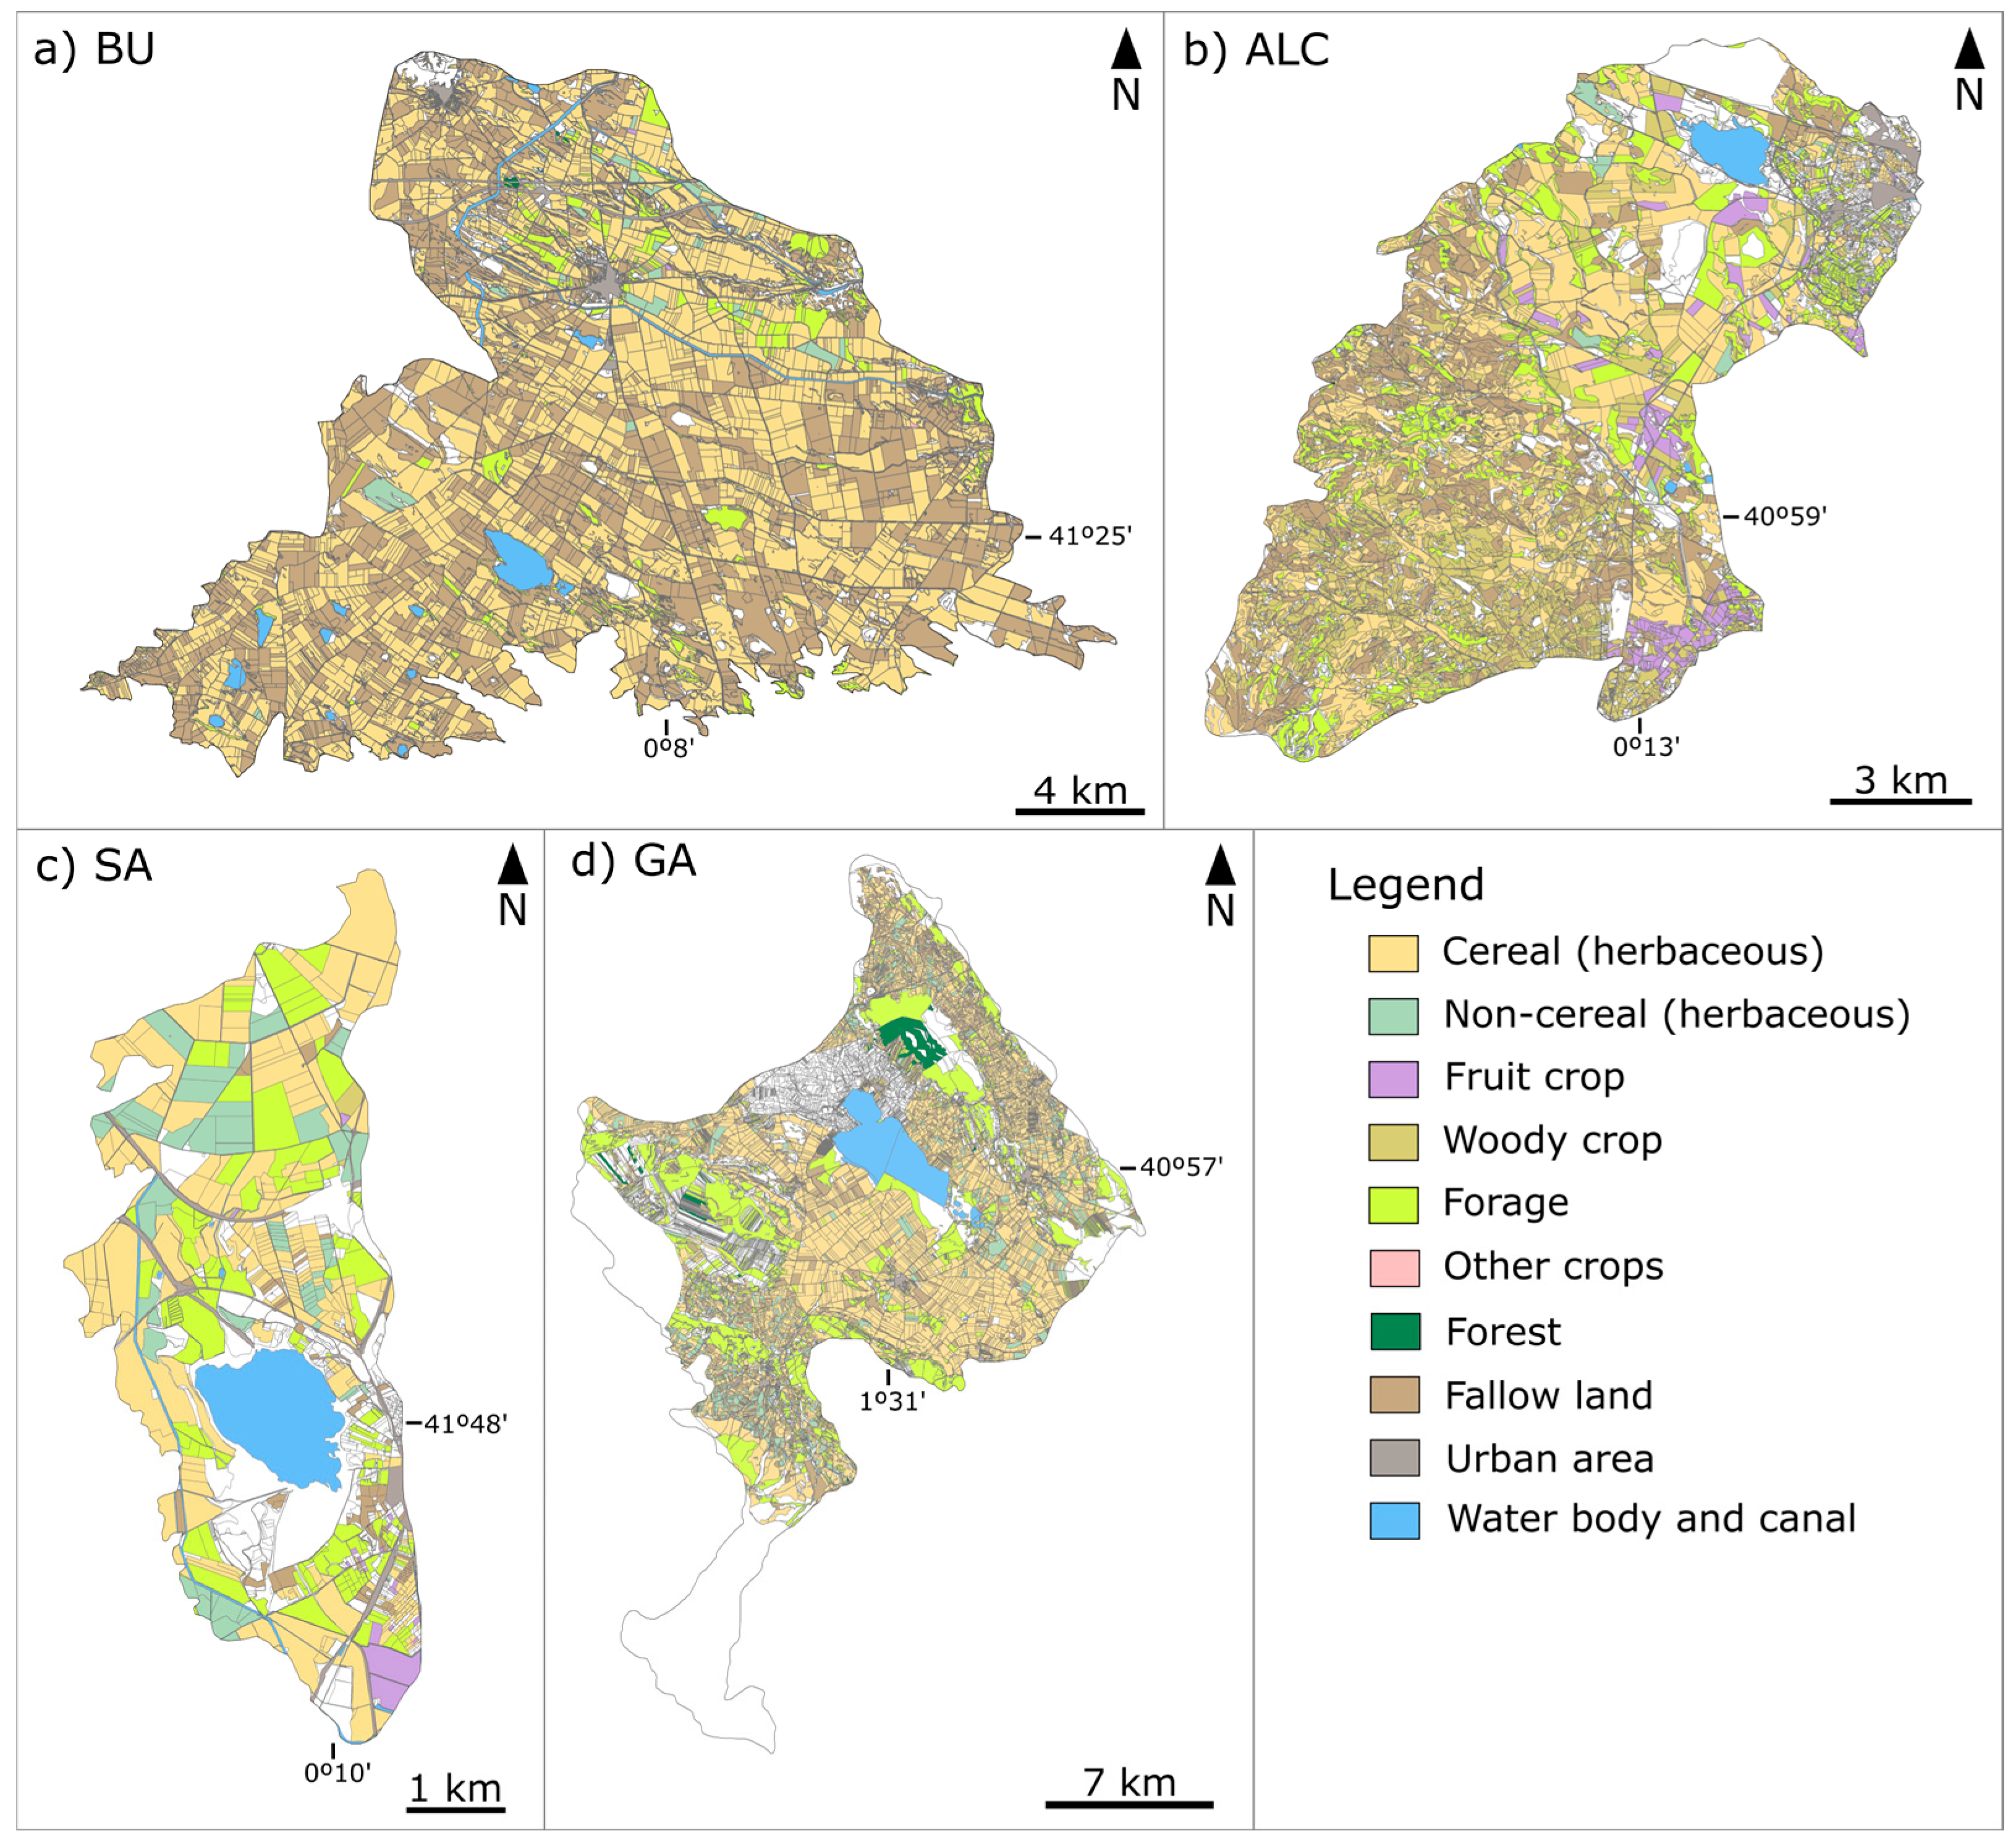
2.1. Study Areas

This study has been carried out in the catchments of four protected saline wetland located in the semi-arid conditions of the Ebro Basin (NE Spain). The wetlands are Saladas de Alcañiz-Calanda (ALC), Gallocanta Lake (GA), Saladas de Sástago-Bujaraloz (BU), and Sariñena Lake (SA) (Figure 1). All of them are located in the Aragón region, the first three in the province of Zaragoza, and the last one in the province of Huesca. The Gallocanta and Sariñena basins include one single wetland each, but Saladas de Alcañiz-Calanda includes 25 wetlands, and Saladas de Sástago-Bujaraloz is a system of about 150 wetlands. Sariñena is permanently flooded, and the rest are fluctuating depending on the previous rains (Table 1). Most of them include threatened habitats and endemic species adapted to extreme conditions, especially aridity, salinity, and soil composition. All of them are catalogued in the Natura 2000 European Network, protected under the European Directives Birds (2009/147/EC) and Habitats (92/43/EEC). Two of them (GA, BU) are included in the Ramsar list of wetlands of international importance [23], and all of them are under the European Water Framework Directive (WFD) (91/676/EC) as sensitive and vulnerable waters against pollution caused by nitrates from agricultural source.
The studied wetlands represent a gradient of water salinity (Table 1) and agricultural intensification in the surrounding lands. Most areas are developed in Tertiary sediments characterized by saliferous sediments and a fairly flat topography which condition the lack of permanent streams. Wetlands at central Ebro Basin are fed by a complex interaction of different sources of water which include irregular rains and sporadic streams, subsurface runoff, irrigation return flows, and groundwater. Although the irrigation water used at the central Ebro Basin has good quality [25], water tends to salinize by evaporation or addition of other ions from the geological materials [26]. In the studied semi-arid environments, the annual precipitation ranges from 300 to 480 mm and the mean annual evapotranspiration (ET0) ranges from 1000 to 1300 mm (Table 1).
The land use in the basins varies between the two extremes, from total rainfed farming in GA to intensive irrigation in SA. A mixture of both agricultural systems occurs in the rest of the basins (Table 1), where new irrigation and irrigation modernization are transforming the landscape and water quality [27]. Main crops are winter cereals with long fallow (18 months) in rainfed areas and double cropping system (wheat-maize) in irrigated areas. The facilities of intensive animal farms are increasing, especially in SA and BU. All the studied basins include areas designated as NVZs in application of the EU Nitrate Directive (ND), and therefore, the maximum amount of nitrogen fertilizer is regulated.

2.2. Wetland Watershed Delimitation

The boundaries of the wetland watersheds were delimited following the drainage divides (Figure 2). We used a high-resolution digital terrain model generated from airborne LiDAR data with an absolute vertical accuracy of 2 m and a density of 0.5 points m−2. LiDAR was obtained from the Spanish Geographic Institute PNOA-LiDAR Plan with a mesh size of 2 × 2 km and, in smaller quantities, 1 × 1 km. In general, we included in the basin all the land that drains into the wetland excepting the Saladas de Sástago-Bujaraloz, where the drainage basin was restricted to the surroundings of the wetlands due to the large extension of the basin and its flatness [28].

2.3. Livestock Census and N Produced

The database of livestock census was collected from the official administrative Register of Livestock Farms of Aragon, Spain (REGA), updated in April 2023 and available for download in the Open Data platform of the regional government (https://opendata.aragon.es/ (accessed on 27 May 2025)). The geographic file was overlaid in a geographic information system (ArcGIS v.10.8.2) and the location of each animal farm was confirmed and corrected if necessary, using the PNOA-2021 (Spanish National Aerial Orthophotography Program) images as background layer in the GIS. The farm dataset included the type of productive system together with the species (pig, goat, sheep, cattle, and poultry) and the annual farm capacity (number of places per year).
We estimated the amount of nitrogen (N) produced from animal excreta (hereafter called ‘gross N’) considering the maximum capacity of the farms declared in the regional register of animal farms (https://www.aragon.es/-/explotaciones-ganaderas, (accessed on 27 May 2025)) and the amount of N excreted by pigs [29] and other types of animals like bovine (18.07 kg N), chicken (0.12 kg N), goat (8.18 kg N), quail (0.03 kg N), sheep (5.49 kg N), and turkey (0.46 kg N) [30]. Due to the variability in the regional assessments of the amounts of N excreted by pigs, we used the minimum medium and maximum values reported by these sources (Table 2). N losses during manure storage and management were not considered due to the lack of data at this scale.

2.4. Crop and Plot Information

We elaborated the crop maps of the four basins at very detailed spatial and thematic resolution using the official datasets provided by the regional government (Figure 3). The datasets contain the annual declaration of farmers under the Common Agricultural Policy (CAP). The corresponding geographic layers of agricultural plots georeferenced through the GeoSpatial Aid Application (GSSA) were downloaded from the official website ICEARAGON (https://idearagon.aragon.es/portal/ (accessed on 27 May 2025)). About 30,150 land use polygons and the corresponding attributes were processed to create a unique integrated layer merging the information stored in different geographic layers.
We elaborated the maps of crop distribution over a period of five years, from 2018 to 2022. The crop maps were required to overlay the thematic geographic information containing the administrative regulation criteria.
In this work we considered barley, wheat, oats, rye, and corn as the crops on which the application of manures and slurries was feasible. We only considered fields of these crops with a slope less than 15%, as regulations do not allow the application of organic fertilizers on slopes steeper than this value. Yield data for each year in the period 2018–2022 were provided by the agricultural extension service of the regional government and its collaborating cooperatives.
We estimated the N output per unit area multiplying yields by the N extracted by those crops. These extractions are established by regional regulations [30] as 30 kg N t−1 for winter grains and 25 kg N t−1 for maize under sprinkler irrigation. Three levels of N output were considered taking into account the minimum, mean, and maximum yields in the 5-year period 2018–2022.

2.5. Areas and Doses of Application of Animal Excreta

The application of organic fertilizers is limited in the region by various factors: the ban on the application on fields with a slope over 15% [30], the designation of NVZs [30], and the N requirements of crops. These factors defined the areas where organic fertilizers were applied and the areas producing N output through crops.
In relation to the first limitation, we removed areas with slopes over 15% (Figure 2) using the 2022 GeoSpatial Aid Application (GSAA) dataset from ICEARAGON (https://idearagon.aragon.es/portal/ (accessed on 27 May 2025)). NVZs are defined by each regional government [30]. The NVZs geographic layers corresponding to our study basins (updated to 2023) were downloaded from the National Spatial Data Infrastructure of the MITECO website (https://www.miteco.gob.es/es/cartografia-y-sig/ide/descargas/agua/zonas-vulnerables.html (accessed on 27 May 2025)). The agricultural plots and the total area qualified as vulnerable were identified and quantified in ArcGIS (Table 1). In areas designated as NVZs, the application of slurries and manures is limited according to the N extracted by crops or to a maximum of 170 kg N ha−1 y−1. In non-NVZ areas, the maximum is set to 210 kg N ha−1 y−1.
The second criterion was the type of production area, which was obtained from Annex XIV in [30]. This regulation establishes three types of areas within the NVZs, that is, arid rainfed (Type 1), humid rainfed (Type 2), and irrigated (Type 3), and therefore, the maximum allowable nitrogen input per hectare (kg N ha−1).
Finally, as key agronomic criterion, the crop production data allowed adjusting the manure applied to the needs of the crops. For all the agricultural plots qualified as vulnerable, the upper limit was 170 kg N ha−1 y−1 (210 kg N ha−1 y−1 in case of irrigation), and outside the vulnerable areas the upper limit was 210 kg N ha−1 y−1. Below these general upper limits, the regional government [30] establishes the N needs based on expected production. For winter cereal with 30 kg N t−1, the maximum allowable N input was 90 kg N ha−1 in Type 1 areas and 150 kg N ha−1 in Type 2 areas (Table 3). In the case of corn, in this work, the N extraction values were considered for sprinkler irrigation conditions with an estimated N requirement of 25 kg N t−1 and a maximum allowable N input of 380 kg N ha−1 (Table 3).
In areas not designated as NVZs, the applications of N from organic sources may reach up to 210 kg N ha−1 in those cases, in which, the yields obtained results in N outputs higher than 170 kg N ha−1. This is the case of irrigated crops of wheat, barley, and maize. In the first two cases, such high doses are split in two applications, before sowing and at tillering, and we have used 210 kg N ha−1 as the amount applied in those circumstances. But in the case of maize, this management is not possible, and we have used the amount of 170 kg N ha−1 as the maximum. The N applied was calculated under the premise of replacing all inorganic fertilization with manures and slurries.

2.6. N Pressure Balances and Indexes

The livestock pressure in each basin was assessed by estimating the balance of nitrogen based on the calculation of N inputs and outputs in order to identify N deficits or excesses at the scale of the basin. In this work, we considered the N input as the total N produced by all the farms registered in the basin. N output was calculated as the amount applied to grain crops on fields with slopes less than 15%. We considered the yields obtained each year. The budgets were calculated under three scenarios. In the ‘favourable scenario’, the N input was calculated considering the minimum level of excreta produced (Section 2.3) and the N output was calculated considering the maximum yield in the 2018–2022 period (Section 2.4). In the ‘mean scenario’, the N input was calculated using the medium level of excreta and the N output using the mean yield of that period. And in the ‘unfavourable scenario’, N input was calculated using the maximum level of excreta considered in the regulations and the N output using the minimum yield of the study period.
We used N inputs and outputs to calculate three different indexes proposed in Spanish regulations: the traditional N Balance (NB), the Livestock Load Index (LLI), and the Saturation Index (SI). The interpretation of the three indexes is summarized in Table 4.
The NB applied in this work was a simplification of the N balance defined by [33]. The Equation (1) is as follows:
NB (kg N ha−1) = I − O
The Livestock Load Index (LLI) was adapted from [34] in order to account for the restrictions in our vulnerable areas and was formulated in Equation (2) as follows:
LLI = I/O
The index interpretation provides a classification of the wetland’s basins in terms of capacity to absorb organic fertilization.
The Saturation Index (SI) is established by [35] in Equation (3) as follows:
SI = (I − O) × 100/O
The saturation (SI = 0) is reached when within the watershed area there is an output equivalent to the N excreted by the livestock farms [35].
Table 4. Indexes applied to estimate the N balance in the watersheds, their values, and standard interpretation.
N balance IndexIndex ValueInterpretation
N Balance (NB)NB ≥ 0Excess N from organic sources
NB < 0Still available N capacity
NB/7.6 < 0Still available capacity (number of fattening pigs)
Livestock Load Index (LLI) adapted from [34]0.5 < LLI ≤ 0.8Capacity to absorb more organics
0.8 < LLI ≤ 1.0Compatible
1.0 < LLI ≤ 1.2Moderate
LLI > 1.2Saturated
Saturation Index (SI) adapted from [34]SI ≤ 0Compatible
0 < SI ≤ 25Moderate
25 < SI ≤ 50Severe
SI > 50Critical

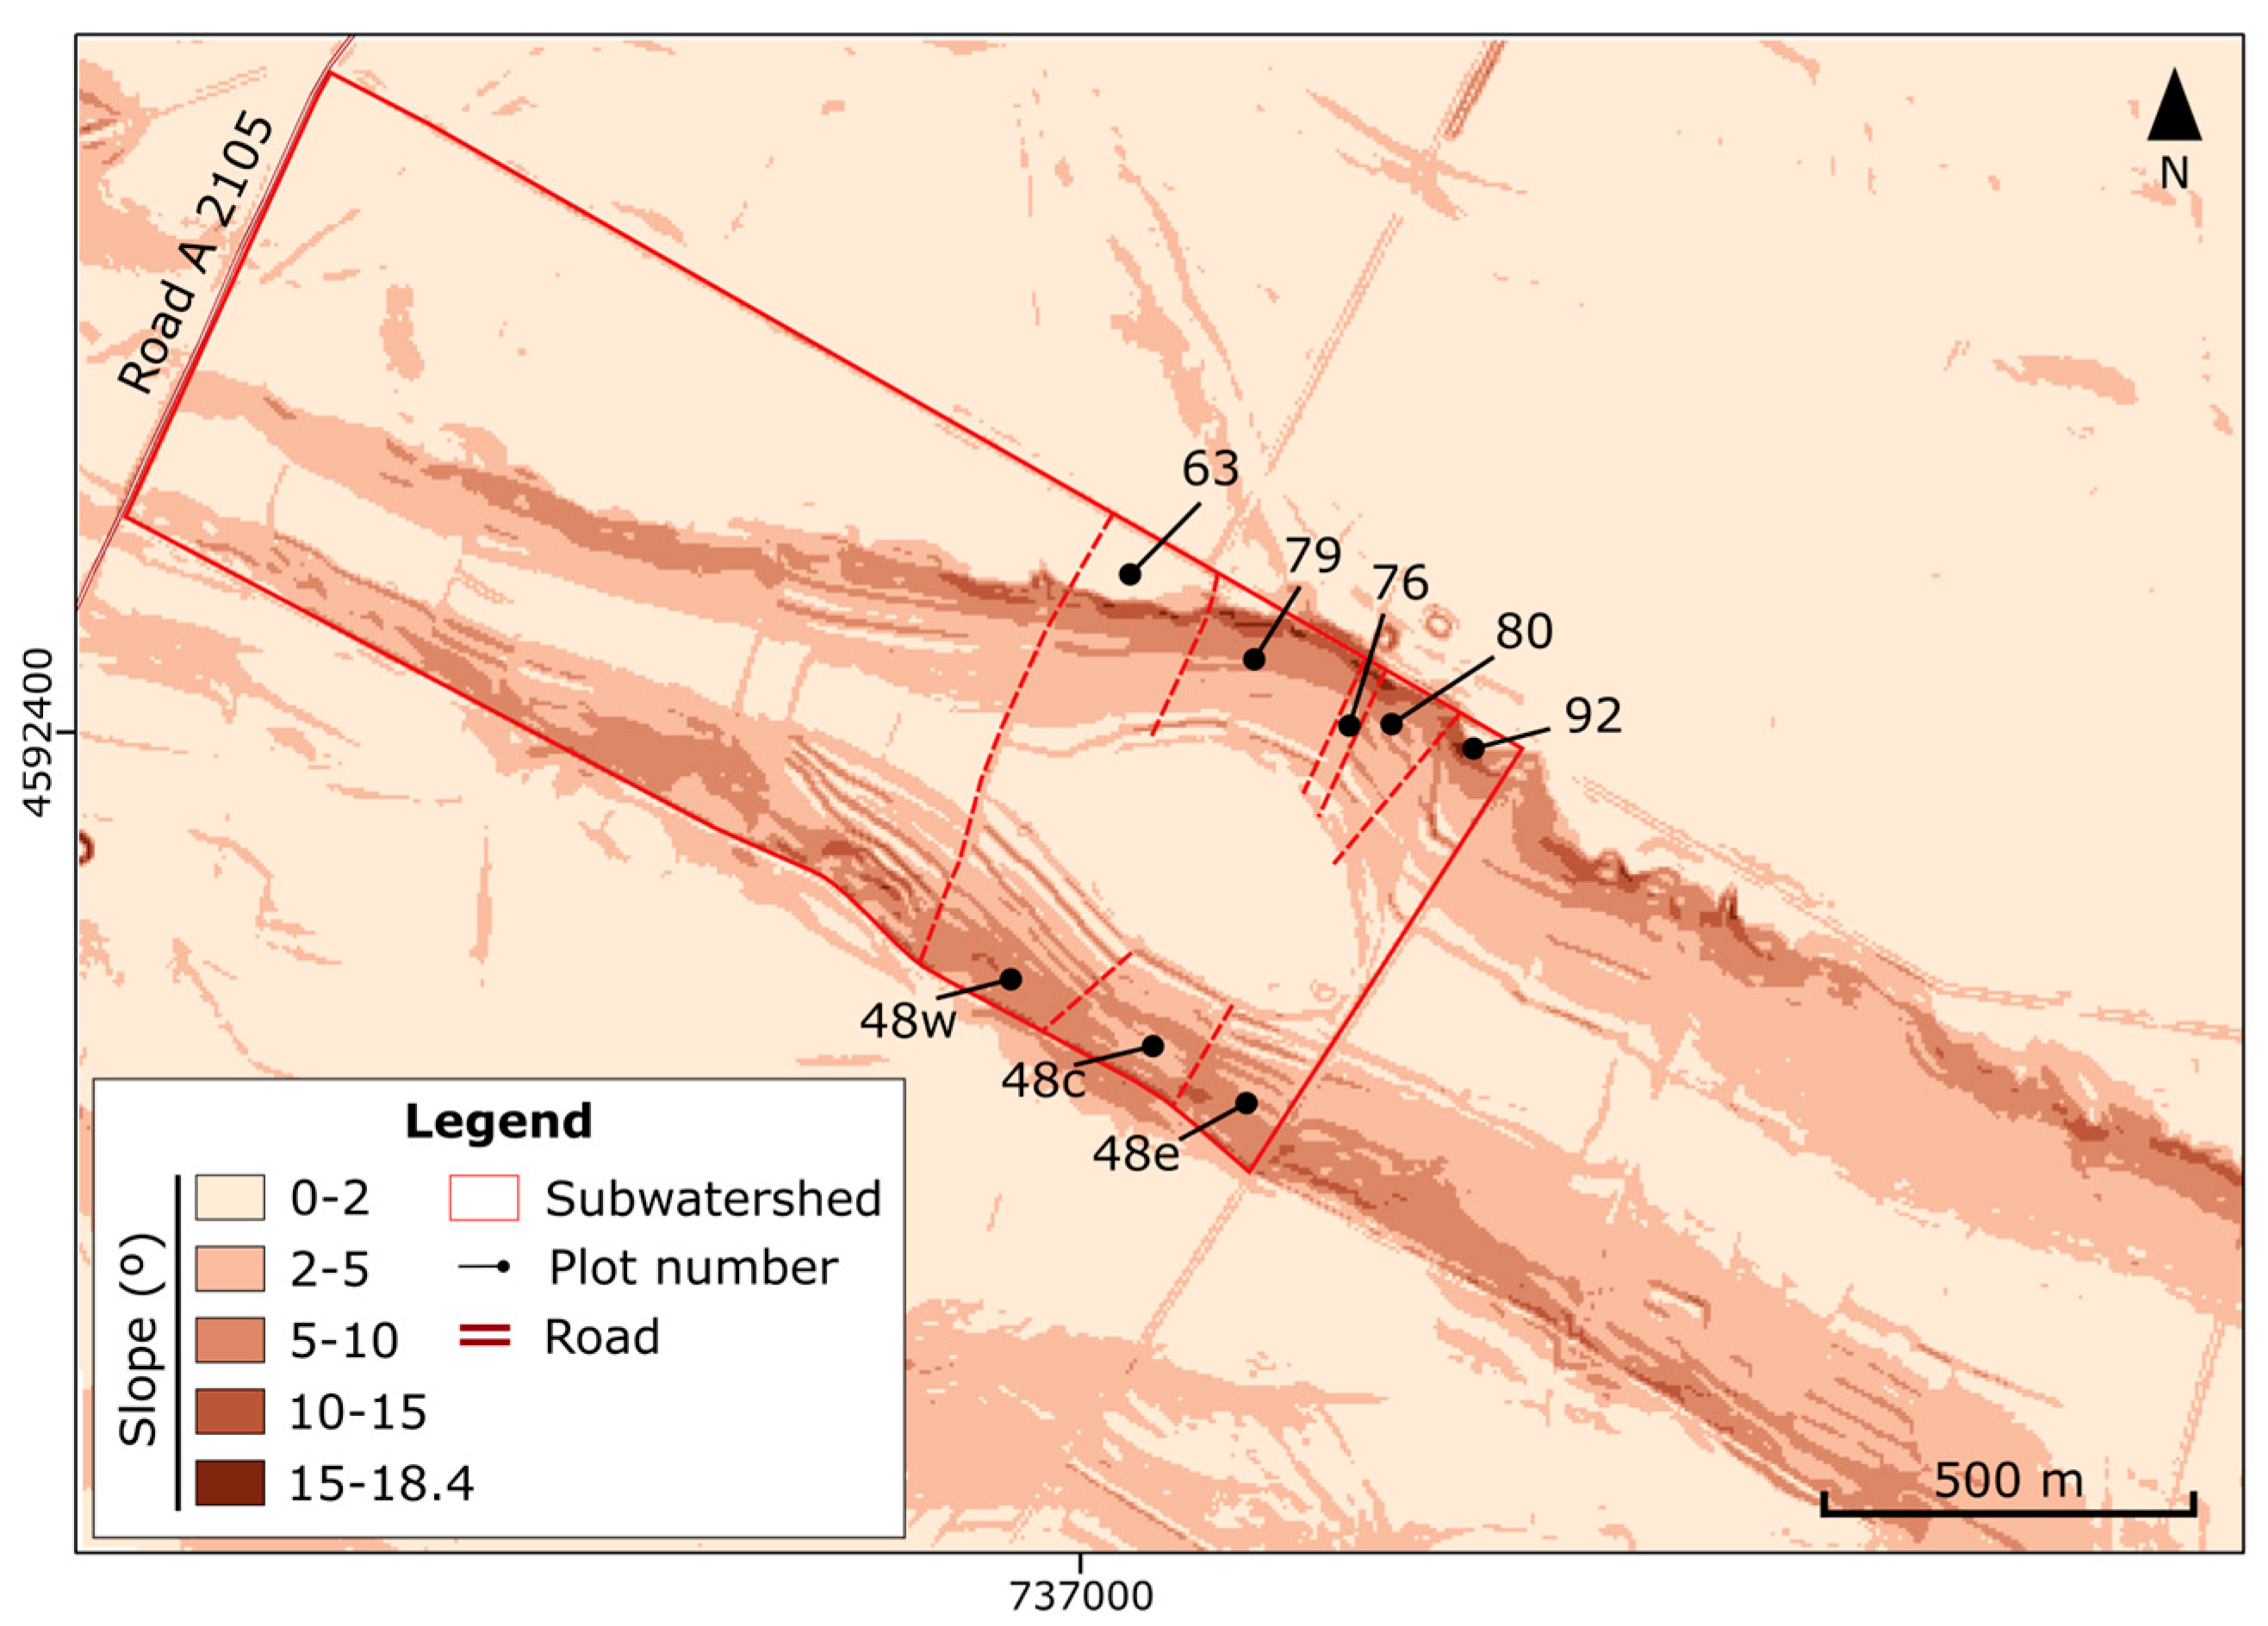
2.7. Application of the WEPP Model to the Farnaca Wetland

In order to assess the risk of pollution from agricultural sources at a more detailed scale, we applied the WEPP model [36] at the Farnaca wetland, which covers 13.13 ha in BU basin (Figure 1). We obtained the long-term (100 years) flows of surface and subsurface water, the mass of sediments, and the amount of organic matter reaching the wetland from its watershed. We assessed these processes from the specific combinations of slopes, soils, land uses, and climate in the watershed of the wetland, as required by WEPP. We obtained a 100-year climate data series with the CLIGEN generator included in WEPP using the 2003–2023 daily rainfall and temperature data from the Valfarta station (SIAR newtwork, https://servicio.mapa.gob.es/websiar/ (accessed on 27 May 2025)) located 12 km north of Farnaca.
The watershed of Farnaca is crossed by various roads and tracks built on 30–50 cm high embankments. We therefore considered that these tracks limited the area actually providing runoff and sediments to the wetland to only 97.27 ha with a rectangular shape (Figure 4). For modelling purposes, this reduced watershed was subdivided into eight slopes and a subwatershed, each of them directly feeding the wetland (Figure 4). The topography, length, and gradient of each segment of the slopes and subwatershed were determined from the digital terrain model and field measurements.
Soils on the plateau surrounding the wetland are mostly Typic Xerorthents with a silty clay texture in the surface horizons, and on the slopes leading to the wetland, soils are Gypsic Haploxerepts with a loamy to a silty clay texture in the surface. Organic matter concentration in the surface soil horizons varies between 13 and 22 g kg−1, total nitrogen from 0.9 to 1.6 g kg−1, and Olsen phosphorus from 9 to 15 mg kg−1.
Land use in the watershed is dominated by a winter grain-fallow rotation on slopes with a gradient of less than 15% with narrow strips of short shrubs on risers of bench terraces and on natural slopes of up to 35% gradient. Fertilizer application takes place before ploughing and sowing, and at the beginning of tillering, at rates equivalent to 170 kg N ha−1. Winter grain, mostly barley, was considered to be managed by conventional tillage, with a disc plough pass down to 20 cm plus a cultivator pass down to 12 cm in September–October, which incorporates the fertilizer previously applied at rates equivalent to 170 kg N ha−1 and 45 kg P ha−1. Crop variables were based on the WEPP database. Sowing was considered to take place in late October. Shrub areas were modelled as providing a permanent 30% cover with a height of 40 cm.
The yield estimates obtained with WEPP were checked against the yield data provided by local informants. The amount of nitrogen and phosphorus reaching the wetland were estimated from the monthly runoff and sediment volumes obtained with WEPP, and the total concentrations of those elements in runoff, which were considered to decrease from 11 mg N L−1 immediately after application to 1 mg N L−1 six months later and from 3 mg P L−1 to 1 mg P L−1 [37,38,39,40].

3. Results

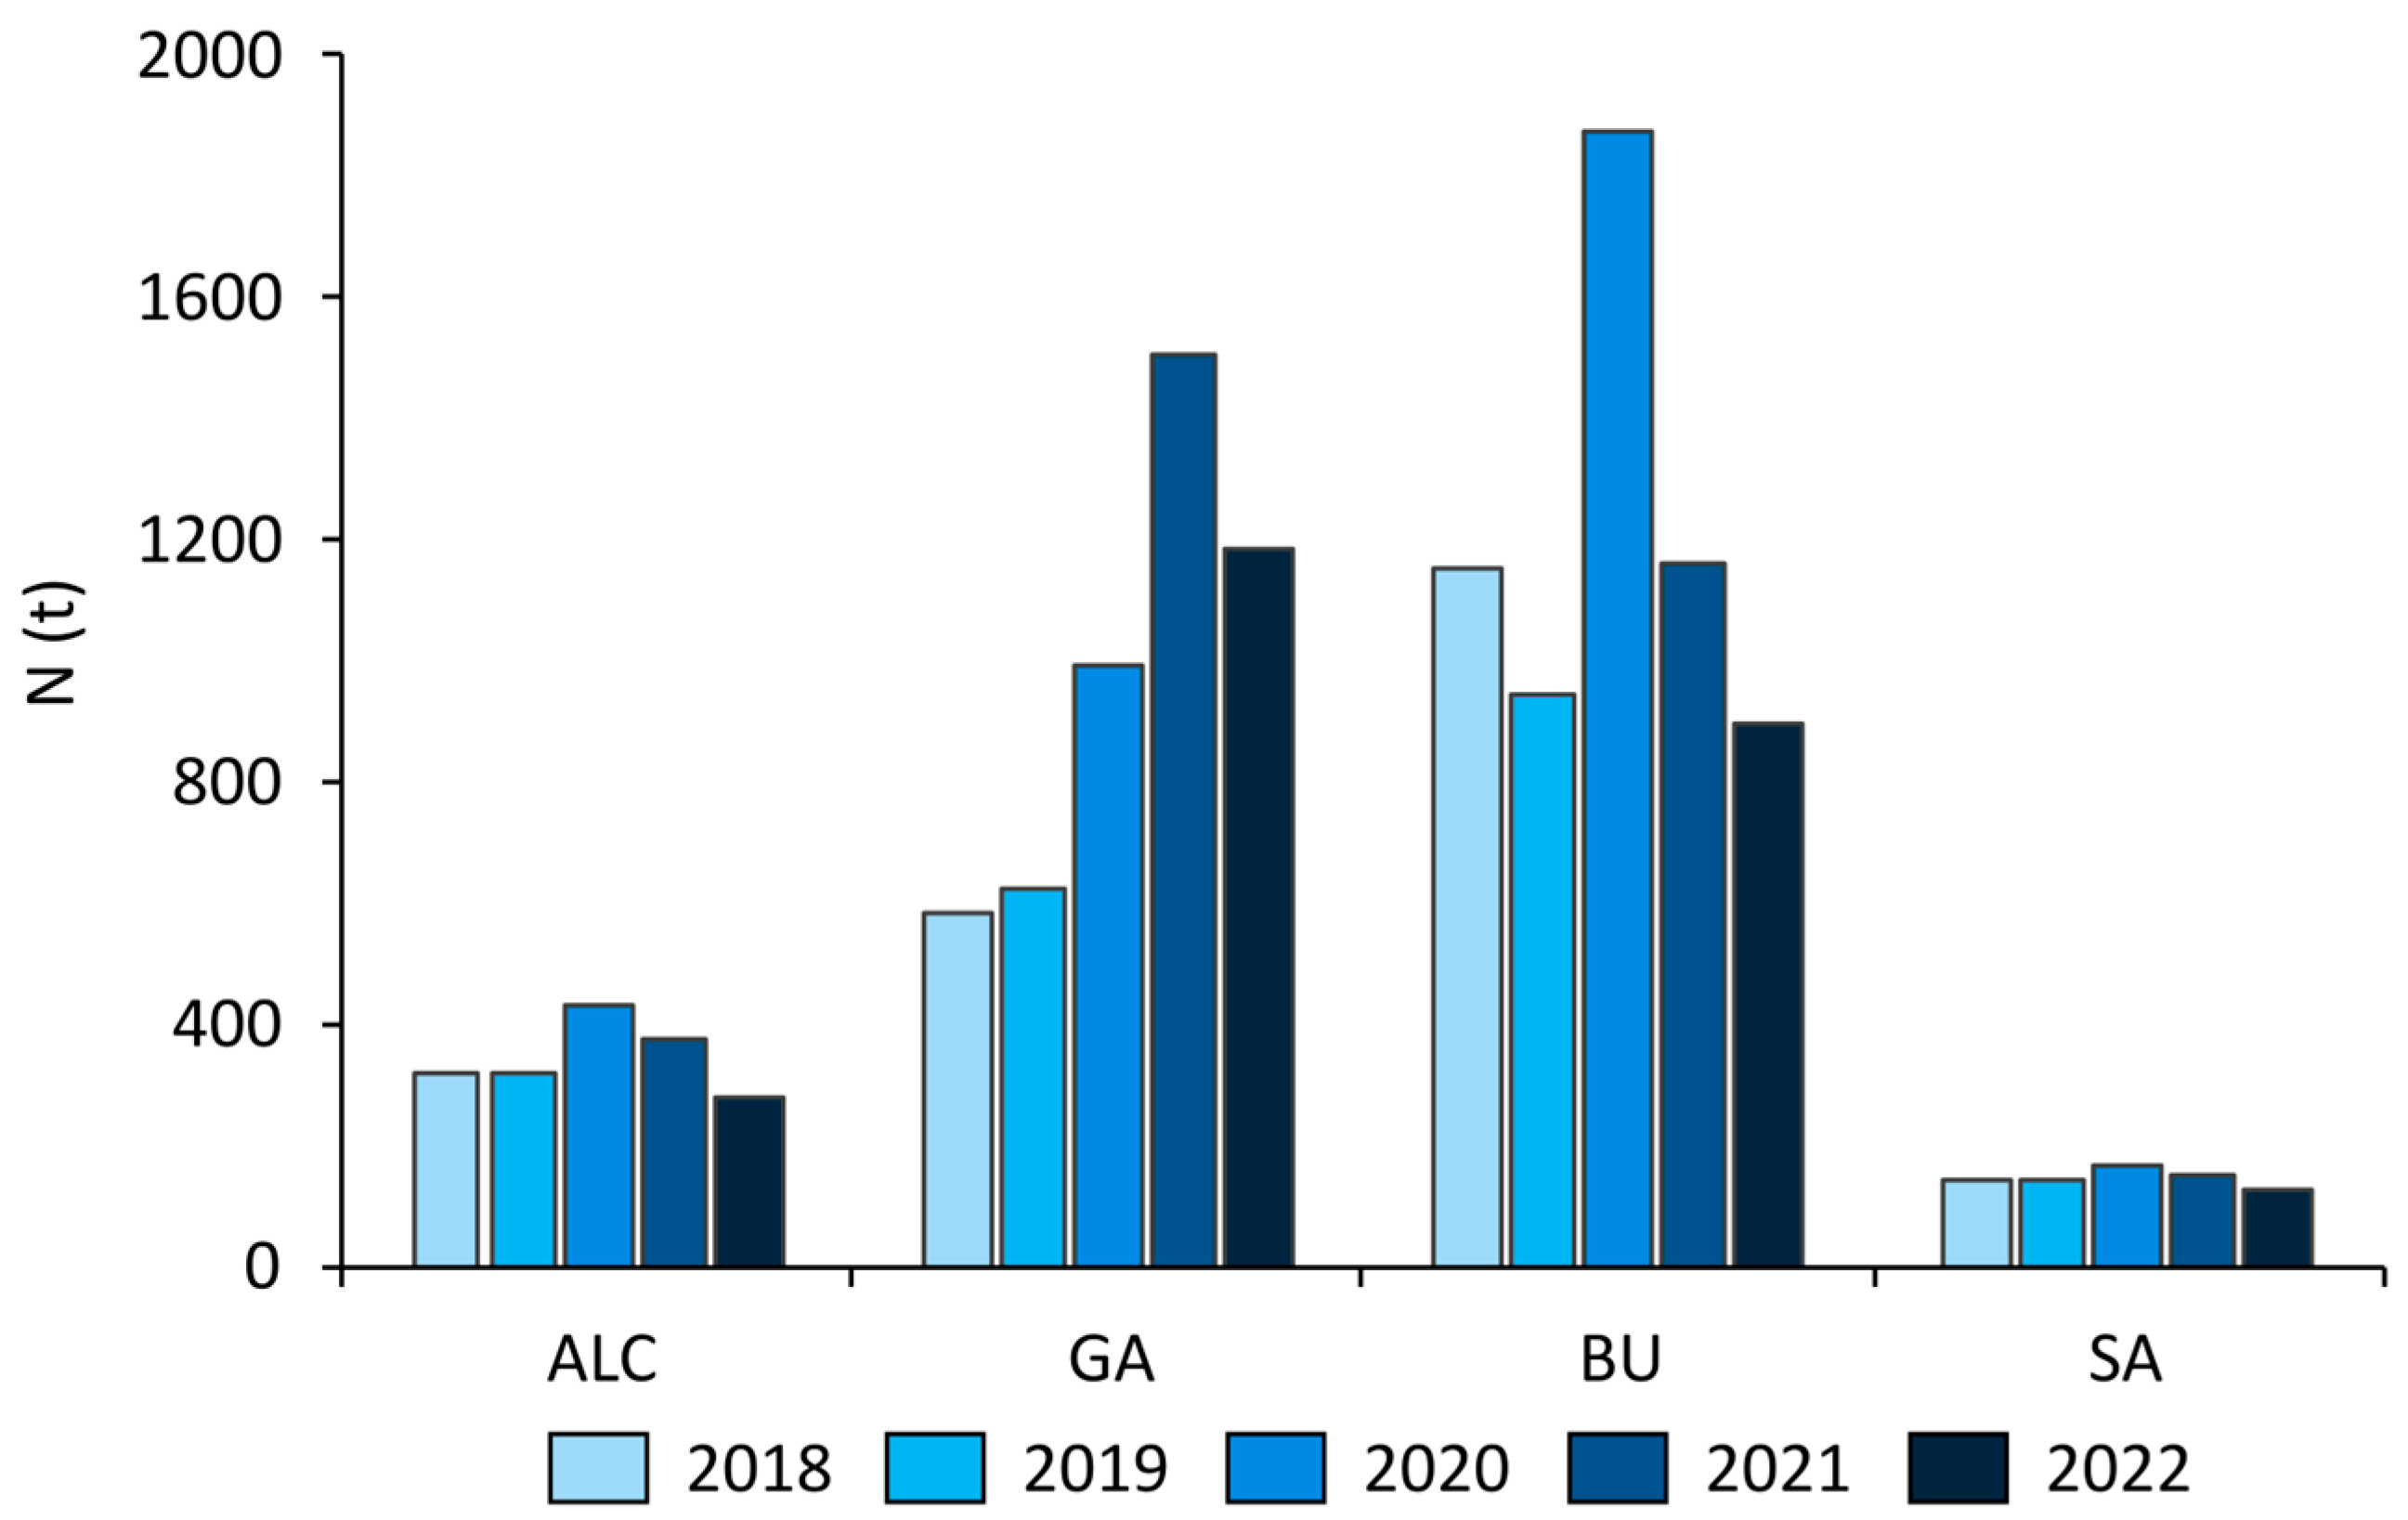
3.1. Crop Distribution and Yield from 2018 to 2022

The agricultural area of the basins, i.e., the area included in CAP declarations, varies from 48% in GA to 93.3% in BU (Table 5). The surface extent of the irrigated areas varied from 0.8% in GA to 98.7% in SA (Table 5). BU is the basin with the largest NVZ (99.5%) (Table 5). The percentage of agricultural land covered by cereals varied from 16.5% in ALC basin to 31.4% in SA basin.
The usable agricultural area (UAA) suitable for organic fertilizers, i.e., with a slope less than 15%, can reach almost 50% of the basin in SA and BU (Table 5). We found a relatively low UAA percentage in GA and ALC, with 25% and 26.9%, respectively. There is a limited number of CAP declarations in GA and also other land uses compatible with the mountain climate of the basin, such as pasture or forest. The ALC basin exhibits a predominance of fruit trees which are not commonly used for manure or slurry application, olive tree orchards reaching 31% of the area and almond tree orchards 5% in 2022.
The BU basin has the particularity of the long-fallowing (18 months) practice which represents an area similar to that of the cereal, 31% of the basin, in 2022. Barley is the predominant cereal in all the basins followed by corn, with a 61.8% and a 17.4% of the total cereal area, respectively.
Table 6 summarizes the mean crop yield for the period 2018–2022 for each basin. The yield of cereals in irrigated areas was stable throughout the period analyzed; whereas, the mean yield of the rainfed cereals showed a high variability between basins due to the variability in climatic conditions.

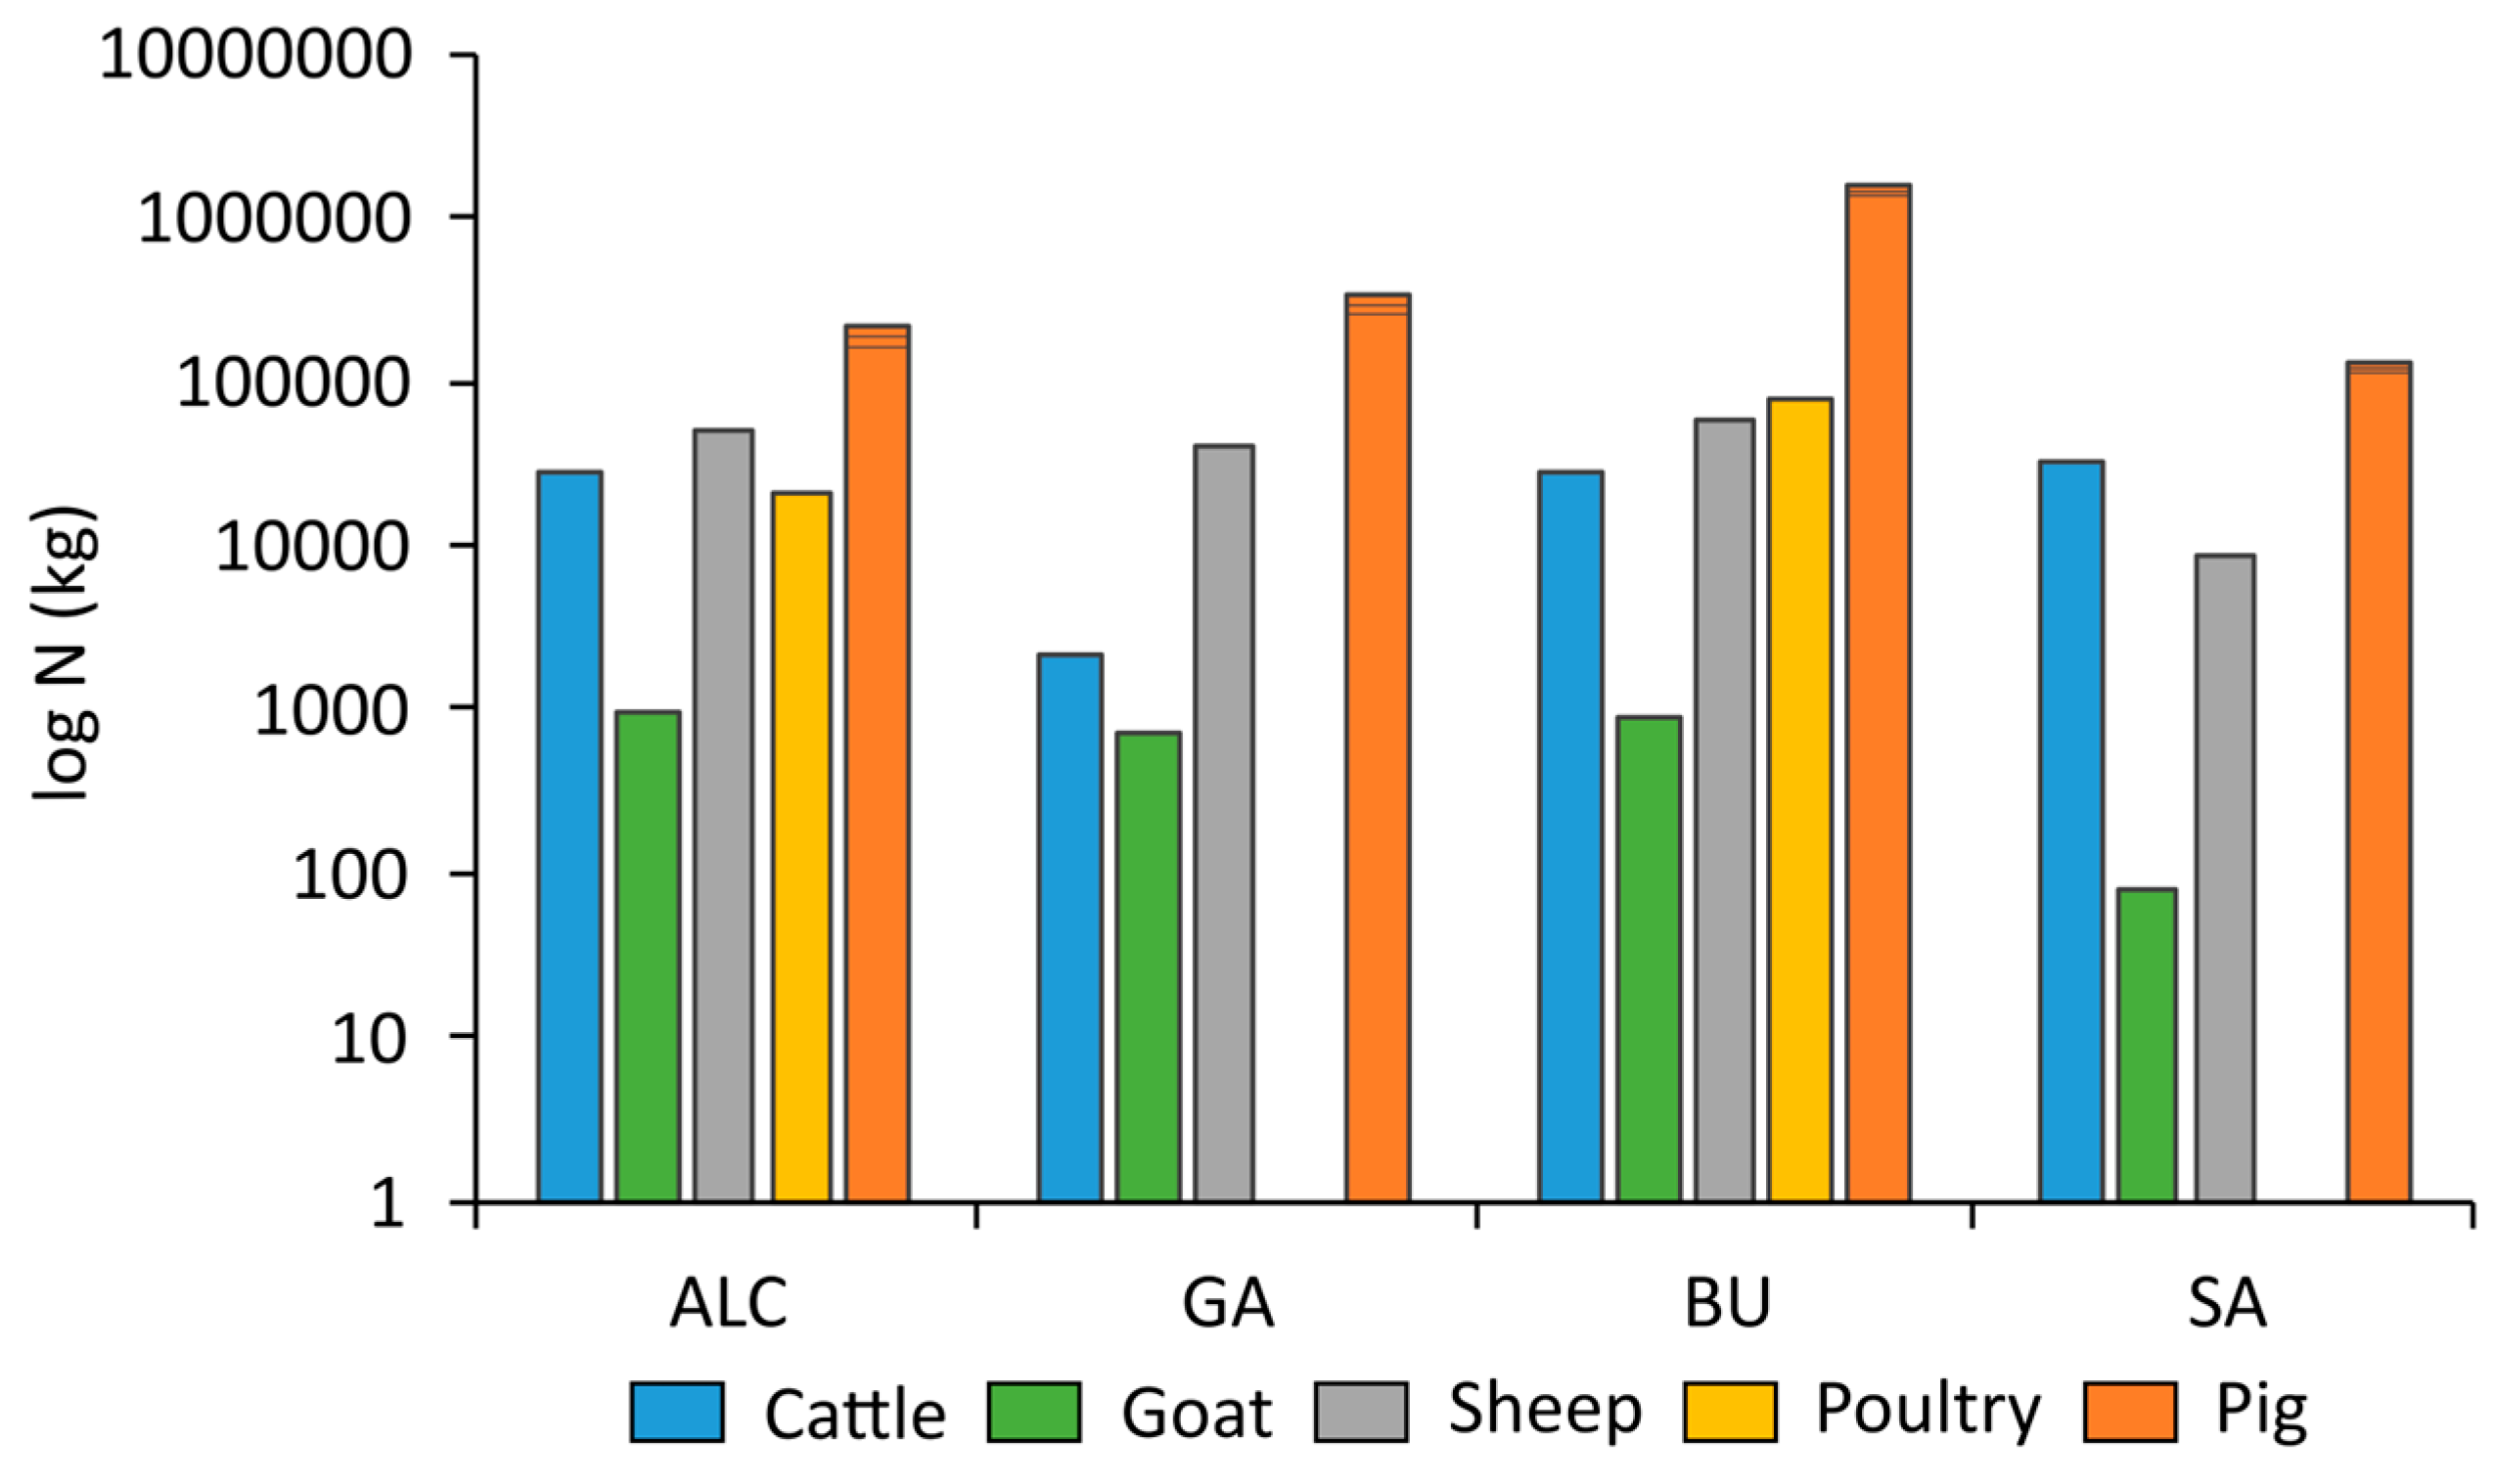
3.2. Livestock Density and N Excreted

The number of livestock farms per basin ranged from 17 in SA to 110 in BU (Table 7). Most of them are intensive farms, from 83% of all farms in ALC to 100% in GA. As expected, a high proportion of farms are located within the irrigated areas of each basin, 64% in ALC and 100% in SA. The GA basin, being practically all rainfed, is an exception. In the BU basin, most of the intensive farms (92%) are also found in the rainfed areas, although the reason here is related to the expected arrival of irrigation.
The distribution of farms within the basins in relation to the water bodies is variable (Figure 1). In the SA basin, farms can be found at a distance of 0.2 km of the only existing water body, Sariñena Lake. The minimum distance of the farms to Gallocanta Lake was 1.3 km. In BU, intensive pig farms can be found about 50 m away from the water bodies.
Pig farms, followed by sheep and beef cattle, are the most frequent, with the highest densities in terms of livestock places per hectare in SA (17.2 places ha−1) and BU (12.0 places ha−1) basins (Table 7). Livestock density is an expression of the livestock census and, therefore, most of the N excreted comes from pig farms (58–74%). Figure 5 summarizes the estimated amount of N excreted by all types of animals. The goat produces the lowest amount of total N excreted in all the basins, and the pig is the largest producer for the three calculated cases.

3.3. Crop Requirements as Organic Fertilizers

The estimated N requirement for cereals under irrigation, following the criteria of Table 3, ranged from 108.2 kg ha−1 in BU to 149 kg ha−1 in SA. In contrast, the N needs of rainfed cereals varied between 59.5 kg ha−1 in BU and 99.8 kg ha−1 in GA.
At the scale of the basin, Figure 6 shows the total N requirements for the period 2018–2022. The basins with the highest N needs to cover cereal requirement were BU and GA. The year showing minimum N requirements was 2022 for all the basins except for GA, which showed the minimum in 2018. The maximum N requirements occurred in 2020 in all basins except GA.

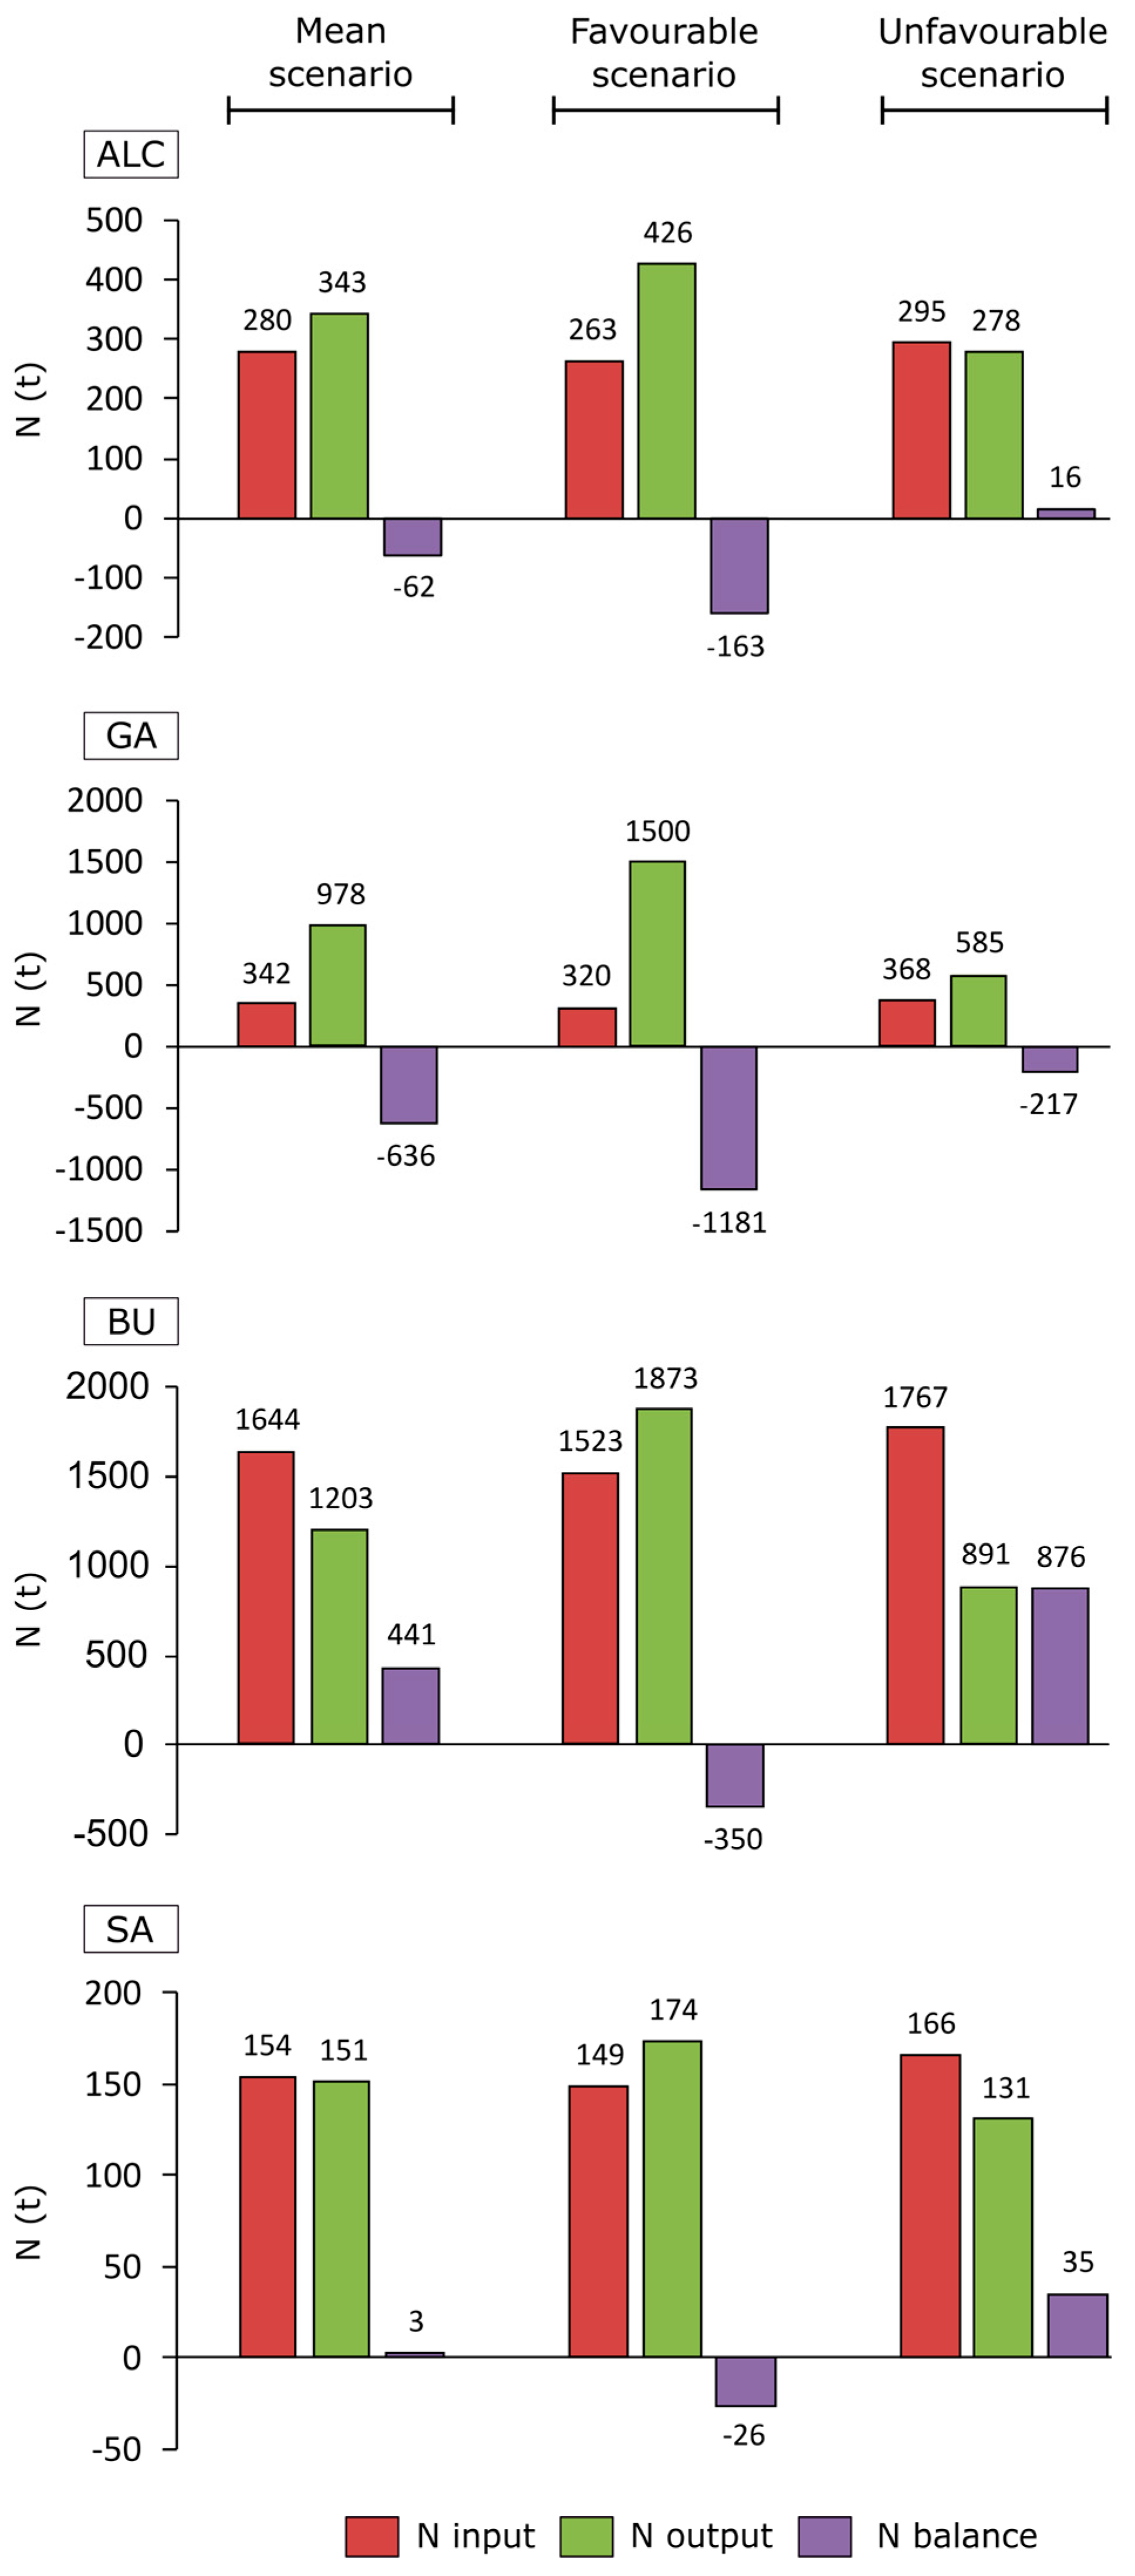
3.4. Nitrogen Balances and Indexes

Most of the farms in the ALC basin are located in the rainfed area but most of the N output (63%; 86 kg N ha−1) occurs in the irrigated area, which only produces 38% of the N input in the basin. The mean N load was 79 kg N ha−1, but the N requirements of crops were not covered in the mean scenario nor in the favourable scenario, with deficits of −62 t N and −163 t N, respectively (Figure 7). The excess in the unfavourable scenario represented 16 t N. Similarly, the LLI and SI indexes (Table 8) indicate a compatible livestock activity in the mean and favourable scenarios but a moderate saturation in the unfavourable scenario.
The N balance in the GA basin is negative under all scenarios, being able to absorb more N than the farms produce. Considering the average scenario, there is a negative balance of −636 t N, although there is a high variability in the balance, with values between −1181 t N and 217 t N, due to the high variability in yields (Figure 7). Since this is a rainfed area (99% of the basin), production, as previously mentioned, is closely associated with climatic conditions (rainfall mainly); and the N output varied by 154% between the minimum and maximum. Both the LLI and the SI indexes (Table 8) indicate that the area has the capacity to absorb more N produced in animal farms at all levels of N output.
In the BU basin, most of the N from animal farms (90%) is produced in the rainfed area, where only 58% of the N output is applied. As in the GA case, outputs of N increased by 85% from years with low yields to years with high yields, with a mean value of 58 kg N ha−1. Under the mean and unfavourable scenarios, the N balance is positive, varying between 441 t N and 876 t N, and the basin may be considered saturated and in a critical condition according to the other indices.
The estimated mean annual rates of erosion in the Farnaca watershed varied between 1 t ha−1 y−1 and 4 t ha−1 y−1 in the slopes directly feeding the wetland but reached up to 8 t ha−1 y−1 in some of the slopes in the subwatershed at the west of the wetland. But the model showed that the materials removed in the slopes of this subwatershed do not actually reach the wetland in any year, but sediment at the bottom of these slopes.
The mean number of sediments reaching the wetland was 54 t y−1, which would increase the level of the bottom of the wetland by 0.4 mm y−1, considering a wetland area of 13.1 ha. These sediments would include over 1 t of organic matter and 23.5 kg y−1 and 7.5 kg y−1 of total nitrogen and phosphorus to the wetland, respectively, including both particulate and dissolved forms.
In the SA basin, 25% of the area has not been designated as NVZ, and therefore, the application of N in winter crops in this area was increased, if required, up to 210 kg N ha−1. Furthermore, 99% of the cropland is irrigated, and as a result, mean N output is the highest for all studied basins, 167 kg N ha−1.

3.5. Runoff and Sediments in the Farnaca Watershed

We estimated through the WEPP model that only 9–10 events produced runoff every year. The mean annual runoff volume reaching the wetland was estimated at 3361 m3 y−1 (Table 9) and 55% of this volume occurred during the months of September, October, and November. Estimated mean annual loads of N and P to the Farnaca wetland are 0.24 kg N ha−1 and 0.07 kg P ha−1. The sediments produced in each slope of the Farnaca catchment, according to our model, were estimated to have mean concentrations of 0.3–1.0 g N kg−1 and 81–331 mg P kg−1. Samples taken from the surface horizon of a sequence of soils in the agricultural fields on slope 76 showed an increasing concentration in total P from the upper plateau (128–130 mg P kg−1) to the middle slope (319–324 mg P kg−1) and to the lower slope (505 mg P kg−1) (unpublished data). But the value in the 20 cm surface soil of the wetland at the bottom of slope 76 was 522 mg P kg−1, which seems to indicate a process of P enrichment of these sediments. Similarly, the concentration of total N in the latter sample was 1.4 g N kg−1, which is within the upper range of concentrations in the surface soils of the agricultural fields on the slope, 0.9–1.6 g N kg−1 (unpublished data).

4. Discussion

4.1. Organic N Load in the Basins

Environmental decision making requires appropriate indicators at the various scales where decisions have to be taken and implemented [41,42]. The Spanish Government has produced N balances at the country, regional, and provincial scales, and also for different groups of crops. At the scale of the whole of Spain, the N balances show a general decreasing trend in the net excess of total N between 2000 and 2017. For the Aragon region, a 45% decrease in agricultural N input between 2012–2015 and 2016–2017 has been reported. But a net excess of 32 kg N ha−1 remained in the agricultural sector in 2017, although it decreased to 29 kg N ha−1 in 2021 [3,29].
A different picture appears among the provinces in the Aragon region. In 1990, the province of Teruel had no excess of N from animal farms (before considering the application of mineral fertilizers), but the provinces of Huesca and Zaragoza already had excesses of 14 kg N ha−1 and 1 kg N ha−1, respectively [29]. By 2016, the excesses amounted to 8, 27, and 13 kg N ha−1 for Teruel, Huesca, and Zaragoza, and have continued increasing up to 9, 33, and 16 kg N ha−1 in 2021, respectively. This is mostly the result of the increase in the number of animals and, consequently, of the 19–22% increase in the organic N available from animal farms in the three provinces between 2016 and 2021 [29]. In 2021, the excesses represented 60–70% of the total N available from animal farms in these provinces.
Our estimates of nitrogen balances in the protected basins show contrasting situations. While the Gallocanta and Alcañiz-Calanda basins are located in the province of Zaragoza, they show balances which are clearly negative and fairly even, respectively, but opposed to the general trend of this province, where the excess of organic N is quite high. On the other hand, the Bujaraloz-Sástago basin, also in the province of Zaragoza, produced a clear positive balance. This difference among the three basins may be related to their different location in relation to the main transport routes of the region, as Gallocanta and Alcañiz-Calanda are relatively distant from them. The small excess in the Sariñena basin, 3 t N, is related to the smallest input of organic N (154 t N) among the basins studied. This is in contrast with the big excess, over 25,000 t N, in the Huesca province where it is located, which has the highest excess among the three provinces. As the expansion of pig farming, in particular, is taking place mostly in rainfed areas, we argue that the small input and excess of organic N in the Sariñena basin may be the result of the predominance of irrigated farming (99% of the utilized agricultural area in the basin).
Following the official methodologies proposed for the calculation of the three indices, we did not consider the N volatilization losses during storage and treatment and before field application, which were estimated for the whole of Spain at 26% of the generated N [43] but have been measured at 62% in other regions [42]. Therefore, these indices may overestimate the N from animal farms available for land application. But a high proportion of those emissions may actually be deposited again within the basins as part of the atmospheric input [44]. The use of mineral fertilizers is also not considered in the indices, and despite the huge excess of N from animal sources in Aragon (Table 10) data for 2023 show that the total sales of mineral N fertilizers in the Aragon region amounted to 84,466 t N [45] for a total agricultural area of 2,345,696 ha and a mean value for the region of 36 kg N ha−1. This amount significantly increases the risk of pollution of the wetlands when added to the inputs of slurries and manures.
Those caveats show that the methodologies used to obtain these indices only provide a very broad assessment of the N balance at general scales. Including mineral fertilizers in the analysis, in particular, would provide a more realistic picture of the true situation, although assessing the actual use of these fertilizers may be challenging. Furthermore, the methodologies also assume that the N dose applied during the cropping season is consistent with the crop yield obtained, which is very variable and obviously cannot be known in advance. A more realistic approach would probably be to assume that farmers will apply the maximum dose of N allowed in each field.

4.2. Runoff and Nutrients Reaching Farnaca Wetland

We consider that the estimates obtained with WEPP model applied to the Farnaca watershed are reasonable. Raclot and Albergel [46] obtained a good agreement between WEPP hydrological estimates and their own measurements at the watershed scale under Mediterranean conditions, but they reported a relatively poor performance of the model for erosion prediction. But Wang et al. [47] showed that WEPP performs well for events with runoff less than 100 mm and soil loss less than 120 t ha−1. WEPP results for the slopes in Farnaca suggest that only once in 100 years would runoff volumes up to 111 mm occur, and at the 99% probability the maximum runoff volume in the catchment would be smaller than 4 mm. Similarly, only in four years out of one hundred would erosion occur on any slope within the catchment at rates as high as 100–180 t ha−1 y−1.
The mean annual runoff reaching the Farnaca wetland was estimated at 15 mm y−1, or 5% of annual rainfall, and the mean annual sediment load was 556 kg ha−1 y−1. Samper-Calvete and García Vera [48] estimated runoff values smaller than 10% of annual rainfall in the region. Our estimated runoff and sediment loads are in the upper range of those obtained by Kosmas et al. [49] for various experimental sites in the Mediterranean with 350 mm annual rainfall under rainfed winter wheat cultivation (up to 8% and 500 kg ha−1 y−1, respectively). De Santisteban et al. [50] measured annual erosion rates of 2–115 t ha−1 y−1 in catchments of similar size to Farnaca and cultivated with winter grains but with annual rainfall values of 300–700 mm.
The increasing values of total P concentration in the surface horizons of soils in Farnaca catchment, from the upper plateau to the middle, lower, and bottom slope, indicate a process of pollution in the surface soil of the wetland by the sediments produced from the runoff and erosion of the agricultural fields. Luna et al. [51] also found total P to be an indicator of nutrient movement towards these semi-arid wetlands. Monitoring of water in some of these wetlands shows that they are in a eutrophic state considering their total P concentration (74–376 µg L−1). Sedimentation plays a key role in nutrient dynamics in semi-arid wetlands [14] and the impact of the load of nutrients in sediments is amplified in shallow wetlands [11], such as Farnaca.
Considering that the Spanish Royal Decree on Sustainable Soil Nutrition bans the use of fertilizers or manures “on those soils from which nutrients may be transported to natural habitats such as wetlands” [52], measures should be adopted to fulfil this legal requirement in the Farnaca watershed. Similar situations may appear in the other wetlands of the basins, but case-by-case studies, such as the one developed for Farnaca, are required in order to identify the wetlands that are really threatened and those that are not. The behaviour of the subwatershed within Farnaca, which, according to the modelling with WEPP, does not contribute any runoff or sediments to the wetland, suggests that the morphology of the watershed and the land use of the plots adjacent to the wetland have a significant influence on the risk of pollution from agricultural sources. Following the framework proposed by Kreiling et al. [53], further research should be aimed at defining the sites within the catchment where best management practices would be most influential in decreasing nutrient loads to the wetland.

4.3. The Protection of the Basins from Pollution

Plans and regulations at various scales have been developed to prevent pollution from agricultural sources, from the country-wide regulation of soil fertilization [52], to the ‘Plan Hidrológico’ at the Ebro Basin scale [32], and the definition of Nitrate Vulnerable Zones (NVZs) and accompanying regulations [30]. Recent studies have shown the widespread distribution of hotspots of groundwater pollution by nitrates in Europe and how only about half of these hotspots occur inside the NVZs [54]. In Spain, the area of NVZs has increased in the action’s programmes carried out every four years. In the Ebro Basin, 8911 km2 (65% over groundwater) were included as NVZs in the 2012–15 programme, and 21,615 km2 (55% over groundwater) in the 2016–19 programme [55].
The Ebro Basin Authority (CHE; the institution responsible for water quality in the Ebro Basin) argues that the action programmes have not been effective enough and that the problem is further compounded by the heavy increase in the number of animal farms in the region [55]. The challenge in meeting the water quality targets in NVZs is not only related to the time lag between implementation of mitigation measures and the actual reduction in N pollution in the water bodies [54], but first of all to the delay in the definition and implementation of those measures.
The new strategy approved by the CHE includes the Gallocanta and Bujaraloz basins as part of the priority areas for the application of new pollution control measures [55]. Among these measures, there is the rejection of proposals for new farms or extension of existing ones which plan to use their manures on agricultural fields without previously reducing their N load. But nevertheless, the 2023 plan for the Ebro Basin still suggests that a maximum N excess of 13–28 kg N ha−1 y−1 for rainfed crops (annual and woody crops, respectively) and 33–55 kg N ha−1 y−1 for irrigated crops (annuals and woody crops, respectively) is compatible with the recovery of the Gallocanta groundwater [4]. But the problem seems to be related not only to N from animal farms, as in the case of Gallocanta basin; our indices show a negative balance of about 40 kg N ha−1, but the groundwater is polluted by nitrates in almost 40% of its area [56]. Therefore, in an area with no industrial activity and very small population density, this pollution must be the result of the application of mineral fertilizers.
But another threat to these basins is the development of irrigation in the areas that are still under rainfed farming, particularly in Alcañiz and Sástago-Bujaraloz. With sprinkler irrigation, drainage flow at a catchment scale in a nearby area (La Violada, 4000 ha) amounts to over 338 mm y−1 [57] while mean runoff volume is 34 mm y−1 [58]. These hugely increased volumes of water entering the wetland in comparison with rainfed conditions would also imply changes in the season when the wetlands have a water layer on the surface, as the irrigation season would occur from April to September when the wetlands would otherwise be dry most years. Similarly, a big increase in the N flows in drainage water under irrigation is expected with amounts up to 32 kg N ha−1 [57].

5. Conclusions

The analysis of N balances at different spatial scales provides useful information to assess the N load and its potential to pollute the studied wetlands. The basins studied present different situations of livestock pressure. The balance between inputs and outputs varies between the big excess in Sástago-Bujaraloz to the negative balance of Gallocanta in the mean scenario. The balance between inputs and outputs varies between the big excess in Sástago-Bujaraloz to the negative balance of Gallocanta in the mean scenario.
Nevertheless, significant contradictions may appear between the results at this scale and the actual situation of the wetlands, as basins such as Gallocanta have a negative N balance and groundwaters are polluted by nitrates. Analysis at more detailed spatial scales is therefore required, and the use of models, such as WEPP or similar ones, provide relevant data to understand the behaviour and characteristics of runoff and sediments reaching these wetlands. Detailed soil surveys of the basin catchments are required for model application together with validation of model results.

Author Contributions

Conceptualization, M.T. and J.R.O.; methodology, M.T. and J.R.O.; software, J.R.O.; validation, M.T., J.R.O. and C.C.; formal analysis, M.T., J.R.O. and C.C.; investigation, M.T., J.R.O. and C.C.; data curation, M.T. and J.R.O.; writing—original draft preparation, M.T., J.R.O. and C.C.; writing—review and editing, M.T., J.R.O. and C.C.; visualization, M.T.; supervision, C.C.; project administration, C.C.; funding acquisition, C.C. All authors have read and agreed to the published version of the manuscript.

Funding

This research was possible by the grant TED2021-130303B-I00 funded by MCIN/AEI/10.13039/501100011033 and by the “European Union NextGenerationEU/PRTR”, and the grant PID2021-127170OB-I00 funded by MCIN/AEI/10.13039/501100011033 and by “ERDF A way of making Europe”.

Data Availability Statement

Geographic information data are freely available at Mendeley Data, https://data.mendeley.com/datasets/4fgvgkhhkh/1 (accessed on 27 May 2025). More data are available upon request.

Acknowledgments

We first acknowledge the assistance of Rosa Yagüe for her methodological guidance and conceptual basis to develop this study within the TED2021-130303B-I00 project. We also acknowledge the Government of Aragon for providing data on livestock census and crop yield, and the ‘Ministerio de Agricultura, Pesca y Alimentación’ of Spain for the data of Valfarta weather station (https://servicio.mapa.gob.es/websiar/ (accessed on 27 May 2025)).

Conflicts of Interest

The authors declare no conflicts of interest.

Abbreviations

The following abbreviations are used in this manuscript:
NVZsNitrate Vulnerable Zones
WEPPWater Erosion Prediction Project
NDNitrate Directive
UAAUtilized Agricultural Area
ALCSaladas de Alcañiz-Calanda
GAGallocanta Lake
BUSaladas de Sástago-Bujaraloz
SASariñena Lake
WFDWater Framerwork Directive
CAPCommon Agricultural Policy
GSSAGeoSpatial Aid Application
NBNitrogen Balance
LLILivestock Load Index
SISaturation Index

References

  1. Wood, A.; Van Halsema, G. Scoping agriculture-wetland interactions: Towards a sustainable multiple-response strategy. FAO Water Rep. 2008, 33, 155. Available online: https://www.fao.org/fileadmin/user_upload/faowater/docs/WaterReports33.pdf (accessed on 27 May 2025).
  2. Wu, W.; Ma, B. Integrated nutrient management (INM) for sustaining crop productivity and reducing environmental impact: A review. Sci. Total Environ. 2015, 512, 415–427. [Google Scholar] [CrossRef] [PubMed]
  3. MITECO (Ministerio para la Transición Ecológica y el Reto Demográfico). Informe de Seguimiento de la Directiva 91/676/CEE. In Contaminación del Agua por Nitratos Utilizados en la Agricultura. Cuatrienio 2016–2019; MTERD: Madrid, Spain, 2020; p. 308. Available online: https://www.miteco.gob.es/content/dam/miteco/es/agua/temas/estado-y-calidad-de-las-aguas/informe-2016-2019_tcm30-518402.pdf (accessed on 27 May 2025).
  4. MITECO (Ministerio para la Transición Ecológica y el Reto Demográfico). Real Decreto 35/2023, de 24 de enero, por el que se Aprueba la Revisión de los Planes Hidrológicos de las Demarcaciones Hidrográficas del Cantábrico Occidental, Guadalquivir, Ceuta, Melilla, Segura y Júcar, y de la parte española de las demarcaciones hidrográficas del Cantábrico Oriental. Miño-Sil, Duero, Tajo, Guadiana y Ebro; 2023; nº 35, p. 19510. Available online: https://www.boe.es/boe/dias/2023/02/10/pdfs/BOE-A-2023-3511.pdf (accessed on 27 May 2025).
  5. Eurostat. Pig Population–Annual Data, Online Data Code: Apro_mt_lspig; Eurostat: Luxembourg, 2024; Available online: https://ec.europa.eu/eurostat/databrowser/product/page/APRO_MT_LSPIG (accessed on 27 May 2025).
  6. Masaka, J.; Wuta, M.; Nyamangara, J.; Themba-Mugabe, F. Effect of manure quality on nitrate leaching and groundwater pollution in wetland soil under field tomato (Lycopersicon esculentum, Mill var. Heinz) rape (Brassica napus, L. var. Giant). Nutr. Cycl. Agroecosystems 2013, 96, 149–170. [Google Scholar] [CrossRef]
  7. Deng, M.; Hou, M.; Zhang, Q.; Bellingrath-Kimura, S.D. Critical livestock densities and manure management for the typical paddy rice and corn cropping systems in an intensive livestock watershed, Japan. Agric. Syst. 2020, 177, 102722. [Google Scholar] [CrossRef]
  8. De Vries, J.W.; Groenestein, C.M.; De Boer, I.J.M. Environmental consequences of processing manure to produce mineral fertilizer and bio-energy. J. Environ. Manag. 2012, 102, 173–183. [Google Scholar] [CrossRef]
  9. Akinnawo, S.O. Eutrophication: Causes, consequences, physical, chemical and biological techniques for mitigation strategies. Environ. Chall. 2023, 12, 100733. [Google Scholar] [CrossRef]
  10. Sharpley, A.N.; McDowell, R.W.; Kleinman, P.J.A. Phosphorus loss from land to water: Integrating agricultural and environmental management. Plant Soil 2001, 237, 287–307. [Google Scholar] [CrossRef]
  11. Zhou, J.; Leavitt, P.R.; Zhang, Y.; Qin, B. Anthropogenic eutrophication of shallow lakes: Is it occasional? Water Res. 2022, 221, 118728. [Google Scholar] [CrossRef]
  12. Pérez-Martín, M.A. Understanding Nutrient Loads from Catchment and Eutrophication in a Salt Lagoon: The Mar Menor Case. Water 2023, 15, 3569. [Google Scholar] [CrossRef]
  13. Lemly, A.D.; Finger, S.E.; Nelson, M.K. Sources and impacts of irrigation drainwater contaminants in arid wetlands. Environ. Toxicol. Chem. 1993, 12, 2265–2279. [Google Scholar] [CrossRef]
  14. Sánchez-Carrillo, S.; Álvarez-Cobelas, M. Nutrient Dynamics and Eutrophication Patterns in a Semi-Arid Wetland: The Effects of Fluctuating Hydrology. Water Air Soil Pollut. 2001, 131, 97–118. [Google Scholar] [CrossRef]
  15. Álvarez-Cobelas, M.; Sánchez-Carrillo, S.; Cirujano, S.; Angeler, D.G. A Story of the Wetland Water Quality Deterioration: Salinization, Pollution, Eutrophication and Siltation. In Ecology of Threatened Semi-Arid Wetlands. Wetlands: Ecology, Conservation and Management, 2nd ed.; Sánchez-Carrillo, S., Angeler, D., Eds.; Springer: Berlin/Heidelberg, Germany, 2010; Volume 2. [Google Scholar] [CrossRef]
  16. Menéndez-Serra, M.; Triadó-Margarit, X.; Castañeda, C.; Herrero, J.; Casamayor, E.O. Microbial composition, potential functional roles and genetic novelty in gypsum-rich and hypersaline soils of Monegros and Gallocanta (Spain). Sci. Total Environ. 2019, 650, 343–353. [Google Scholar] [CrossRef] [PubMed]
  17. Bourhane, Z.; Cagnon, C.; Castañeda, C.; Rodríguez-Ochoa, R.; Álvaro-Fuentes, J.; Cravo-Laureau, C.; Duran, R. Vertical organization of microbial communities in Salineta hypersaline wetland, Spain. Front. Microbiol. 2023, 14, 869901. [Google Scholar] [CrossRef]
  18. Blanco, S.; Viso, R.; Borrego-Ramos, M.; López-flores, R.; Mota-Echadía, D.; Tierra, M.; Herrero, J.; Castañeda, C. The Ecology of Benthic Diatom Assemblages in Saline Wetlands of the Ebro Basin, NE Spain. Microb. Ecol. 2025, 88, 16. [Google Scholar] [CrossRef]
  19. Williams, W.D. Environmental threats to salt lakes and the likely status of inland saline ecosystems in 2025. Environ. Conserv. 2002, 29, 154–167. [Google Scholar] [CrossRef]
  20. Castañeda, C.; Herrero, J. Assessing the degradation of saline wetlands in an arid agricultural region in Spain. Catena 2008, 72, 205–213. [Google Scholar] [CrossRef]
  21. Domínguez-Beisiegel, M.; Herrero, J.; Castañeda, C. Saline wetlands’ fate in inland deserts: An example of 80years’ decline in monegros, spain. Land Degrad. Dev. 2013, 24, 250–265. [Google Scholar] [CrossRef]
  22. Castañeda, C.; López-Flores, R.; Román, A.; Mota, D.; Tierra, M.; Abdelrazek, A.; Navarro, G. Uso de drones para muestreo de agua y adquisición de datos multiespectrales en humedales protegidos de Aragón afectados por intensificación agrícola. In Actas XX Congreso de la Asociación Española de Teledetección; Universidad de Cádiz: Cádiz, Spain, 2024. [Google Scholar]
  23. Ramsar Convention Secretariat. Designating Ramsar Sites: Strategic Framework and guidelines for the future development of the List of Wetlands of International Importance. In Ramsar Handbooks for the Wise Use of Wetlands, 4th ed.; Ramsar Convention Secretariat: Gland, Switzerland, 2010; Volume 17, p. 120. Available online: https://www.ramsar.org/sites/default/files/documents/pdf/lib/hbk4-17.pdf (accessed on 27 May 2025).
  24. Castañeda, C.; Gracia, F.J.; Luna, E.; Rodríguez-Ochoa, R. Edaphic and geomorphic evidences of water level fluctuations in Gallocanta Lake, NE Spain. Geoderma 2015, 239-240, 265–279. [Google Scholar] [CrossRef]
  25. Aragüés, R.; Puy, J.; Royo, A.; Espada, J.L. Three-year field response of young olive trees (Olea europaea L., cv. Arbequina) to soil salinity: Trunk growth and leaf ion accumulation. Plant Soil 2005, 271, 265–273. [Google Scholar] [CrossRef]
  26. Alberto, F.; Aragüés, R. La problemática general de la salinidad en la Cuenca del Ebro. 1983. Available online: https://explore.openaire.eu/search/publication?pid=10261%2F132182 (accessed on 27 May 2025). (In Spanish).
  27. Lecina, S.; Isidoro, D.; Playán, E.; Aragüés, R. Irrigation Modernization in Spain: Effects on Water Quantity and Quality-A Conceptual Approach. Int. J. Water Resour. Dev. 2010, 26, 265–282. [Google Scholar] [CrossRef]
  28. Quirantes, J. Estudio Sedimentológico y Estratigráfico del Terciario Continental de los Monegros; Institución Fernando El Católico: Zaragoza, Spain, 1978; p. 208. Available online: https://ifc.dpz.es/publicaciones/ebooks/id/0792 (accessed on 27 May 2025).
  29. MAPA (Ministerio de Agricultura, Pesca y Alimentación). Balance de nitrógeno en la Agricultura Española (Años 1990–2021). Criterios Utilizados; MAPA: Madrid, Spain, 2023; p. 282. Available online: https://www.mapa.gob.es/es/agricultura/temas/medios-de-produccion/a00_metodologia_bn2021_tcm30-674948.pdf (accessed on 27 May 2025). (In Spanish)
  30. DGA (Diputación General de Aragón). Order AGM/83/2021, from February 15, por la que se Designan y Modifican las Zonas Vulnerables a la Contaminación de las Aguas por Nitratos Procedentes de Fuentes Agrarias en la Comunidad Autónoma de Aragón y por la que se Aprueba el V Programa de Actuación sobre las Zonas Vulnerables de Aragón; DGA: Zaragoza, Spain, 2021; BOA nº 47; pp. 9286–9330. Available online: https://www.boa.aragon.es/cgi-bin/EBOA/BRSCGI?CMD=VEROBJ&MLKOB=1151989261212&type=pdf (accessed on 27 May 2025).
  31. MAPA (Ministerio de Agricultura, Pesca y Alimentación). Informe anual de implantación anual de mejores técnicas disponibles en el sector porcino intensivo. 2022. In Ministerio de Agricultura, Pesca y Alimentación. Dirección General de Producciones y Mercados Agrarios; MAPA: Madrid, Spain, 2022; p. 147. Available online: https://www.mapa.gob.es/en/ganaderia/temas/ganaderia-y-medio-ambiente/informeanualdeimplantacionmtdporcino2022def1_tcm38-661837.pdf (accessed on 27 May 2025).
  32. BOE (Boletín Oficial del Estado). Royal Decree RD47/2022, from January 18, Sobre Protección de las Aguas Contra la Contaminación Difusa Producida por los Nitratos Procedentes de Fuentes Agrarias; BOE: Madrid, Spain, 2022; BOA nº 17; p. 5664. Available online: https://www.boe.es/boe/dias/2022/01/20/pdfs/BOE-A-2022-860.pdf (accessed on 27 May 2025).
  33. Orús, F.; Quílez Sáez De Viteri, D.; Betrán Aso, J. El código de Buenas Prácticas Agrarias (I): Fertilización nitrogenada y contaminación por nitratos. In Informaciones Técnicas; Gobierno de Aragón, Centro de Transferencia Tecnológica en Producción Vegetal, Eds.; Gobierno de Aragón: Zaragoza, Spain, 2000; Volume 93, p. 21. Available online: https://bibliotecavirtual.aragon.es/i18n/catalogo_imagenes/grupo.cmd?path=3705254 (accessed on 27 May 2025).
  34. DOGC (Diari Oficial de la Generalitat de Catalunya). Decree 153/2019, from July 3, of Department of Presidency, de Gestión de la Fertilización del Suelo y de las Deyecciones Ganaderas y de Aprobación del Programa de Actuación en las Zonas Vulnerables en Relación con la Contaminación por Nitratos Procedentes de Fuentes Agrarias; DOGC: Catalunya, Spain, 2019; nº 7911; p. 101. Available online: https://residus.gencat.cat/web/.content/home/consultes_i_tramits/normativa/normativa_catalana_en_materia_de_residus/decret_153_2019_es.pdf (accessed on 27 May 2025).
  35. DGA (Diputación General de Aragón). Order AGM/900/2021, from June 29, of Department of Agriculture, Livestock and Environment, por la que se Establece la Herramienta de Cálculo del Contenido en Nitrógeno de los Estiércoles Generados en Explotaciones Porcinas de la Comunidad Autónoma de Aragón y se Determina el Procedimiento de Reconocimiento de la Reducción del Contenido de Nitrógeno en el Estiércol Generado por Dichas Explotaciones Respecto a los Valores Estándar; DGA: Zaragoza, Spain, 2021; BOA nº 160; pp. 34691–34698. Available online: https://www.boa.aragon.es/cgi-bin/EBOA/BRSCGI?CMD=VEROBJ&MLKOB=1178479463636&type=pdf (accessed on 27 May 2025).
  36. USDA-ARS; NSERL; Purdue University. WEPP Hillslope Model. In Windows Interface; Version 2012.8; National Soil Erosion Research Laboratory; USDA-ARS: West Lafayette, IN, USA, 2012. [Google Scholar]
  37. Daverede, I.C.; Kravchenko, A.N.; Hoeft, R.G.; Nafziger, E.D.; Bullock, D.G.; Warren, J.J.; Gonzini, L.C. Phosphorus runoff from incorporated and surface-applied liquid swine manure and phosphorus fertilizer. J. Environ. Qual. 2004, 33, 1535–1544. [Google Scholar] [CrossRef] [PubMed]
  38. Miller, J.J.; Olson, E.C.S.; Chanasyk, D.S.; Beasley, B.W.; Larney, F.J.; Olson, B.M. Phosphorus and nitrogen in rainfall simulation runoff after fresh and composted beef cattle manure application. J. Environ. Qual. 2006, 35, 1279–1290. [Google Scholar] [CrossRef] [PubMed]
  39. Miller, J.J.; Chanasyk, D.S.; Curtis, T.W.; Olson, B.M. Phosphorus and nitrogen in runoff after phosphorus- or nitrogen-based manure applications. J. Environ. Qual. 2011, 40, 949–958. [Google Scholar] [CrossRef]
  40. Volf, C.A.; Ontkean, G.R.; Bennett, D.R.; Chanasyk, D.S.; Miller, J.J. Phosphorus losses in simulated ranifall runoff from manured soils of Alberta. J. Environ. Qual. 2007, 36, 730–741. [Google Scholar] [CrossRef]
  41. Vizzari, M.; Antognelli, S.; Pauselli, M.; Benincasa, P.; Farneselli, M.; Morbidini, L.; Borghi, P.; Bodo, G.; Santucci, A. Potential nitrogen load from crop-livestock systems: A spatial database for a multi-scale assessment and mapping. Int. J. Agric. Environ. Inf. Syst. 2016, 7, 21–40. [Google Scholar] [CrossRef]
  42. Huezo, L.; Jones, D.; Edwards, E.; Sharara, M. Manure nutrient cycling in US animal agriculture basins-North Carolina case study. J. Environ. Qual. 2023, 53, 198–208. [Google Scholar] [CrossRef]
  43. Oenema, O.; Oudendag, D.; Velthof, G.L. Nutrient losses from manure management in the European Union. Livest. Sci. 2007, 112, 261–272. [Google Scholar] [CrossRef]
  44. Asman, W.A.H.; Sutton, M.A.; Schjørring, J.K. Ammonia: Emission, atmospheric transport and deposition. New Phytol. 1998, 139, 27–48. [Google Scholar] [CrossRef]
  45. MAPA (Ministerio de Agricultura, Pesca y Alimentación). Estadística de Consumo de Fertilizantes en la Agricultura 2023; MAPA: Madrid, Spain, 2024; p. 282. Available online: https://www.mapa.gob.es/es/estadistica/temas/estadisticas-agrarias/fertilizantes2023_definitivoswebpdf_tcm30-694345.pdf (accessed on 27 May 2025).
  46. Raclot, D.; Albergel, J. Runoff and water erosion modelling using WEPP on a Mediterranean cultivated catchment. Phys. Chem. Earth 2006, 31, 1038–1047. [Google Scholar] [CrossRef]
  47. Wang, S.; McGehee, R.P.; Guo, T.; Flanagan, D.C.; Engel, B.A. Calibration, validation, and evaluation of the Water Erosion Prediction Project (WEPP) model for hillslopes with natural runoff plot data. Int. Soil Water Conserv. Res. 2022, 11, 669–687. [Google Scholar] [CrossRef]
  48. Samper-Calvete, F.J.; García-Vera, M.A. Inverse modeling of groundwater flow in the semiarid evaporitic closed basin of Los Monegros, Spain. Hydrogeol. J. 1998, 6, 33–49. [Google Scholar] [CrossRef]
  49. Kosmas, C.; Danalatos, N.; Cammeraat, L.H.; Chabart, M.; Diamantopoulos, J.; Farand, R.; Gutiérrez, L.; Jacob, A.; Marques, H.; Martínez-Fernández, J.; et al. The effect of land use on runoff and soil erosion rates under Mediterranean conditions. Catena 1997, 29, 45–59. [Google Scholar] [CrossRef]
  50. De Santisteban, L.M.; Casalí, J.; López, J.J. Assessing soil erosion rates in cultivated areas of Navarre (Spain). Earth Surf. Process. Landf. 2006, 31, 487–506. [Google Scholar] [CrossRef]
  51. Luna, E.; Jouany, C.; Castañeda, C. Soil composition and plant nutrients at the interface between crops and saline wetlands in arid environments in NE Spain. Catena 2019, 173, 384–393. [Google Scholar] [CrossRef]
  52. MPRCMD (Ministerio de la Presidencia, Relaciones con las Cortes y Memoria Democrática). Real Decreto 1051/2022, de 27 de Diciembre, por el que se Establecen Normas Para la Nutrición Sostenible en los Suelos Agrarios; MPRCMD: Madrid, Spain, 2022; BOA nº 312; p. 188873. Available online: https://www.boe.es/boe/dias/2022/12/29/pdfs/BOE-A-2022-23052.pdf (accessed on 27 May 2025).
  53. Kreiling, R.M.; Thoms, M.C.; Richardson, W.B. Beyond the edge: Linking agricultural landscapes, stream networks, and best management practices. J. Environ. Qual. 2017, 47, 42–53. [Google Scholar] [CrossRef]
  54. Serra, J.; Marques-dos-Santos, C.; Marinheiro, J.; Cruz, S.; Cameira, M.R.; de Vries, W.; Dalgaard, T.; Hutchings, N.J.; Graversgaard, M.; Giannini-Kurina, F.; et al. Assessing nitrate groundwater hotspots in Europe reveals an inadequate designation of Nitrate Vulnerable Zones. Chemosphere 2024, 355, 141830. [Google Scholar] [CrossRef]
  55. CHE (Confederación Hidrográfica del Ebro). Estrategia de la Confederación Hidrográfica del Ebro Para la Lucha Contra el Elevado Contenido de Nitratos en las Aguas de la Cuenca (Estrategia NITRACHE). In Adaptación a Nueva Normativa y Criterio Interpretativo, 12 de diciembre de 2024; CHE: Zaragoza, Spain, 2024; Available online: https://portal.chebro.es/documents/20121/972743/20241212%27+Estrategia_NITRACHE.pdf/75c39850-1196-2ef1-73f5-d2fbd968381b?t=1734089387380 (accessed on 27 May 2025).
  56. CHE (Confederación Hidrográfica del Ebro). Plan Hidrológico de la Demarcación Hidrográfica del Ebro, Cuarto Ciclo (2028–2033). In Documentos Iniciales. Anejo 14: Evaluación Preliminar de Impactos en las Masas de Agua Subterránea; CHE: Zaragoza, Spain, 2024; Available online: https://www.chebro.es/documents/20121/2459045/PHE4_pDDII_Anejo14_Impac-MSBT_V04.pdf/cfc78dc3-e4cb-9ef1-620f-72d2b0f2174e?t=1734622236305 (accessed on 27 May 2025).
  57. Jiménez-Aguirre, M.T.; Isidoro, D. Hydrosaline balance in and nitrogen loads from an irrigation district before and after modernization. Agric. Water Manag. 2018, 208, 163–175. [Google Scholar] [CrossRef]
  58. Barros, R.; Isidoro, D.; Aragüés, R. Long-term water balances in La Violada irrigation district (Spain): I. sequential assessment and minimization of closing errors. Agric. Water Manag. 2011, 102, 35–45. [Google Scholar] [CrossRef]
Figure 1. (a) Location of the study areas in the Ebro Basin and the four wetlands watersheds: (b) Sástago-Bujaraloz (BU); (c) Alcañiz-Calanda (ALC); (d) Sariñena (SA); (e) Gallocanta (GA) showing the location of the wetlands, the intensive farms, the irrigated area, and the nitrates vulnerable zones (NVZs).
Land 14 01170 g001
Figure 2. LiDAR-derived Digital Elevation Model of the studied basins (left) and their corresponding slope maps (right). Wetlands are delimited in blue.
Land 14 01170 g002
Figure 3. Crop maps of 2022. (a) Saladas de Sástago-Bujaraloz basin; (b) Saladas de Alcañiz basin; (c) Sariñena Lake basin; (d) Gallocanta Lake basin. Legend is simplified from the information of agricultural parcels provided by individual farmers declaration in the frame of Common Agriculture Policy subsidies.
Land 14 01170 g003
Figure 4. Slope map of the Farnaca watershed obtained from the available LiDAR-derived Digital Elevation Model (LiDAR-PNOA-cob2 2015 CC-BY 4.0 (scne.es)). The red perimeter shows the eight slope segments with the numbers indicated, and the subwatershed modelled with WEPP.
Land 14 01170 g004
Figure 5. Total N excreted per basin (kg N) regarding the type of animal according to the regulations based on [30]; Aragon [30]; Spain [31].
Land 14 01170 g005
Figure 6. Requirements of N (t) per basin and year for the period 2018–2022.
Land 14 01170 g006
Figure 7. Values of inputs, outputs, and balance in the three scenarios during the study period (“Mean”: mean values of N inputs and outputs; “Favourable”: minimum production and maximum output of N; “Unfavourable”: maximum production and minimum output of N) for the four basins studied (ALC: Saladas de Alcañiz; GA: Gallocanta Lake; BU: Saladas de Sástago-Bujaraloz; SA: Sariñena Lake).
Land 14 01170 g007
Table 1. Main characteristics of the wetlands and their basin. Meteorological data obtained from the Spanish Agroclimatic Information System for Irrigation (SIAR), https://servicio.mapa.gob.es/websiar/SeleccionParametrosMap.aspx?dst=1 (accessed on 27 May 2025), for the period 2004–2024, except for GA, obtained from [24].
Main CharacteristicsWetland Basin
ALCGABUSA
Wetland basin
Basin area (ha)12,92535,18735,5191959
Mean annual rainfall (mm)366487359378
Mean annual ET0 (mm)1312110012621217
AgricultureRainfed and IrrigatedRainfedRainfed and IrrigatedIrrigated
Wetland
Surface area (ha)17914001917141
Elevation (m a.s.l.)350990325330
Hydrological regimeFluctuating until dryFluctuating until dryFluctuating until dryPermanent
Depth of water column (m)<0.5<2.8<0.5<3
Water salinity (dS m−1)4–9016−>100Up to 4002.5–3
Table 2. Standard N excreted by pig farms (kg place−1 y−1) according to the regulations from regional government [30] and the Ministry of Agriculture [31], and N excreta levels established in this work: (1) minimum, (2) medium, and (3) maximum. Bold letters indicate minimum and maximum range in each regulation.
Pig TypeExcreted N (kg Place−1 y−1)
Regional Regulation [30] (1)National Regulation [31]
Mean for Aragón (2)Mean for Spain (3)
Sow with piglets up to 20 kg18.00
Replacement sow8.50
Piglets from 6 to 20 kg1.19
Pigs from 20 to 100 kg7.25
Boars18.00
Weaned piglets 6–20 kg 2.102.40
Fattening pigs 20–100 kg 7.608.40
Breeding sows/Sow with piglets < 6 kg 21.8020.50
Table 3. Limiting criteria used in this work to estimate the amount of N organic fertilization.
Parameter/CriteriaSourceUpper Threshold (kg N ha−1)/Class
Designation of Nitrates Vulnerable Zones (NVZs)General reference upper limits [16]170 (rainfed)
210 (irrigated)
Type of production areaAnnex XIV [30]Type 1: Arid rainfed
Type 2: Humid rainfed
Type 3: Irrigated
N output (N ha−1) based on expected production in vulnerable areas:
30 kg N t−1 winter cereal
25 kg N t−1 sprinkler corn
Annex III [30]Winter cereal (Type 1): 90
Winter cereal (Type 2): 150 Sprinkler corn: 380
N output (N ha−1) in non-vulnerable areas (kg N t−1)Own crop production data and [32]Own data up to 210
Slope of agricultural plotGSAA dataset attributes15%
Table 5. Main agricultural characteristics of the basins studied. The Agricultural Area (AA), e.g., the total area of declared agricultural plots, has been computed as the mean of the period 2018–2022.
ParameterWetland Basin
ALCGABUSA
Agricultural area (AA) (ha)10,54816,88533,1421383
Irrigated area (ha)2644.4136.44116.81365.8
Nitrates Vulnerable Zone (ha)2955.618,492.835,339.61468.3
Cereal area with <15% slope (ha)4203.011,461.718,944.5756.2
Table 6. Mean and standard deviation of the cereal yield (t ha−1) from 2018 to 2022 accounted for the irrigated (I) and rainfed (R) areas of the four wetlands basins.
Cereal TypeYield (t ha−1) per Wetland Basin
ALCGABUSA
IRIRIRIR
Barley6.9 (±0.5)2.3 (±1.0)4.6 (±0.9)3.9 (±0.8)7.6 (±0.5)1.9 (±1.0)7.0 (±0.5)2.2 (±1.1)
Common wheat6.7 (±0.3)2.1 (±1.3)4.3 (±0.8)3.6 (±1.1)6.5 (±0.7)1.4 (±1.1)5.6 (±1.0)1.7 (±0.9)
Corn13.4 (±1.1)7.5 (±0.5)13.4 (±1.1)7.5 (±0.5)12.3 (±2.9)8.8 (±2.9)13.4 (±1.1)7.5 (±0.5)
Durum wheat5.6 (±0.5)1.5 (±1.1)3.8 (±0.9)3.2 (±1.0)6 (±0.0)1.3 (±1.0)5.0 (±1.4)1.7 (±0.7)
Rye-0.7 (±0.0)4 (±0.6)3.4 (±1.1)-1 (±0.7)3.0 (±0.0)1.6 (±0.5)
Oat3.8 (±0.4)2.2 (±1.0)3.3 (±0.8)2.9 (±0.8)-1.6 (±0.9)3.0 (±0.0)2.2 (±0.6)
Table 7. Number of farms (farms), livestock places (places), and livestock density (places ha−1) in the total agricultural area per basin declared in the CAP (AA); places accounts for the total number of places available in the intensive farms, as declared in the official administrative Register of Livestock Farms of Aragon.
Animal TypeALCGABUSA
AA: 3472.3AA: 8780.9AA: 16,606.6AA: 869.2
FarmPlacesPlaces ha−1FarmPlacesPlaces ha−1FarmPlacesPlaces ha−1FarmPlacesPlaces ha−1
Cattle51000.0311-914000.08912781.2
Goat101210.039900.01121100.011100.01
Pig1224,6787.11539,4034.575199,59212.02714,92317.2
Poultry253,52415.4---14344,00033.3---
Sheep1491962.71472370.81210,2550.6115301.8
Table 8. Livestock Load Index (LLI) and Saturation Index (SI) in different N requirement of the crop and the compatibilization level of the system for the further implementation of N. C. abs: capacity to absorb.
N Requirements of the Crop
IndexWatershedMediumHighLow
LLIALC0.9
Compatible
0.7
C. abs
1.0
Moderate
GA0.4
C. abs
0.3
C. abs
0.6
C. abs
BU1.4
Saturated
0.9
Compatible
1.9
Saturated
SA1.0
Moderate
0.9
Compatible
1.2
Moderate
SIALC−18.2
Compatible
−34.2
Compatible
0.7
Moderate
GA−65.0
Compatible
−77.2
Compatible
−41.5
Compatible
BU36.7
Severe
−12.2
Compatible
84.5
Critic
SA1.8
Moderate
−11.6
Compatible
17.9
Moderate
Table 9. Estimated mean annual values of runoff, sediments, organic matter, and total nitrogen and phosphorus reaching the Farnaca wetland from the various slope segments and subwatersheds.
Slope/
Subwatershed
Area (ha)Runoff
(mm y−1)
Sediments
(kg y−1)
Organic Matter
(kg y−1)
Nitrogen
(kg y−1)
Phosphorus
(kg y−1)
760.6615.02604110.60.2
802.1614.064656842.10.7
922.1614.4586901472.20.7
48e2.6517.2764961323.41.1
48c2.7712.652158452.10.7
48w4.1115.3867421343.61.1
Subwatershed74.1800000
634.7013.8216,4263325.51.7
793.8815.4283171674.01.3
Table 10. Amounts of N (t) in animal feces in the provinces of Aragon [29]. Avail.: N in manures/slurries—N in manures/slurries lost in storage and management; Used: N from manures/slurries applied to crops; Excess: N from manures/slurries applied to crops in excess of the crop requirements.
Aragon ProvincesN from Animal Farms (t)
199020162021
Avail.UsedExcessAvail.UsedExcessAvail.UsedExcess
Huesca15,59415,59410,53529,37329,37320,92135,88435,88425,099
Teruel379237920774177415330911791175892
Zaragoza85768576104020,51220,51211,48624,30924,30914,692
Disclaimer/Publisher’s Note: The statements, opinions and data contained in all publications are solely those of the individual author(s) and contributor(s) and not of MDPI and/or the editor(s). MDPI and/or the editor(s) disclaim responsibility for any injury to people or property resulting from any ideas, methods, instructions or products referred to in the content.

