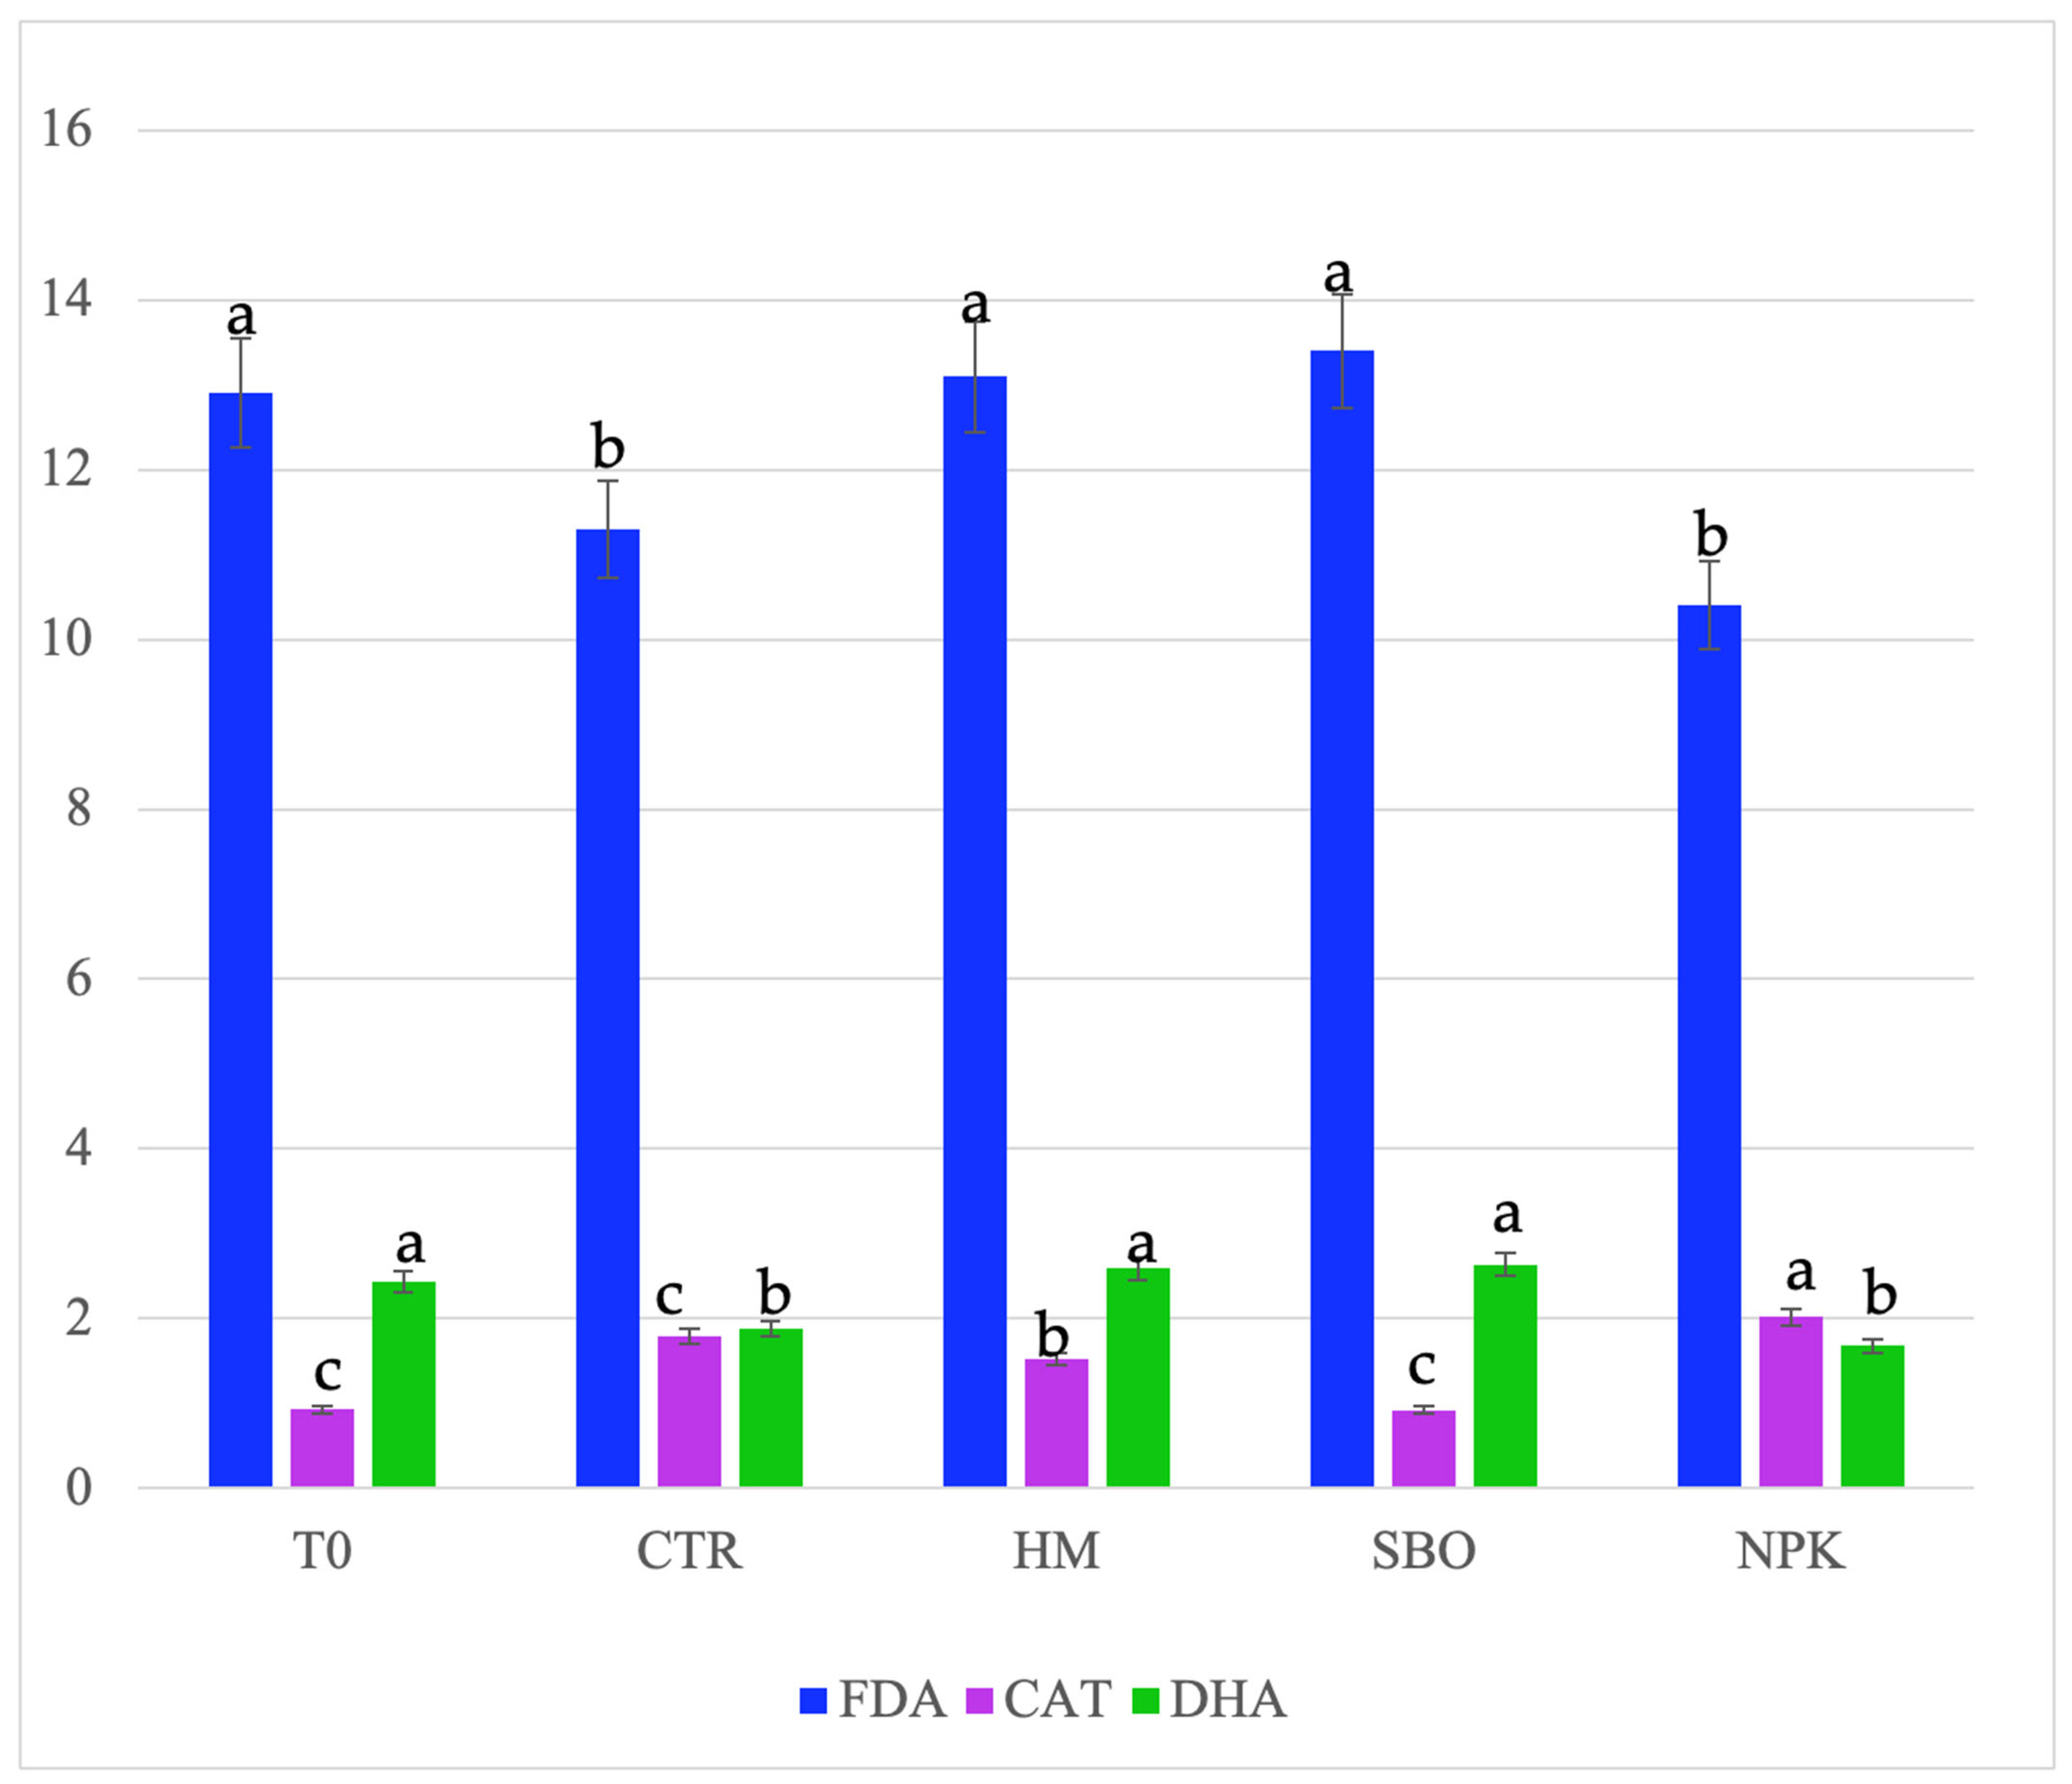
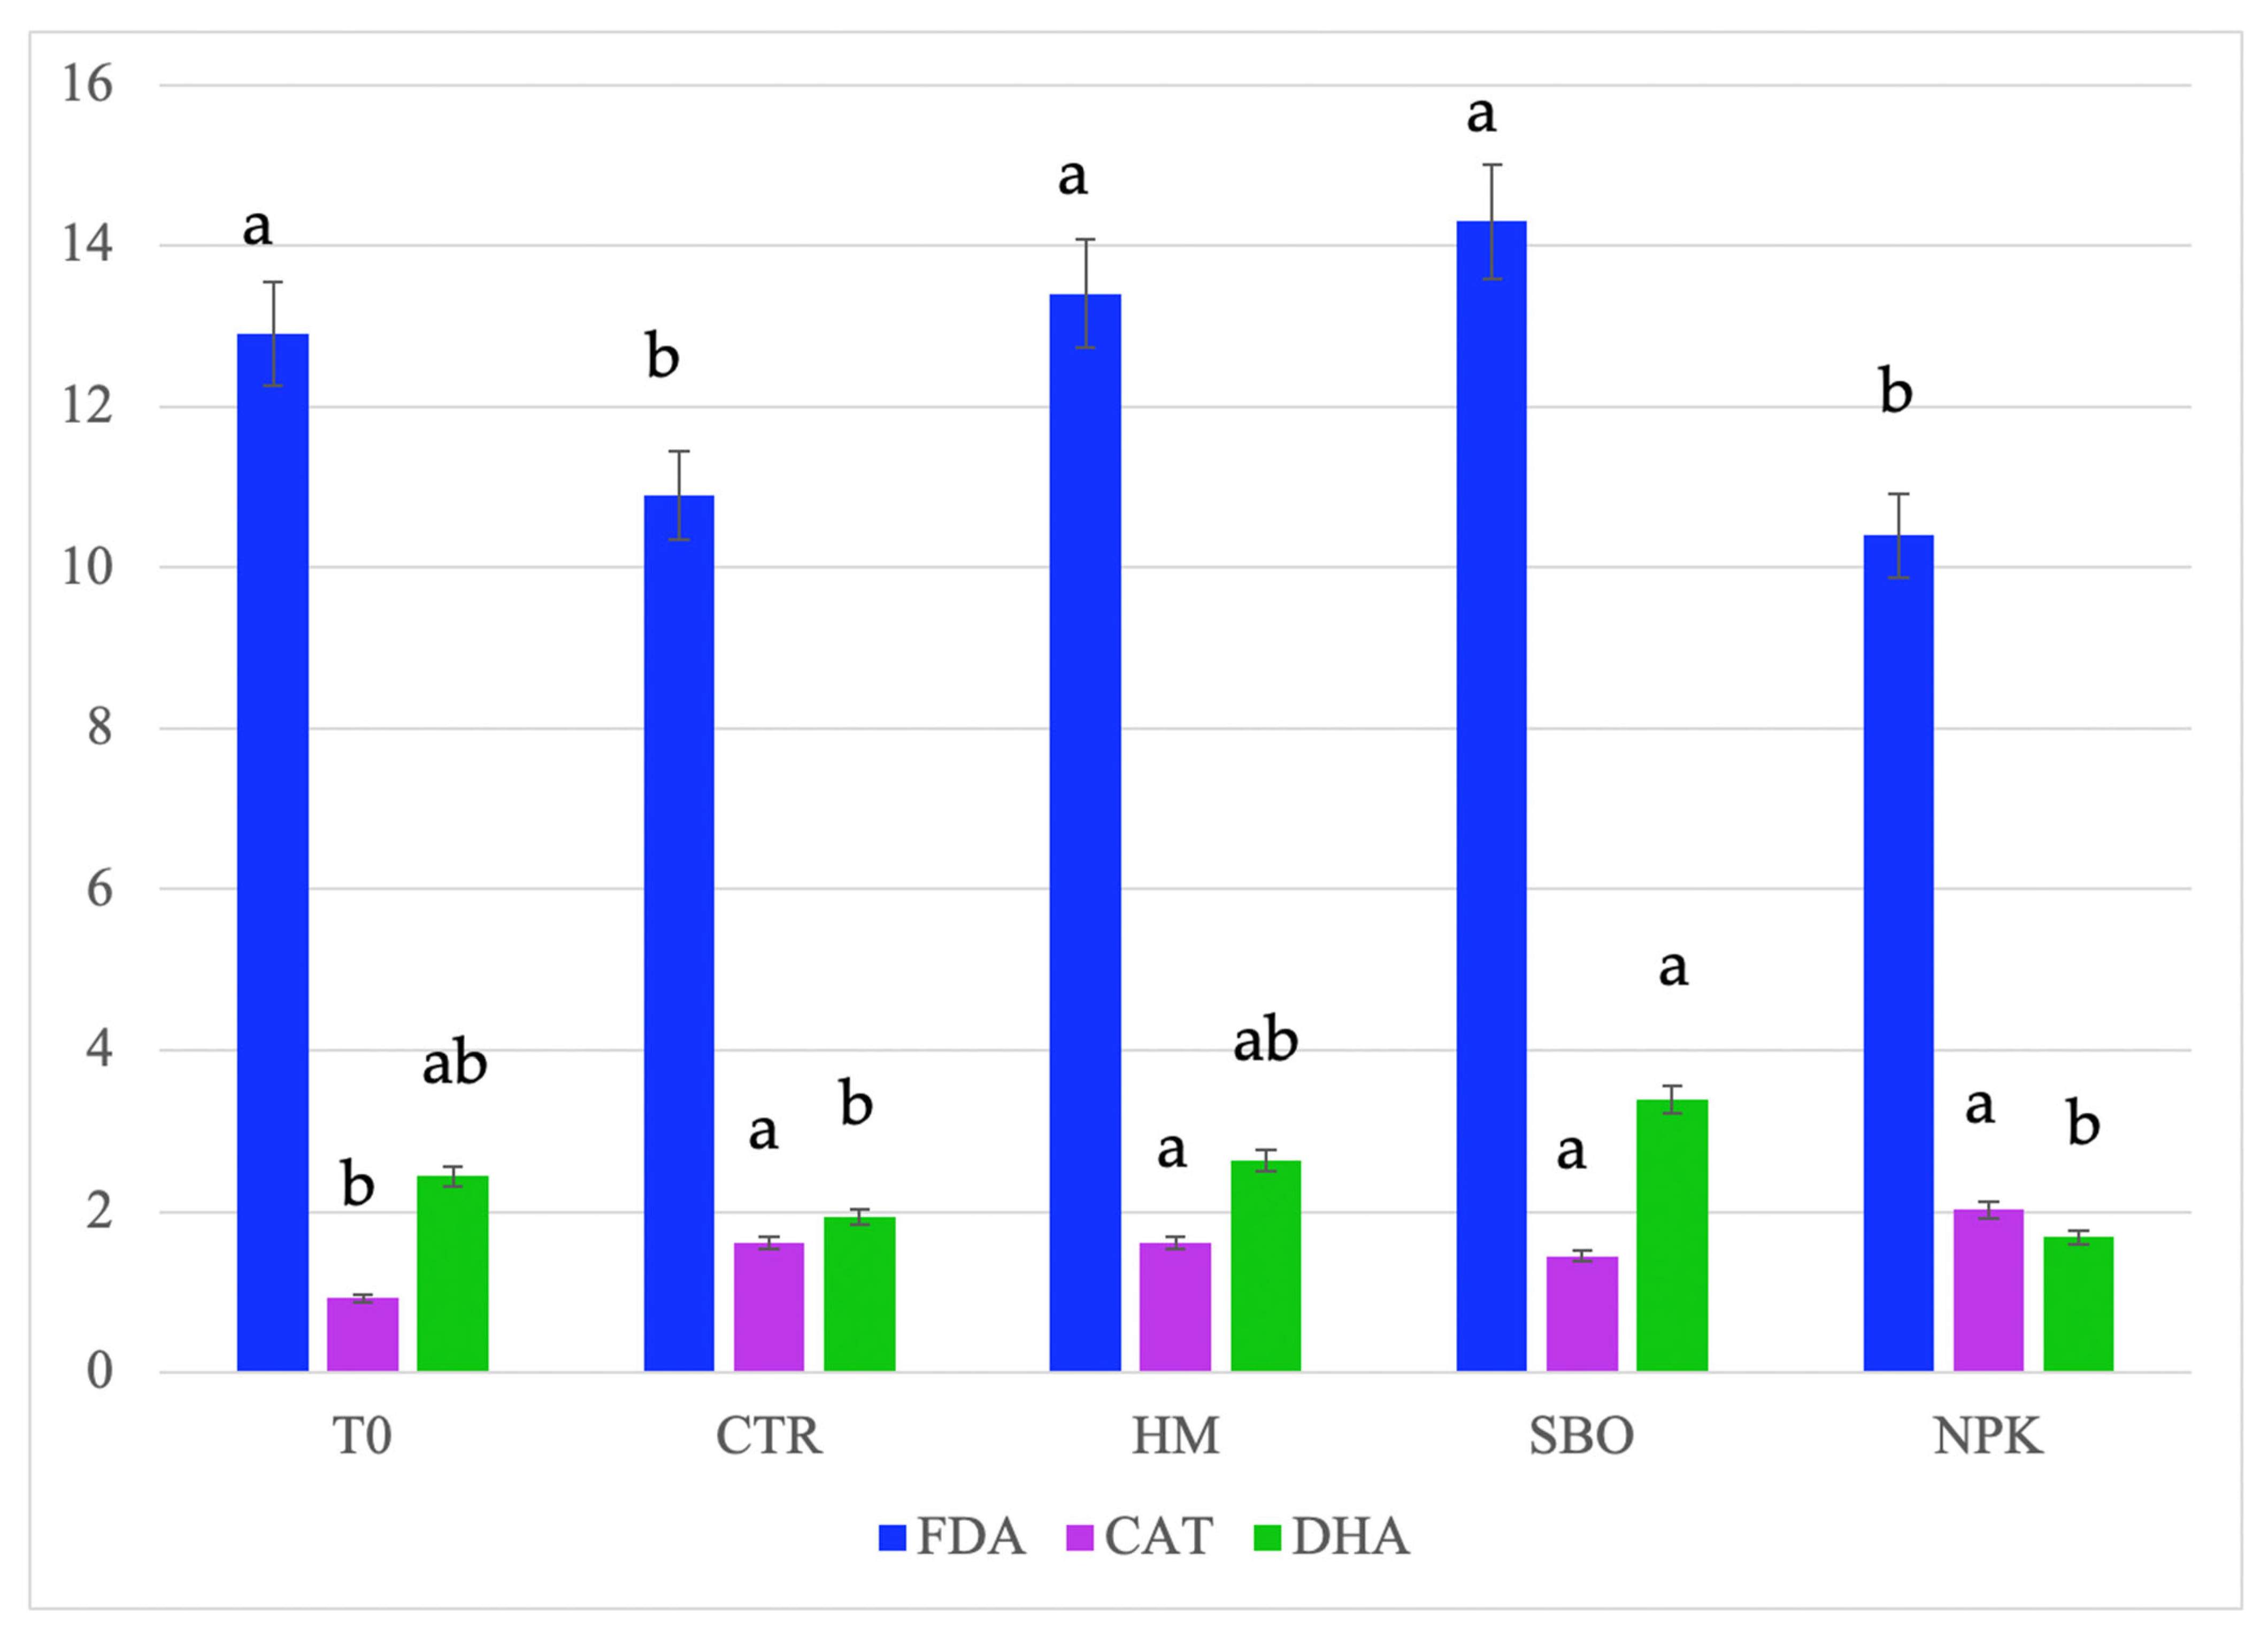
Figure 1.
Fluorescein diacetate hydrolase (FDA, µg FDA/g d.s.), dehydrogenase (DHA, µg TTF/h/g d.s.), and catalase, (CAT, O2/3 min/g d.s.) detected in soil after the second cycle of broccoli–tomato crop rotation. The data refers to the open field experiments carried on from October 2022 to July 2023. Soil samples were collected after the tomato harvest. The treatments include T0 (initial soil), CTR (unfertilized control), HM (horse manure), SBO (sulfur bentonite plus orange waste), and NPK (mineral fertilizer). Different letters indicate statistically significant differences among the treatments according to Tukey’s test (p < 0.05).
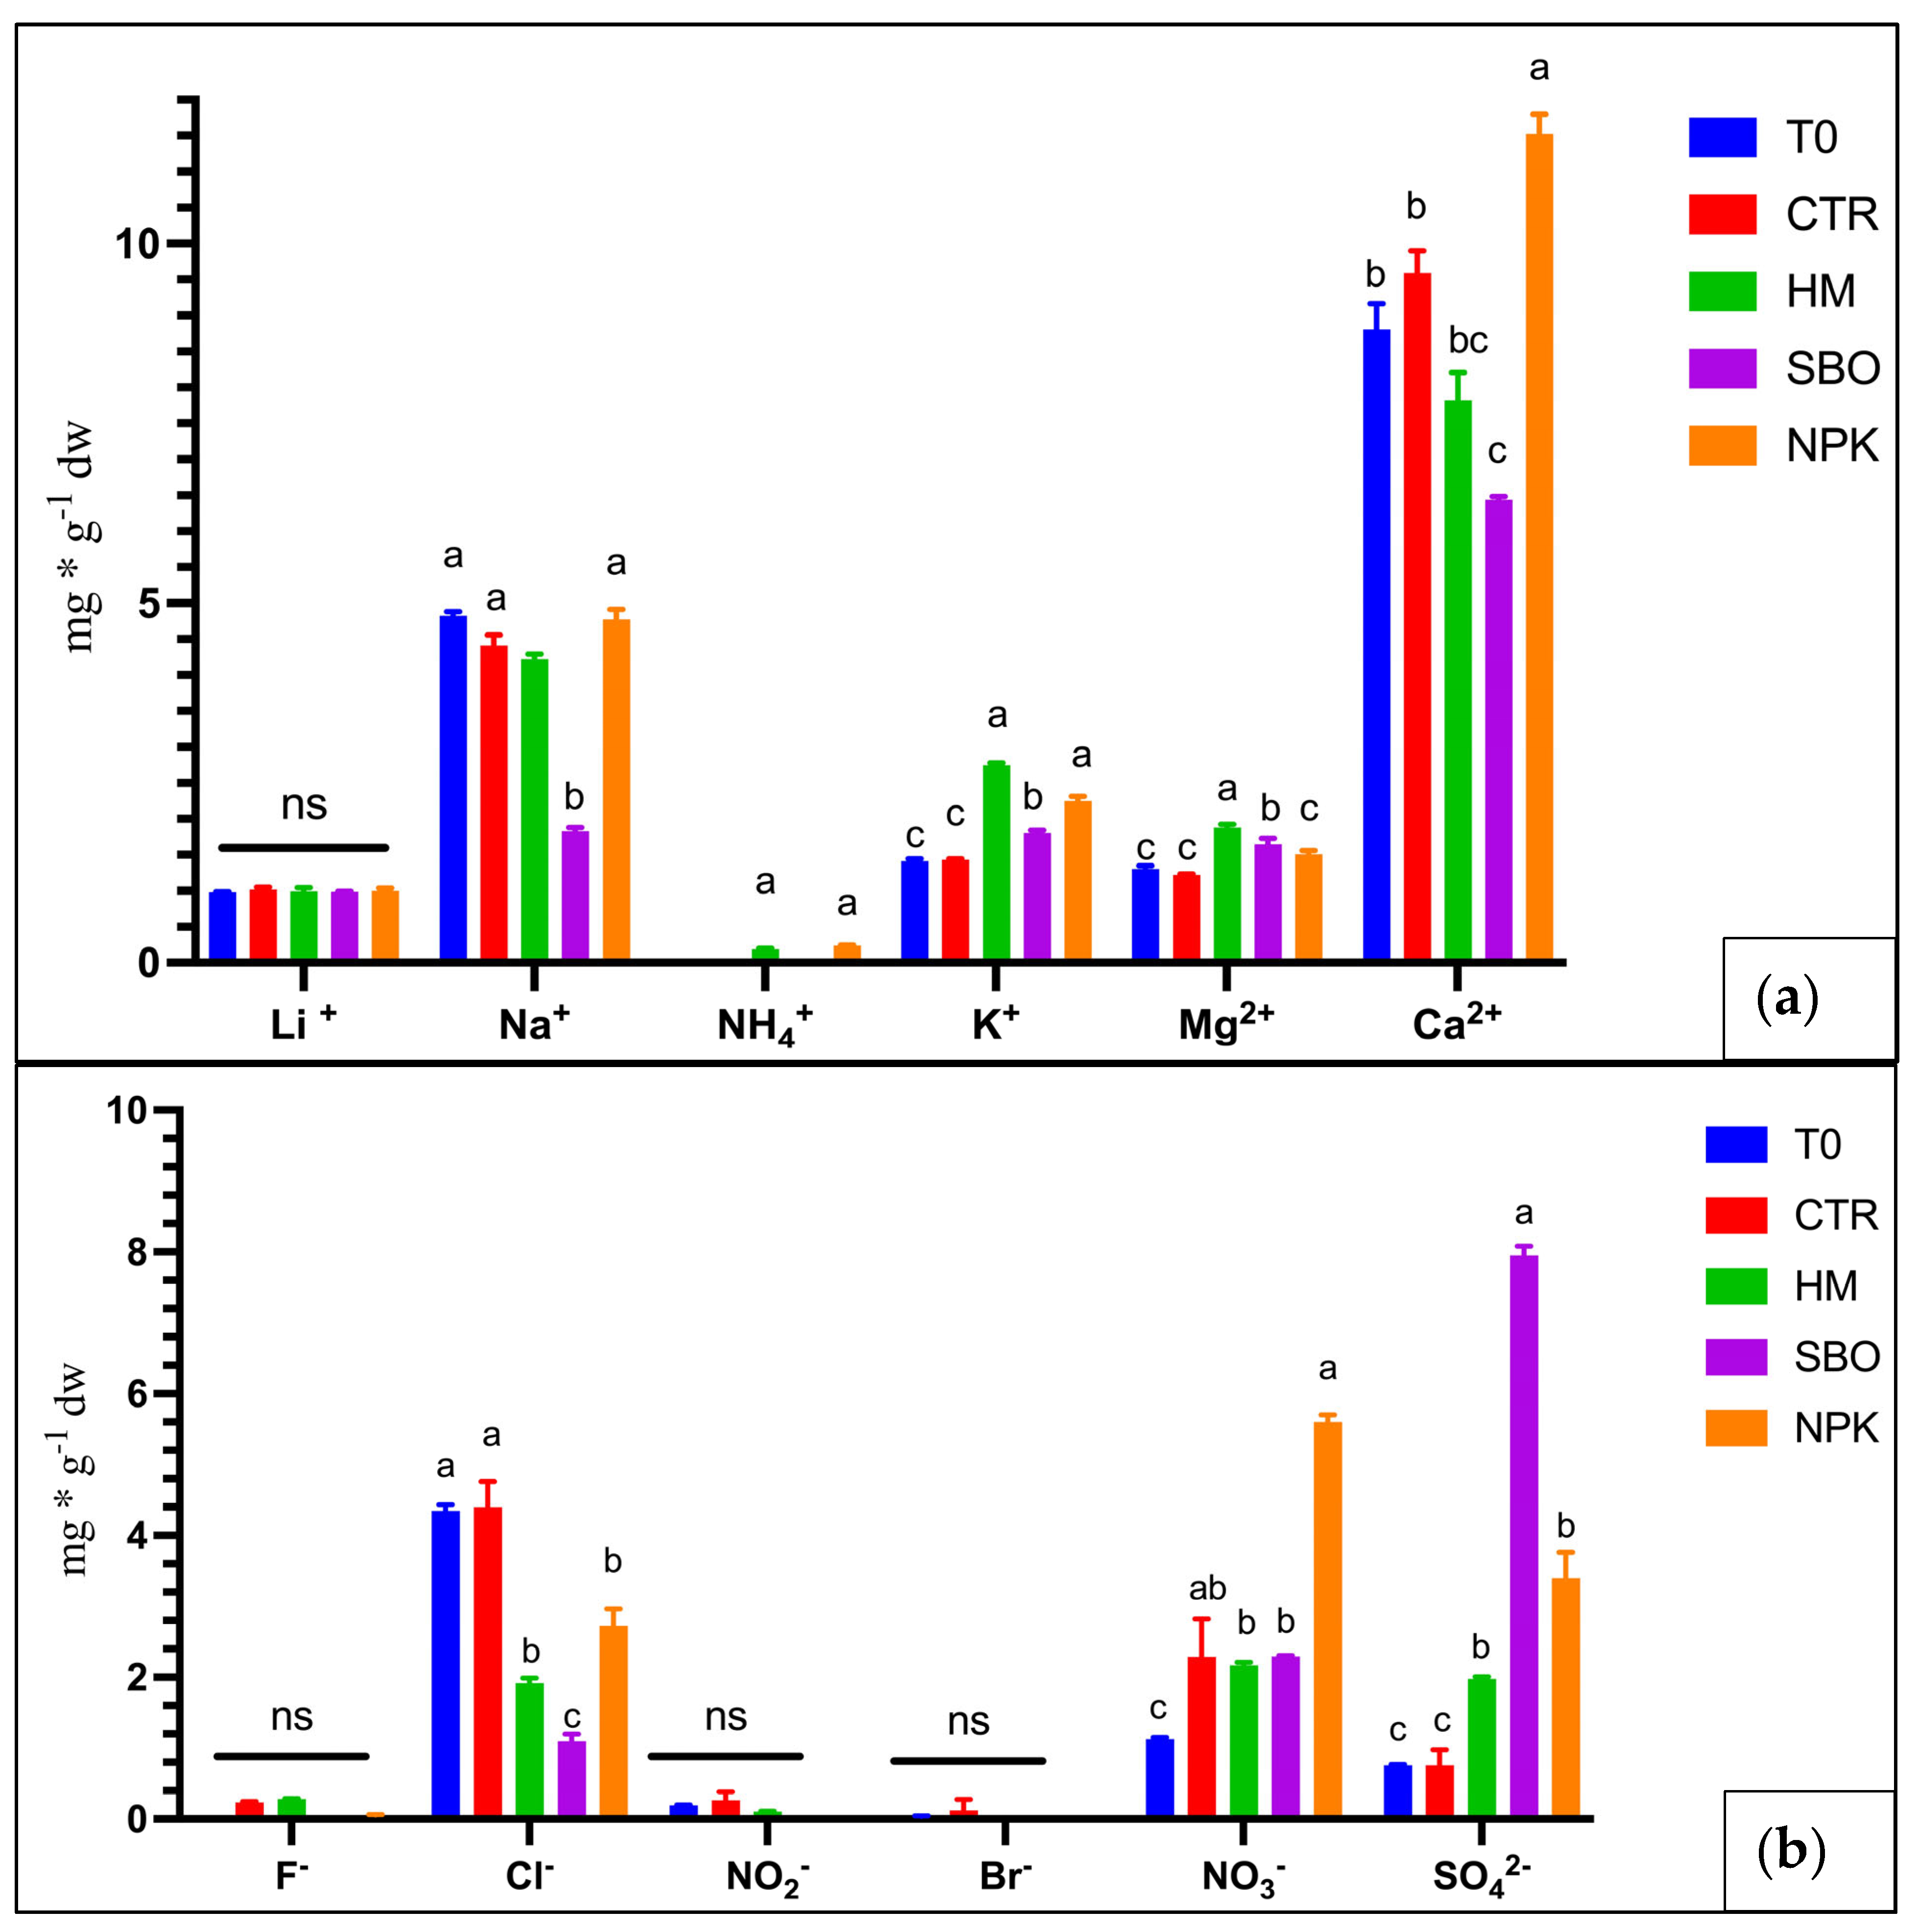
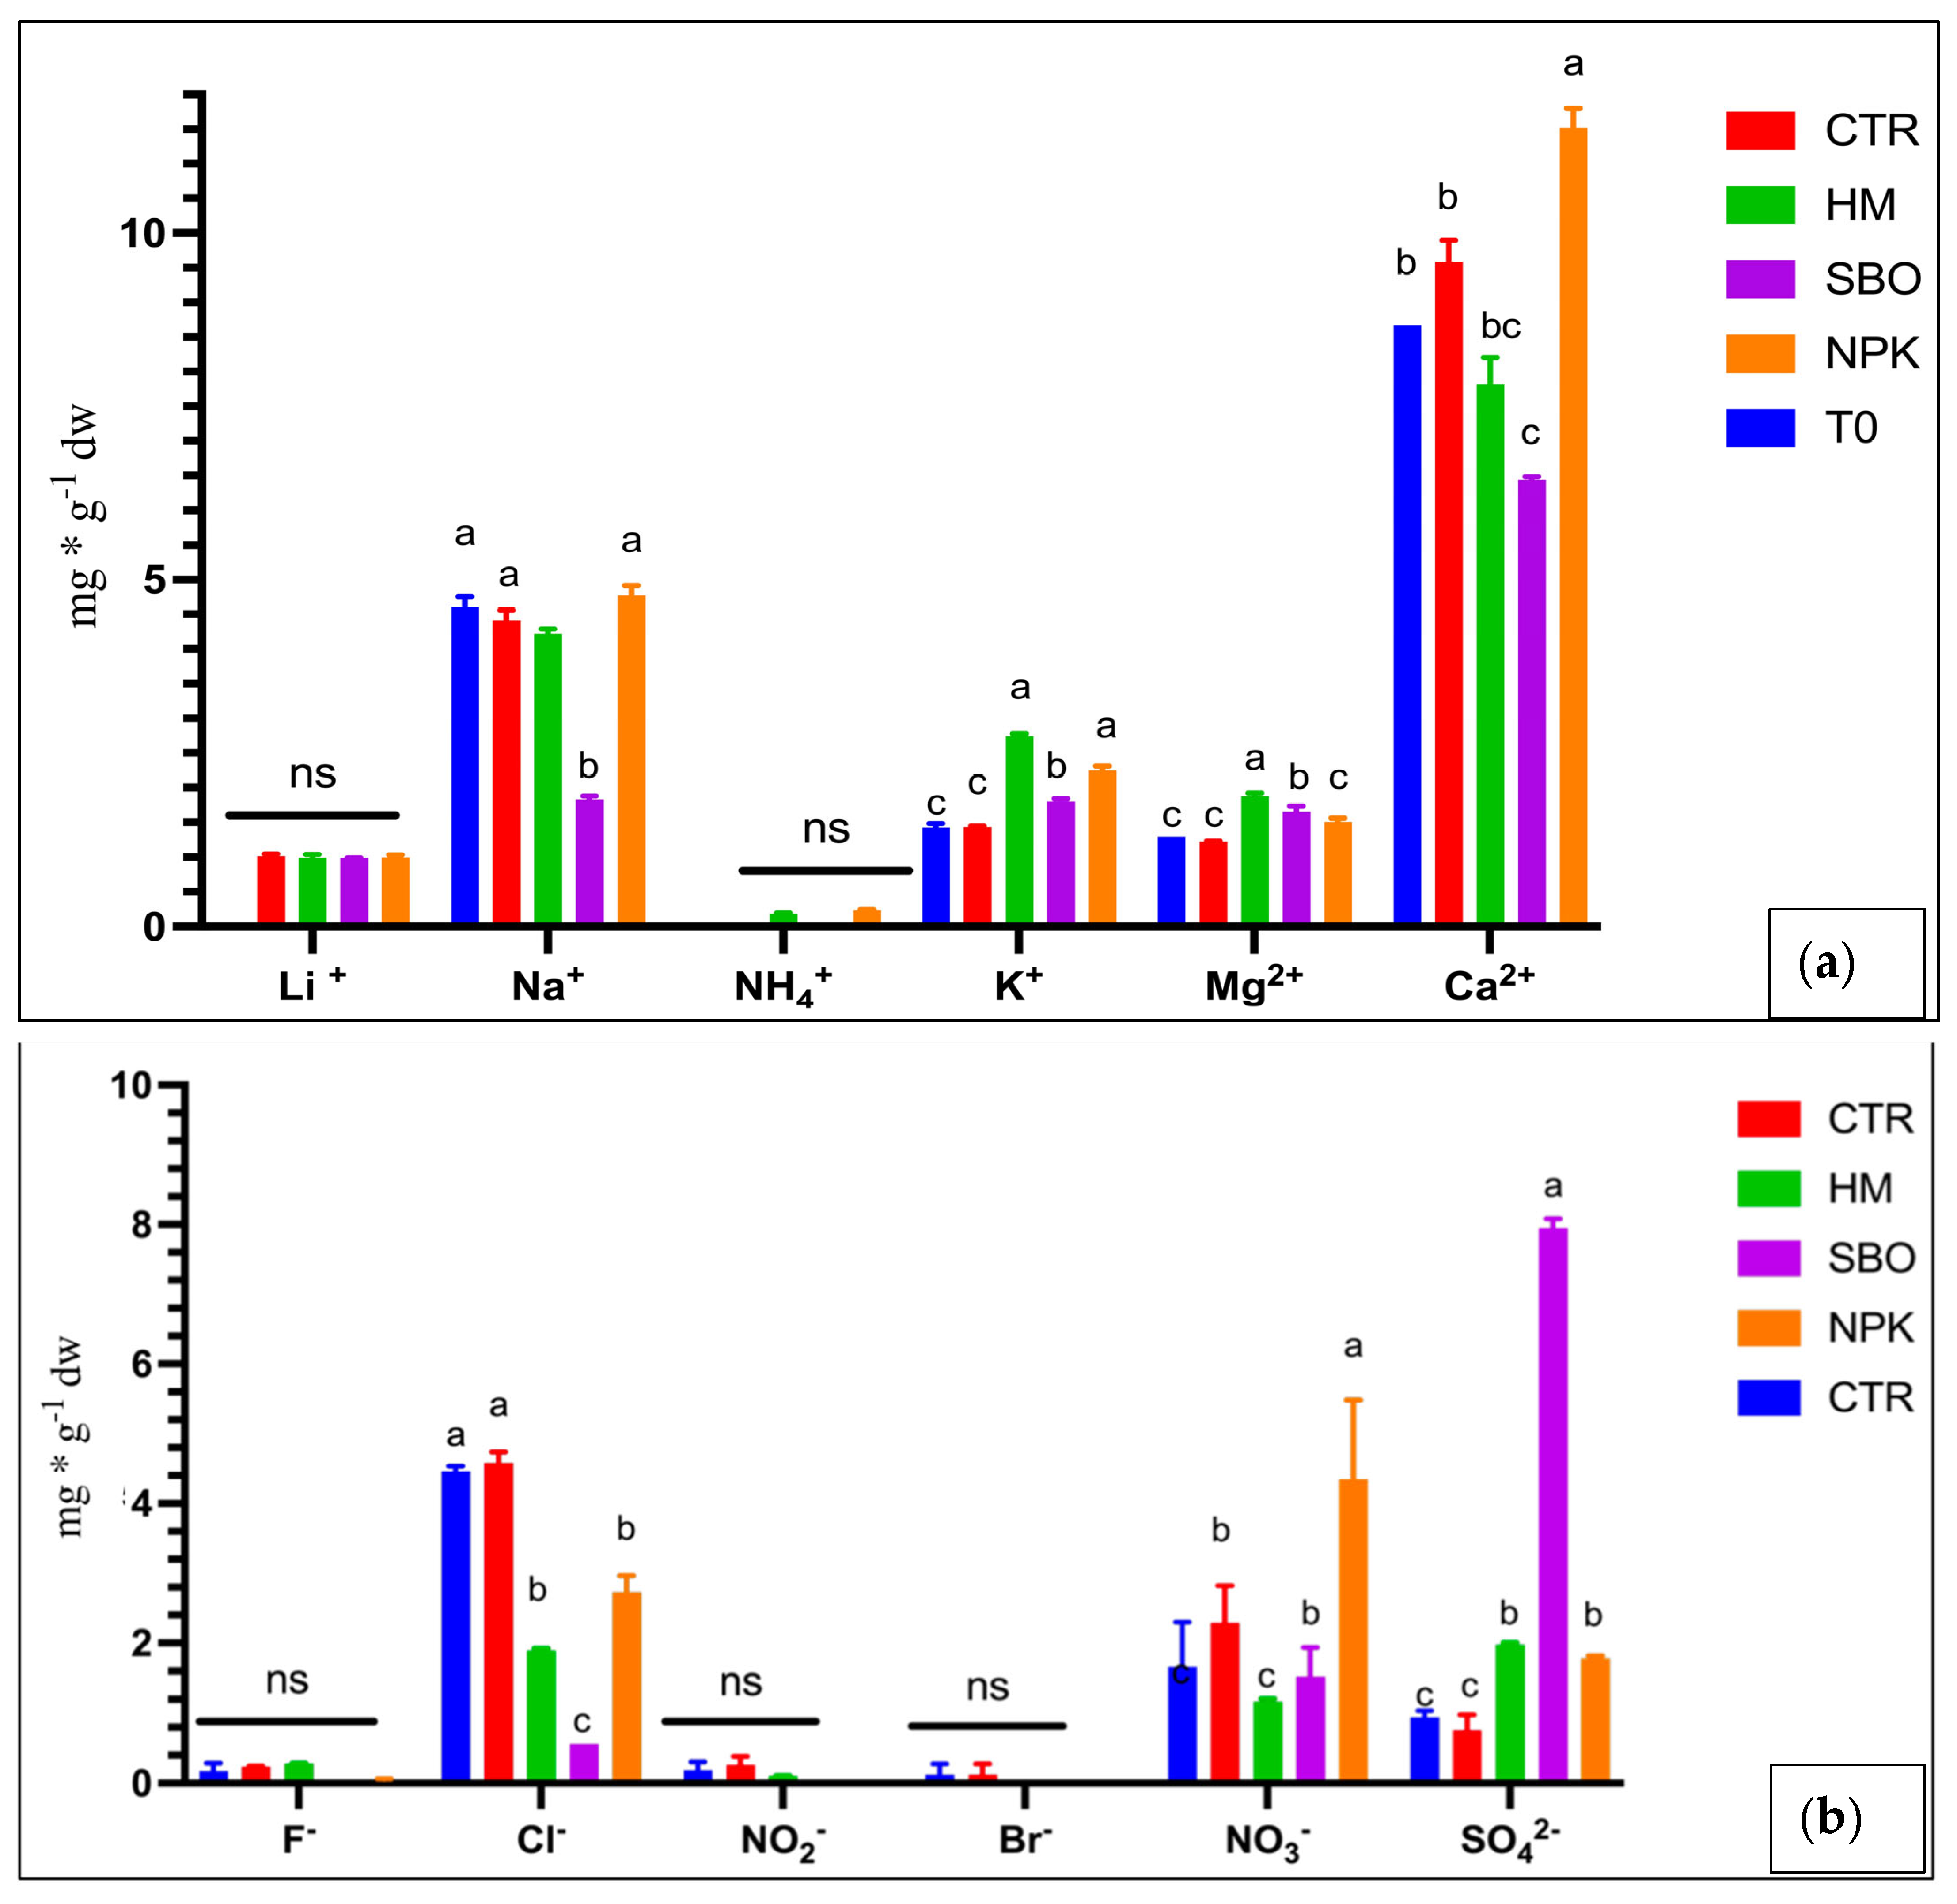
Figure 2.
Cations (a) and anions (b) (mg * g−1 dw) in soil under the broccoli–tomato crop rotation. The first crop rotation cycle, from October 2022 to July 2023, with soil samples collected after the tomato harvest. The treatments include T0 (initial soil), CTR (unfertilized control), HM (horse manure), SBO (sulfur bentonite plus orange waste), and NPK (mineral fertilizer). Different letters indicate statistically significant differences among the treatments according to Tukey’s test (p < 0.05). n.s. = not significant (p > 0.05).
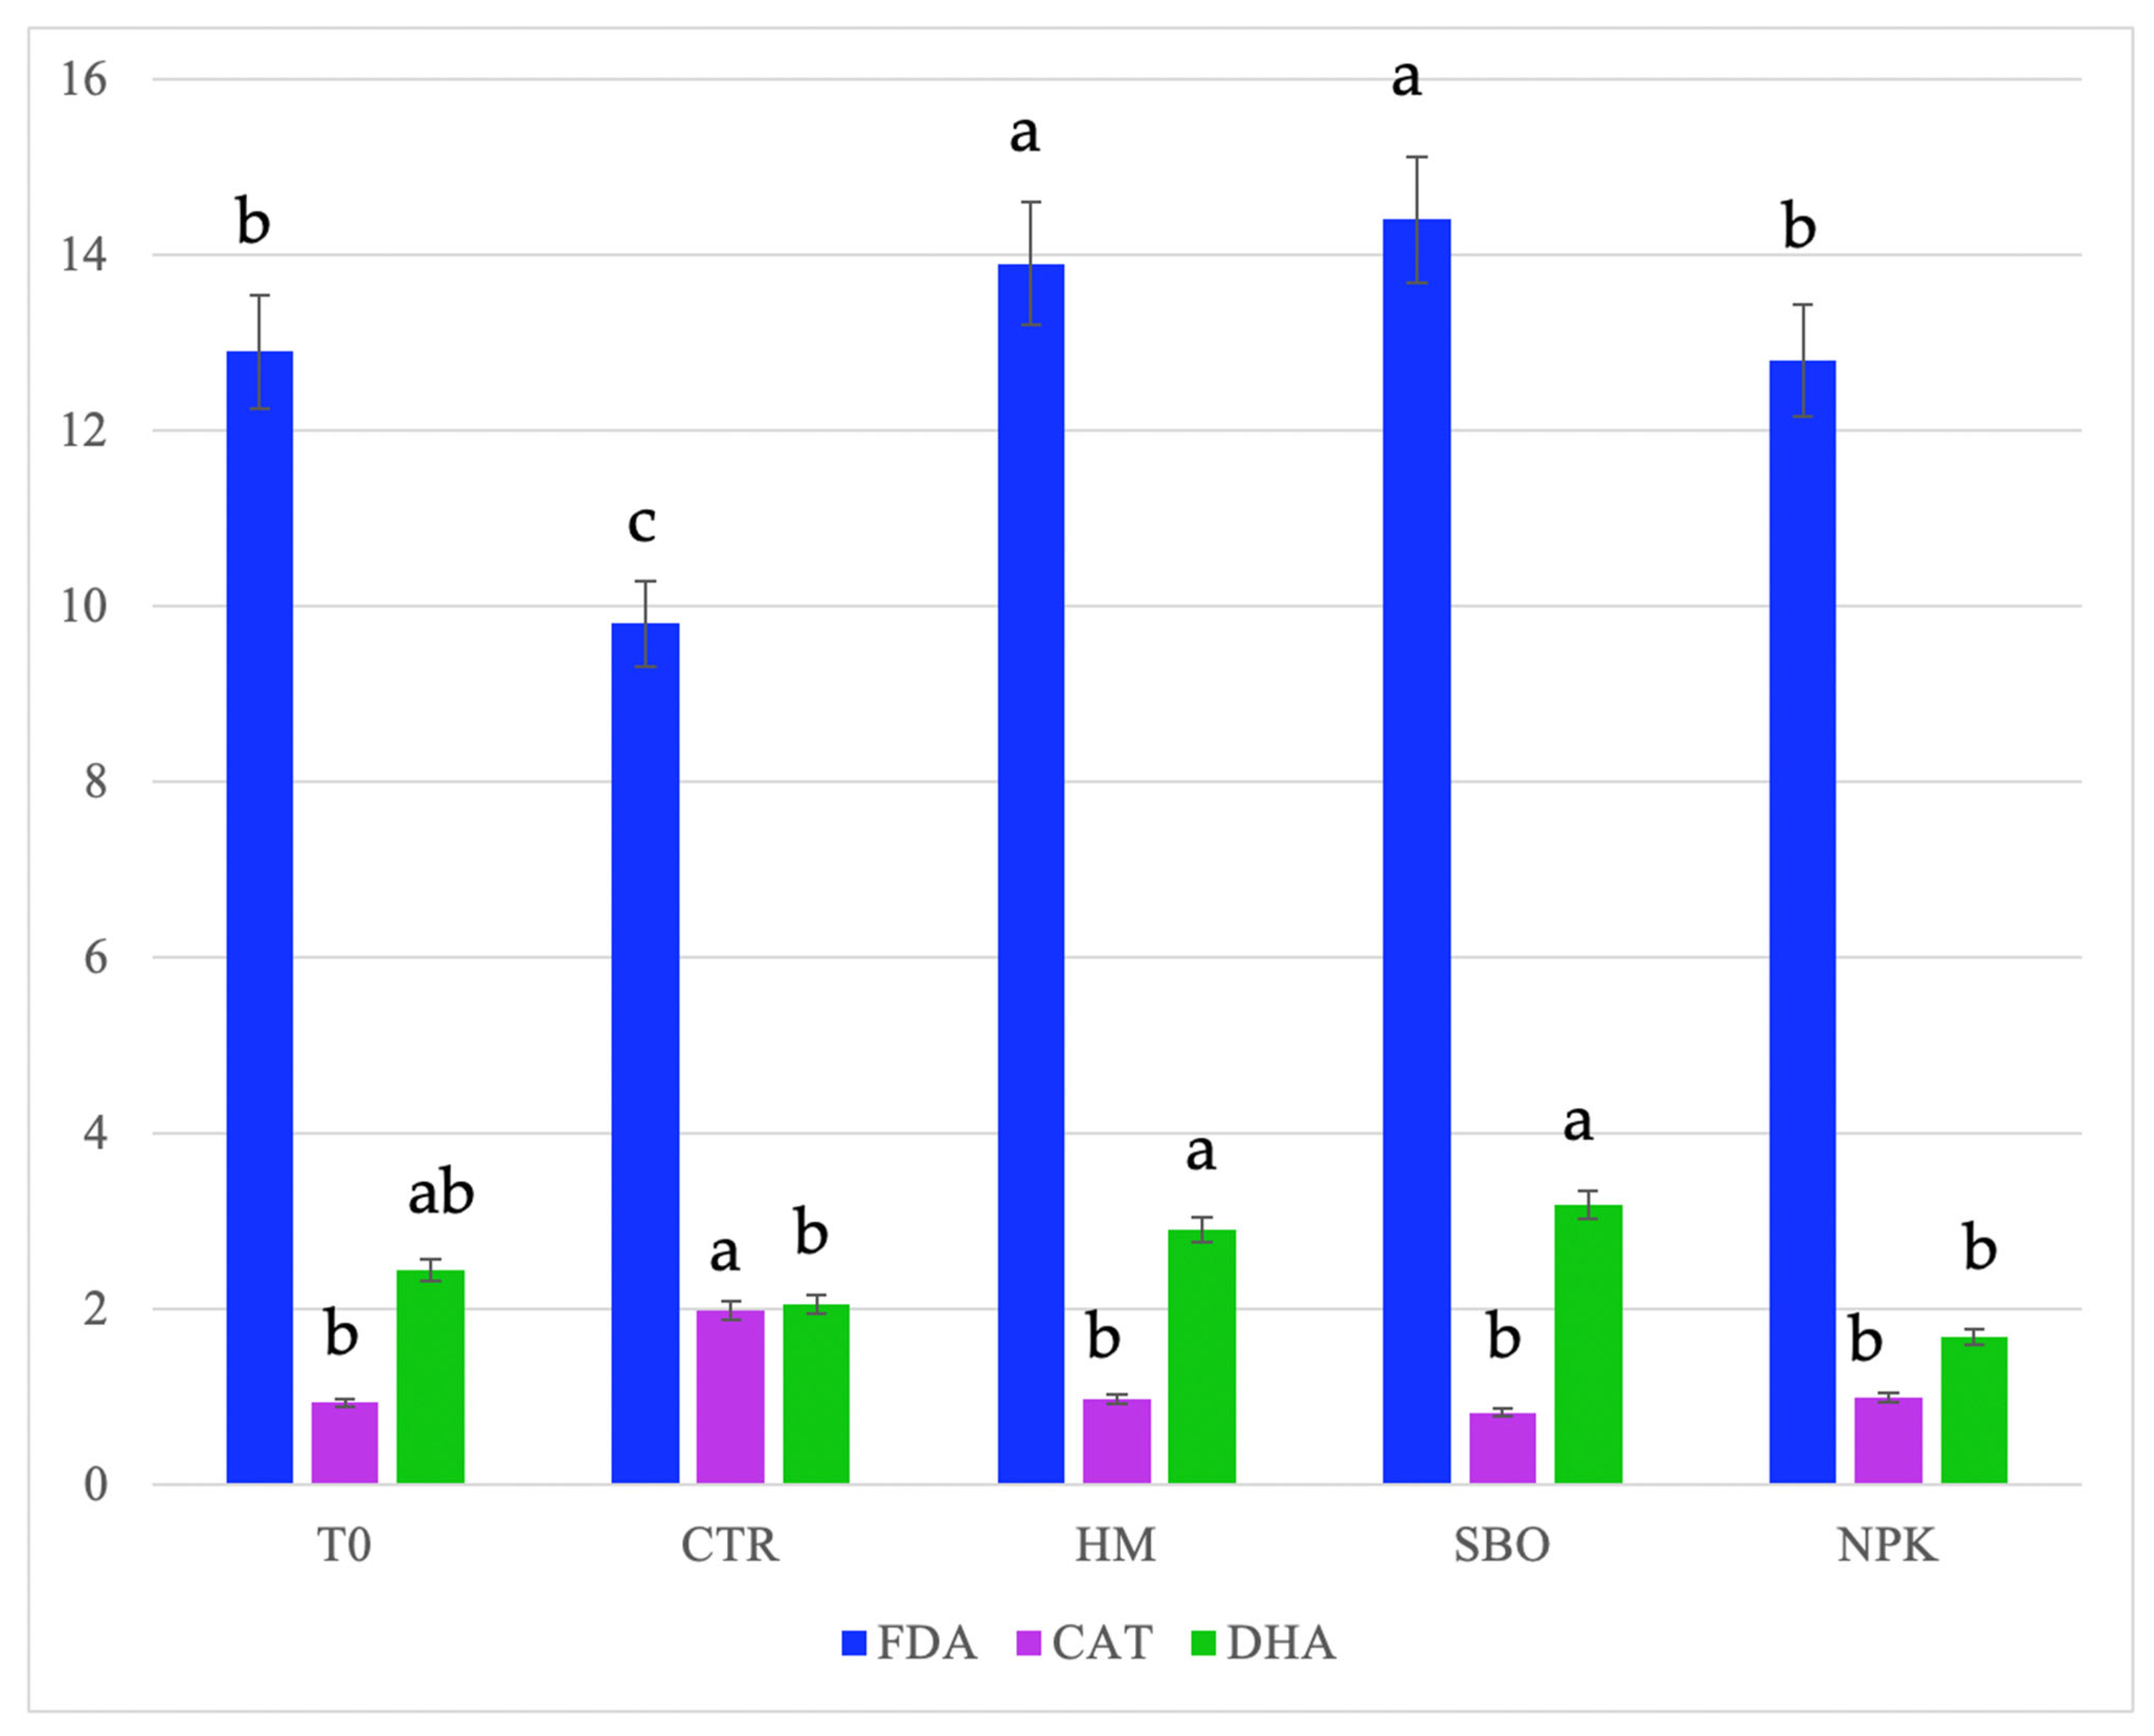
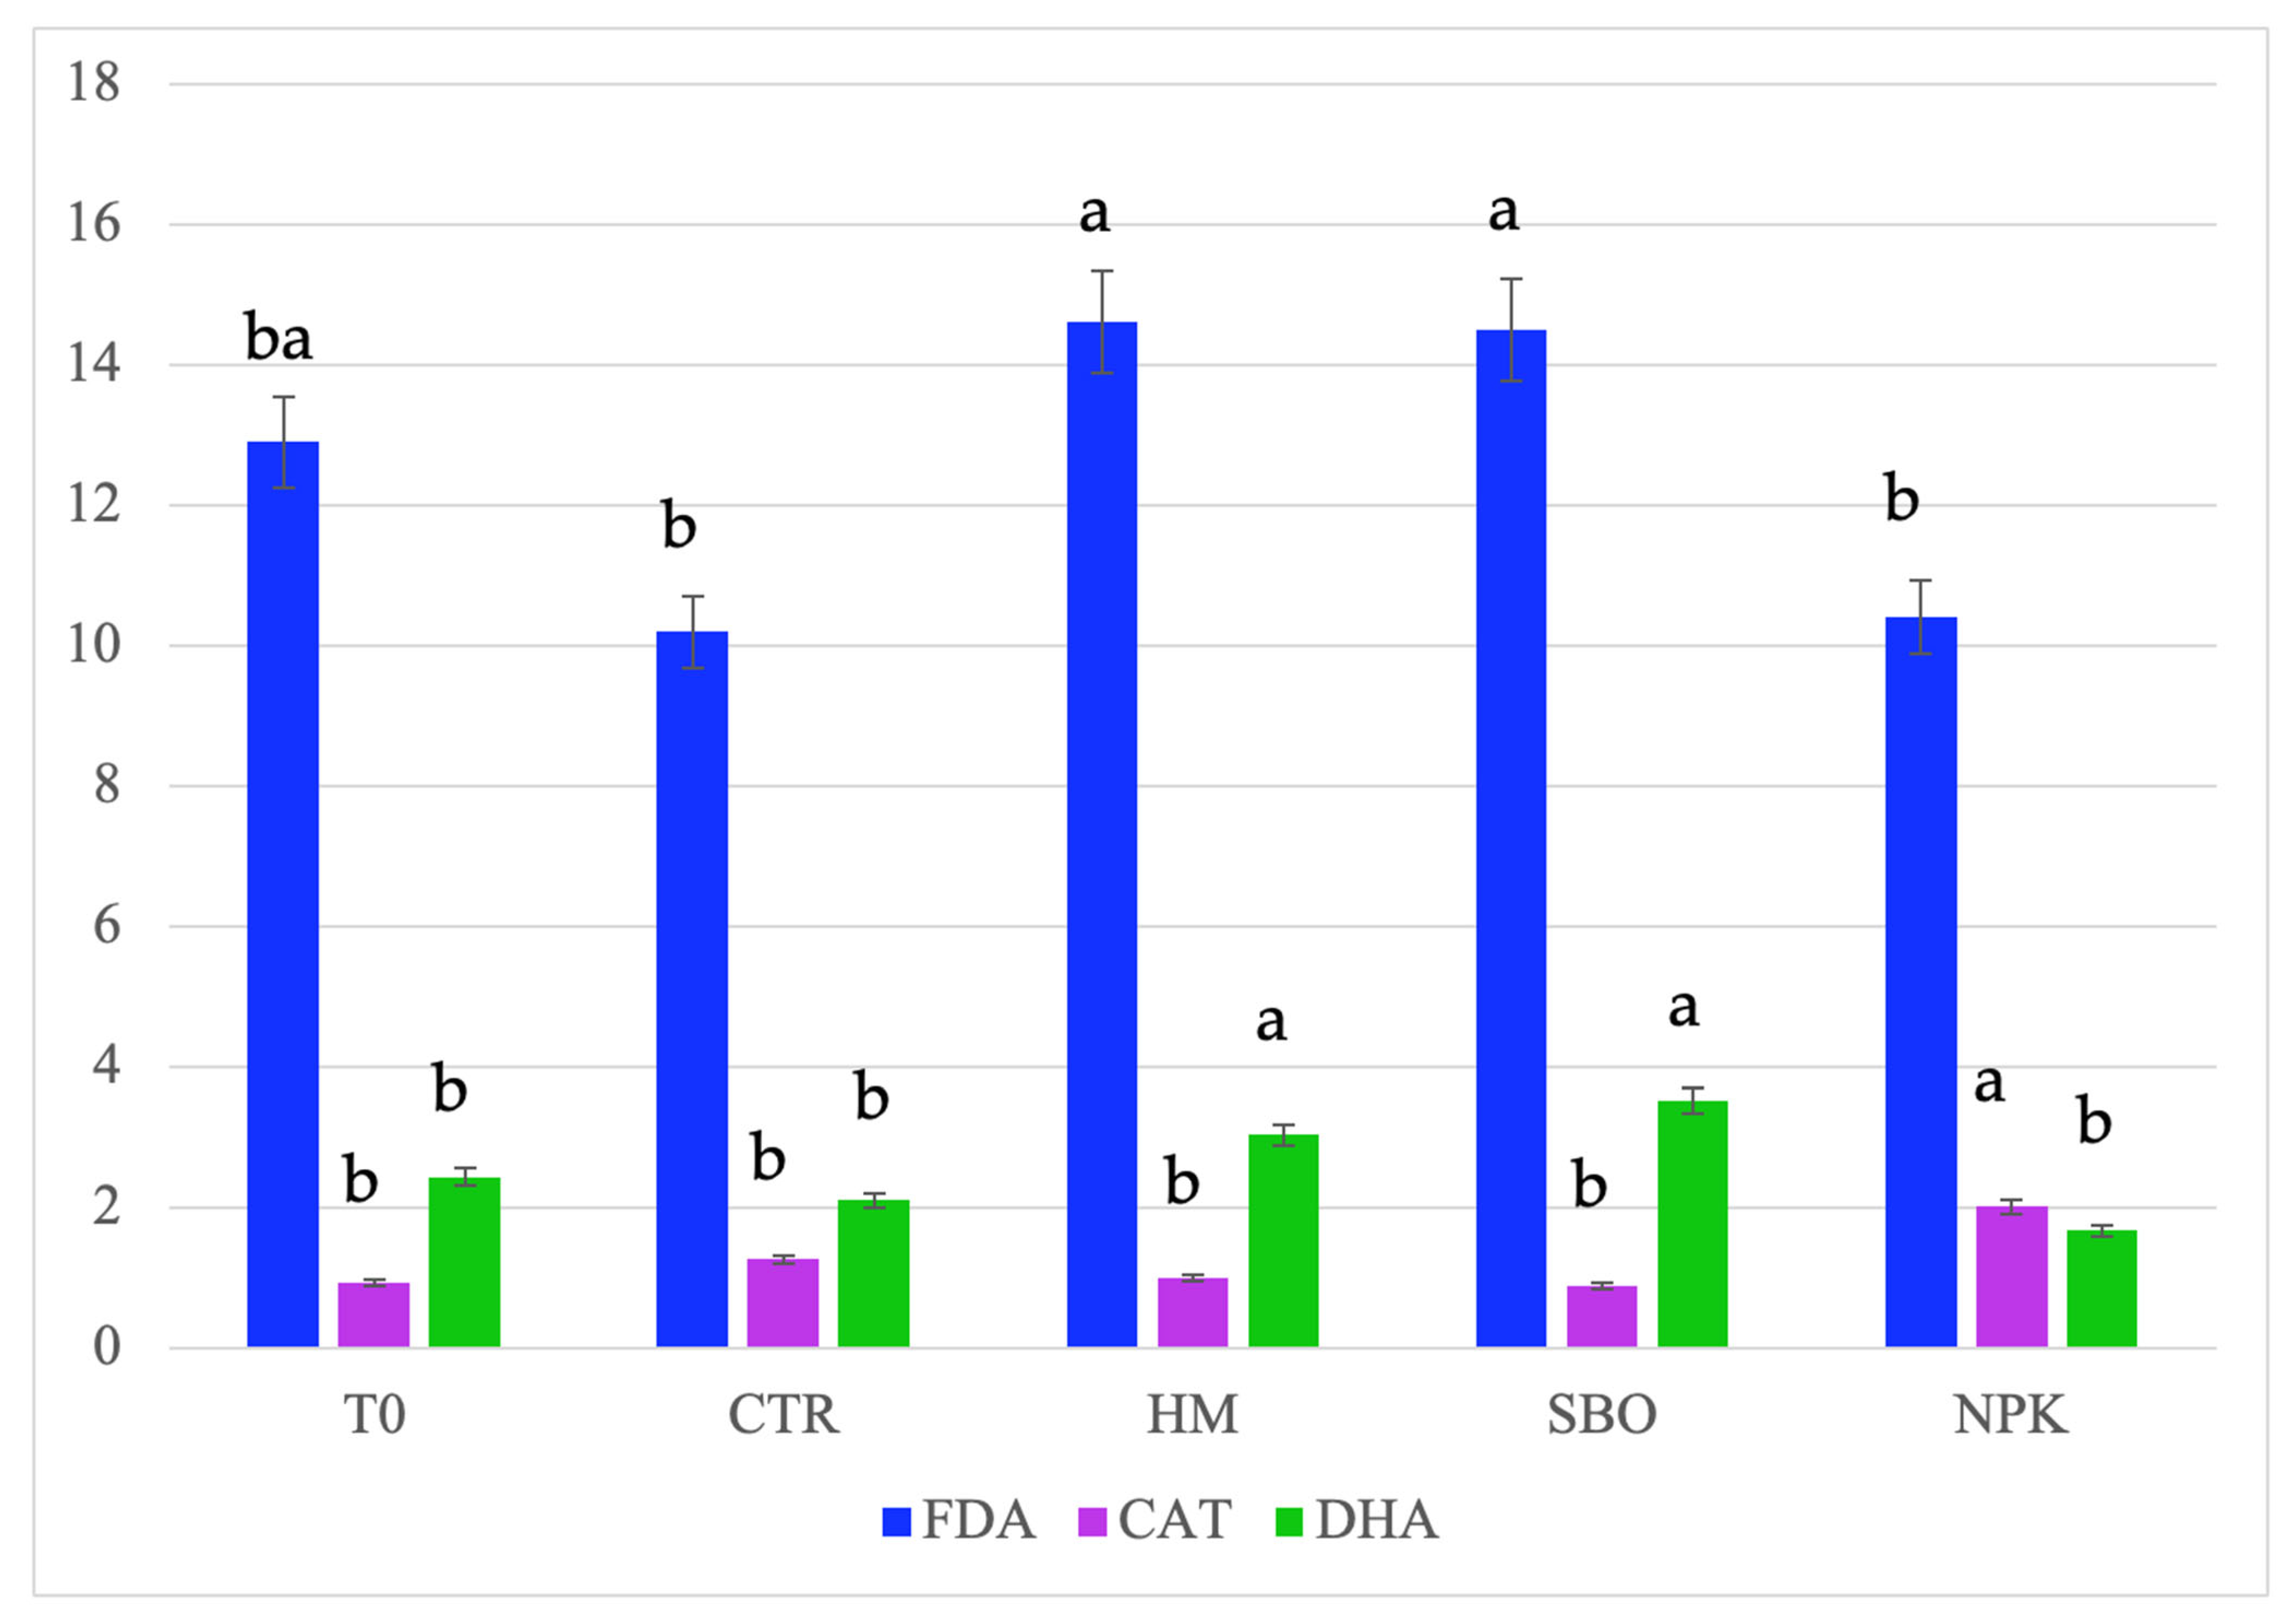
Figure 3.
Fluorescein diacetate hydrolase (FDA, µg FDA/g d.s.), dehydrogenase (DHA, µg TTF/h/g d.s.), and catalase, (CAT, O2/3 min/g d.s.) detected in soil after the second cycle of the broccoli–tomato crop rotation. The data refers to the open field experiments carried on from October 2022 to July 2023. Soil samples were collected after the tomato harvest. Different letters indicate statistically significant differences among the treatments according to Tukey’s test (p < 0.05).
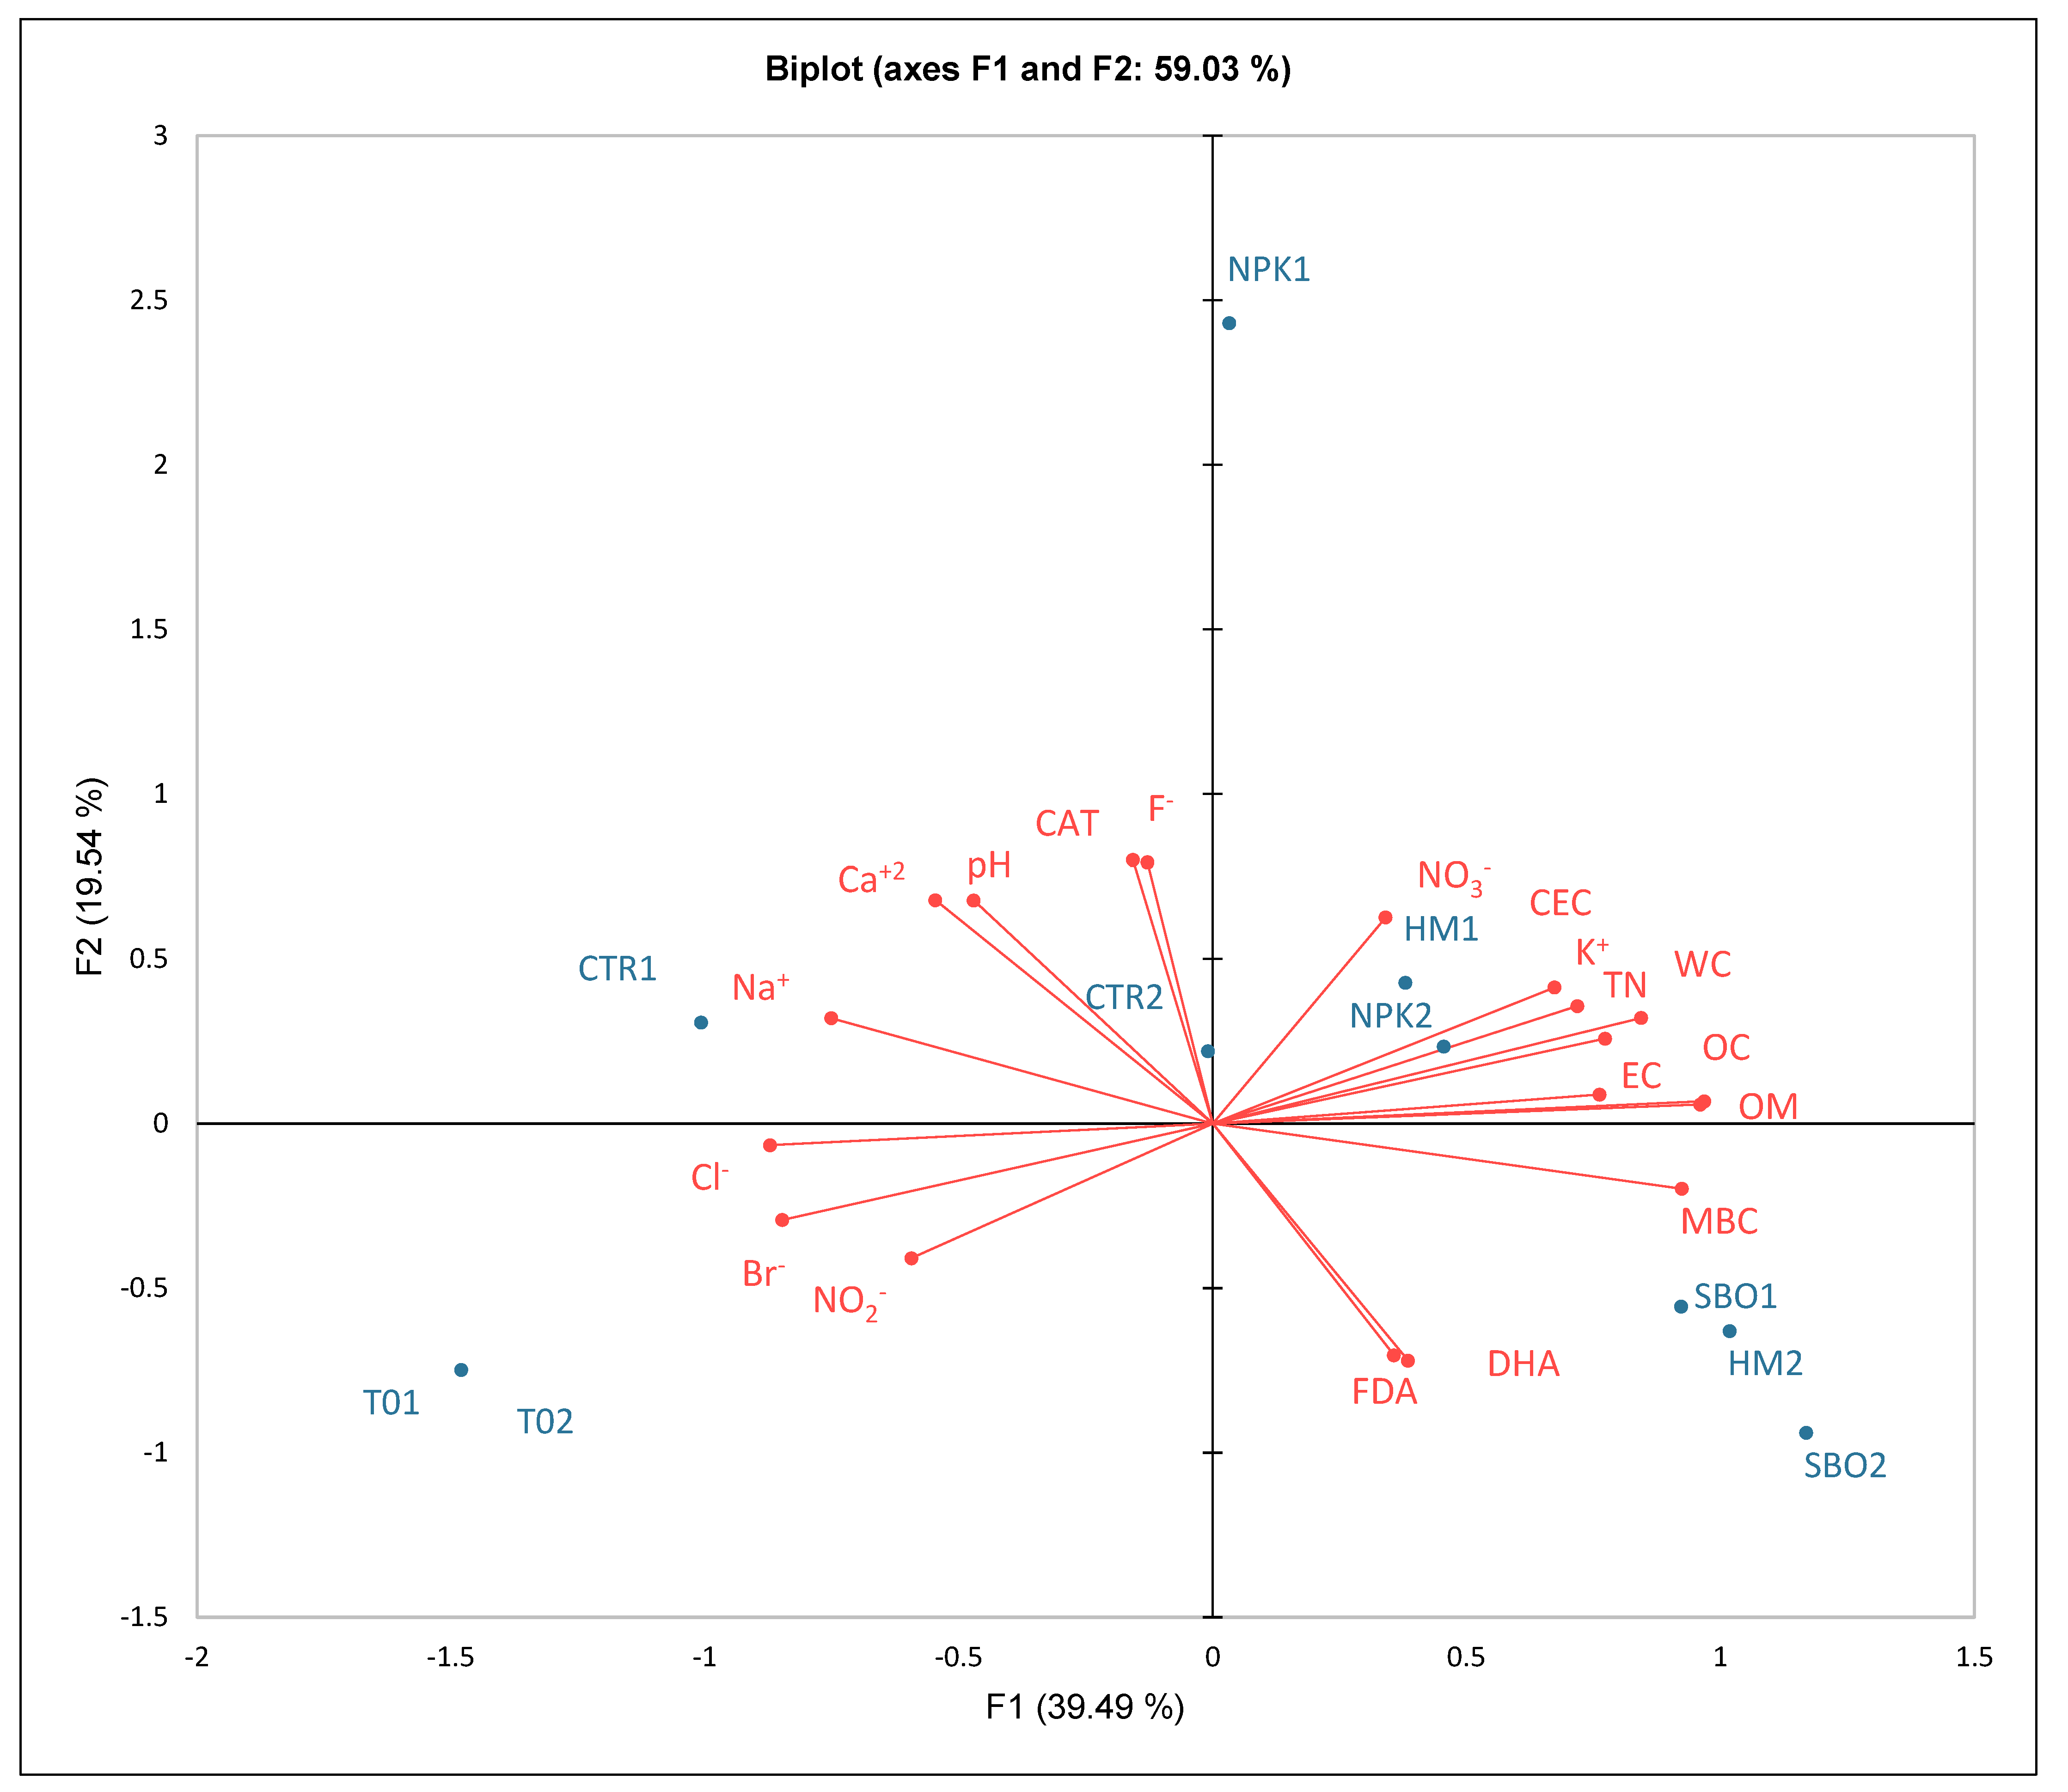
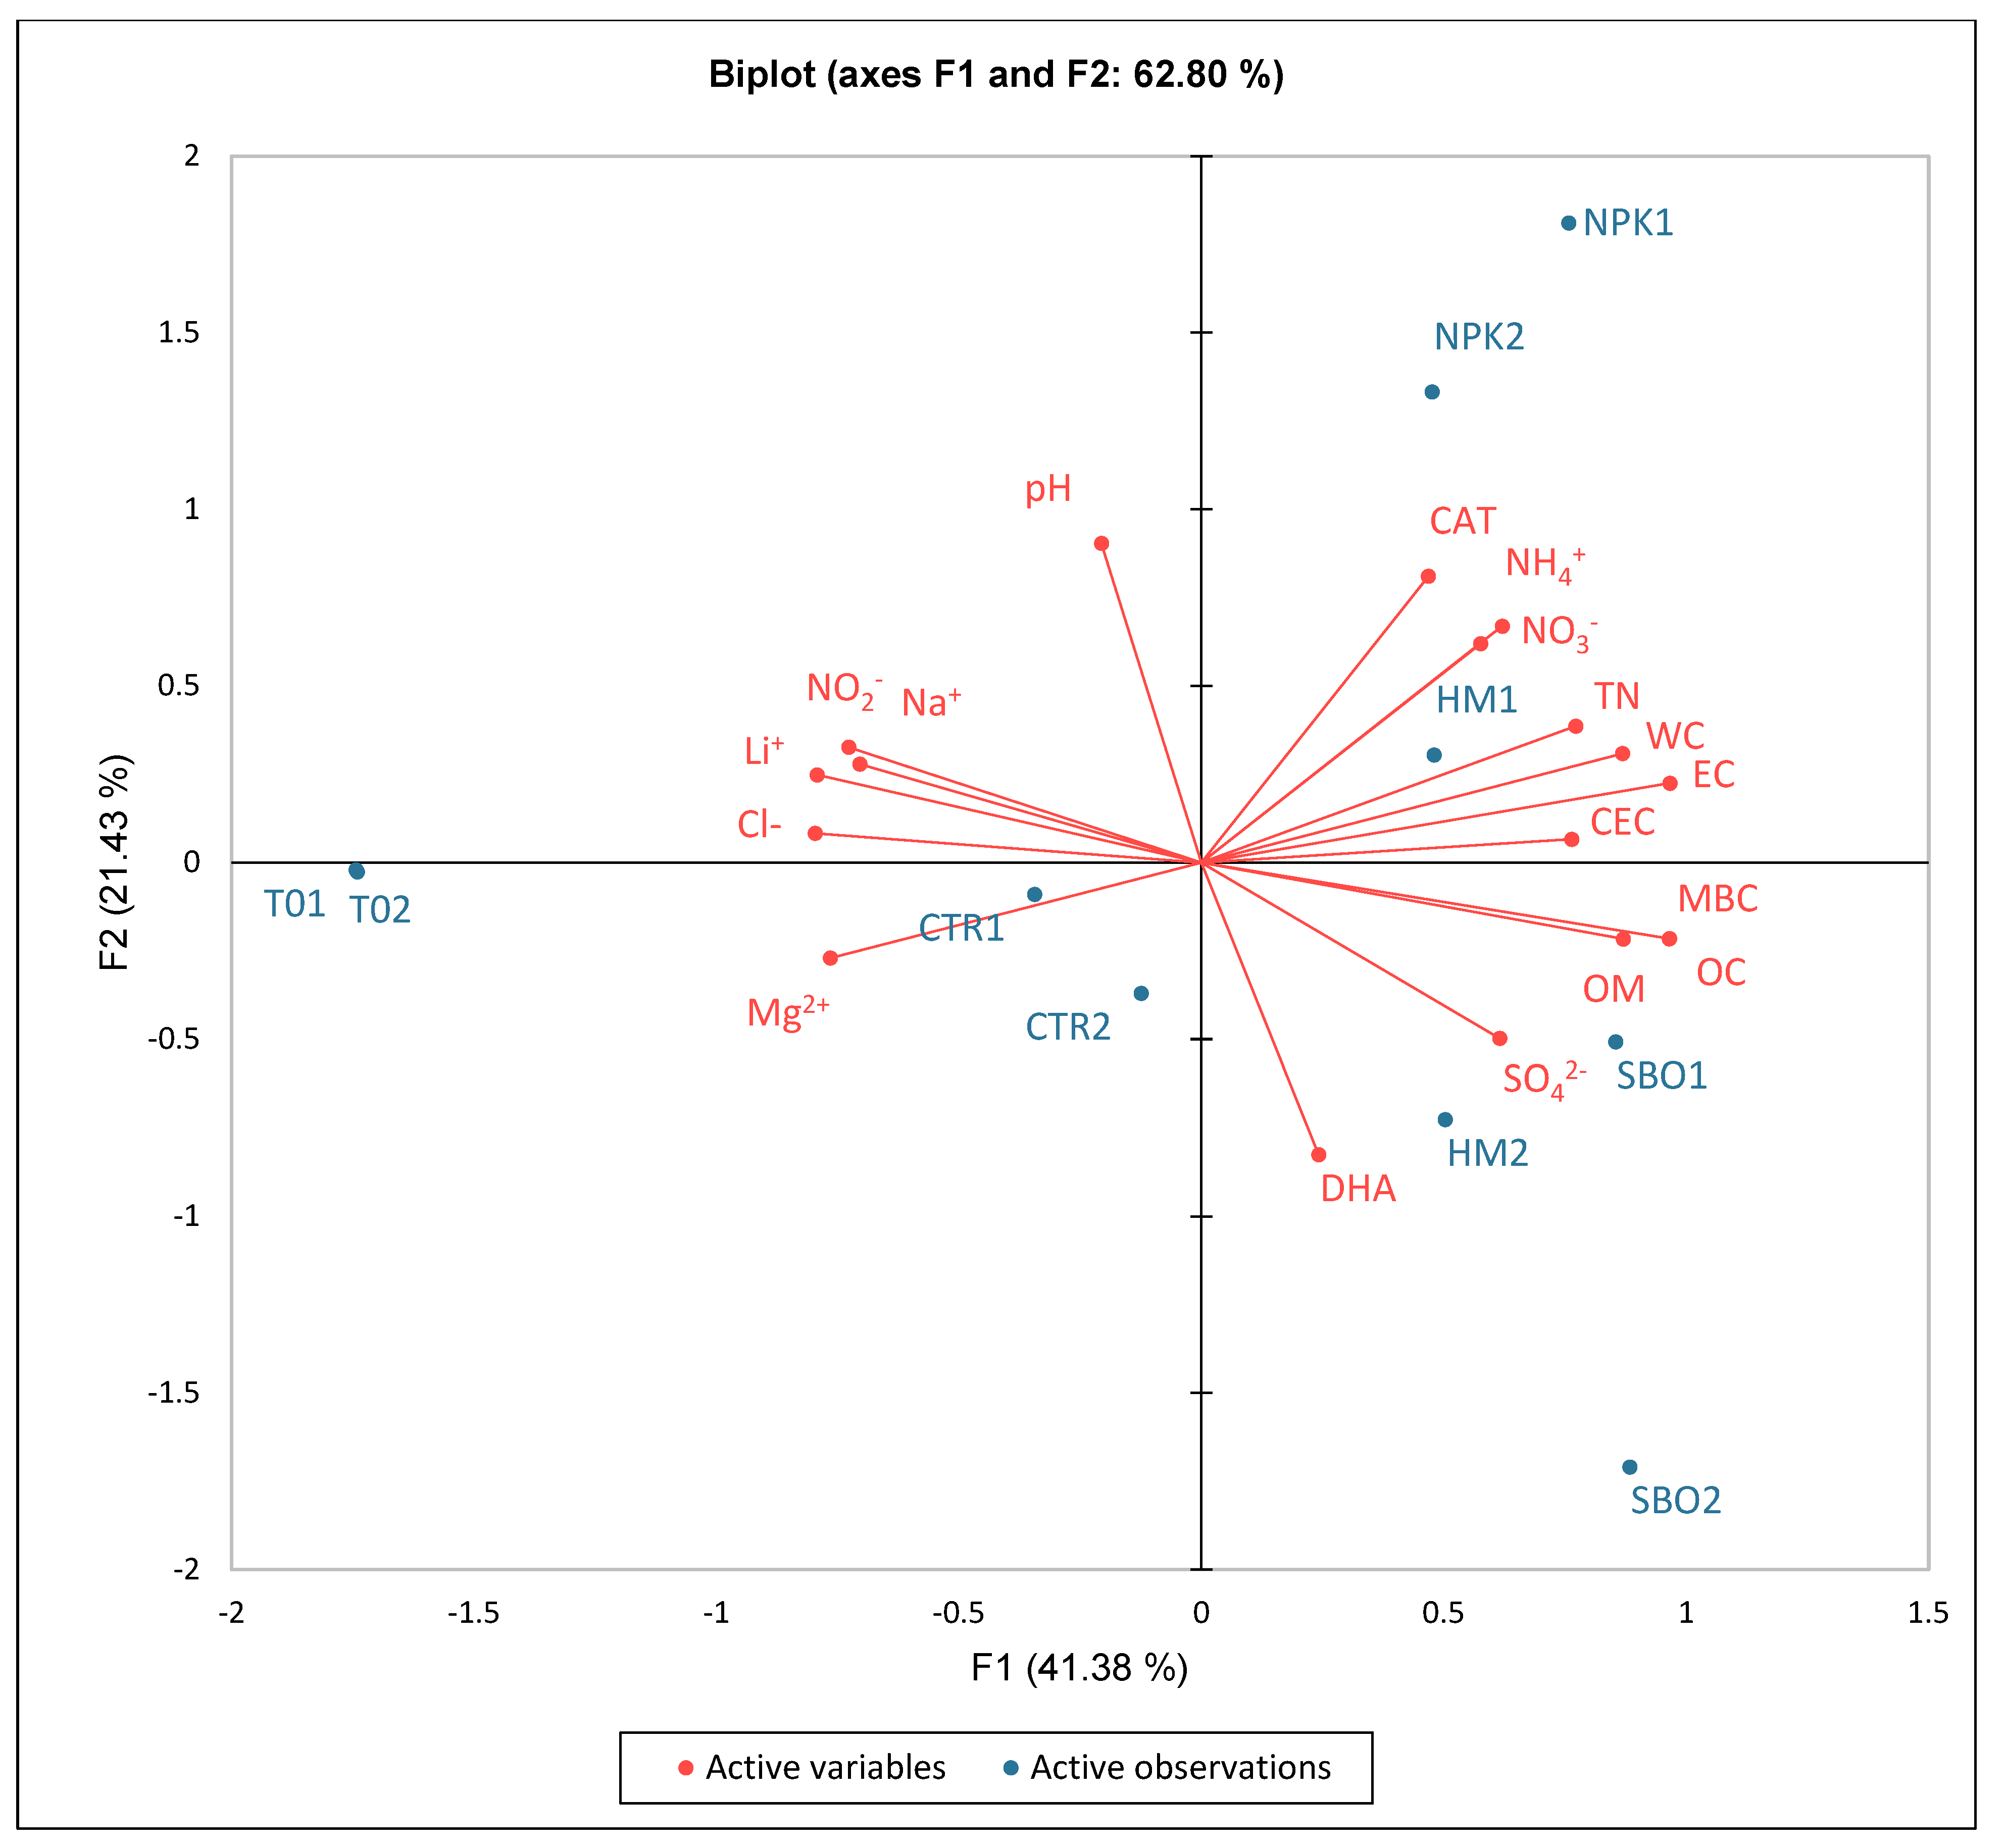
Figure 4.
Principal component analysis (PCA) of chemical, biochemical, and ionic soil parameters under the broccoli–tomato crop rotation. The biplot represents soil samples collected after the first cycle (T01, CTR1, NPK1, HM1, SBO1) and the second cycle (T02, CTR2, NPK2, HM2, SBO2).
Figure 4.
Principal component analysis (PCA) of chemical, biochemical, and ionic soil parameters under the broccoli–tomato crop rotation. The biplot represents soil samples collected after the first cycle (T01, CTR1, NPK1, HM1, SBO1) and the second cycle (T02, CTR2, NPK2, HM2, SBO2).
Figure 5.
Fluorescein diacetate hydrolase (FDA, µg FDA/g d.s.), dehydrogenase (DHA, µg TTF/h/g d.s.), and catalase, (CAT, O2/3 min/g d.s.) detected in soil after the first cycle of the broccoli–pepper crop rotation. The data refers to the open field experiments carried on from October 2022 to July 2023. Soil samples were collected after the tomato harvest. Different letters indicate statistically significant differences among the treatments according to Tukey’s test (p < 0.05).
Figure 6.
Cations (a) and anions (b) (mg * g−1 dw) in soil under the broccoli–pepper crop rotation. The first crop rotation cycle, from October 2022 to July 2023, with soil samples collected after the pepper harvest. The treatments include T0 (initial soil), CTR (unfertilized control), HM (horse manure), SBO (sulfur bentonite plus orange waste), and NPK (mineral fertilizer). Different letters indicate statistically significant differences among the treatments according to Tukey’s test (p < 0.05). n.s. = not significant (p > 0.05).
Figure 7.
Fluorescein diacetate hydrolase (FDA. µg FDA/g d.s.), dehydrogenase (DHA. µg TTF/h/g d.s.), and catalase. (CAT. O2/3 min/g d.s.) detected in soil after the second cycle of the broccoli–pepper crop rotation. The data refers to the open field experiments carried on from October 2022 to July 2023. Soil samples were collected after the tomato harvest. The treatments include T0 (initial soil), CTR (unfertilized control), HM (horse manure), SBO (sulfur bentonite plus orange waste), and NPK (mineral fertilizer). Different letters indicate statistically significant differences among the treatments according to Tukey’s test (p < 0.05).
Figure 8.
Cations (a) and anions (b) (mg * g−1 dw) in soil under the broccoli–pepper crop rotation. The second crop rotation cycle, from October 2023 to July 2024, with soil samples collected after the pepper harvest. The treatments include T0 (initial soil), CTR (unfertilized control), HM (horse manure), SBO (sulfur bentonite plus orange waste), and NPK (mineral fertilizer). Different letters indicate statistically significant differences among the treatments according to Tukey’s test (p < 0.05). n.s. = not significant (p > 0.05).
Figure 9.
Principal component analysis (PCA) of chemical, biochemical, and ionic soil parameters under the broccoli–pepper crop rotation. The biplot represents soil samples collected after the first cycle (T01, CTR1, NPK1, HM1, SBO1) and the second cycle (T02, CTR2, NPK2, HM2, SBO2).
Figure 9.
Principal component analysis (PCA) of chemical, biochemical, and ionic soil parameters under the broccoli–pepper crop rotation. The biplot represents soil samples collected after the first cycle (T01, CTR1, NPK1, HM1, SBO1) and the second cycle (T02, CTR2, NPK2, HM2, SBO2).
Table 1.
Chemical characteristic of sulfur bentonite plus orange waste and horse manure fertilizers. Data are the mean of three replications ± standard deviation. Different letters in the same row indicate, significant differences among the treatments (* Tukey’s test, p ≤ 0.05).
Table 1.
Chemical characteristic of sulfur bentonite plus orange waste and horse manure fertilizers. Data are the mean of three replications ± standard deviation. Different letters in the same row indicate, significant differences among the treatments (* Tukey’s test, p ≤ 0.05).
| Chemical Properties | HM | SBO |
|---|
| pH | 7.0 a* ± 0.1 | 6.8 a ± 0.2 |
| EC (mS/cm) | 12 a ± 1.1 | 1.3 b ± 0.9 |
| Moisture (%) | 86.7 a ± 3.2 | nd ± 2.9 |
| OC (%) | 22.6 a ± 1.9 | 6.3 b ± 2.5 |
| TN (%) | 3.0 a ± 0.6 | 0.9 b ± 0.3 |
| C/N | 7.3 a ± 1.9 | 9.3 a ± 1.7 |
| Na+ (mg g−1 dw) | 1.8 a ± 0.5 | 0.12 b ± 0.2 |
| NH4+ (mg g−1 dw) | 0.24 a ± 0.03 | 0.09 b ± 0.04 |
| K+ (mg g−1 dw) | 3.2 a ± 2.3 | 1.32 b ± 2.6 |
| Mg2+ (mg g−1 dw) | 1.9 a ± 0.4 | 1.41 b ± 0.7 |
| Ca2+ (mg g−1 dw) | 2.3 a ± 0.7 | 1.1 b ± 1.0 |
| Cl− (mg g−1 dw) | 3.8 a ± 0.5 | 0.11 b ± 0.6 |
| PO43− (g g−1 dw) | 2.8 a ± 0.4 | 0.3 b ± 0.3 |
Table 2.
Chemical and biological properties of soil after the first crop cycle of the broccoli–tomato rotation (October 2022–July 2023), with samples collected after tomato harvest. The treatments include T0 (initial soil), CTR (unfertilized control), HM (horse manure), SBO (sulfur bentonite plus orange waste), and NPK (mineral fertilizer). The measured variables include water content (WC, %), pH, electrical conductivity (EC, µS cm−1), water-soluble phenols (WSP, µg TAE g−1 dry soil), organic carbon (OC, %), organic matter (OM, %), total nitrogen (TN, %), carbon-to-nitrogen ratio (C/N), cation exchange capacity (CEC, cmol+ kg−1), and microbial biomass carbon (MBC, µg C g−1). Values are expressed as a mean ± standard deviation. Different letters within the same column indicate statistically significant differences among the treatments according to Tukey’s test (p < 0.05).
| | WC (%) | pH | EC | WSP | OC | OM | TN | C/N | CEC | MBC |
|---|
| T0 | 7.8 ± 0.2 b | 8.16 ± 0.1 a | 100 ± 6 e | 23.3 ± 3 b | 0.73 ± 0.03 d | 1.25 ± 0.1 d | 0.09 ± 0.01 b | 8.1 ± 0.2 b | 13.4 ± 0.1 b | 433 ± 8 e |
| CTR | 8 ± 0.2 b | 8.24 ± 0.2 a | 171 ± 9 d | 23.2 ± 2 b | 1.40 ± 0.02 c | 2.40 ± 0.3 c | 0.10 ± 0.02 b | 14.0 ± 0.2 a | 15.2 ± 0.1 b | 476 ± 10 d |
| HM | 13 ± 0.2 a | 8.19 ± 0.2 a | 232 ± 10 a | 22.4 ± 3 b | 1.70 ± 0.04 b | 2.92 ± 0.1 b | 0.15 ± 0.01 a | 11.3 ± 0.1 a | 17.1 ± 0.2 a | 752 ± 12 b |
| SBO | 16 ± 0.2 a | 7.99 ± 0.1 a | 207 ± 8 b | 28.8 ± 2 a | 1.98 ± 0.1 a | 3.40 ± 0.2 a | 0.14 ± 0.02 a | 14.1 ± 0. 2 a | 17.0 ± 0.2 a | 788 ± 11 a |
| NPK | 16 ± 0.2 a | 8.38 ± 0.2 a | 195 ± 9 b | 19.5 ± 3 b | 1.67 ± 0.07 b | 2.87 ± 0.2 b | 0.18 ± 0.02 a | 9.2 ± 0.01 b | 16.5 ± 0.02 a | 611 ± 13 c |
Table 3.
Chemical and biological properties of soil after the second crop cycle of the broccoli–tomato rotation (October 2022–July 2023), with samples collected after tomato harvest. The treatments include T0 (initial soil), CTR (unfertilized control), HM (horse manure), SBO (sulfur bentonite plus orange waste), and NPK (mineral fertilizer). The measured variables include water content (WC, %), pH, electrical conductivity (EC, µS cm−1), water-soluble phenols (WSP, µg TAE g−1 dry soil), organic carbon (OC, %), organic matter (OM, %), total nitrogen (TN, %), carbon-to-nitrogen ratio (C/N), cation exchange capacity (CEC, cmol+ kg−1), and microbial biomass carbon (MBC, µg C g−1). Values are expressed as a mean ± standard deviation. Different letters within the same column indicate statistically significant differences among the treatments according to Tukey’s test (p < 0.05).
| | WC (%) | pH | EC | WSP | OC | TN | C/N | OM | CEC | MBC |
|---|
| T0 | 7.85 ± 0.2 c | 8.16 ± 0.2 a | 100 ± 7 d | 23.3 ± 2 c | 0.73 ± 0.05 d | 0.09 ± 0.001 b | 8.1 ± 1 d | 1.25 ± 0.05 d | 13.4 ± 0.5 c | 433 ± 15 d |
| CTR | 11.0 ± 0.1 b | 8.21 ± 0.1 a | 217 ± 9 c | 45.1 ± 6 a | 1.62 ± 0.1 c | 0.08 ± 0.002 b | 20.2 ± 3 a | 2.40 ± 0.1 c | 15.7 ± 0.7 a | 498 ± 14 d |
| HM | 14.0 ± 0.7 a | 7.89 ± 0.2 ab | 220 ± 8 c | 30.2 ± 4 b | 2.14 ± 0.2 ab | 0.19 ± 0.001 a | 11.2 ± 1 c | 3.68 ± 0.2 a | 16.3 ± 0.5 a | 952 ± 15 b |
| SBO | 14.0 ± 0.6 a | 7.50 ± 0.2 b | 310 ± 11 b | 27.9 ± 3 b | 2.30 ± 0.2 a | 0.17 ± 0.001 a | 13.5 ± 2 b | 3.95 ± 0.3 a | 15.0 ± 1 a | 988 ± 10 a |
| NPK | 11.0 ± 0.8 b | 8.29 ± 0.3 a | 370 ± 9 a | 25.0 ± 2 c | 1.95 ± 0.1 b | 0.17 ± 0.002 a | 11.4 ± 1 c | 3.35 ± 0.2 b | 14.4 ± 0.4 b | 0761 ± 11 c |
Table 4.
Chemical analysis of soil under the broccoli–pepper crop rotation. The first cycle refers to the first crop rotation cycle, from October 2022 to July 2023, with soil samples collected after the pepper harvest. The treatments include T0 (initial soil), CTR (unfertilized control), HM (horse manure), SBO (sulfur bentonite plus orange waste), and NPK (mineral fertilizer). The measured variables include water content (WC, %), pH, electrical conductivity (EC, µS cm−1), water-soluble phenols (WSP, µg TAE g−1 dry soil), organic carbon (OC, %), organic matter (OM, %), total nitrogen (TN, %), carbon-to-nitrogen ratio (C/N), cation exchange capacity (CEC, cmol+ kg−1), and microbial biomass carbon (MBC, µg C g−1). Values are expressed as a mean ± standard deviation. Different letters within the same column indicate statistically significant differences among the treatments according to Tukey’s test (p < 0.05).
| | WC (%) | pH | EC | WSP | OC | TN | C/N | OM | CEC | MBC |
|---|
| T0 | 7.85 ± 0.2 c | 8.16 ± 0.3 a | 100 ± 2.1 c | 23.34 ± 0.6 b | 0.73 ± 0.5 c | 0.09 ± 0.5 b | 8.1 ± 0.6 c | 1.25 ± 0.1 c | 13.4 ± 0.4 b | 433 ± 4.6 c |
| CTR | 9.3 ± 2.1 b | 8.16 ± 0.5 a | 188 ± 4.1 b | 30.96 ± 0.7 a | 1.48 ± 0.4 b | 0.08 ± 0.1 b | 18.5 ± 0.3 a | 2.54 ± 0.7 b | 14.1 ± 0.5 b | 499 ± 3.4 c |
| HM | 16.5 ± 1.2 a | 8.14 ± 0.7 a | 233 ± 2.3 ba | 26.85 ± 0.5 b | 1.93 ± 0.1 b | 0.18 ± 0.1 a | 10.7 ± 0.5 b | 3.31 ± 0.2 a | 18.2 ± 0.5 a | 852 ± 4.4 b |
| SBO | 16.5 ± 3.1 a | 7.94 ± 0.9 a | 275 ± 2.1 a | 24.34 ± 2.1 b | 2.16 ± 0.1 a | 0.17 ± 0.2 a | 12.7 ± 0.4 ab | 3.71 ± 0.1 a | 16.9 ± 0.7 a | 988 ± 5.6 a |
| NPK | 16.00 ± 3.4 a | 8.38 ± 0.1 a | 295 ± 3.4 a | 19.55 ± 1.4 c | 1.67 ± 0.3 b | 0.18 ± 0.1 a | 9.2 ± 0.6 c | 2.87 ± 0.2 b | 15.6 ± 0.8 b | 735 ± 5.5 b |
Table 5.
Chemical analysis of soil under the broccoli–pepper crop rotation. The second cycle refers to the second crop rotation cycle, from October 2023 to July 2024, with soil samples collected after the pepper harvest. The treatments include T0 (initial soil), CTR (unfertilized control), HM (horse manure), SBO (sulfur bentonite plus orange waste), and NPK (mineral fertilizer). The measured variables include water content (WC, %), pH, electrical conductivity (EC, µS cm−1), water-soluble phenols (WSP, µg TAE g−1 dry soil), organic carbon (OC, %), organic matter (OM, %), total nitrogen (TN, %), carbon-to-nitrogen ratio (C/N), cation exchange capacity (CEC, cmol+ kg−1), and microbial biomass carbon (MBC, µg C g−1). Values are expressed as a mean ± standard deviation. Different letters within the same column indicate statistically significant differences among the treatments according to Tukey’s test (p < 0.05).
| | WC (%) | pH | EC | WSP | OC | TN | C/N | OM | CEC | MBC |
|---|
| T0 | 7.85 ± 0.1 c | 8.16 ± 0.1 a | 100 ± 1.5 b | 23.34 ± 1.5 b | 0.73 ± 0.1 c | 0.09 ± 0.2 a | 8.1 ± 0.7 c | 1.25 ± 0.1 c | 13.4 ± 1.2 b | 433 ± 2.5 c |
| CTR | 10 0 ± 0.2 b | 8.25 ± 0.2 a | 192 ± 2.5 ab | 37.5 ± 0.5 a | 1.54 ± 0.1 b | 0.10 ± 0.3 a | 15.4 ± 0.8 a | 2.65 ± 0.3 b | 13.9 ± 1.3 b | 501 ± 2.7 c |
| HM | 13.5 ± 0.2 b | 7.97 ± 0.4 a | 223 ± 2.7 a | 25.50 ± 1.7 b | 1.93 ± 0.2 b | 0.16 ± 0.3 a | 12.1 ± 1.1 b | 3.31 ± 0.3 a | 15.2 ± 1.6 a | 879 ± 3.5 a |
| SBO | 13.0 ± 0.3 b | 7.81 ± 0.4 a | 249 ± 3.5 a | 32.50 ± 1.2 a | 2.10 ± 0.2 a | 0.13 ± 0.3 a | 16.2 ± 1.2 a | 3.61 ± 0.4 a | 15.81 ± 1.2 a | 955 ± 4.7 a |
| NPK | 16.00 ± 0.3 a | 8.38 ± 0.7 a | 264 ± 2.3 a | 19.55 ± 1.4 c | 1.67 ± 0.3 b | 0.18 ± 0.2 a | 9.2 ± 1.2 bc | 2.87 ± 0.1 b | 15.6 ± 1.2 a | 755 ± 5.6 b |
Table 6.
Correlation matrix (Pearson (n − 1) among soil chemical, biochemical, and ionic variables measured across both crop rotation cycles and all fertilization treatments. Values in bold are different from 0 with a significance level, alpha = 0.005.
Table 6.
Correlation matrix (Pearson (n − 1) among soil chemical, biochemical, and ionic variables measured across both crop rotation cycles and all fertilization treatments. Values in bold are different from 0 with a significance level, alpha = 0.005.
| Variables | WC | pH | EC | WSP | FDA | CAT | DHA | OC | TN | C/N | OM | CEC | MBC |
|---|
| WC | 1 | −0.313 | 0.446 | 0.042 | 0.144 | 0.049 | 0.242 | 0.773 | 0.760 | 0.141 | 0.779 | 0.800 | 0.718 |
| pH | −0.313 | 1 | −0.242 | −0.199 | −0.730 | 0.615 | −0.901 | −0.506 | −0.326 | −0.132 | −0.522 | −0.064 | −0.715 |
| EC | 0.446 | −0.242 | 1 | 0.225 | 0.209 | −0.106 | −0.020 | 0.820 | 0.638 | 0.334 | 0.810 | 0.269 | 0.704 |
| WSP | 0.042 | −0.199 | 0.225 | 1 | −0.274 | 0.146 | 0.080 | 0.275 | −0.265 | 0.842 | 0.159 | 0.116 | 0.062 |
| FDA | 0.144 | −0.730 | 0.209 | −0.274 | 1 | −0.901 | 0.781 | 0.266 | 0.399 | −0.384 | 0.345 | −0.099 | 0.642 |
| CAT | 0.049 | 0.615 | −0.106 | 0.146 | −0.901 | 1 | −0.632 | −0.056 | −0.180 | 0.394 | −0.120 | 0.394 | −0.416 |
| DHA | 0.242 | −0.901 | −0.020 | 0.080 | 0.781 | −0.632 | 1 | 0.267 | 0.183 | −0.035 | 0.291 | 0.097 | 0.573 |
| OC | 0.773 | −0.506 | 0.820 | 0.275 | 0.266 | −0.056 | 0.267 | 1 | 0.767 | 0.426 | 0.992 | 0.640 | 0.892 |
| TN | 0.760 | −0.326 | 0.638 | −0.265 | 0.399 | −0.180 | 0.183 | 0.767 | 1 | −0.225 | 0.821 | 0.490 | 0.839 |
| C/N | 0.141 | −0.132 | 0.334 | 0.842 | −0.384 | 0.394 | −0.035 | 0.426 | −0.225 | 1 | 0.320 | 0.361 | 0.089 |
| OM | 0.779 | −0.522 | 0.810 | 0.159 | 0.345 | −0.120 | 0.291 | 0.992 | 0.821 | 0.320 | 1 | 0.625 | 0.922 |
| CEC | 0.800 | −0.064 | 0.269 | 0.116 | −0.099 | 0.394 | 0.097 | 0.640 | 0.490 | 0.361 | 0.625 | 1 | 0.481 |
| MBC | 0.718 | −0.715 | 0.704 | 0.062 | 0.642 | −0.416 | 0.573 | 0.892 | 0.839 | 0.089 | 0.922 | 0.481 | 1 |
Table 7.
The p-values from three-way ANOVA testing the effects of fertilization, crop rotation, and year on soil chemical and biological variables. Significance levels: * p < 0.05, ** p < 0.01, *** p < 0.001, n.s. = not significant (p > 0.05).
Table 7.
The p-values from three-way ANOVA testing the effects of fertilization, crop rotation, and year on soil chemical and biological variables. Significance levels: * p < 0.05, ** p < 0.01, *** p < 0.001, n.s. = not significant (p > 0.05).
| Variable | Fertilizer | Fertilizer × Rotation | Fertilizer × Year | Fertilizer × Year × Rotation | Rotation | Year | Year × Rotation |
|---|
| C/N | *** | *** | *** | *** | n.s | *** | *** |
| CAT | *** | *** | *** | *** | *** | *** | n.s |
| CEC | *** | *** | *** | *** | * | *** | n.s |
| DHA | *** | *** | *** | ** | *** | *** | * |
| EC | *** | n.s | *** | *** | n.s | *** | *** |
| FDA | *** | *** | *** | *** | n.s | *** | n.s |
| MBC | *** | ** | ** | *** | *** | *** | *** |
| OC | *** | * | * | ** | n.s | *** | *** |
| OM | *** | *** | ** | *** | n.s | *** | *** |
| TN | *** | n.s | *** | *** | n.s | n.s | *** |
| WC | *** | *** | *** | *** | *** | *** | *** |
| WSP | *** | *** | *** | *** | *** | *** | *** |
| pH | *** | n.s | * | n.s | n.s | *** | n.s |


 ,
, 

