Abstract
The quality of life in both urban and rural areas is highly dependent on the availability of services of general interest. This study examines the provision and accessibility of 41 types of point-specific services, divided into 10 categories, within the functional urban region of Zagreb, Croatia, characterized by a declining population, despite being the most populous area in Croatia. This study adopts a multi-service rather than a single-service research approach, providing a more comprehensive understanding of the phenomenon. Using GIS composite indices for service provision and accessibility by car (cumulative opportunities) were calculated. Cluster analysis (Ward method, quadratic Euclidean distance) revealed seven different geographical patterns. The results show different patterns of service provision and accessibility throughout the urban region. Two specific areas were highlighted: traditional and inner peripheral areas with low levels of both service provision and accessibility, and suburban areas with very good accessibility but very poor service provision. The results of this study are particularly valuable as they relate to a single functional urban area that includes both urban, suburban and rural settlements of different types, a spatial framework that has not been sufficiently analysed in the literature.
1. Introduction
The provision and accessibility of basic services have been important issues of social, economic and spatial development for decades [1,2,3,4,5,6]. In the European context, they are considered one of the cornerstones of quality of life to which every citizen has a right, as evidenced by the Charter of Fundamental Rights of the European Union [7] and the European Pillar of Social Rights Action Plan [8]. Although there are numerous definitions, the prevailing concept in the EU refers to both 1. services of general economic interest (SGEI), e.g., telecommunications, gas, postal services, transport, waste management, water supply and public broadcasting, and 2. social services of general interest (SSGI), e.g., healthcare, education and social security [9,10].
Their spatial organisation, both in terms of provision and accessibility, has been the subject of numerous studies, particularly with regard to the existing inequalities between urban and rural areas [9,11,12,13,14,15]. In particular, the lack of services and the closure of some of these facilities due to economic (e.g., market forces [16]) or social factors (ageing and depopulation) (e.g., [17,18,19,20]) have attracted academic interest. Research on service deserts (food, pharmacies, etc.), inadequate public transport or the urban–rural divide in digital and broadband services [21] has brought to light many examples of the poor provision of both SGEI and SSGI throughout European remote, traditional or legacy rural peripheries [22].
However, as Ortega-Reig et al. [11] rightly point out, and this adds weight to this paper, the signs of peripheralisation, including the reduction of service levels in non-remote areas and even in the metropolitan core regions, are still under-researched. This applies in particular to Central, Eastern and Southern Europe, where a strong polarisation between the regions can be observed. This may also come as a surprise, as recent academic interest in city-regions, metropolitan regions or functional urban areas is growing. However, the interest is mainly related to the geography of post-industrial and post-modern economic activities [23] or new industrial spaces [24] in urban regions. Consider, for example, Cambridge and the M11 corridor or the Thames project in the UK, the Munich city region in Germany, Stockholm [23] in Sweden and Helsinki in Finland, all of which have been the subject of recent academic research [24,25]. They are often seen as successful examples both in terms of production and consumption. Their productive role is often related to the availability of construction land and lower operating costs for business while providing recreation and leisure opportunities in green areas close to the core city [25]. This may hide social problems such as inadequate service provision and accessibility in both the suburban and rural areas that make up the city region or functional urban area or metropolitan area in Europe alongside the core city [26]. ESPON project PROFECY [27], which analysed accessibility to financial, cultural, health, educational, transport and commercial services in Europe, concluded, among other things, that the so-called inner peripheries, i.e., the areas outside the traditional peripheries, are struggling with problems in accessing basic services. It recognized the need for further research on the provision and accessibility of services outside of traditional peripheries.
In this sense, this paper is also particularly interested in recognising different spatial patterns of both the provision and accessibility of basic services within the urban region of Zagreb, which consists of the densely populated core city and the less populated suburban and rural areas. In addition to recognising areas where access to basic services is problematic, we want to identify clusters with different levels of both service provision and accessibility, explain their differences and discuss the consequences for their development. This would be an important contribution to current research focussing on risk areas, inner peripheries and enclaves with insufficient access. In analysing accessibility, the role of public transport and intra-regional networks will be of particular interest. In doing so, we respond to the gap in the literature on the urban–rural divide, which focuses on interregional networks, while secondary and local networks and public transport are equally, if not more, important for access to services and improving quality of life. Finally, the study adopts a multi-service research approach rather than a single-service approach as used in some published research on service provision and accessibility in urban regions [16,28], thus providing a more comprehensive understanding of the phenomenon.
2. Theoretical Framework
2.1. Services of General Interest—Definition and Legal and Philosophical Approach
In the European context, the interest in researching spatial service patterns was initially academic; later, it became an important topic of spatial development policy. Although European countries have addressed the development of services in their policy documents—as the concept of “public services” [29] or “Daseinsvorsorge” in German-speaking countries show [30,31]—this issue was particularly emphasised at the European Union (EU) agenda level in the 1990s and 2000s and has since been developed under the normative term “services of general interest” [32,33]. At the EU level, the services covered by this concept were defined more precisely in the Green [34] and White Paper on services of general interest [35] published in 2004 and categorised into three categories, depending on the need for and intensity of the European community’s action and the role of the member states: services of general economic interest provided by large network industries (telecommunications, gas, postal services and transport), other services of general economic interest (waste management, water supply and public broadcasting) and non-economic services and services with no effect on trade. However, a clear shortcoming of this categorisation was the omission of other social services (e.g., healthcare, education, social security, etc.) which, although not of economic importance for the European internal market, are extremely important for the quality of life of the population. As a result, the category of social services of general interest (SSGI) was introduced, in contrast to the previously recognised services of general economic interest (SGEI). The issue of services of general interest in the EU has largely remained the responsibility of the member states. As a result, it is very difficult to determine what precisely constitutes the general interest for each individual member state as well as for a particular territorial unit or end user [36]. According to sources based on the ESPON SeGI project, services of general economic interest include services provided by technical and communication infrastructure, while social services of general interest include services in the fields of education, healthcare, social care and the labour market [9,10]. This categorisation is obviously not exhaustive, but indicates a wide range of services that are important to individuals, businesses and society as a whole.
Nevertheless, it can be assumed that services of general interest—irrespective of the spatial context or specific interpretations of the common good—are those services that aim to create a broad social benefit. These are services that every individual or enterprise needs and rightly demands in order to achieve a satisfactory quality of life and work, and which are at the same time subject to the influence of the state, as their provision is primarily market-orientated [30,33].
The legal perspective set out in these documents can be combined with philosophical and theoretical views on justice, in particular those of Rawls [37] and Soja [38]. Rawls [37] argues that all people should have equal opportunities to benefit from certain goods, while Soja [38] builds on his non-spatial approach by introducing an understanding of spatial inequalities and spatial justice. In the context of services of general interest, the equal opportunities for the individual are achieved, in particular, through those services that support the realisation of personal development [39]. In the context of spatial justice, scholarship may raise the question of whether and to what extent services of general interest can and should be considered a universal right (a debate that is being conducted at the conceptual level by proponents of egalitarianism, libertarianism, utilitarianism and other philosophical schools of thought), as well as the question of who should be responsible for the provision of such services [33]. Nonetheless, the fact remains that opportunities for individuals, companies or society—as well as social rights—are based on limited resources and are therefore not equally or freely accessible to all individuals, companies or society as a whole [40,41]. If we transfer this assertion to the spatial context, we can say that space is inherently divided between the centre and periphery and that not every point in space can be equidistant from the centres where possibilities are concentrated and therefore the opportunities of those residing in the periphery are limited [42,43].
Apart from the centre–periphery theory, which is a much broader economic-geographical theory, scholars have sought to better understand the spatial organisation and inequalities in the provision and accessibility of services by developing appropriate theories and concepts. In this context, the theory of central places, which was founded in 1933 by Walter Christaller with his work on central places in southern Germany and further developed by numerous academics and theorists in the following decades, should be emphasised in particular [4,44,45]. This theory was developed under the influence of neoclassical location theory, with the aim of understanding the concentration of services in specific locations to which the population of an associated catchment area tends. The services offered in the settlements are neither equal in number nor in level, which leads to a hierarchy between settlements with higher and lower quality services. The catchment areas of centres in which higher-order services are concentrated are larger and include several catchment areas in which lower-order services are offered. Service centres and their catchment areas were combined in an ideal hexagonal network. The over-idealisation of this model, the lack of consideration of the relationship between demand and supply of services, the significant role of a single regulator (the state) in the provision of services and its inflexibility in the context of a market economy led to a decline in the importance of the theory in academic circles [4,46]. However, its application in the Central European tradition of spatial planning has proved to be a sound approach to maintaining a reasonably balanced level of services—an approach for which a suitable alternative is not easy to find [47]. For these reasons, the legacy of the theory of central places in spatial planning is now being empirically researched, validated and interpreted within the theoretical framework of the new economic geography, the geography of trade and the geography of consumption, although the number of studies on this topic is still relatively limited [45,48,49].
2.2. Measuring Service Provision and Accessibility
The key question for understanding spatial patterns of service provision is how they can be measured. A major advantage of the theory of central places in this context is the clear representation of spatial relationships between different centres, measured by the degree of centrality of a settlement—derived from the quantity and level of services provided in that settlement. The most comprehensive analysis of indicators that can be used to study spatial disparities in the provision of services of general interest was carried out in the ESPON SeGI project, where various indicators available in the Eurostat database were identified and categorised according to the statistical classification of economic activities (NACE) [9,36,50]. Most indicators are calculated on the basis of the number of units, users or capacity in relation to a certain number of inhabitants (mainly 100,000). However, these indicators are only available at the national level (NUTS 0) and some at the level of NUTS 2 statistical regions, which makes them much more difficult to analyse in smaller regions as statistical data do not exist at these levels. In the academic literature, interest in the provision of services of general interest in smaller regions is usually associated with specific changes in the provision of services, primarily related to the closure of certain services or the emergence of new spatial organisations. Rural areas have been particularly well researched in this context (e.g., [17,18,19,51,52]). Most studies focus on a single type of service and, in addition to the provision of services, great importance is also attached to the accessibility of services (see [17,18,19,28,53,54,55,56,57,58,59]). Settlements with certain services are therefore more often distinguished not by the quantity or level of services available in them, but rather by the accessibility of these services.
Accessibility is a concept that has been greatly developed and researched in academic literature in recent decades. There are numerous definitions of accessibility, ranging from Hansen’s definition, which describes it as “the potential of opportunities for interaction”, to others that generally include the elements of destinations, activities and travel resistance [60,61]. In the context of services of general interest, accessibility can be defined as the potential possibility for the inhabitants of a given area to benefit from certain types of services [14].
According to Geurs and Van Wee [61], accessibility can be measured in four ways: infrastructure-based (based on the capacity of the transport network), location-based (analysing accessibility from a specific location), person-based (based on the opportunities available to a person) and usage-based (the economic benefit that society derives from access to certain activities). In the context of the spatial organisation of services of general interest, particular emphasis is placed on different models for the representation of location-based accessibility.
Location-based accessibility can be measured by distance measures and as potential accessibility [61]. Distance measures are the simplest type of accessibility metric and provide what is known as relative accessibility—a measure that indicates the spatial or temporal distance between specific locations. When multiple locations are considered, they are often delineated using isolines (isodistances or isochrones), i.e., contours on a map that mark areas that are accessible from a particular location within a given spatial or temporal threshold. This leads to an indicator known as cumulative opportunities. The advantages of this method lie in its simplicity of implementation and interpretation. However, it does not consider competition between locations, the influence of external factors (such as traffic and land use patterns) or individual perceptions. In addition, the choice of a time or distance threshold is arbitrary.
A more complex model is potential accessibility, where the accessibility of opportunities (services) from one zone to other zones is assessed, with smaller or more distant opportunities (services) having a decreasing influence. It overcomes the shortcomings of relative accessibility determined by isochrones, as certain locations can be assigned weighting values, the influence of external factors (transport infrastructure and land use) can be integrated and the distance drop can be determined taking individual user preferences into account. On the other hand, the interpretation of the results is more complex and competition between specific locations is still not considered. The limitation that competition cannot be taken into account has been improved by the development of the Two-Step Floating Catchment Area (2SFCA) method, which calculates the service catchment area (the population size that can potentially reach a provider within the catchment area boundary) and the population catchment area (for each population location, the amount of services accessible within the catchment area boundary) [62,63]. This approach makes an important contribution to research that focuses not only on service provision but also on demand [14].
In the academic literature, a growing number of studies have been conducted in recent decades on the accessibility of specific places where different services are offered. Most studies focus on a single service or analyse the accessibility of services individually (e.g., [14,17,28,52,53,54,56,58,63,64,65,66,67,68,69,70], while a few analyse the accessibility of a wider range of services and derive composite accessibility indicators for all analysed services (e.g., [11,12,13,71]). Understanding the overall accessibility of all service categories, which results from the interpretation of composite indicators, contributes significantly to understanding the spatial distribution of services and centres of different service levels. Composite indicators can also be used to derive territorial typologies that emphasise areas with stronger or weaker service provision and accessibility. In the European context, such typologies have been developed mainly in the context of ESPON studies that have focussed wholly or partly on services of general interest (e.g., ESPON SeGI (see [72]) and ESPON PROFECY (see [11])).
3. Materials and Methods
3.1. Study Area and Data
The Zagreb region (Figure 1) is a functional urban area and the central region of the Republic of Croatia and consists of three Croatian counties (NUTS 3 level): the City of Zagreb, Zagreb County and the Krapina-Zagorje County. According to data from the 2021 population census [73], 1,187,818 people live in this area, which corresponds to 30.7% of the total population of the Republic of Croatia. The area comprises 67 local self-government units, in which 1184 statistical settlements are designated, which serve as the basis for all steps of analysis in this study. Despite its relatively small area, this region is characterised by highly diversified demographic and socio-economic dynamics. It comprises a densely populated urban area that has experienced a population decline in recent decades, suburban areas with positive demographic development and rural settlements that are partially or completely peripheral. The differences in demographic processes are reflected in the population development during the most recent inter-census period in Croatia (2011–2021, Figure 1). The City of Zagreb recorded a slight population decline and the surrounding areas showed moderate growth, while the peripheral areas, especially in the far southwestern part, were subject to severe depopulation. The peripheral areas of the region also have a high proportion of residents over the age of 65, which is a further indication of a weakening demographic base. According to van den Berg’s model of urban development [74,75], the Zagreb region is currently in transition from the second to the third stage of urban development—from suburbanization to deurbanization/disurbanization. Croatia is a country that is experiencing a pronounced overall population decline at the national level, which has intensified, especially after joining the European Union. This trend is reflected in the fact that even the Zagreb region, the most populous region in the country, is losing population. Between 2011 and 2021, the region’s population fell by 4.3%. More recent trends, triggered mainly by the recent influx of foreign labour, could change the demographic picture of the region somewhat, but as there is no population register, it is not currently possible to assess these effects more precisely.

Figure 1.
Population change and ageing characteristics of settlements in Zagreb region in 2021.
As a basis for the analyses presented in this study, data on the number of provided services of general interest types were collected in each statistical settlement. Due to the exceptionally high population and large area that cover the urban settlement of Zagreb (663,592 inhabitants in 2021), it was divided into its 15 urban districts before the analysis. This reduced the variation between the smallest and the largest settlement in the region from 663,592 to 65,324 inhabitants. This brings the total number of statistical settlements analysed for the data on services to 1198, represented by 1207 polygon features in GIS.
This study is limited to services that are point-specific for individual settlements, like in [14]. For each statistical settlement, the number of available services was surveyed. Data were collected on 41 types of services, divided into 10 categories:
- Supply: general shops (grocery shops, supermarkets and hypermarkets), shopping centres and petrol stations;
- Education: pre-school facilities, four-year primary schools (primary schools in smaller villages as branches of complete primary schools), complete primary schools, secondary schools, high schools and university branches and universities;
- Healthcare: general practise, dental practise, health centre, specialist clinics, general/clinical hospital, clinical hospital centre, public health insurance office, public health institute and pharmacies;
- Post office, banking and finance: branches of the Croatian Post Office, branches of a commercial bank, ATMs, financial agency offices and tax administration offices;
- Administration and justice: seats of local self-government, municipal and county courts and administrative courts;
- Social services and infrastructure: social welfare centres and family and retirement homes;
- Cultural services: libraries, cinemas and theatres;
- Religious facilities: Catholic parishes and religious institutions of other denominations;
- Civic social services: sports clubs, voluntary fire brigades, cultural and arts organisations and local action groups;
- Mobility services: public bus transport (the maximum number of departures) and passenger rail transport (the maximum number of departures).
Since there is no standardised data source in Croatia that systematically classifies services into the above categories, various sources were used to collect information on the number of services. These sources included official registers of public institutions for education, health, administration, justice, postal, financial and civil institutions; registers and websites of private companies and civil society organisations providing services in the areas of utilities, banking, social care, culture, religious institutions and other civil services; timetables of various public bus and rail transport providers; and cartographic data from public map services such as Google Maps and the map of the Croatian Auto Club. The critical date for obtaining the data was 30 June 2023.
3.2. Analysis of the Service Provision in Settlements
After collecting data on the number of services available in the settlements of the Zagreb region, the first step was to analyse the differentiation of settlements based on the number of services offered in them. For this purpose, the method of composite indices was applied. The composite indices were calculated with ArcGIS Pro 3.2 software using the Calculate Composite Index tool. This tool is used to combine multiple numeric variables into a single index. The input data consisted of the number of services within certain categories and their subtypes taken from the service directory created in the previous phase. The variables used were the total number of services in a particular subtype of the 10 categories mentioned. A total of 41 variables were used, the values of which are contained in 41 columns of the attribute table in the polygon layer of the settlements for each of the 1198 settlements. All service subtypes were treated as equal, with no special weighting assigned to lower- or higher-order services. In all observed service categories, lower-order services are present in settlements where higher-order services are also available (e.g., there are general shops in settlements with hypermarkets, general medical practises in settlements with hospitals, etc.). Therefore, a distorted representation where settlements with higher-order services may appear less well-equipped than those with only lower-order services is non-existent.
Due to the differences in the spatial organisation of services, depending on how they are provided and the need for access to them, the set of 41 previously introduced services was divided into three groups, each with its own composite index calculated.
The first group comprises essential services of general interest, i.e., those that are provided at one or more locations within a settlement and on which residents necessarily rely at some stage of their lives. This includes services in categories 1–5 (supply, education, healthcare, postal services, banking and finance and administration and justice).
The second group also includes services that are available at specific locations within a settlement but are not necessarily utilised by the inhabitants at any point in their lives, unless it is a matter of personal preference. These services fall into categories 6–9 (social services and infrastructure, cultural services, religious facilities and civic social services). In further text they are referred to as other social services of general interest.
The third and final group of services comprises public bus and rail transport (category 10). Since these services are provided at one or more locations within a settlement, the number of daily departures on weekdays from the stop with the highest number of departures for each type of public transport in the settlement was used as input for the analysis. In Croatia, there is no public transport system based on a fixed interval timetable, which would allow the use of departure intervals as a more precise indicator. However, the number of departures from the stop with the highest frequency is a good indicator of the differences between settlements located on major transport axes and those that are further away from them.
Therefore, for each settlement i (i = 1, 2, 3, …, 1198) j-th variable (j = 1, 2, 3, …, 41) was identified to represent the number of services in a specific subtype.
Given the significant differences in the number of services in individual settlements within certain subtypes, standardisation was necessary to ensure the same value for all subtypes. The rank method was identified as the most appropriate method for normalisation, as it prioritizes variable ranks over absolute values, which are essential for understanding the spatial organization of service provision. It highlights settlement similarities and differences, potentially indicating a hierarchy, and its robustness ensures resistance to outliers, such as high service numbers in large urban settlements. For each value j, the settlements were ranked based on the variable values. The rank Rij value was assigned to settlement i for variable j. The rank values range from 1 to the total number of settlements n = 1198.
When creating the composite index, the rank values for different variables are averaged, and finally, the mean rank value for all settlements i is determined.
where m is the total number of variables in the group (depending on the service category grouping).
The mean rank value serves as the basis for the index. All indices in this stage of the study were derived by distributing the normalised mean rank values for the three groups of services on a scale from 0 to 100, starting with the lowest mean values. The final composite index value CPIi was calculated using the following formula:
where and are minimum and maximum mean ranks across all settlements.
For each group of services g (g = 1, 2, 3), a separate composite index CPIi,g was calculated using the same steps. Each group g corresponds to the following: g = 1 (essential services, categories 1–5), g = 2 (other social services, categories 6–9) and g = 3 (public transport, category 10). As a final output, three composite indices for service provision in each settlement were calculated:
- CPIi,1—composite index for the provision of essential services of general interest;
- CPIi,2—composite index for the provision of other social services of general interest;
- CPIi,3—composite index for the provision of public bus and rail transport.
3.3. Analysis of the Service Accessibility in Settlements
The next step in the analysis was to calculate the accessibility of certain services from each settlement. The accessibility was calculated for certain service subtypes in each settlement using ArcGIS Pro 3.2 software. Ultimately, a composite index was created based on the maximum number of settlements in which a certain type of service can be reached from a certain settlement within a certain time threshold. Cumulative opportunities were used as the method for measuring accessibility. More complex methods such as potential accessibility or 2SFCA were excluded, as in this study all services available in a given settlement—regardless of their actual level—are considered to be of equal value and no other indicators are considered other than the number of services accessible from a settlement within a given time period. This is because the analysis focuses exclusively on service provision, not on potential demand. The application of this approach ensures comparability with the composite service provision indices.
The calculation of the accessibility was carried out in six steps. When calculating accessibility, it was assumed that the population of the region utilises the services within the settlements in the region. This reflects the practical reality for public sector services that are provided within strictly defined service areas (e.g., primary schools have defined enrolment areas, and public health services, administrative and judicial services have defined jurisdictions). Furthermore, it can be assumed that the inhabitants of the peripheral settlements in the region rely on the settlements in the neighbouring regions for only a few services due to strong daily migration towards Zagreb and other larger settlements as centres of work and education.
In the first step of the analysis, central points of settlements providing any of the 39 analysed subtypes of services were generated into 39 point layers. The public rail and bus transport services are excluded from this analysis. All points were positioned in the central part of the settlements on roads accessible by car. Due to the large number of services in categories 1–9, totalling 13,639 services in 1198 settlements, and the lack of a public GIS database linked to the specific addresses of these services, it was decided to use the central point of the settlement as the location where the service is considered to be accessible. The central points were taken from point layer Places of OpenStreetMap data. In smaller settlements, services are generally concentrated in the central area, while for larger settlements it is considered that calculating accessibility based on the centre point of the settlement would not significantly alter the results given the relatively small size of the region.
The second step was to calculate the average time within which access to a particular service subtype would be appropriate. This was done using the Origin–Destination Cost Matrix tool in ArcGIS Pro 3.2. This tool is used to find the closest facilities based on the journey time. For 36 point layers representing settlements with a particular service subtype (layers with universities, clinical hospital centres and administrative courts are excluded as they exist only in the City of Zagreb), the journey times by car to the three nearest settlements offering the same service were calculated. The arithmetic mean of the resulting times was then calculated. In order to increase the comparability of the data and to consider the fact that the data refer to the central points of the settlements, the mean value was rounded up to the nearest multiple of 5 min. This ensured the consistency and practical applicability of the time estimates.
In the next step, the Service Area tool in the Network Analyst of ArcGIS Pro 3.2 software was used to delineate the service areas within the defined travel time frame (Table 1) from the centre of each settlement offering a particular service. For the service area of each settlement, the tool creates a single polygon feature that can overlap with others. The polygon includes the road network accessible within the specified time frame, with the default Polygon Trim Distance set to 100 metres, creating a 100-metre buffer around the roads within the polygon. The service areas were generated without detailed adjustments to the traffic conditions depending on the day or time of day, but based on standard driving conditions from the software’s internal cartographic database.

Table 1.
Rounded average journey times per service subtypes.
Using the Count Overlapping Features function, a new polygon layer was created for each service subtype analysed, containing information about the number of overlapping service areas within a given area. This number was then linked to the settlement polygon layer using the Spatial Join function. For each settlement polygon, the maximum value of overlapping polygons was determined, which provides information on how many settlements with a certain service subtype can be reached within the defined timeframe from the part of the given settlement with the highest accessibility.
In the final step of the analysis, a composite accessibility index CAIi for settlements was calculated by aggregating the data on the number of settlements with certain service subtypes that are accessible within the specified time frame. For each settlement i (i = 1, 2, 3, …, 1198), the k-th values (k = 1, 2, …, 36) representing the number of accessible settlements for 36 service subtypes were used as input variables.
As these data were not fully comparable due to the different timeframes, the z-score method was chosen for data standardisation. For each variable k, the mean and standard deviation were calculated across all settlements and the z-score Zik for settlements i for variable k was determined:
Then, the mean z-score for each settlement i was calculated:
where p = 36 is the total number of service subtypes.
The mean z-score was then normalized to a scale from 0 to 100, and the values of composite accessibility index CAIi were determined:
where and are the minimum and maximum mean z-scores across all settlements.
3.4. Cluster Analysis
The purpose of the cluster analysis was to identify similarities between the settlements based on the values of composite indices for the provision of basic services of general interest (CPIi,1), the provision of other social services (CPIi,2), public bus and rail transport services (CPIi,3) and the accessibility of services (CAIi). The cluster analysis was performed using IBM SPSS 29. The input data consisted of the values of the above-mentioned composite indices for all 1198 settlements. Ward’s method was chosen for clustering, with the squared Euclidean distance serving as the measurement interval. Standardisation of the values was not necessary, as all four indices were ultimately scaled from 0 to 100. The final number of clusters was set at seven.
4. Results
This section presents the spatial differentiation of the composite index values for the service provision and accessibility as well as the results of the cluster analysis carried out on the basis of the composite index values.
4.1. Provision of Services of General Interest in Zagreb Region
The values of the composite indices for the service provision in settlements in three categories (essential services of general interest, other social services and public bus and rail transport) show three different spatial patterns. These patterns can be interpreted using the basic indicators of descriptive statistics (Table 1), the correlation coefficients (Table 2) and the cartographic representations of the index values (Figure 2, Figure 3 and Figure 4).
Table 2.
Descriptive statistics of the composite provision indices.
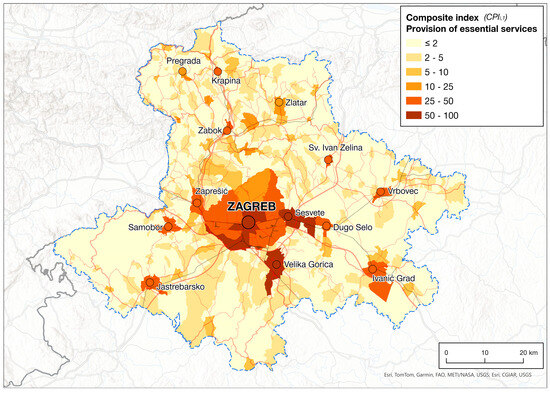
Figure 2.
Composite index for provision of essential services of general interest (CPIi,1) in the settlements of Zagreb region.
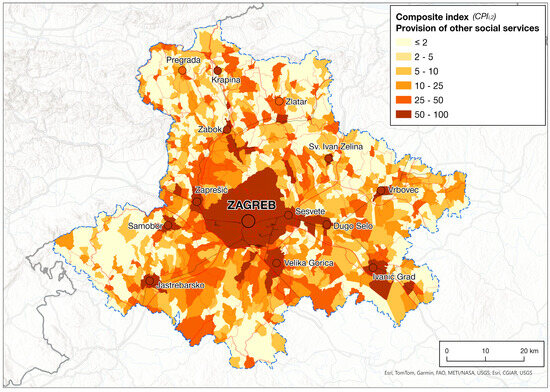
Figure 3.
Composite index for provision of other social services (CPIi,2) in the settlements of Zagreb region.
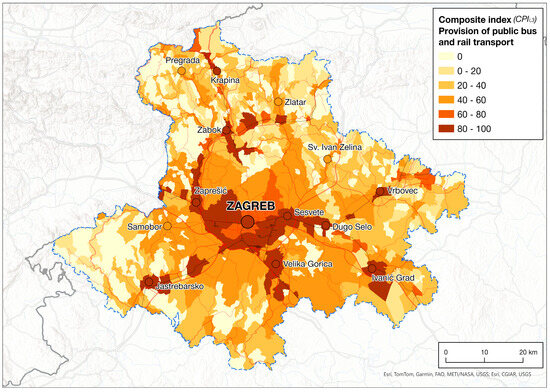
Figure 4.
Composite index for provision of public bus and rail transport (CPIi,3) in the settlements of Zagreb region.
The values of the composite provision index for essential services of general interest (CPIi,1) (Figure 2) are relatively low for most settlements, as shown by the average index value of 4.95 on a scale of zero to 100. Essential services of general interest are concentrated in a smaller number of settlements with exceptionally good provision, as Figure 1 clearly shows. Settlements with high index scores are rare but, with the exception of the sparsely populated regions in the southwest, south and eastern periphery, are fairly well distributed across the functional urban area. Settlements with high index values are mainly located along the main transport axes and in more densely populated areas. There is a hierarchy between these well-equipped settlements that ensures adequate provision of higher-order services (e.g., secondary schools, health centres, shopping centres and retail parks) in almost all parts of the study area. It is also interesting to note the spatial division between public and private providers in the areas of health and education, which are the only subtypes of essential services that can operate in both the public and private sectors. Private facilities for pre-school, primary and secondary education are mainly located in settlements with a larger population, most of which already have the same public sector services. Private medical practises and clinics have a similar spatial organisation, so it can be concluded that the services offered by private sector almost do not change the spatial organisation defined by the same public sector services.
The values of the composite settlement provision index for other social services (CPIi,2) (Figure 3) show a slightly higher average value (9.24) compared to the previous service category. In most settlements, the index values for this category are higher than those of the previous category. This is largely due to the fact that most non-essential social services are privately owned or provided by civil society and arise from small local initiatives. They are therefore widespread overall, particularly in smaller settlements where there are no essential services of general interest. These include voluntary fire brigades, religious facilities and cultural and sports clubs, which are strongly associated with rural life. Even if these services cannot replace the presence of essential services of general interest in settlements where they do not exist, they are very important for improving the quality of life and social inclusion of the population.
The values of the settlement provision index for public bus and rail transport (CPIi,3) show a different distribution pattern compared to the other two categories, as can be seen in Figure 4. Of all of the composite indices, this category has the highest average score (26.32 on a scale of zero to 100) and the largest standard deviation. Public transport services are more evenly distributed across the statistical settlements than the two previous service categories. The areas surrounding Zagreb and the settlements along the road and railway corridors radiating from the city, where the Zagreb public bus transport (ZET) operates and suburban railway lines exist, have the highest level of public transport services. In the outer parts of the region, a relatively large number of settlements (416 settlements, 34.7% of the total number of settlements) have no public transport. The index value of these settlements is zero. The introduction of national co-financing for public transport has significantly improved the offer in the southern part of the region (Zagreb County) and reduced the number of settlements without public transport. This step has yet to be implemented in the northern part of the region (Krapina-Zagorje County).
As the distribution of the composite index values deviates from normality, Spearman’s correlation coefficient (Table 3) was used to measure the relationships between the composite indices and the basic demographic indicators. The highest correlation was found between CPIi,1 and CPIi,2 (0.624, p < 0.01), indicating a moderately strong positive relationship. Slightly lower correlation coefficients were found between CPIi,1 and CPIi,3 (0.555, p < 0.01) and between CPIi,2 and CPIi,3 (0.522, p < 0.01). This is also implied by the general overlap of settlements with higher index values on the maps (Figure 2, Figure 3 and Figure 4).
Table 3.
Correlation coefficients between composite index values for the provision and accessibility of services of general interest and the main demographic indicators.
On the other hand, the relationships between the composite provision indices and the demographic indicators (the share of the population aged 65 and over and the population change index for the last inter-census period in Croatia (2011–2021)) show a statistically significant correlation at the 0.01 level (with the exception of the relationship between the CPIi,2 and the elderly share of the population). The correlation is positive between the composite provision indices and the population change index, while it is negative between the composite provision indices and the elderly share of the population. However, the correlation coefficients are too low to draw meaningful conclusions about the relationships between the variables.
4.2. Accessibility of Services of General Interest in Zagreb Region
The values of the composite accessibility index (CAIi, Figure 5) show that the best accessibility is found in settlements where services of general interest are concentrated, especially in the central part of the region (City of Zagreb and its surroundings). Accessibility then radiates along the major transport corridors, where settlements with larger populations and more services are also concentrated. The peripheral parts of the region have the lowest values for the accessibility index, especially those that are distant from the major transport axes and have a lower population and density. Although these data lack precision, as they do not take into account the gravitational influences of centres outside the functional urban area (as mentioned in the methodology section), the results can still be considered a fair reflection of reality. This is because most of the services analysed—especially those of the public sector—are based on an administrative principle that obliges residents to use them within their own region. In addition, daily commuting is predominantly centred on Zagreb as the largest centre, which further supports the reliability of the observed index values.
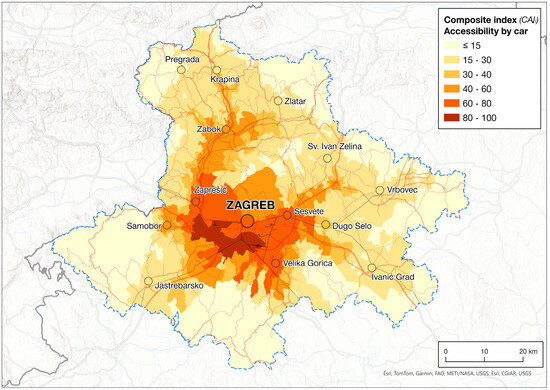
Figure 5.
Composite index for accessibility of services of general interest (CAIi) in the settlements of Zagreb region.
The mean value of the composite accessibility index for all settlements in the region is 21.61 (variance 296.45 and standard deviation 17.22) and is therefore significantly higher than the mean values of the composite indices for the provision of essential services of general interest and other social services. The values of the Spearman correlation coefficient between the composite accessibility index and the composite indices for the provision of services (CPIi,1, CPIi,2 and CPIi,3) indicate a positive but rather weak correlation. Compared to these indices, the composite accessibility index shows a slightly stronger association with demographic indicators, with a weak positive relationship observed with the population development index for the period 2011–2021 and a negative relationship with the elderly share of the population, which, despite its statistical significance, is too weak to support a more reliable conclusion about this relationship.
4.3. Clusters of Settlements in Zagreb Region According to the Service Provision and Accessibility
In the cluster analysis, seven clusters were formed based on the values of the composite indices for service provision (CPIi,1, CPIi,2 and CPIi,3) and the composite accessibility index (CAIi). The clusters were labelled with the letters A–G and their spatial distribution is shown in Figure 6. The mean values of the individual indices within the clusters are shown in Table 4. Each cluster was assigned a descriptive label based on the quartile range of variation between the lowest and highest mean of the composite indices. Clusters with mean values in the first quartile were labelled as poor, those in the second quartile as below average, those in the third quartile as above average and those in the fourth quartile as good. These classifications, which reflect the relative position of the individual clusters, are shown in Table 5.
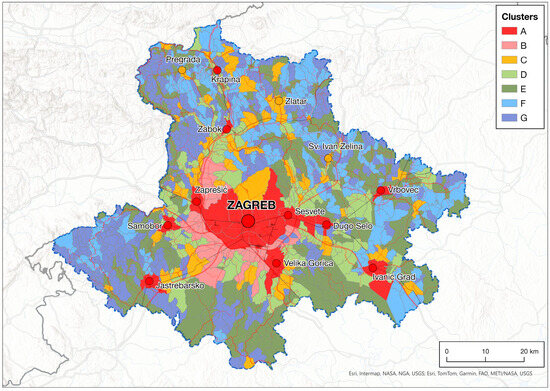
Figure 6.
Clusters of settlements in the Zagreb region according to the values of composite provision and accessibility indices.
Table 4.
Mean values of the composite provision and accessibility indices in seven clusters.
Table 5.
Labels for the clusters according to the relative position of composite provision and accessibility indices in seven clusters.
Cluster A consists of cities (Zagreb—663,592 inhabitants, Sesvete—55,313 inh. and Velika Gorica—30,036 inh.), Zagreb’s satellite towns (Zaprešić, Samobor and Dugo Selo; 10,000—20,000 inh.) and other towns with a higher population and a greater number of services (Ivanić-Grad, Vrbovec, Jastrebarsko and Krapina, Zabok; 3000—10,000 inh.). All settlements in this cluster are characterised by a high level of services in all categories and excellent accessibility. These settlements have well-developed higher-level services, such as secondary and higher education facilities, health centres, large retail outlets, public administration offices and judicial facilities. They also serve as important hubs for public rail and bus transport within the functional urban area. Their location on important transport routes ensures good connections to higher- and lower-level centres.
Cluster B consists of settlements around Zagreb where the process of suburbanisation is actively taking place. These settlements are exceptionally well connected to Zagreb and other centres in Cluster A. The settlements in this cluster can be characterised as settlements in the shadow of Zagreb, as their proximity and accessibility to Zagreb have overshadowed their needs and capacities for the development of services. Despite their relatively high population (most are between 500 and 4000 inhabitants), basic services and other social services have not developed to the point where these settlements could function as independent local service centres. Instead, they usually offer only the most basic services (e.g., a general shop, a general medical practise and a primary school) to meet the basic needs of the residents. De facto, these settlements can be seen as dormitory towns of Zagreb—places where people live but neither work nor use services. Daily commuting to Zagreb and other Cluster A centres is crucial for these settlements, as residents rely on these areas not only for services, but also for employment and educational opportunities.
Cluster C consists of smaller urban and rural centres with 100 to 3000 inhabitants, in which services are concentrated to meet the needs of the local population. These settlements are scattered across different parts of the region and are characterised by poor accessibility to other centres. A significant proportion of the population relies on their own vehicles to access services in these settlements, as public transport services are not as frequent as in previous clusters, and the rail transport in those settlements mainly does not exist.
Cluster D consists of rural settlements with less developed services that are relatively close to the centres in Cluster A. Nearly all of these settlements have between 100 and 1000 inhabitants. In contrast to the settlements in Cluster B, however, their connections to other centres are not as good, as they are located outside the main transport routes in areas with a somewhat lower population density. Public transport is adequately developed in these settlements. These settlements form the broader suburban zone of Zagreb, where change under the influence of the city is significantly weaker compared to Cluster B.
Cluster E consists of rural settlements with poorly developed services and limited access to other settlements where services are concentrated. Their population ranges from 10 to 1000. The advantage of this cluster over the last two is the relatively frequent public transport, which enables the population to reach settlements where the necessary services are provided.
The settlements in clusters F and G are poorly equipped with essential services of general interest and social services, and have relatively poor accessibility and poorly developed (cluster F) or non-existent public transport (cluster G). The spatial distribution of the settlements in these two clusters is very diverse. In general, three zones with a greater concentration of settlements can be identified in these clusters. In the southeastern part of the area lies a region known as Žumberak, which is the only classic karst and fluvio-karst area in this region. This area consists of a large number of very small settlements (almost all with less than 10 inhabitants) whose demographic base is too weak to support a significant development of services. Due to the highly fragmented nature of the terrain, the road network is poorly developed and the technical characteristics of the roads are not conducive to the introduction or expansion of public transport services. Furthermore, it is a border area bordering Slovenia and part of the population relies on service centres across the border to access basic services. The second zone includes almost all settlements located outside the main roads in the northern part of the region (Krapina-Zagorje County). This area is characterised by sparse and scattered settlement patterns in hilly terrain, where topographical conditions have hindered the development of road infrastructure and larger settlements. Most of the settlements in this area have between 50 and 300 inhabitants. The third zone consists of settlements in the eastern and southeastern part of the region. This area is mostly lowland, predominantly agricultural and still influenced by rural–urban migration due to its distance from Zagreb. The size of the settlements in this area is between 100 and 400 inhabitants. As an exception within these clusters, there are also some larger settlements close to the urban area of Zagreb. However, due to their location away from the main transport routes—which makes access to basic services difficult—and the underdeveloped public transport system, they have been categorised in cluster G.
5. Discussion
The main purpose of this paper was to understand the spatial provision of different types of services of general interest (essential services, other social services and public bus and rail transport services) and their accessibility within the Zagreb functional urban region. Many studies focus primarily on service accessibility using different measurement methods (e.g., isochrone analysis, cumulative opportunities, potential accessibility and 2SFCA [14,17,28,58,62,63]). The results are usually analysed and visualised in the form of maps showing different degrees of the accessibility of services within a certain time frame (very rarely within a certain distance). They usually indicate areas with poor or insufficient accessibility (e.g., (inner) peripheries and service deserts (food and medical)). Other research focuses on the supply side of service provision by mapping and analysing with a central place system using hierarchical approaches [59,76,77]. This study focuses simultaneously on 1. service provision (the quantity of available services) in 1198 urban and rural settlements and 2. service accessibility to the population of the Zagreb functional urban region by their place of residence. In addition to calculating accessibility using the cumulative opportunities technique, this approach enabled a comparison between service provision and accessibility. Instead of analysing and visualising the results as the degree of the accessibility of services, the final map shows spatial clusters with different relations between service provision and accessibility.
The service provision in the settlements of the region and the accessibility of the individual settlements to the service locations were expressed by composite indicators—the service provision index and the accessibility index. Some studies, e.g., from Poland [14] and Portugal [13], use index or score-based values to quantify the accessibility of services at the national level. Considering the Central European tradition of applying the theory of central places in spatial and regional planning, this study also aimed to investigate the quantity of services available in individual settlements in order to be able to compare them with the network of central places specified in spatial and regional planning documents in a subsequent research step.
Like previous studies [11,12,13,14,78], this study has shown that, although in a relatively small study area, there is certain spatial disparity between the services provision and accessibility within the region. Most services are concentrated in urban settlements and their accessibility is greatest in cities and their immediate surroundings. In rural areas, on the other hand, especially in remote rural areas or in areas with unfavourable natural conditions, service provision and accessibility are the lowest. As the provision and accessibility of services within functional urban regions have been significantly less explored in the literature compared to the available research on services in peripheral rural areas, even some studies that explicitly mention the relationship of services within functional urban regions [14,76] point to a clear distinction between the urban core—with a higher provision and accessibility of services—and the rural periphery—with a lower provision and accessibility. In this sense, the present research also contributes to confirming this fact.
We would argue that the main benefit of using cluster analysis lies in recognising distinctive patterns of relationships between service provision and accessibility. Apart from Zagreb as the main urban centre and smaller urban centres (clusters A and C), which are relatively evenly distributed in the region and where services are concentrated and their accessibility is satisfactory, two examples with very specific characteristics can be highlighted.
The first example, covered by clusters F and G, includes the rural periphery, both the traditional (legacy) and also inner peripheries close to urban centres, as they fulfil the three basic criteria of inner peripheries: they are enclaves surrounded by areas with better economic accessibility, they have poor access to services of general interest and they experience a lack of relational proximity and exclusion from the mainstream of economic activity [27]. In the hilly and mountain areas closer to the Slovenian border, on the other hand, the traditional (legacy) type of periphery predominates. The traditional periphery is characterised by long-term depopulation and, based on the cluster analysis, can also be described as settlements in a service desert. The term “service desert” is closely related to the concept of “food desert”, which is more common in academic literature and policy documents. A food desert can be understood as an area with limited access to full-line supermarkets, where people therefore have no access to affordable and nutritious food [79,80]. Grocery shops, which serve to supply the population with food and everyday necessities, are the most common type of essential service found in individual settlements. In most settlements in clusters F and G, however, there is either no grocery shop at all or only one small shop of this type, forcing residents to travel to other settlements for basic supplies, which are less accessible compared to the other clusters. Retail in remote rural settlements has not undergone the same market transformation as shops in and around cities, where large retail chains with large-scale shops have developed [16]. As a result, retail in rural peripheral settlements is still tied to small shops that generally offer goods at higher prices than in urban areas.
The second example that shows the usefulness of cluster analysis is the suburban settlements (cluster B), where accessibility to services is very high, but there is also a significant lack of services due to the proximity to higher-level centres, especially Zagreb. The residents of this area live in the so-called agglomeration shadow, and due to the proximity to the higher-level centres, there is an obvious lack of services, so they are borrowed from the neighbouring centres [59,71,81]. In such areas, it is extremely important to ensure a high level of mobility for people so that they can reach the places where services are offered to them. The availability of public transport in such areas significantly increases the level of mobility compared to other parts of the region, as do certain alternative means of transport that have yet to be developed in this region (e.g., public bicycle system, transport on demand, carpooling, etc. [82]). Walking access to services within a certain timeframe (the 15 min city concept [83]) is feasible in settlements with a satisfactory level of services, such as satellite towns, but is not yet plausible in the suburbs due to the lack of services. Ensuring mobility is associated with numerous challenges—such as age, gender, income, disability, etc. [84]. In this context, care must be taken to ensure safe and reliable mobility for various potentially vulnerable groups—women, older people, families with children and people with disabilities.
Suburban areas are also of particular interest for further research because of the consequences of urbanisation. Future studies could therefore focus on the sustainability of urbanisation, particularly in terms of developing utility infrastructures and local services and ensuring satisfactory quality and capacity of transport infrastructures and services that enable suburban residents to reach jobs and services of general interest in the urban centres they gravitate toward. In the Croatian context, urbanisation has a diffuse character (similar to urban sprawl), which means that the development of settlements often does not keep pace with the development of infrastructure and services. With such dispersed urbanisation, public transport is not sufficiently efficient in all areas, forcing some of the population to use their own cars for daily transport. This leads to negative consequences such as traffic congestion, increased noise and air pollution and a general rise in transport costs [85,86]. In this respect, planned urbanisation based on polycentric development—such as transit-oriented development (TOD)—that considers the expansion of public transport networks could help to reduce the negative impacts mentioned above.
6. Conclusions
The results of this study are particularly valuable as they refer to a single functional urban area that includes both urban and rural settlements of different types, a level that has not been sufficiently explored in the literature. The values of composite indices for the service provision and accessibility at the settlement level and settlement clusters show a heterogeneous spatial distribution of service provision and accessibility, with areas with high and low values occasionally converging, but often also diverging. In this way, two specific areas were identified: the rural periphery (both traditional and inner type), characterised by an extremely low level of service provision and accessibility, and the suburban area in the agglomeration shadow, which compensates for its lack of services by relying on the services of nearby urban areas. Recognising such areas is valuable for planning the development of functional urban areas. The data obtained from this study can be used for the elaboration of urban and regional plans, as they show where different strategies can be used to either increase the level of services offered in specific locations (especially in the field of public services) or to improve the accessibility of services through different approaches.
Although analysing the provision and accessibility of services of general interest at the settlement level provides valuable insights, data collection is extremely complex in reality. In the absence of service-related databases, it was not possible to obtain any indicator other than the most basic one—the number of services per settlement. Analysing the provision and accessibility of services at the municipal level would not be useful, as there are significant differences between settlement types within many local government units. A major shortcoming of the Zagreb region in the context of public transport research is the lack of integrated timetable information, in particular through GTFS data, which currently only exist for a single company providing public transport services.
The next research steps should include the validation of the identified settlement types and an expansion of knowledge on whether there are differences in service demand between different settlement types. This would provide valuable insights into how residents and service providers perceive the quantity, quality and accessibility of services available in their settlements or local administrative units.
Author Contributions
Conceptualization, I.Š. and A.L.; methodology, I.Š. and A.L.; software, I.Š.; validation, I.Š. and A.L.; formal analysis, I.Š.; investigation, I.Š.; resources, I.Š.; data curation, I.Š.; writing—original draft preparation, I.Š. and A.L.; writing—review and editing, I.Š. and A.L.; visualization, I.Š.; supervision, A.L.; project administration, A.L.; funding acquisition, A.L. All authors have read and agreed to the published version of the manuscript.
Funding
This research was funded by the University of Zagreb, scientific research grant 108-F23-00008.
Data Availability Statement
Dataset available on request from the authors.
Conflicts of Interest
The authors declare no conflicts of interest.
References
- Christaller, W. Die Zentralen Orte in Süddeutschland: Eine Ökonomisch-Geographische Untersuchung über die Gesetzmäßigkeit der Verbreitung und Entwicklung der Siedlungen mit Städtischen Funktionen, 3rd ed.; unveränd. Aufl., reprograf. Nachdr. d. 1. Aufl., Jena 1933; Wissenschaftliche Buchgesellschaft: Darmstadt, Germany, 1980; ISBN 978-3-534-04466-5. [Google Scholar]
- Moseley, M.J. Accessibility: The Rural Challenge; Methuen: London, UK, 1979; ISBN 978-0-416-71220-9. [Google Scholar]
- Moseley, M.J. England’s Village Services in the Late 1990s: Entrepreneurialism, Community Involvement and the State. Town Plan. Rev. 2000, 71, 415–433. [Google Scholar] [CrossRef]
- Blotevogel, H.H. Zentrale Orte: Zur Karriere Und Krise Eines Konzepts in Geographie Und Raumplanung. ERDKUNDE 1996, 50, 9–25. [Google Scholar] [CrossRef]
- Higgs, G.; White, S.D. Changes in Service Provision in Rural Areas. Part 1: The Use of GIS in Analysing Accessibility to Services in Rural Deprivation Research. J. Rural Stud. 1997, 13, 441–450. [Google Scholar] [CrossRef]
- Stiens, G.; Pick, D. Die Zentrale-Orte-Systeme Der Bundesländer. Raumforsch. Raumordn. Spat. Res. Plan. 1998, 56, 421–434. [Google Scholar] [CrossRef]
- Charter of Fundamental Rights of the European Union (2000/C 364/01). Available online: https://www.europarl.europa.eu/charter/pdf/text_en.pdf (accessed on 4 December 2024).
- Communication from the Commission to the European Parliament, the Council, the European Economic and Social Committee and the Committee of the Regions—The European Pillar of Social Rights Action Plan {SWD(2021) 46 Final}. Available online: https://eur-lex.europa.eu/legal-content/EN/TXT/HTML/?uri=CELEX:52021DC0102 (accessed on 4 December 2024).
- Humer, A.; Palma, P. The Provision of Services of General Interest in Europe: Regional Indices and Types Explained by Socio-Economic and Territorial Conditions. Eur. XXI 2013, 23, 85–104. [Google Scholar] [CrossRef]
- Humer, A. Services of General Interest in der EU-Räumliche und Raumpolitische Dimensionen; PhD Series; InPlanning: Groningen, The Netherlands, 2016. [Google Scholar]
- Ortega-Reig, M.; Schürmann, C.; Ferrandis Martínez, A.; Copus, A. Measuring Access to Services of General Interest as a Diagnostic Tool to Identify Well-Being Disparities between Rural Areas in Europe. Land 2023, 12, 1049. [Google Scholar] [CrossRef]
- Kompil, M.; Jacobs-Crisioni, C.; Dijkstra, L.; Lavalle, C. Mapping Accessibility to Generic Services in Europe: A Market-Potential Based Approach. Sustain. Cities Soc. 2019, 47, 101372. [Google Scholar] [CrossRef]
- Sá Marques, T.; Saraiva, M.; Ribeiro, D.; Amante, A.; Silva, D.; Melo, P. Accessibility to Services of General Interest in Polycentric Urban System Planning: The Case of Portugal. Eur. Plan. Stud. 2020, 28, 1068–1094. [Google Scholar] [CrossRef]
- Wiśniewski, R.; Stępniak, M.; Szejgiec-Kolenda, B. Accessibility of Public Services in the Age of Ageing and Shrinking Population: Are Regions Following Trends. Geogr. Ann. Ser. B Hum. Geogr. 2021, 103, 55–74. [Google Scholar] [CrossRef]
- Świątek, D.; Komornicki, T.; Piotr, S. Services of General Interest: Empirical Evidence from Case Studies of SeGI Project. Eur. XXI 2013, 23, 105–129. [Google Scholar] [CrossRef]
- Heffner, K.; Twardzik, M. The Impact of Shopping Centers in Rural Areas and Small Towns in the Outer Metropolitan Zone (The Example of the Silesian Voivodeship). Eur. Countrys 2015, 7, 87–100. [Google Scholar] [CrossRef]
- Christiaanse, S. Rural Facility Decline: A Longitudinal Accessibility Analysis Questioning the Focus of Dutch Depopulation-Policy. Appl. Geogr. 2020, 121, 102251. [Google Scholar] [CrossRef]
- Cedering, M.; Wihlborg, E. Village Schools as a Hub in the Community-A Time-Geographical Analysis of the Closing of Two Rural Schools in Southern Sweden. J. Rural Stud. 2020, 80, 606–617. [Google Scholar] [CrossRef]
- Lehtonen, O. Primary School Closures and Population Development–Is School Vitality an Investment in the Attractiveness of the (Rural) Communities or Not? J. Rural Stud. 2021, 82, 138–147. [Google Scholar] [CrossRef]
- Haartsen, T.; Gieling, J. Dealing with the Loss of the Village Supermarket: The Perceived Effects Two Years after Closure. Sociol. Rural. 2021, 61, 561–577. [Google Scholar] [CrossRef]
- Velaga, N.R.; Beecroft, M.; Nelson, J.D.; Corsar, D.; Edwards, P. Transport Poverty Meets the Digital Divide: Accessibility and Connectivity in Rural Communities. J. Transp. Geogr. 2012, 21, 102–112. [Google Scholar] [CrossRef]
- ESPON ESCAPE. European Shrinking Rural Areas: Challenges, Actions and Perspectives for Territorial Governance (Final Report); ESPON EGTC: Luxembourg, 2020. [Google Scholar]
- Hermelin, B. The Urbanization and Suburbanization of the Service Economy: Producer Services and Specialization in Stockholm. Geogr. Ann. Ser. B Hum. Geogr. 2007, 89, 59–74. [Google Scholar] [CrossRef]
- Jonas, A.E.G.; While, A.H.; Gibbs, D.C. Managing Infrastructural and Service Demands in New Economic Spaces: The New Territorial Politics of Collective Provision. Reg. Stud. 2010, 44, 183–200. [Google Scholar] [CrossRef]
- Turok, I. Limits to the Mega-City Region: Conflicting Local and Regional Needs. Reg. Stud. 2009, 43, 845–862. [Google Scholar] [CrossRef]
- Eurostat Glossary: Functional Urban Area. Available online: https://ec.europa.eu/eurostat/statistics-explained/index.php?title=Glossary:Functional_urban_area (accessed on 12 November 2024).
- ESPON. PROFECY–Processes, Features and Cycles of Inner Peripheries in Europe (Inner Peripheries: National Territories Facing Challenges of Access to Basic Services of General Interest)-Final Report; ESPON EGTC: Luxembourg, 2017. [Google Scholar]
- Mercier, A.; Souche-Le Corvec, S.; Ovtracht, N. Measure of Accessibility to Postal Services in France: A Potential Spatial Accessibility Approach Applied in an Urban Region. Pap. Reg. Sci. 2021, 100, 227–249. [Google Scholar] [CrossRef]
- Clifton, J.; Díaz-Fuentes, D.; Fernández-Gutiérrez, M. Public Infrastructure Services in the European Union: Challenges for Territorial Cohesion. Reg. Stud. 2016, 50, 358–373. [Google Scholar] [CrossRef]
- Milstein, A. Daseinsvorsorge. In Handwörterbuch der Stadt-und Raumentwicklung; Blotevogel, H.-H., Ed.; ARL–Akademie für Raumforschung und Landesplanung: Hannover, Germany, 2018; pp. 361–373. [Google Scholar]
- Neu, C. Handbuch Daseinsvorsorge: Ein Überblick aus Forschung und Praxis; VKU Verlag: Berlin, Germany, 2022. [Google Scholar]
- Humer, A. Dienste und Infrastrukturen der Daseinsvorsorge im Europäischen Kontext. In Handbuch Daseinsvorsorge: Ein Überblick aus Forschung und Praxis; Neu, C., Ed.; VKU Verlag: Berlin, Germany, 2022; pp. 26–35. [Google Scholar]
- Littke, H.; Rauhut, D. Minimum Levels of Services of General Interest: What Fundamental Rights Do Individuals and Enterprises Have? Eur. XXI 2013, 23, 47–68. [Google Scholar] [CrossRef]
- EUR-Lex. Green Paper on Services of General Interest/*COM/2003/0270 Final. Available online: https://eur-lex.europa.eu/legal-content/EN/TXT/?uri=celex%3A52003DC0270 (accessed on 4 December 2024).
- Communication from the Commission to the European Parliament, the Council, the European Economic and Social Committee and the Committee of the Regions—White Paper on Services of General Interest/COM/2004/0374 Final. Available online: https://eur-lex.europa.eu/legal-content/EN/TXT/?uri=celex%3A52004DC0374 (accessed on 4 December 2024).
- Marques da Costa, E.; Palma, P.; Rauhut, D.; Humer, A.; Constantin, D.; Velasco Echeverria, X. What Indicators to Use When Measuring Services of General Interest? Eur. XXI 2013, 23, 7–28. [Google Scholar] [CrossRef]
- Rawls, J. A Theory of Justice: Original Edition; Harvard University Press: Cambridge, MA, USA, 2005; ISBN 978-0-674-04260-5. [Google Scholar]
- Soja, E.W. Seeking Spatial Justice; Globalization and Community; University of Minnesota Press: Minneapolis, MN, USA, 2010; ISBN 978-0-8166-6668-3. [Google Scholar]
- Miosga, M. Räumliche Gerechtigkeit. In Handbuch Daseinsvorsorge: Ein Überblick aus Forschung und Praxis; Neu, C., Ed.; VKU Verlag: Berlin, Germany, 2022; pp. 60–67. [Google Scholar]
- Kriisk, K.; Minas, R. Social Rights and Spatial Access to Local Social Services: The Role of Structural Conditions in Access to Local Social Services in Estonia. Soc. Work. Soc. Int. Online J. 2018, 15, 1–18. [Google Scholar]
- Sen, A. Inequality Reexamined, 1st ed.; Oxford University Press: Oxford, UK, 1995; ISBN 978-0-19-828928-9. [Google Scholar]
- Martens, K.; Golub, A.; Robinson, G. A Justice-Theoretic Approach to the Distribution of Transportation Benefits: Implications for Transportation Planning Practice in the United States. Transp. Res. Part Policy Pract. 2012, 46, 684–695. [Google Scholar] [CrossRef]
- Schneider, M. Spatial Justice Angesichts Abgehängter Regionen. In Stadtluft Macht Reich/Arm: Stadtentwicklung, Soziale Ungleichheit und Raumgerechtigkeit; Edmunds, B., Czignon, C., Wolff, M., Eds.; Metropolis Verlag: Marburg, Germany, 2018; pp. 221–245. [Google Scholar]
- Terfrüchte, T.; Flex, F. Central Place. In Handwörterbuch der Stadt-und Raumentwicklung; Akademie für Raumforschung und Landesplanung: Hannover, Germany, 2018; pp. 2969–2979. [Google Scholar]
- Mulligan, G.F.; Partridge, M.D.; Carruthers, J.I. Central Place Theory and Its Reemergence in Regional Science. Ann. Reg. Sci. 2012, 48, 405–431. [Google Scholar] [CrossRef]
- Deiters, J. Ist Das Zentrale-Orte-System Als Raumordnungskonzept Noch Zeitgemäß? ERDKUNDE 1996, 50, 26–34. [Google Scholar] [CrossRef]
- Giese, E. Die Einzelhandelszentralität Westdeutscher Städte: Ein Beitrag zur Methodik der Zentralitätsmessung. ERDKUNDE 1996, 50, 46–59. [Google Scholar] [CrossRef]
- Terfrüchte, T.; Greiving, S.; Flex, F. Empirische Fundierung von Zentrale-Orte-Konzepten—Vorschlag für ein Idealtypisches Vorgehen. Raumforsch. Raumordn. Spat. Res. Plan. 2017, 75, 471–485. [Google Scholar] [CrossRef]
- Deiters, J. Von der Zentralitätsforschung zur geographischen Handelsforschung—Neuorientierung oder Paradigmenwechsel in der Wirtschafts- und Sozialgeographie? Erde 2006, 137, 293–317. [Google Scholar]
- Breuer, I.M.; Milbert, A. Services of General Interest Indicators: Methodological Aspects and Findings. Eur. XXI 2013, 23, 29–46. [Google Scholar] [CrossRef]
- Yin, P. Urban–Rural Inequalities in Spatial Accessibility to Prenatal Care: A GIS Analysis of Georgia, USA, 2000–2010. GeoJournal 2019, 84, 671–683. [Google Scholar] [CrossRef]
- Neumeier, S.; Kokorsch, M. Supermarket and Discounter Accessibility in Rural Germany–Identifying Food Deserts Using a GIS Accessibility Model. J. Rural Stud. 2021, 86, 247–261. [Google Scholar] [CrossRef]
- Baudet-Michel, S.; Chouraqui, J.; Conti, B.; Guiraud, N.; Le Neindre, C.; Toutin, G. The Shrinkage of Justice and Hospital Facilities in Small French Cities (2000–2016). Geogr. Ann. Ser. B Hum. Geogr. 2021, 103, 253–275. [Google Scholar] [CrossRef]
- Higgs, G.; Langford, M.; Norman, P. Accessibility to Sport Facilities in Wales: A GIS-Based Analysis of Socio-Economic Variations in Provision. Geoforum 2015, 62, 105–120. [Google Scholar] [CrossRef]
- Langford, M.; Higgs, G. Accessibility and Public Service Provision: Evaluating the Impacts of the Post Office Network Change Programme in the UK. Trans. Inst. Br. Geogr. 2010, 35, 585–601. [Google Scholar] [CrossRef]
- Higgs, G.; Price, A.; Langford, M. Investigating the Impact of Bank Branch Closures on Access to Financial Services in the Early Stages of the COVID-19 Pandemic. J. Rural Stud. 2022, 95, 1–14. [Google Scholar] [CrossRef] [PubMed]
- Kostanjšek, B.; Marot, N. The Current Challenges and Future Alternatives of Supplying Remote Areas with Basic Goods: The Case Study of Idrijsko-Cerkljansko Region, Slovenia. Eur. Countrys 2021, 13, 130–152. [Google Scholar] [CrossRef]
- Neumeier, S. Accessibility to Services in Rural Areas: The Example of Petrol Service Provision in Germany. DISP Plan. Rev. 2016, 52, 32–49. [Google Scholar] [CrossRef]
- Mager, C.; Wagner, M. Kulturelle Infrastrukturen in Deutschen Klein- Und Mittelstädten. Eine Typisierung Der Standortgemeinschaften von Einrichtungen Der Kulturellen Daseinsvorsorge. Raumforsch. Raumordn. Spat. Res. Plan. 2022, 80, 379–396. [Google Scholar] [CrossRef]
- van Wee, B. Accessible Accessibility Research Challenges. J. Transp. Geogr. 2016, 51, 9–16. [Google Scholar] [CrossRef]
- Geurs, K.T.; van Wee, B. Accessibility Evaluation of Land-Use and Transport Strategies: Review and Research Directions. J. Transp. Geogr. 2004, 12, 127–140. [Google Scholar] [CrossRef]
- McGrail, M.R. Spatial Accessibility of Primary Health Care Utilising the Two Step Floating Catchment Area Method: An Assessment of Recent Improvements. Int. J. Health Geogr. 2012, 11, 50. [Google Scholar] [CrossRef]
- McGrail, M.R.; Humphreys, J.S. Measuring Spatial Accessibility to Primary Health Care Services: Utilising Dynamic Catchment Sizes. Appl. Geogr. 2014, 54, 182–188. [Google Scholar] [CrossRef]
- Neumeier, S. Accessibility of COVID-19 Vaccination Centers in Germany via Different Means of Transport. KN-J. Cartogr. Geogr. Inf. 2022, 72, 41–58. [Google Scholar] [CrossRef]
- Haynes, R.; Lovett, A.; Sünnenberg, G. Potential Accessibility, Travel Time, and Consumer Choice: Geographical Variations in General Medical Practice Registrations in Eastern England. Environ. Plan. Econ. Space 2003, 35, 1733–1750. [Google Scholar] [CrossRef]
- Apparicio, P.; Gelb, J.; Dubé, A.-S.; Kingham, S.; Gauvin, L.; Robitaille, É. The Approaches to Measuring the Potential Spatial Access to Urban Health Services Revisited: Distance Types and Aggregation-Error Issues. Int. J. Health Geogr. 2017, 16, 32. [Google Scholar] [CrossRef] [PubMed]
- Luo, W. Using a GIS-Based Floating Catchment Method to Assess Areas with Shortage of Physicians. Health Place 2004, 10, 1–11. [Google Scholar] [CrossRef]
- Stępniak, M.; Rosik, P. Accessibility of Services of General Interest at Regional Scale. Eur. XXI 2013, 23, 131–147. [Google Scholar] [CrossRef]
- Vaishar, A.; Šťastná, M. Accessibility of Services in Rural Areas: Southern Moravia Case Study. Sustainability 2021, 13, 9103. [Google Scholar] [CrossRef]
- Lechowski, Ł.; Jasion, A. Spatial Accessibility of Primary Health Care in Rural Areas in Poland. Int. J. Environ. Res. Public. Health 2021, 18, 9282. [Google Scholar] [CrossRef] [PubMed]
- Malý, J. Questioning Territorial Cohesion: (Un)Equal Access to Services of General Interest. Pap. Reg. Sci. 2018, 97, 323–344. [Google Scholar] [CrossRef]
- Breuer, I.M.; Milbert, A.; Foss, O.; Humer, A.; Palma, P.; Rosik, P.; Stepniak, M.; Velasco, X. European Atlas of Services of General Interest; Breuer, I.M., Smith, C., Eds.; Bundesinst f. Bau-, Stadt- u Regionalforschung (BBSR) im Bundesamt f. Bauwesen u. Raumordnung (BBR): Bonn, Germany, 2013; ISBN 978-3-87994-791-1. [Google Scholar]
- Central Bureau of Statistics Census of Population, Households and Dwellings. Results 2021. Available online: https://dzs.gov.hr/u-fokusu/popis-2021/popisni-upitnik/english/results/1501 (accessed on 4 November 2024).
- van den Berg, L.; Drewett, R.; Klaassen, L.H.; Rossi, A.; Vijverberg, C.H.T. Stages of Urban Development. In A Study of Growth and Decline; van den Berg, L., Drewett, R., Klaassen, L.H., Rossi, A., Vijverberg, C.H.T., Eds.; Elsevier: Amsterdam, The Netherlands, 1982; pp. 24–45. ISBN 978-0-08-023156-3. [Google Scholar]
- Humer, A.; Cardoso, R.V.; Meijers, E. Breaking with the Spatial-Cycle Model: The Shift towards ‘Syncurbanization’ in Polycentric Urban Regions. Reg. Stud. 2022, 56, 21–35. [Google Scholar] [CrossRef]
- Neuaufstellung des Zentrale-Orte-Konzepts in Nordrhein-Westfalen; Greiving, S., Flex, F., Eds.; Arbeitsberichte der ARL 17; ARL Akademie für Raumforschung und Landesplanung, Leibniz-Forum für Raumwissenschaften: Hannover, Germany, 2016; ISBN 978-3-88838-403-5. [Google Scholar]
- Dale, B.; Sjøholt, P. The Changing Structure of the Central Place System in Trøndelag, Norway, over the Past 40 Years—Viewed in the Light of Old and Recent Theories and Trends. Geogr. Ann. Ser. B Hum. Geogr. 2007, 89, 13–30. [Google Scholar] [CrossRef]
- Milbert, A.; Breuer, I.M.; Rosik, P.; Stępniak, M.; Velasco, X. Accessiblity of Services of General Interest in Europe. Rom. J. Reg. Sci. 2013, 7, 37–65. [Google Scholar]
- Wang, H.; Qiu, F.; Swallow, B. Can Community Gardens and Farmers’ Markets Relieve Food Desert Problems? A Study of Edmonton, Canada. Appl. Geogr. 2014, 55, 127–137. [Google Scholar] [CrossRef]
- Neumeier, S. Street Petrol Station Shops as an Alternative to Missing Local Food Suppliers–Contribution to the German Discourse on ‘Daseinsvorsorge’: A German View. Appl. Geogr. 2015, 60, 150–164. [Google Scholar] [CrossRef]
- Burger, M.J.; Meijers, E.J.; Hoogerbrugge, M.M.; Tresserra, J.M. Borrowed Size, Agglomeration Shadows and Cultural Amenities in North-West Europe. Eur. Plan. Stud. 2015, 23, 1090–1109. [Google Scholar] [CrossRef]
- Bauchinger, L.; Reichenberger, A.; Goodwin-Hawkins, B.; Kobal, J.; Hrabar, M.; Oedl-Wieser, T. Developing Sustainable and Flexible Rural-Urban Connectivity through Complementary Mobility Services. Sustainability 2021, 13, 1280. [Google Scholar] [CrossRef]
- Moreno, C.; Allam, Z.; Chabaud, D.; Gall, C.; Pratlong, F. Introducing the “15-Minute City”: Sustainability, Resilience and Place Identity in Future Post-Pandemic Cities. Smart Cities 2021, 4, 93–111. [Google Scholar] [CrossRef]
- Hidayati, I.; Tan, W.; Yamu, C. Conceptualizing Mobility Inequality: Mobility and Accessibility for the Marginalized. J. Plan. Lit. 2021, 36, 492–507. [Google Scholar] [CrossRef]
- Evers, D.; Katurić, I.; van der Wouden, R. Urbanization in Europe: Past Developments and Pathways to a Sustainable Future; Sustainable Urban Futures; Springer International Publishing: Cham, Switzerland, 2024; ISBN 978-3-031-62260-1. [Google Scholar]
- Evers, D.; Katurić, I.; van der Wouden, R.; van Schie, M.; van Rijn, F. ESPON SUPER Final Report Annex 4—Sustainability Assessment and Scenarios; ESPON: Luxembourg, 2020. [Google Scholar]
Disclaimer/Publisher’s Note: The statements, opinions and data contained in all publications are solely those of the individual author(s) and contributor(s) and not of MDPI and/or the editor(s). MDPI and/or the editor(s) disclaim responsibility for any injury to people or property resulting from any ideas, methods, instructions or products referred to in the content. |
© 2025 by the authors. Licensee MDPI, Basel, Switzerland. This article is an open access article distributed under the terms and conditions of the Creative Commons Attribution (CC BY) license (https://creativecommons.org/licenses/by/4.0/).