Abstract
With the progression of global urbanization, UGS greenery plays an increasingly important role in encouraging engagement in various health-related activities among sedentary residents, and its quality improvement is widely recognized as a promising strategy for achieving public health benefits. However, existing studies have not reached an agreement on the associations between UGS greenery and engagement in health-related activities, largely due to limited dimensions of greenery measurement and insufficient evidence on health-related activities. To address these gaps, this study proposes a holistic analytical framework that integrates multi-dimensional greenery measurements (measured by the NDVI, GVI, and LVV metrics) with systematic observations of engagement in physical activity and social interaction across the general population, children, and seniors, allowing for a more comprehensive understanding of their varied associations. Conducting empirical research in the Xuanwu Lake Scenic Area, the results showed that (1) UGS greenery had stronger explanatory power for activity participant numbers than activity intensity across age groups; (2) top–down greenery (NDVI) was positively associated with engagement in health-related activities (although not statistically significant), while excessive eye-level (GVI) and spatial greenery (LVV) demonstrated negative effects; (3) UGS greenery alone did not sufficiently predict children’s engagement in health-related activities; and (4) greenery conditions in adjacent UGS samples also significantly impacted local health-related activities. These findings suggest that UGS greenery measured from a single dimension may not reliably predict engagement in health-related activities across age groups, thereby calling for balanced and context-sensitive greenery design in future UGS planning to support inclusive public health.
1. Introduction
1.1. UGS and Public Health
With worldwide urbanization, more than half of people have settled in high-density urban areas [1]. This trend has been accompanied by prevailing sedentary lifestyles, with the majority of urban residents lacking sufficient engagement in healthy activities [2], which has raised significant public health concerns [3,4,5]. The role of Urban Green Spaces (UGSs) in addressing related health issues has gained growing recognition [6,7]. In addition to the direct health benefits of exposure to UGSs [8,9,10,11], evidence from various disciplines has confirmed another crucial health pathway of UGSs, mediated by encouraging people to participate in various health-related activities [3,12,13,14,15,16,17]. In the post-pandemic period, UGSs have continued to play a vital role in promoting public health by helping to mitigate the long-term impacts of lockdowns, such as physical inactivity and mental health challenges [18,19,20,21]. Recent statistics indicate that residents’ visitation patterns to UGSs have witnessed significant changes, particularly among children and seniors, who are vulnerable populations in terms of equitable access to UGS resources [22,23,24,25]. For instance, a study conducted in the metropolitan area of Vienna, Austria found that while young people reconnected with nature and increased the time that they spent outdoors, older urban residents reduced the time that they spent in UGSs on average [25]. This highlights the need for UGS planning strategies that actively promote inclusive visitation. However, merely increasing the amount and accessibility of UGSs was found to be insufficient in encouraging urban residents to engage in health-related activities [11,26,27]. In response, increasing numbers of urban planners and policy-makers have recognized that enhancing the greenery quality of existing UGSs presents a more efficient and sustainable strategy for achieving their associated health benefits [28,29,30,31].
1.2. Dimensions of UGS Greenery Measurement
With increasing attention to the health benefits of UGS greenery, it has typically been measured through two primary dimensions: the top–down dimension, and the eye-level dimension [32,33]. The Normalized Difference Vegetation Index (NDVI) is the most common and accessible metric for measuring UGS greenery from the top–down dimension [30,34], as it is available worldwide based on satellite images to reflect the vegetation coverage and living status [35,36]. For measuring eye-level dimension greenery, the Green View Index (GVI) metric is commonly applied to assess the visibility of upper and lower greenery from a pedestrian perspective [37,38]. Through field surveys and photograph interpretation, the GVI captures vertical forms of greenery, such as lawns, shrubs, trees, green walls, etc. [39,40]. However, the NDVI and GVI metrics are inherently constrained by fixed observation angles [35,36,41,42]. To overcome this limitation, recent studies gvhave proposed the Living Vegetation Volume (LVV) metric, which leverages terrestrial laser scanning or airborne remote sensing to measure greenery from a spatial dimension, thereby enabling more flexible and multidirectional observation angles, showing great potential for spatial greenery measurement [43,44,45]. Moreover, LVV may better align with visitors’ perceptions of UGS greenery [14,46]. Nevertheless, more empirical evidence is needed to validate its effectiveness in research on UGS–health relationships [46].
Despite these advancements in individual measurement dimensions, studies integrating multiple dimensions of UGS greenery are limited, and the associations between UGS greenery and engagement in health-related activities are yet to be clearly established [14,31,37,47]. Several studies have reported that UGS greenery measured by the GVI was positively associated with health activities [37,48], whereas other studies found no significant relationship when using the NDVI for greenery measurement [42,49]. This discrepancy may be due to the different greenery characteristics that each metric captures—the NDVI is more sensitive to horizontal canopy cover, whereas the GVI primarily reflects vertical visibility [50,51,52]. Moreover, inconsistencies persist even within studies from the same measurement dimension [14,35,41,42], implying the need for an integrated framework that combines top–down, eye-level, and spatial dimensions to comprehensively examine the associations between UGS greenery and engagement in health-related activities.
1.3. Evidence on Engagement in Health-Related Activities
Additionally, the limited and incomplete evidence on engagement in health-related activities also hinders the establishment of a consensus on UGS–health associations. Existing studies have predominantly focused on physical activity [37,42,48,49], while another prevalent activity within UGSs, social interaction, has received comparatively less attention [16,26,53]. Preliminary findings suggest that engaging in social interaction can also contribute to public health in UGS settings [54,55,56]. Beyond the general population, an increasing number of studies have begun to specifically investigate the activity patterns of children or seniors, highlighting that engagement in health-related activities varies across age groups [14,54,57,58,59,60]. However, few studies have adopted a holistic approach by simultaneously examining engagement in health-related activities across all age groups.
In terms of data collection, most studies rely on questionnaires to assess engagement in health-related activities [47,48,49], which typically fail to capture all concurrent participants and are prone to subjective bias due to their reliance on self-reported preferences. Although some studies have also employed objective sensor devices, such as accelerometers and GPS trackers, to record participants’ movement, their high costs make them less feasible for large-scale studies [59,61,62]. Additionally, systematic observational tools such as the System for Observing Play and Recreation in Communities (SOPARC) and Systematically Observing Social Interaction in Parks (SOSIP) offer promising alternatives for collecting comprehensive evidence on engagement in health-related activities in UGS–health research. By adopting a third-person perspective to comprehensively scan UGSs, these tools can capture both physical activity and social interaction across various age groups, providing a more objective and inclusive understanding of engagement in health-related activities in UGSs [53,63].
1.4. Research Objectives
Based on the above literature review, three main gaps were identified: First, existing studies have not sufficiently integrated multiple measurement dimensions of UGS greenery. Second, prior research on engagement in health-related activities in UGSs has primarily focused on physical activity or a specific age group, with limited consideration of social interaction and inclusive participation across all age groups. Moreover, the commonly used data collection methods also compromise the reliability and comprehensiveness of the evidence on engagement in health-related activities in UGSs. Third, as a result of the above limitations, the associations between UGS greenery and engagement in health-related activities remain unclear and inconclusive.
To address these research gaps, this study aims to (1) integrate top–down (using the NDVI metric), eye-level (using the GVI metric), and spatial (using the LVV metric) dimensions to comprehensively measure UGS greenery; (2) employ systematic observational tools (the SOPARC and SOSIP) to objectively capture both physical activity and social interaction across all age groups, thereby offering a holistic perspective on engagement in health-related activities in UGSs; and (3) explore the associations between multi-dimensional greenery measurement and multi-age health-related activities, thereby informing effective planning strategies to improve the quality of UGS greenery for promoting inclusive public health.
2. Materials and Methods
2.1. Study Settings and Sample
This study was conducted in the Xuanwu Lake Scenic Area, which is the biggest park cluster in the central built-up area of Nanjing, China, supporting an active lifestyle for local residents as well as tourists. This scenic area covers an area of 5.02 km2, and 35 urban parks from it were selected as the UGS samples, based on a previous on-site survey (Figure 1). These selected UGS samples included the gamut of greenery forms, such as lawns, street trees, flower beds, green walls, etc. Accordingly, the study conducted using these UGS samples is representative.
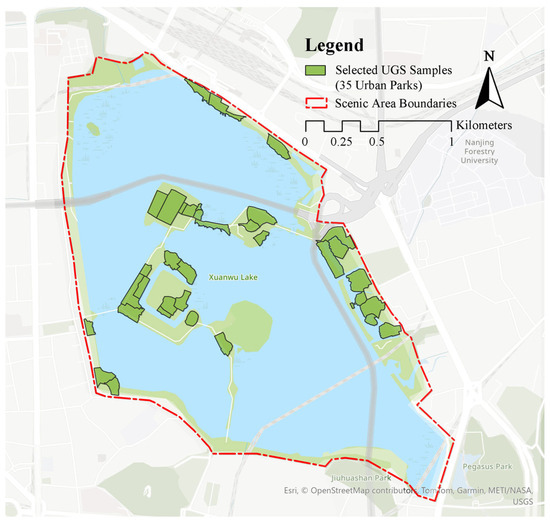
Figure 1.
Distribution of UGS samples in Xuanwu Lake Scenic Area.
2.2. Measuring UGS Greenery from Multiple Dimensions
According to our research objectives, the UGS greenery was measured by multi-dimensional metrics, including the NDVI from the top–down dimension, the GVI from the eye-level dimension, and LVV from the three-dimensional perspective (Figure 2). With the approval of the Nanjing Forestry University Institutional Review Board, the measurement fieldwork was carried out in the summer months of June to July, so as to avoid the significant variations in greenery across different seasons [64].
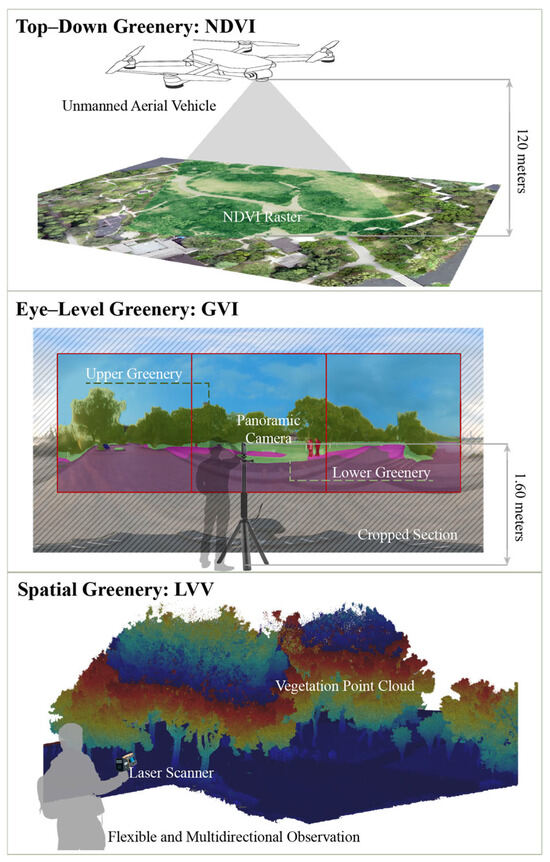
Figure 2.
Greenery measurement process utilizing multi-dimensional metrics.
2.2.1. Top–Down Greenery Measurement Using the NDVI
While the NDVI is typically measured based on satellite images, Unmanned Aerial Vehicle (UAV) remote sensing technology made it more convenient to obtain the high-resolution images at fine scales [65,66,67]. This study utilized UAV-based images from a height of 120 m to calculate the NDVI metric, and the formula is as follows [68]:
where represents the pixel values from the near-infrared band (which vegetation strongly reflects), while represents the pixel values from the red band (which vegetation absorbs). The NDVI values were computed and distributed to each UGS sample using ArcGIS Pro software (version 3.0.1).
2.2.2. Eye-Level Greenery Measurement Using the GVI
This study measured the GVI based on panoramic images taken from a height of 1.6 m in the UGS samples [69]. The outside portion of the panoramic images was cropped out because of severe distortion caused by the camera lens [70], and the center portion was consistent with the view of a pedestrian in the UGS [37,71,72]. This study employed a deep learning algorithm (DeepLabv3, based on the Cityscapes dataset) to facilitate the measurement process by automatically identifying greenery elements, including both upper and lower greenery [73,74]. Accordingly, the GVI can be calculated as follows [37,38]:
where is the sum of the upper and lower greenery, while is the number of pixels in the center portion of a panoramic image. For each UGS sample, the GVI was determined by averaging all of the panoramic images that it contained.
2.2.3. Spatial Greenery Measurement Using LVV
We applied a terrestrial laser scanner (GEO SLAM ZEB-HORIZON) to collect the point cloud data, capturing the spatial information of the UGS samples [44]. Based on these data, we applied a combination of automated classification and manual processing in Trimble RealWorks software (Version 12.0) to accurately segment the vegetation point clouds [43]. The segmented data were then voxelized in Grasshopper (Version 6.0) to calculate the LVV values, using a voxel cell size of 0.3 m × 0.3 m × 0.3 m [75].
2.3. Capturing Engagement in Health-Related Activities Across All Age Groups
Two types of health-related activities in the UGS samples, including physical activity (PA) and social interaction (SI), were captured via systematic observational tools: the System for Observing Play and Recreation in Communities (SOPARC), and Systematically Observing Social Interaction in Parks (SOSIP) [53,76]. Using the SOPARC and SOSIP, both the number of participants and their corresponding activity levels for all targeted populations (general population, children, and seniors) were captured through systematic observation. The intensity of PA and SI was quantified by multiplying the number of participants by their respective activity levels. Simultaneously, the field videos were recorded for verification of the on-site observations. To minimize measurement bias caused by random variability, we conducted a total of 16 observations under varying weather conditions, on both weekdays and weekends, and during both morning and afternoon periods, and the date of each measurement was recorded for further analysis [77].
2.4. Statistical Analysis
This study fitted a series of regression models to examine the associations between UGS greenery and engagement in health-related activities. The independent variables (IVs) included multi-dimensional greenery measurement based on the NDVI, GVI, and LVV metrics. The dependent variables (DVs) comprised the intensity of PA and SI among the general population, children, and seniors. In addition, the total number of participants in PA and SI were also considered as DVs. Park size was included as a control variable (CV) in the regressions, given its positive contribution to engagement in health-related activities [54,78]. Spearman correlation analysis was conducted to assess the relationships between each DV and the CV, aiming to detect potential multicollinearity. To account for the data characteristics, the Generalized Linear Model (GLM) with a negative binomial distribution was employed to fit the regression models [79].
Before the formal GLM analysis, this study preliminarily tested the variations in multi-age health-related activities across dates using analysis of variance (ANOVA), and we compared the performance of the GLM with and without the data as random terms through likelihood ratio tests (LRTs). Based on this, this study determined whether the unobserved factors across measurement dates need to be controlled for when establishing models [80].
The UGS samples in this study were from the same scenic area, and the measurement results may have been influenced by their spatial adjacency, meaning that adjacent UGS samples may be more similar than distant ones in terms of engagement in health-related activities [81,82]. This study analyzed the residuals of the regression model using Moran’s I to test the potential spatial autocorrelation and decide whether the spatial lag term (using the k-nearest neighbors approach with k = 4, where all of the neighbors are equally weighted) should be included when establishing regression models. The GLM analysis and tests can be conducted using the glmmTMB, lmtest, and spdep packages in R (version 4,4.0) [83,84,85].
3. Results
3.1. Sample Characteristics
Table 1 depicts the sample characteristics of all variables, including the mean, standard deviation (SD), coefficient of variation (CoV), and range. To account for the multi-dimensional nature of the variables, we standardized the DVs and CV to the same scale through min–max normalization. This standardization ensured comparability across variables with different measurement units and value ranges, reduced the influence of scale differences on the subsequent model estimation, and improved the robustness and interpretability of the regression results [86].

Table 1.
Descriptive statistics of the variables.
Table 2 depicts the Spearman correlation analysis results for the IVs and CV. The NDVI demonstrated a significantly positive correlation with both the GVI and LVV. LVV was also significantly and positively correlated with park size. These significant coefficients were around 0.5, indicating a moderate degree of correlation between related variables, which did not induce serious multicollinearity concerns in the regression analysis [87].
Table 2.
Correlation matrix for independent variables and control variable.
3.2. The Results of Preliminary Tests
As shown in Table 3, the ANOVA results indicated that, except for the intensity of children’s physical activity and children’s social interaction, all other DVs showed significant differences across the 16 measurements (p < 0.01), suggesting that unobserved factors influenced the measurement results of engagement in health-related activities. The LRT (Table 4) results further confirmed that excluding the intensity of children’s social interaction, along with controlling for unobserved factors by introducing the dates as a random term in the GLM, improved the model’s fit and explanatory power.
Table 3.
Summary of the ANOVA results of dependent variables.
Table 4.
Summary of the likelihood ratio test results.
The Moran’s I statistics for the residuals (Table 5) indicated significant spatial autocorrelation in the regression models (p < 0.001), except for the model for children’s physical activity levels. Accordingly, it was necessary to add the spatial lag in these spatially significant regression models to account for spatial dependencies and improve the models’ accuracy.
Table 5.
Summary of Moran’s I statistics for the residuals of LME.
3.3. Results of GLM Analysis
The coefficients of the GLM analysis shown in Table 6 and Table 7 demonstrate varied associations between the multi-dimensional measurements of UGS greenery and engagement in health-related activities across age groups.
Table 6.
GLM results for physical activity (PA).
Table 7.
GLM results for social interaction (SI).
Among the greenery metrics, the NDVI showed positive associations, while the GVI and LVV generally exhibited negative effects on engagement in health-related activities across age groups. The NDVI exhibited the weakest explanatory power, with a significant positive association observed only for the intensity of seniors’ physical activity (β = 0.636, p < 0.05). In contrast, the GVI showed a consistent and significant negative association with different types of engagement in health-related activities (e.g., β = −0.829 p < 0.01 for the number of physical activity participants; β = −0.998 p < 0.01 for the intensity of seniors’ social interaction). Regarding LVV, significant negative associations were observed for the number of physical activity participants (β = –0.440, p < 0.05), the number of social interaction participants (β = –0.484, p < 0.05), and the intensity of seniors’ physical activity (β = –1.216, p < 0.01).
In addition, park size served as a control variable, and its positive contributions to both the number of activity participants and the intensity of health-related activities were consistently confirmed across models (e.g., β = 0.560, p < 0.01 for the number of social interaction participants; β = 0.997, p < 0.05 for the intensity of seniors’ social interaction). The effects of spatial lag terms were significantly positive in all models except for the model of the intensity of children’s physical activity (e.g., β = 0.073, p < 0.01), highlighting the importance of the greenery in adjacent UGSs in affecting engagement in health-related activities.
4. Discussion
This study expands the UGS greenery measurement dimensions by combining two well-established dimensions (the top–down dimension, measured by the NDVI, and the eye-level dimension, measured by the GVI) with a newly introduced dimension (the spatial dimension, measured by LVV). Compared with other top–down metrics like land use and land cover, which are subject to variations in spatial resolution and vegetation classification [35], the NDVI offers a standardized and representative measure of vegetation growth conditions and distribution by differentiating the light bands that are reflected and absorbed by vegetation. Traditional NDVI data, derived from satellite imagery, are typically captured at a single point in time and updated annually or less frequently, potentially compromising accuracy in rapidly evolving UGS environments [35]. To overcome this, our study employed UAV-based remote sensing, which provides high-resolution and up-to-date NDVI data, offering practical advantages in UGS management and improvement [65,66,67].
For eye-level greenery measurement using the GVI metric, this study employed self-captured panoramic images and selected the least distorted sections aligned with pedestrians’ visual field [37,72]. Compared with traditional photos, panoramic images capture more on-site information with fewer shooting efforts [70]. Based on panoramic images, this study applied deep learning algorithms to automatically identify greenery elements, significantly reducing labor costs in the GVI measurement process [71,73,74,88]. Although an increasing number of studies have relied on panoramic images derived from online street map platforms (e.g., Google Street View, Baidu Street View), limitations in data availability and outdated images reduce their reliability for accurate greenery assessment [88,89]. Taking the Xuanwu Lake Scenic Area as an example, Google Street View images were only available in a few locations, while the coverage of Baidu Street View was mainly limited to the exterior driveway, with most images captured several years ago.
In addition, this study incorporated the LVV metric to capture spatial greenery, which is an emerging and underexplored dimension in UGS–health research. Given the limited empirical evidence on LVV’s role, this study provides additional insights and empirical support [14,46]. Unlike traditional two-dimensional metrics, such as the NDVI and GVI, which rely on a fixed observation perspective, LVV considers both horizontal and vertical observation of greenery, thereby reflecting more realistic greenery conditions in UGSs [44,46]. Moreover, the NDVI and GVI are subject to limitations in complex urban park environments, where factors such as building obstructions and heterogeneity of the greenery structure can compromise measurement accuracy [37,46,88]. We acknowledge that capturing LVV using technologies such as laser scanners involves high equipment and operational costs. However, its enhanced greenery measurement enables new possibilities for UGS–health analysis [14,46].
This study further holistically captured engagement in health-related activities by observing both physical activity and social interaction across different age groups. The intensity of health-related activities was recorded separately for the general population, children, and seniors. In the meantime, the number of participants engaged in each activity type was also recorded. This inclusive approach offers a more comprehensive understanding of age-diverse activity patterns and provides robust empirical evidence on engagement in health-related activities in UGSs.
On this basis, this study disentangles how multi-dimensional UGS greenery contributes to engagement in health-related activities, highlighting the importance of comprehensive greenery measurement as well as the variations across different types of health-related activities and age groups. In general, compared to the intensity of health-related activities, all dimensions of greenery measurement (using the NDVI, GVI, and LVV metrics) exhibited stronger explanatory power in accounting for the number of activity participants across different age groups, as verified in previous research [26,31]. This suggests that greenery has a more direct influence on whether people participate, rather than on how intensely they engage. This is likely because the intensity of such activities is influenced by more complex factors. For example, engaging in high-intensity physical activity often requires the availability of supportive facilities, such as sports courts or running tracks, while high-intensity social interaction may depend on conducive social settings, such as plazas suitable for dancing or seating areas that encourage conversation [13,21,54,90].
From an age-specific perspective, the associations between greenery and engagement in health-related activities were generally less robust for children compared to the general population and seniors. This may be attributable to the high variation observed in the intensity of children’s physical activity (CoV = 5.163) and social interaction (CoV = 4.545) across different UGS samples and observation dates. Compared with the influence of UGS greenery, children’s engagement in health-related activities is more likely shaped by family-related factors, school schedules, and the availability of parental or guardian supervision [91,92,93]. Moreover, previous studies have found that children tended to congregate in the areas with facilities and amenities specifically designed for them, such as playgrounds, sandpits, slides, etc., further reducing the predictive power of greenery alone in explaining their activity patterns [54,56,90]. In addition, the specific needs and vulnerabilities of each age group, such as seniors’ reliance on nearby and restorative spaces, or children’s need for stimulation and mobility, may also contribute to the varied associations across age groups [94]. Further age-specific research is needed to provide additional empirical evidence on these associations.
In contrast, greenery demonstrated stronger associations with engagement in health-related activities among the general population and seniors. These groups typically have greater autonomy in selecting their activity locations and tend to exhibit more stable outdoor routines, such as regular exercise and social gathering, which allows greenery to exert a more consistent influence on their activity patterns [21,63]. Compared with the general population, the strength of the associations between greenery and engagement in health-related activities was even greater among seniors, indicating that older adults are more sensitive to greenery [95,96]. This could be because seniors prefer the greenery-related spaces, such as shady trees, a peaceful and relaxed setting, and walking paths [21,60], while the general population engages in a wider range of health-related activities that may occur in various types of spaces, such as sports courts, skate areas, or pavement [26,54,97].
Among the greenery metrics, only the NDVI was positively associated with engagement in health-related activities, whereas the GVI and LVV demonstrated negative associations in this study. These negative associations can be interpreted in the light of previous findings on the inverted U-shaped relationship between eye-level greenery (GVI) and the walking propensity of older adults. L. Yang et al. identified a GVI threshold of 0.24, beyond which further increases in eye-level greenery started to demonstrate a negative effect [60]. In our study, the mean GVI across the 35 UGS samples was 0.468, indicating that the observed negative association may be attributed to the excessive level of eye-level greenery. Our findings provide further empirical evidence suggesting that this threshold effect may also apply to physical activity and social interaction across all age groups. Moreover, the negative association was not limited to eye-level greenery (GVI) but was also observed for spatial greenery measured by LVV. This may be due to the fact that excessive eye-level greenery can obstruct visual permeability, while overly dense spatial greenery may reduce the availability of usable spaces for physical and social activities [98]. Additionally, excessive eye-level and spatial greenery may also be closely associated with an increased sense of enclosure and lower levels of perceived safety, which can act as negative factors influencing activity engagement in UGSs [99,100,101]. In contrast, the positive association observed for the NDVI suggests that, when visual and spatial constraints are minimal, people still tend to prefer more densely vegetated environments [36]. Nonetheless, the NDVI’s influence in our study was not statistically significant, highlighting the need for further research to validate this finding. In addition, the GVI showed significant associations with engagement in health-related activities across most age groups and activity types, whereas the influence of LVV was relatively limited. This validates the intuitive and readily perceived nature of eye-level greenery, which may have a more direct impact on individuals’ activity decisions [14,46].
Furthermore, our findings revealed that the greenery standards in surrounding UGSs also significantly influenced engagement in health-related activities, underscoring the importance of external environments. While previous studies mainly relied on buffer-based approaches to examine surrounding contexts [14,102], our study employed a spatial lag term established by the k-nearest neighbors approach (k = 4) to incorporate adjacent UGS samples into the analysis. This method captured inter-UGS clustering effects, which are particularly relevant in the Xuanwu Lake Scenic Area, where UGSs are densely distributed and located in a high-density urban area. In other settings, the incorporated UGS neighbors could be adjusted based on local UGS distribution patterns [81]. Overall, this approach enhances spatial precision and highlights the cluster-level effects of UGS environments on public engagement in health-related activities.
Additionally, this study was conducted in the Xuanwu Lake Scenic Area during the summer months, a period chosen to minimize the influence of unobserved factors on the greenery measurement results. While the effects of unobserved factors, such as seasonality, accessibility, and maintenance, were effectively controlled in this context, we acknowledge that these factors can influence greenery metrics in other settings [64,103,104]. Therefore, we encourage future research to further explore how greenery measurements may vary under different seasonal conditions, accessibility levels, and maintenance conditions. Such investigations would contribute to a more robust and comprehensive foundation for developing effective and adaptive UGS planning strategies.
5. Conclusions
This study proposed an integrated framework to measure UGS greenery from multiple dimensions (NDVI, GVI, and LVV) and examined their associations with engagement in health-related activities across age groups. Our findings suggested that UGS greenery had stronger explanatory power for activity participant numbers than activity intensity across age groups. While top–down greenery (NDVI) showed a positive but non-significant association, excessive eye-level greenery (GVI) and spatial greenery (LVV) were negatively associated with engagement in health-related activities, indicating a possible threshold effect of UGS greenery. Among the three metrics, the GVI had the strongest and most consistent influence, particularly among adults and seniors, highlighting its intuitive and perceptual impact on activity decisions. Children’s engagement in health-related activities, however, appeared to be less tied to greenery, indicating the need to account for their unique activity patterns and preferences in greenery improvement. Additionally, the surrounding UGS greenery significantly shaped local activity patterns, emphasizing the importance of spatial context. These insights suggest that UGS greenery measured from a single dimension may not reliably predict engagement in health-related activities across age groups, reinforcing the need for balanced, context-sensitive UGS design to support inclusive public health.
Author Contributions
Conceptualization, C.W. and S.C.; methodology, C.W.; software, C.W.; validation, C.W., S.C. and Y.C.; formal analysis, C.W.; investigation, C.W. and S.C.; resources, S.C.; data curation, S.C.; writing—original draft preparation, C.W.; writing—review and editing, C.W., S.C., Y.C. and Z.S.; visualization, C.W.; supervision, S.C.; project administration, C.W. and S.C.; funding acquisition, C.W. and S.C. All authors have read and agreed to the published version of the manuscript.
Funding
This research was funded by the Postgraduate Research and Practice Innovation Program of Jiangsu Province, grant number KYCX23_1205; the Jiangsu Province Natural Science Foundation, grant number BK20230401; the National Natural Science Foundation of China, grant number 52308066; and the China Postdoctoral Science Foundation, grant number 2023M741720.
Data Availability Statement
The data presented in this study are available upon request from the authors. The data are not publicly available due to privacy concerns. The images employed for this study will be made available online for readers.
Acknowledgments
The authors have reviewed and edited the output and take full responsibility for the contents of this publication.
Conflicts of Interest
The authors declare no conflicts of interest.
Abbreviations
The following abbreviations are used in this manuscript:
| UGSs | Urban Green Spaces |
| NDVI | Normalized Difference Vegetation Index |
| GVI | Green View Index |
| LVV | Living Vegetation Volume |
| UAV | Unmanned Aerial Vehicle |
| PA | Physical activity |
| SI | Social interaction |
| IVs | Independent variables |
| DVs | Dependent variables |
| CV | Control variable |
| GLM | Generalized Linear Model |
| ANOVA | Analysis of variance |
| LRT | Likelihood ratio test |
| SD | Standard deviation |
| CoV | Coefficient of variation |
References
- World Urbanization Prospects the 2018 Revision; United Nations, Department of Economic and Social Affairs: New York, NY, USA, 2019.
- Guthold, R.; Ono, T.; Strong, K.L.; Chatterji, S.; Morabia, A. Worldwide Variability in Physical Inactivity: A 51-Country Survey. Am. J. Prev. Med. 2008, 34, 486–494. [Google Scholar] [CrossRef]
- Motomura, M.; Koohsari, M.J.; Lin, C.-Y.; Ishii, K.; Shibata, A.; Nakaya, T.; Kaczynski, A.T.; Veitch, J.; Oka, K. Associations of Public Open Space Attributes with Active and Sedentary Behaviors in Dense Urban Areas: A Systematic Review of Observational Studies. Health Place 2022, 75, 102816. [Google Scholar] [CrossRef]
- Rojas-Rueda, D.; Nieuwenhuijsen, M.J.; Gascon, M.; Perez-Leon, D.; Mudu, P. Green Spaces and Mortality: A Systematic Review and Meta-Analysis of Cohort Studies. Lancet Planet. Health 2019, 3, e469–e477. [Google Scholar] [CrossRef]
- Wang, P.; Meng, Y.-Y.; Lam, V.; Ponce, N. Green Space and Serious Psychological Distress among Adults and Teens: A Population-Based Study in California. Health Place 2019, 56, 184–190. [Google Scholar] [CrossRef]
- Douglas, O.; Lennon, M.; Scott, M. Green Space Benefits for Health and Well-Being: A Life-Course Approach for Urban Planning, Design and Management. Cities 2017, 66, 53–62. [Google Scholar] [CrossRef]
- Leal Filho, W.; Vidal, D.G.; Dinis, M.A.P.; Dias, R.C. (Eds.) Sustainable Policies and Practices in Energy, Environment and Health Research: Addressing Cross-Cutting Issues; World Sustainability Series; Springer International Publishing: Cham, Switzerland, 2022; ISBN 978-3-030-86303-6. [Google Scholar]
- Gascon, M.; Triguero-Mas, M.; Martínez, D.; Dadvand, P.; Forns, J.; Plasència, A.; Nieuwenhuijsen, M.J. Mental Health Benefits of Long-Term Exposure to Residential Green and Blue Spaces: A Systematic Review. Int. J. Environ. Res. Public Health 2015, 12, 4354–4379. [Google Scholar] [CrossRef]
- Larkin, A.; Hystad, P. Evaluating Street View Exposure Measures of Visible Green Space for Health Research. J. Expo. Sci. Environ. Epidemiol. 2019, 29, 447–456. [Google Scholar] [CrossRef]
- Liu, J.; Green, R.J. The Effect of Exposure to Nature on Children’s Psychological Well-Being: A Systematic Review of the Literature. Urban For. Urban Green. 2023, 81, 127846. [Google Scholar] [CrossRef]
- Markevych, I.; Schoierer, J.; Hartig, T.; Chudnovsky, A.; Hystad, P.; Dzhambov, A.M.; De Vries, S.; Triguero-Mas, M.; Brauer, M.; Nieuwenhuijsen, M.J.; et al. Exploring Pathways Linking Greenspace to Health: Theoretical and Methodological Guidance. Environ. Res. 2017, 158, 301–317. [Google Scholar] [CrossRef]
- Duan, Y.; Wagner, P.; Zhang, R.; Wulff, H.; Brehm, W. Physical Activity Areas in Urban Parks and Their Use by the Elderly from Two Cities in China and Germany. Landsc. Urban Plan. 2018, 178, 261–269. [Google Scholar] [CrossRef]
- Han, S.; Song, D.; Xu, L.; Ye, Y.; Yan, S.; Shi, F.; Zhang, Y.; Liu, X.; Du, H. Behaviour in Public Open Spaces: A Systematic Review of Studies with Quantitative Research Methods. Build. Environ. 2022, 223, 109444. [Google Scholar] [CrossRef]
- Mao, Y.; Xia, T.; Hu, F.; Chen, D.; He, Y.; Bi, X.; Zhang, Y.; Cao, L.; Yan, J.; Hu, J.; et al. The Greener the Living Environment, the Better the Health? Examining the Effects of Multiple Green Exposure Metrics on Physical Activity and Health among Young Students. Environ. Res. 2024, 250, 118520. [Google Scholar] [CrossRef] [PubMed]
- Nieuwenhuijsen, M.J.; Khreis, H.; Triguero-Mas, M.; Gascon, M.; Dadvand, P. Fifty Shades of Green: Pathway to Healthy Urban Living. Epidemiology 2017, 28, 63–71. [Google Scholar] [CrossRef] [PubMed]
- Putra, I.G.N.E.; Astell-Burt, T.; Cliff, D.P.; Vella, S.A.; Feng, X. Do Physical Activity, Social Interaction, and Mental Health Mediate the Association between Green Space Quality and Child Prosocial Behaviour? Urban For. Urban Green. 2021, 64, 127264. [Google Scholar] [CrossRef]
- Song, X.P.; Richards, D.R.; Tan, P.Y. Using Social Media User Attributes to Understand Human–Environment Interactions at Urban Parks. Sci. Rep. 2020, 10, 808. [Google Scholar] [CrossRef]
- Chen, S.; Christensen, K.M.; Li, S. A Comparison of Park Access with Park Need for Children: A Case Study in Cache County, Utah. Landsc. Urban Plan. 2019, 187, 119–128. [Google Scholar] [CrossRef]
- Lee, H.-S. Developing and Testing the Senior Park Environment Assessment in Korea (SPEAK) Audit Tool. Landsc. Urban Plan. 2022, 227, 104545. [Google Scholar] [CrossRef]
- Lu, Y.; Giuliano, G. Where Do People Meet? Time-Series Clustering for Social Interaction Levels in Daily-Life Spaces during the COVID-19 Pandemic. Cities 2023, 137, 104298. [Google Scholar] [CrossRef]
- Veitch, J.; Ball, K.; Rivera, E.; Loh, V.; Deforche, B.; Best, K.; Timperio, A. What Entices Older Adults to Parks? Identification of Park Features That Encourage Park Visitation, Physical Activity, and Social Interaction. Landsc. Urban Plan. 2022, 217, 104254. [Google Scholar] [CrossRef]
- Spotswood, E.N.; Benjamin, M.; Stoneburner, L.; Wheeler, M.M.; Beller, E.E.; Balk, D.; McPhearson, T.; Kuo, M.; McDonald, R.I. Nature Inequity and Higher COVID-19 Case Rates in Less-Green Neighbourhoods in the United States. Nat. Sustain. 2021, 4, 1092–1098. [Google Scholar] [CrossRef]
- Chen, L.; Liu, L.; Wu, H.; Peng, Z.; Sun, Z. Change of Residents’ Attitudes and Behaviors toward Urban Green Space Pre- and Post- COVID-19 Pandemic. Land 2022, 11, 1051. [Google Scholar] [CrossRef]
- Ugolini, F.; Massetti, L.; Pearlmutter, D.; Sanesi, G. Usage of Urban Green Space and Related Feelings of Deprivation during the COVID-19 Lockdown: Lessons Learned from an Italian Case Study. Land Use Policy 2021, 105, 105437. [Google Scholar] [CrossRef] [PubMed]
- Taczanowska, K.; Tansil, D.; Wilfer, J.; Jiricka-Pürrer, A. The Impact of Age on People’s Use and Perception of Urban Green Spaces and Their Effect on Personal Health and Wellbeing during the COVID-19 Pandemic—A Case Study of the Metropolitan Area of Vienna, Austria. Cities 2024, 147, 104798. [Google Scholar] [CrossRef]
- Poppe, L.; Van Dyck, D.; De Keyser, E.; Van Puyvelde, A.; Veitch, J.; Deforche, B. The Impact of Renewal of an Urban Park in Belgium on Park Use, Park-Based Physical Activity, and Social Interaction: A Natural Experiment. Cities 2023, 140, 104428. [Google Scholar] [CrossRef]
- Samsudin, R.; Yok, T.P.; Chua, V. Social Capital Formation in High Density Urban Environments: Perceived Attributes of Neighborhood Green Space Shape Social Capital More Directly than Physical Ones. Landsc. Urban Plan. 2022, 227, 104527. [Google Scholar] [CrossRef]
- Kajosaari, A.; Hasanzadeh, K.; Fagerholm, N.; Nummi, P.; Kuusisto-Hjort, P.; Kyttä, M. Predicting Context-Sensitive Urban Green Space Quality to Support Urban Green Infrastructure Planning. Landsc. Urban Plan. 2024, 242, 104952. [Google Scholar] [CrossRef]
- Knobel, P.; Kondo, M.; Maneja, R.; Zhao, Y.; Dadvand, P.; Schinasi, L.H. Associations of Objective and Perceived Greenness Measures with Cardiovascular Risk Factors in Philadelphia, PA: A Spatial Analysis. Environ. Res. 2021, 197, 110990. [Google Scholar] [CrossRef]
- Martinez, A.d.l.I.; Labib, S.M. Demystifying Normalized Difference Vegetation Index (NDVI) for Greenness Exposure Assessments and Policy Interventions in Urban Greening. Environ. Res. 2023, 220, 115155. [Google Scholar] [CrossRef]
- Yang, Y.; Lu, Y.; Yang, H.; Yang, L.; Gou, Z. Impact of the Quality and Quantity of Eye-Level Greenery on Park Usage. Urban For. Urban Green. 2021, 60, 127061. [Google Scholar] [CrossRef]
- Sánchez, I.A.V.; Labib, S.M. Accessing Eye-Level Greenness Visibility from Open-Source Street View Images: A Methodological Development and Implementation in Multi-City and Multi-Country Contexts. Sustain. Cities Soc. 2024, 103, 105262. [Google Scholar] [CrossRef]
- Yu, C.; Kwan, M.-P. Dynamic Greenspace Exposure, Individual Mental Health Status and Momentary Stress Level: A Study Using Multiple Greenspace Measurements. Health Place 2024, 86, 103213. [Google Scholar] [CrossRef] [PubMed]
- Gascon, M.; Cirach, M.; Martínez, D.; Dadvand, P.; Valentín, A.; Plasència, A.; Nieuwenhuijsen, M.J. Normalized Difference Vegetation Index (NDVI) as a Marker of Surrounding Greenness in Epidemiological Studies: The Case of Barcelona City. Urban For. Urban Green. 2016, 19, 88–94. [Google Scholar] [CrossRef]
- Reid, C.E.; Kubzansky, L.D.; Li, J.; Shmool, J.L.; Clougherty, J.E. It’s Not Easy Assessing Greenness: A Comparison of NDVI Datasets and Neighborhood Types and Their Associations with Self-Rated Health in New York City. Health Place 2018, 54, 92–101. [Google Scholar] [CrossRef] [PubMed]
- Teeuwen, R.; Milias, V.; Bozzon, A.; Psyllidis, A. How Well Do NDVI and OpenStreetMap Data Capture People’s Visual Perceptions of Urban Greenspace? Landsc. Urban Plan. 2024, 245, 105009. [Google Scholar] [CrossRef]
- Ki, D.; Lee, S. Analyzing the Effects of Green View Index of Neighborhood Streets on Walking Time Using Google Street View and Deep Learning. Landsc. Urban Plan. 2021, 205, 103920. [Google Scholar] [CrossRef]
- Yang, J.; Zhao, L.; Mcbride, J.; Gong, P. Can You See Green? Assessing the Visibility of Urban Forests in Cities. Landsc. Urban Plan. 2009, 91, 97–104. [Google Scholar] [CrossRef]
- Helbich, M.; Yao, Y.; Liu, Y.; Zhang, J.; Liu, P.; Wang, R. Using Deep Learning to Examine Street View Green and Blue Spaces and Their Associations with Geriatric Depression in Beijing, China. Environ. Int. 2019, 126, 107–117. [Google Scholar] [CrossRef]
- Liu, Y.; Zhao, B.; Cheng, Y.; Zhao, T.; Zhang, A.; Cheng, S.; Zhang, J. Does the Quality of Street Greenspace Matter? Examining the Associations between Multiple Greenspace Exposures and Chronic Health Conditions of Urban Residents in a Rapidly Urbanising Chinese City. Environ. Res. 2023, 222, 115344. [Google Scholar] [CrossRef]
- Liu, C.; Cao, Y.; Yang, C.; Zhou, Y.; Ai, M. Pattern Identification and Analysis for the Traditional Village Using Low Altitude UAV-Borne Remote Sensing: Multifeatured Geospatial Data to Support Rural Landscape Investigation, Documentation and Management. Comput. Environ. Urban Syst. 2020, 44, 185–195. [Google Scholar] [CrossRef]
- Lu, Y.; Yang, Y.; Sun, G.; Gou, Z. Associations between Overhead-View and Eye-Level Urban Greenness and Cycling Behaviors. Cities 2019, 88, 10–18. [Google Scholar] [CrossRef]
- Huang, F.; Peng, S.; Chen, S.; Cao, H.; Ma, N. VO-LVV—A Novel Urban Regional Living Vegetation Volume Quantitative Estimation Model Based on the Voxel Measurement Method and an Octree Data Structure. Remote Sens. 2022, 14, 855. [Google Scholar] [CrossRef]
- Sun, X.; Xu, S.; Hua, W.; Tian, J.; Xu, Y. Feasibility Study on the Estimation of the Living Vegetation Volume of Individual Street Trees Using Terrestrial Laser Scanning. Urban For. Urban Green. 2022, 71, 127553. [Google Scholar] [CrossRef]
- Yang, Y.; Shen, X.; Cao, L. Estimation of the Living Vegetation Volume (LVV) for Individual Urban Street Trees Based on Vehicle-Mounted LiDAR Data. Remote Sens. 2024, 16, 1662. [Google Scholar] [CrossRef]
- Xia, T.; Zhao, B.; Xian, Z.; Zhang, J. How to Systematically Evaluate the Greenspace Exposure of Residential Communities? A 3-D Novel Perspective Using UAV Photogrammetry. Remote Sens. 2023, 15, 1543. [Google Scholar] [CrossRef]
- Klompmaker, J.O.; Hoek, G.; Bloemsma, L.D.; Gehring, U.; Strak, M.; Wijga, A.H.; van den Brink, C.; Brunekreef, B.; Lebret, E.; Janssen, N.A.H. Green Space Definition Affects Associations of Green Space with Overweight and Physical Activity. Environ. Res. 2018, 160, 531–540. [Google Scholar] [CrossRef]
- Huang, D.; Jiang, B.; Yuan, L. Analyzing the Effects of Nature Exposure on Perceived Satisfaction with Running Routes: An Activity Path-Based Measure Approach. Urban For. Urban Green. 2022, 68, 127480. [Google Scholar] [CrossRef]
- Villeneuve, P.J.; Ysseldyk, R.L.; Root, A.; Ambrose, S.; DiMuzio, J.; Kumar, N.; Shehata, M.; Xi, M.; Seed, E.; Li, X.; et al. Comparing the Normalized Difference Vegetation Index with the Google Street View Measure of Vegetation to Assess Associations between Greenness, Walkability, Recreational Physical Activity, and Health in Ottawa, Canada. Int. J. Environ. Res. Public Health 2018, 15, 1719. [Google Scholar] [CrossRef]
- Li, X. Examining the Spatial Distribution and Temporal Change of the Green View Index in New York City Using Google Street View Images and Deep Learning. Environ. Plan. B Urban Anal. City Sci. 2021, 48, 2039–2054. [Google Scholar] [CrossRef]
- Lu, Y.; Ferranti, E.J.S.; Chapman, L.; Pfrang, C. Assessing Urban Greenery by Harvesting Street View Data: A Review. Urban For. Urban Green. 2023, 83, 127917. [Google Scholar] [CrossRef]
- Xia, T.; Zhao, B.; Yu, J.; Gao, Y.; Wang, X.; Mao, Y.; Zhang, J. Making Residential Green Space Exposure Evaluation More Accurate: A Composite Assessment Framework That Integrates Objective and Subjective Indicators. Urban For. Urban Green. 2024, 95, 128290. [Google Scholar] [CrossRef]
- Chen, S.; Sleipness, O.; Christensen, K.; Yang, B.; Wang, H. Developing and Testing a Protocol to Systematically Assess Social Interaction with Urban Outdoor Environment. J. Environ. Psychol. 2023, 88, 102008. [Google Scholar] [CrossRef]
- Chen, S.; Sleipness, O.; Christensen, K.; Yang, B.; Park, K.; Knowles, R.; Yang, Z.; Wang, H. Exploring Associations between Social Interaction and Urban Park Attributes: Design Guideline for Both Overall and Separate Park Quality Enhancement. Cities 2024, 145, 104714. [Google Scholar] [CrossRef]
- Jennings, V.; Bamkole, O. The Relationship between Social Cohesion and Urban Green Space: An Avenue for Health Promotion. Int. J. Environ. Res. Public Health 2019, 16, 452. [Google Scholar] [CrossRef]
- Veitch, J.; Ball, K.; Flowers, E.; Deforche, B.; Timperio, A. Children’s Ratings of Park Features That Encourage Park Visitation, Physical Activity and Social Interaction. Urban For. Urban Green. 2021, 58, 126963. [Google Scholar] [CrossRef]
- Akpinar, A. Urban Green Spaces for Children: A Cross-Sectional Study of Associations with Distance, Physical Activity, Screen Time, General Health, and Overweight. Urban For. Urban Green. 2017, 25, 66–73. [Google Scholar] [CrossRef]
- He, H.; Lin, X.; Yang, Y.; Lu, Y. Association of Street Greenery and Physical Activity in Older Adults: A Novel Study Using Pedestrian-Centered Photographs. Urban For. Urban Green. 2020, 55, 126789. [Google Scholar] [CrossRef]
- Vich, G.; Delclòs-Alió, X.; Maciejewska, M.; Marquet, O.; Schipperijn, J.; Miralles-Guasch, C. Contribution of Park Visits to Daily Physical Activity Levels among Older Adults: Evidence Using GPS and Accelerometery Data. Urban For. Urban Green. 2021, 63, 127225. [Google Scholar] [CrossRef]
- Yang, L.; Ao, Y.; Ke, J.; Lu, Y.; Liang, Y. To Walk or Not to Walk? Examining Non-Linear Effects of Streetscape Greenery on Walking Propensity of Older Adults. J. Transp. Geogr. 2021, 94, 103099. [Google Scholar] [CrossRef]
- Raney, M.A.; Hendry, C.F.; Yee, S.A. Physical Activity and Social Behaviors of Urban Children in Green Playgrounds. Am. J. Prev. Med. 2019, 56, 522–529. [Google Scholar] [CrossRef]
- Zhai, Y.; Li, D.; Wu, C.; Wu, H. Urban Park Facility Use and Intensity of Seniors’ Physical Activity—An Examination Combining Accelerometer and GPS Tracking. Landsc. Urban Plan. 2021, 205, 103950. [Google Scholar] [CrossRef]
- Evenson, K.R.; Jones, S.A.; Holliday, K.M.; Cohen, D.A.; McKenzie, T.L. Park Characteristics, Use, and Physical Activity: A Review of Studies Using SOPARC (System for Observing Play and Recreation in Communities). Prev. Med. 2016, 86, 153–166. [Google Scholar] [CrossRef] [PubMed]
- Han, Y.; Zhong, T.; Yeh, A.G.O.; Zhong, X.; Chen, M.; Lü, G. Mapping Seasonal Changes of Street Greenery Using Multi-Temporal Street-View Images. Sustain. Cities Soc. 2023, 92, 104498. [Google Scholar] [CrossRef]
- Wang, C.; Zou, J.; Fang, X.; Chen, S.; Wang, H. Using Social Media and Multi-Source Geospatial Data for Quantifying and Understanding Visitor’s Preferences in Rural Forest Scenes: A Case Study from Nanjing. Forests 2023, 14, 1932. [Google Scholar] [CrossRef]
- Song, W.-K. Application of UAV for Vegetation Monitoring in Urban Green Space. J. Korean Soc. Environ. Restor. Technol. 2019, 22, 61–72. [Google Scholar] [CrossRef]
- Stow, D.; Nichol, C.J.; Wade, T.; Assmann, J.J.; Simpson, G.; Helfter, C. Illumination Geometry and Flying Height Influence Surface Reflectance and NDVI Derived from Multispectral UAS Imagery. Drones 2019, 3, 55. [Google Scholar] [CrossRef]
- Tucker, C.J. Red and Photographic Infrared Linear Combinations for Monitoring Vegetation. Remote Sens. Environ. 1979, 8, 127–150. [Google Scholar] [CrossRef]
- Dong, L.; Jiang, H.; Li, W.; Qiu, B.; Wang, H.; Qiu, W. Assessing Impacts of Objective Features and Subjective Perceptions of Street Environment on Running Amount: A Case Study of Boston. Landsc. Urban Plan. 2023, 235, 104756. [Google Scholar] [CrossRef]
- Tsai, V.J.D.; Chang, C.-T. Three-Dimensional Positioning from Google Street View Panoramas. IET Image Process. 2013, 7, 229–239. [Google Scholar] [CrossRef]
- Ye, Y.; Richards, D.; Lu, Y.; Song, X.; Zhuang, Y.; Zeng, W.; Zhong, T. Measuring Daily Accessed Street Greenery: A Human-Scale Approach for Informing Better Urban Planning Practices. Landsc. Urban Plan. 2019, 191, 103434. [Google Scholar] [CrossRef]
- Yin, L.; Wang, Z. Measuring Visual Enclosure for Street Walkability: Using Machine Learning Algorithms and Google Street View Imagery. Appl. Geogr. 2016, 76, 147–153. [Google Scholar] [CrossRef]
- Aikoh, T.; Homma, R.; Abe, Y. Comparing Conventional Manual Measurement of the Green View Index with Modern Automatic Methods Using Google Street View and Semantic Segmentation. Urban For. Urban Green. 2023, 80, 127845. [Google Scholar] [CrossRef]
- Cordts, M.; Omran, M.; Ramos, S.; Rehfeld, T.; Enzweiler, M.; Benenson, R.; Franke, U.; Roth, S.; Schiele, B. The Cityscapes Dataset for Semantic Urban Scene Understanding. In Proceedings of the 2016 IEEE Conference on Computer Vision and Pattern Recognition (CVPR), Las Vegas, NV, USA, 27–30 June 2016; IEEE: Piscataway, NJ, USA, 2016; pp. 3213–3223. [Google Scholar]
- Zięba-Kulawik, K.; Skoczylas, K.; Wężyk, P.; Teller, J.; Mustafa, A.; Omrani, H. Monitoring of Urban Forests Using 3D Spatial Indices Based on LiDAR Point Clouds and Voxel Approach. Urban For. Urban Green. 2021, 65, 127324. [Google Scholar] [CrossRef]
- McKenzie, T.L.; Cohen, D.A.; Sehgal, A.; Williamson, S.; Golinelli, D. System for Observing Play and Recreation in Communities (SOPARC): Reliability and Feasibility Measures. J. Phys. Act. Health 2006, 3 (Suppl. S1), S208–S222. [Google Scholar] [CrossRef] [PubMed]
- Hewer, M.; Scott, D.; Fenech, A. Seasonal Weather Sensitivity, Temperature Thresholds, and Climate Change Impacts for Park Visitation. Tour. Geogr. 2016, 18, 297–321. [Google Scholar] [CrossRef]
- Hooper, P.; Foster, S.; Edwards, N.; Turrell, G.; Burton, N.; Giles-Corti, B.; Brown, W.J. Positive HABITATS for Physical Activity: Examining Use of Parks and Its Contribution to Physical Activity Levels in Mid-to Older-Aged Adults. Health Place 2020, 63, 102308. [Google Scholar] [CrossRef]
- Dunn, P.K.; Smyth, G.K. Generalized Linear Models with Examples in R; Springer Texts in Statistics; Springer: New York, NY, USA, 2018; ISBN 978-1-4419-0117-0. [Google Scholar]
- Gałecki, A.; Burzykowski, T. Linear Mixed-Effects Models Using R: A Step-by-Step Approach; Springer Texts in Statistics; Springer: New York, NY, USA, 2013; ISBN 978-1-4614-3899-1. [Google Scholar]
- Chen, S.; Sleipness, O.R.; Christensen, K.M.; Feldon, D.; Xu, Y. Environmental Justice and Park Quality in an Intermountain West Gateway Community: Assessing the Spatial Autocorrelation. Landsc. Ecol. 2019, 34, 2323–2335. [Google Scholar] [CrossRef]
- Conway, D.; Li, C.Q.; Wolch, J.; Kahle, C.; Jerrett, M. A Spatial Autocorrelation Approach for Examining the Effects of Urban Greenspace on Residential Property Values. J. Real Estate Financ. Econ. 2010, 41, 150–169. [Google Scholar] [CrossRef]
- Brooks, M.E.; Kristensen, K.; van Benthem, K.J.; Magnusson, A.; Berg, C.W.; Nielsen, A.; Skaug, H.J.; Mächler, M.; Bolker, B.M. glmmTMB Balances Speed and Flexibility Among Packages for Zero-Inflated Generalized Linear Mixed Modeling. R J. 2017, 9, 378–400. [Google Scholar] [CrossRef]
- Pebesma, E.; Bivand, R. Spatial Data Science: With Applications in R, 1st ed.; Chapman and Hall/CRC: New York, NY, USA, 2023; ISBN 978-0-429-45901-6. [Google Scholar]
- Zeileis, A.; Hothorn, T. Diagnostic Checking in Regression Relationships. R News 2002, 2, 7–10. [Google Scholar]
- Han, J.; Kamber, M.; Pei, J. Data Mining: Concepts and Techniques; Elsevier: Amsterdam, The Netherlands, 2011; ISBN 978-0-12-381480-7. [Google Scholar]
- Belsley, D.A.; Kuh, E.; Welsch, R.E. Regression Diagnostics: Identifying Influential Data and Sources of Collinearity; John Wiley & Sons: Hoboken, NJ, USA, 2005; ISBN 978-0-471-72514-5. [Google Scholar]
- Zhang, L.; Wang, L.; Wu, J.; Li, P.; Dong, J.; Wang, T. Decoding Urban Green Spaces: Deep Learning and Google Street View Measure Greening Structures. Urban For. Urban Green. 2023, 87, 128028. [Google Scholar] [CrossRef]
- Chen, X.; Meng, Q.; Hu, D.; Zhang, L.; Yang, J. Evaluating Greenery around Streets Using Baidu Panoramic Street View Images and the Panoramic Green View Index. Forests 2019, 10, 1109. [Google Scholar] [CrossRef]
- Zhang, R.; Zhang, C.-Q.; Lai, P.C.; Kwan, M.-P. Park and Neighbourhood Environmental Characteristics Associated with Park-Based Physical Activity among Children in a High-Density City. Urban For. Urban Green. 2022, 68, 127479. [Google Scholar] [CrossRef]
- Baró, F.; Camacho, D.A.; Pérez Del Pulgar, C.; Triguero-Mas, M.; Anguelovski, I. School Greening: Right or Privilege? Examining Urban Nature within and around Primary Schools through an Equity Lens. Landsc. Urban Plan. 2021, 208, 104019. [Google Scholar] [CrossRef]
- Janssen, I.; Rosu, A. Undeveloped Green Space and Free-Time Physical Activity in 11 to 13-Year-Old Children. Int. J. Behav. Nutr. Phys. Act. 2015, 12, 26. [Google Scholar] [CrossRef] [PubMed]
- Truong, M.V.; Nakabayashi, M.; Hosaka, T. How to Encourage Parents to Let Children Play in Nature: Factors Affecting Parental Perception of Children’s Nature Play. Urban For. Urban Green. 2022, 69, 127497. [Google Scholar] [CrossRef]
- Chen, Y.; Bouferguene, A.; Al-Hussein, M. Neighborhood Design and Regional Accessibility of Age-Restricted Communities from Resiliency and Spatial Perspectives. In Proceedings of the Construction Research Congress 2018, New Orleans, LA, USA, 2–4 April 2018. [Google Scholar]
- Buffel, T.; Verté, D.; Donder, L.D.; Witte, N.D.; Dury, S.; Vanwing, T.; Bolsenbroek, A. Theorising the Relationship between Older People and Their Immediate Social Living Environment. Int. J. Lifelong Educ. 2012, 31, 13–32. [Google Scholar] [CrossRef]
- Van Cauwenberg, J.; Cerin, E.; Timperio, A.; Salmon, J.; Deforche, B.; Veitch, J. Park Proximity, Quality and Recreational Physical Activity among Mid-Older Aged Adults: Moderating Effects of Individual Factors and Area of Residence. Int. J. Behav. Nutr. Phys. Act. 2015, 12, 46. [Google Scholar] [CrossRef]
- Kaczynski, A.T.; Besenyi, G.M.; Stanis, S.A.W.; Koohsari, M.J.; Oestman, K.B.; Bergstrom, R.; Potwarka, L.R.; Reis, R.S. Are Park Proximity and Park Features Related to Park Use and Park-Based Physical Activity among Adults? Variations by Multiple Socio-Demographic Characteristics. Int. J. Behav. Nutr. Phys. Act. 2014, 11, 146. [Google Scholar] [CrossRef]
- Hou, J.; Wang, Y.; Zhang, X.; Qiu, L.; Gao, T. The Effect of Visibility on Green Space Recovery, Perception and Preference. Trees For. People 2024, 16, 100538. [Google Scholar] [CrossRef]
- Tabrizian, P.; Baran, P.K.; Smith, W.R.; Meentemeyer, R.K. Exploring Perceived Restoration Potential of Urban Green Enclosure through Immersive Virtual Environments. J. Environ. Psychol. 2018, 55, 99–109. [Google Scholar] [CrossRef]
- Sezavar, N.; Pazhouhanfar, M.; Van Dongen, R.P.; Grahn, P. The Importance of Designing the Spatial Distribution and Density of Vegetation in Urban Parks for Increased Experience of Safety. J. Clean. Prod. 2023, 403, 136768. [Google Scholar] [CrossRef]
- Lis, A.; Zalewska, K.; Grabowski, M. The Ability to Choose How to Interact with Other People in the Park Space and Its Role in Terms of Perceived Safety and Preference. J. Environ. Psychol. 2024, 99, 102429. [Google Scholar] [CrossRef]
- Teeuwen, R.; Psyllidis, A.; Bozzon, A. Measuring Children’s and Adolescents’ Accessibility to Greenspaces from Different Locations and Commuting Settings. Comput. Environ. Urban Syst. 2023, 100, 101912. [Google Scholar] [CrossRef]
- Zhang, K.; Chen, M. Multi-Method Analysis of Urban Green Space Accessibility: Influences of Land Use, Greenery Types, and Individual Characteristics Factors. Urban For. Urban Green. 2024, 96, 128366. [Google Scholar] [CrossRef]
- Liu, Y.; Maurer, M.L.; Carstensen, T.A.; Wagner, A.M.; Skov-Petersen, H.; Olafsson, A.S. An Integrated Approach for Urban Green Travel Environments: Planning Factors, Benefits and Barriers as Perceived by Users and Planners. J. Transp. Geogr. 2024, 117, 103849. [Google Scholar] [CrossRef]
Disclaimer/Publisher’s Note: The statements, opinions and data contained in all publications are solely those of the individual author(s) and contributor(s) and not of MDPI and/or the editor(s). MDPI and/or the editor(s) disclaim responsibility for any injury to people or property resulting from any ideas, methods, instructions or products referred to in the content. |
© 2025 by the authors. Licensee MDPI, Basel, Switzerland. This article is an open access article distributed under the terms and conditions of the Creative Commons Attribution (CC BY) license (https://creativecommons.org/licenses/by/4.0/).