Article

Spatial Correlation of Non-Agriculturalization and Non-Grain Utilization Transformation of Cultivated Land in China and Its Implications

by
Yingge Wang
1,
Daiyi Song
1,
Cheng Liu
2,
Shuaicheng Li
1,
Man Yuan
1,
Jian Gong
2 and
Jianxin Yang
2,*
1
School of Public Administration, China University of Geosciences, Wuhan 430074, China
2
Key Laboratory of Rule of Law Research, Ministry of Natural Resources, Wuhan 430074, China
*
Author to whom correspondence should be addressed.
Land 2025, 14(5), 1031; https://doi.org/10.3390/land14051031
Submission received: 28 March 2025 / Revised: 6 May 2025 / Accepted: 7 May 2025 / Published: 8 May 2025
(This article belongs to the Section Land Innovations – Data and Machine Learning)

Abstract

:
China’s rapid urbanization and evolving agricultural practices have driven significant changes in cultivated land utilization, characterized by non-agriculturalization (NA) and non-grain utilization (NGU) transformation. Understanding the spatial patterns and driving mechanisms of these transformations is critical for formulating effective cultivated land management and protection policies. Previous studies have treated the non-agriculturalization (NA) and non-grain utilization (NGU) of cultivated land as distinct phenomena with no correlation. Therefore, this study constructs a theoretical framework to explore the correlation between NA and NGU and examines their interaction patterns using Ezhou City in China as a case study. Spatial econometric models and multinomial logistic regression analyses reveal distinct trade-offs and synergies between NA and NGU, which are shaped by locational, socioeconomic, natural, and policy factors. Urban areas exhibit higher NA rates due to economic development, while rural areas favor NGU for improved land use efficiency and profitability. Suburban zones demonstrate a coordinated transformation, where both processes coexist synergistically. The findings, which are also verified by another two case study areas, highlight the existence of spatial correlations between NA and NGU transformations of cultivated land. They also underscore the necessity for region-specific policies to balance food security with economic growth and dietary transformation. This study helps to elucidate the complex mechanisms underlying different types of cultivated land use transitions and offers new perspectives for the formulation of cultivated land use and protection policies for global cities.

1. Introduction

China feeds 21% of the world’s population with only 7% of the world’s cultivated land [1], which makes a significant contribution to the global sustainable development goal of Zero Hunger (SDG 2). Therefore, the protection of cultivated land in China is a critical issue worldwide, driven by the country’s vast population and the growing challenge of food security [2,3]. As the world’s most populous nation, with over 1.4 billion people, China still constantly faces great demands for food, which places immense pressure on preventing the loss of cultivated land and promoting sustainable agricultural practices [4]. However, the dual threats of rapid urbanization and shifting agricultural practices are reshaping China’s cultivated land, creating a complex web of challenges that demand an integrated and strategic approach to cultivated land management and protection, not only for achieving food security in China, but also for supporting global sustainable development [5,6].
Cultivated land loss refers to the reduction of arable land due to various reasons, including urbanization, industrialization, environmental degradation, and changes in agricultural practices [7]. Studies from across North America, Europe, and Asia highlight the role of urban sprawl as one of the most prominent drivers of cultivated land loss [8,9]. In China, since the launch of the reform and opening-up policy (1978–present), the NA transformation of cultivated land has become increasingly prominent, with large areas of farmland being converted for urban and industrial development. The NA transformation of cultivated land refers to the process of land resource reallocation caused by the competition between cultivated land and construction land, essentially referring to the conversion of cultivated land to construction land use [10]. In response, China has implemented strict land use regulations, notably the “cultivated land requisition–compensation balance” policy, which mandates that any converted farmland be offset by creating new arable land of equal quantity and quality [11]. This land use regulation policy mainly aims to curb stakeholder’s inclination of NA transformation of cultivated land and has, so far, contributed greatly to ensure grain production, despite ongoing urbanization and industrialization in China [12].
However, there is still a lack of institutional regulations regarding agricultural behavior transformations, i.e., the conversion from cultivated land for grain production to other types of agricultural land usage, such as pastures, orchards, forests, grasslands, and even aquaculture [13,14]. This has led to an increasing severity of the non-grain utilization (NGU) transformation of cultivated land, becoming another significant contributor to the loss of cultivated land in China [15]. The Chinese government has also realized that the NGU transformation of cultivated land is a significant cause leading to cultivated land loss due to human activities in China. The NGU transformation of cultivated land can be categorized into two kinds. One involves adjusting the crop planting structure by replacing grain crops (like wheat, rice, corn, barley, oats, etc.) with non-grain crops (typically annual food crops like vegetables, root and tuber crops, fiber crops, sugar crops, oilseeds and oil crops, etc.). The other kind involves transforming cultivated land into other types of agricultural land (in most cases are perennial economic products) such as livestock, orchards, forests, and even aquaculture, as part of a structural adjustment of agricultural production [16]. Studies show that while NGU transformation may improve short-term economic gains for stakeholders, it poses risks to long-term regional food security by reducing the quality and amount of land available for grain cultivation, which could implicitly undermine China’s self-sufficiency goals in food production [17].
Data from the National Land Survey in China show that over the past decade, the proportion of cultivated land in China has decreased from 19.62% to 15.96% due to NA and NGU transformation, with a net transfer of 11.67 million hectares of cultivated land to forests and orchards [18]. Therefore, issues such as the unmanaged occupation of cultivated land and unplanned changes in its usage remain prominent in China. Confronting these threats of cultivated land protection, the regime shifts in the cultivated land use regulation system call for a more comprehensive understanding of the underlying mechanisms driving NA and NGU transformation [19], and particularly a deeper comprehension of their spatial correlation patterns and mechanisms, to help develop more integrated and coordinated governance strategies for both issues.
By comparing grain planting patterns across China and in specific regions such as Henan [20,21], Zhejiang [22,23], Shandong [24,25], and Hubei [26,27], scholars have found that both NA and NGU are gradually expanding. Furthermore, these phenomena exhibit significant spatial clustering characteristics, with a higher degree of NA observed east of the “Hu Line”. The NGU of cultivated land shows a spatial pattern intensifying from the northeast to the southwest, and there is an overall spatial trade-off between NA and NGU in China [28]. While existing studies have identified notable spatial characteristics of NA and NGU, comprehensive research into the spatial coupling and interaction patterns between NA and NGU is still lacking. Previous studies have also investigated the driving factors and mechanisms behind the NA and NGU of cultivated land in China. It is widely believed that the richness of cultivated land resources is the fundamental condition that influences the NA and NGU of cultivated land. Natural conditions such as soil quality, irrigation infrastructure, and terrain slope determine the suitability and cost-efficiency of land for grain production, thereby influencing the decision-making of stakeholders [29]. The different benefits arising from different land use behaviors and agriculture practices are important reasons leading to NA and NGU transformation. Moreover, the market demand and preferences driven by urbanization and changing lifestyles have exacerbated the NA and NGU phenomenon [30]. Additionally, the outflow of rural labor to cities and the transfer of cultivated land to diversified and large-scale farming, which led to profit-oriented planting decisions, have accelerated the NGU of cultivated land [31]. In recent years, farmer’s decisions have increasingly been influenced by cultivated land protection and management policies. The profit-driven decisions of individuals have been embedded in the broader national strategy to ensure grain production and food security, directly or indirectly affecting the spatiotemporal patterns of regional NA and NGU [32].
However, in prior studies, the NA and NGU of cultivated land are treated as distinct phenomena without correlations, with a focus primarily on their respective spatiotemporal patterns and driving mechanisms [33,34]. Limited research has delved into the correlation between these two phenomena, examining their spatial correlation, underlying mechanisms, and implications for policy. Existing studies reveal that the spatial distribution of NA and NGU often exhibits complex patterns that may manifest as either synergistic or trade-off relationships [35]. Despite having distinct influencing factors and mechanisms, these processes are, to some extent, interlinked [28]. The correlation patterns between NA and NGU are regionally heterogeneous, potentially influencing the effectiveness of integrated governance strategies aimed at controlling cultivated land loss in China. Research that solely concentrates on NA or NGU often overlooks their spatial interconnections, resulting in a limited understanding of how their combined impacts shape regional cultivated land use practices and influence protection policies. This gap restricts the ability to obtain a comprehensive grasp of the complex spatiotemporal dynamics and driving forces behind cultivated land transformation.
To address this issue, this paper offers a theoretical analysis of the correlation and interaction between NA and NGU processes. Using Ezhou City in Hubei, China as a case study, we examine the spatiotemporal characteristics and correlation patterns of these processes in detail. As one of the few models specifically developed for spatial causality detection, Geographical Convergent Cross Mapping (GCCM) [36] facilitates the identification and evaluation of spatial linkages between NA and NGU based on cross-sectional data. Upon establishing the presence of spatial causality, this study further employs spatial econometric models to systematically examine both the commonalities and divergences in the driving mechanisms of NA and NGU while explicitly accounting for spatial heterogeneity. Subsequently, the study categorizes the basic analytical units into three types based on the interaction patterns between NA and NGU, and utilizes a multinomial logistic regression model to investigate the underlying mechanisms shaping these interactions. To further substantiate our findings, two additional case studies are analyzed and discussed, providing a robust verification of the observed correlation patterns and mechanisms. The primary contribution of this study lies in its introduction of a unique perspective by examining the pattern and mechanism of spatial correlation between the non-agriculturalization and non-grain utilization transformation of cultivated land, both theoretically and empirically. This perspective moves beyond the conventional analysis of individual transformation types and highlights the synergies and trade-offs between NA and NGU, providing a more holistic understanding of cultivated land use transitions. By introducing this innovative perspective of cultivated land transformation using cutting-edge cause inference and econometric regression models, it delves into the deeper causes underlying these transitions. The findings will provide fresh insights for global policymakers to think about the reform and enhancement of current cultivated land use and protection policies [37].

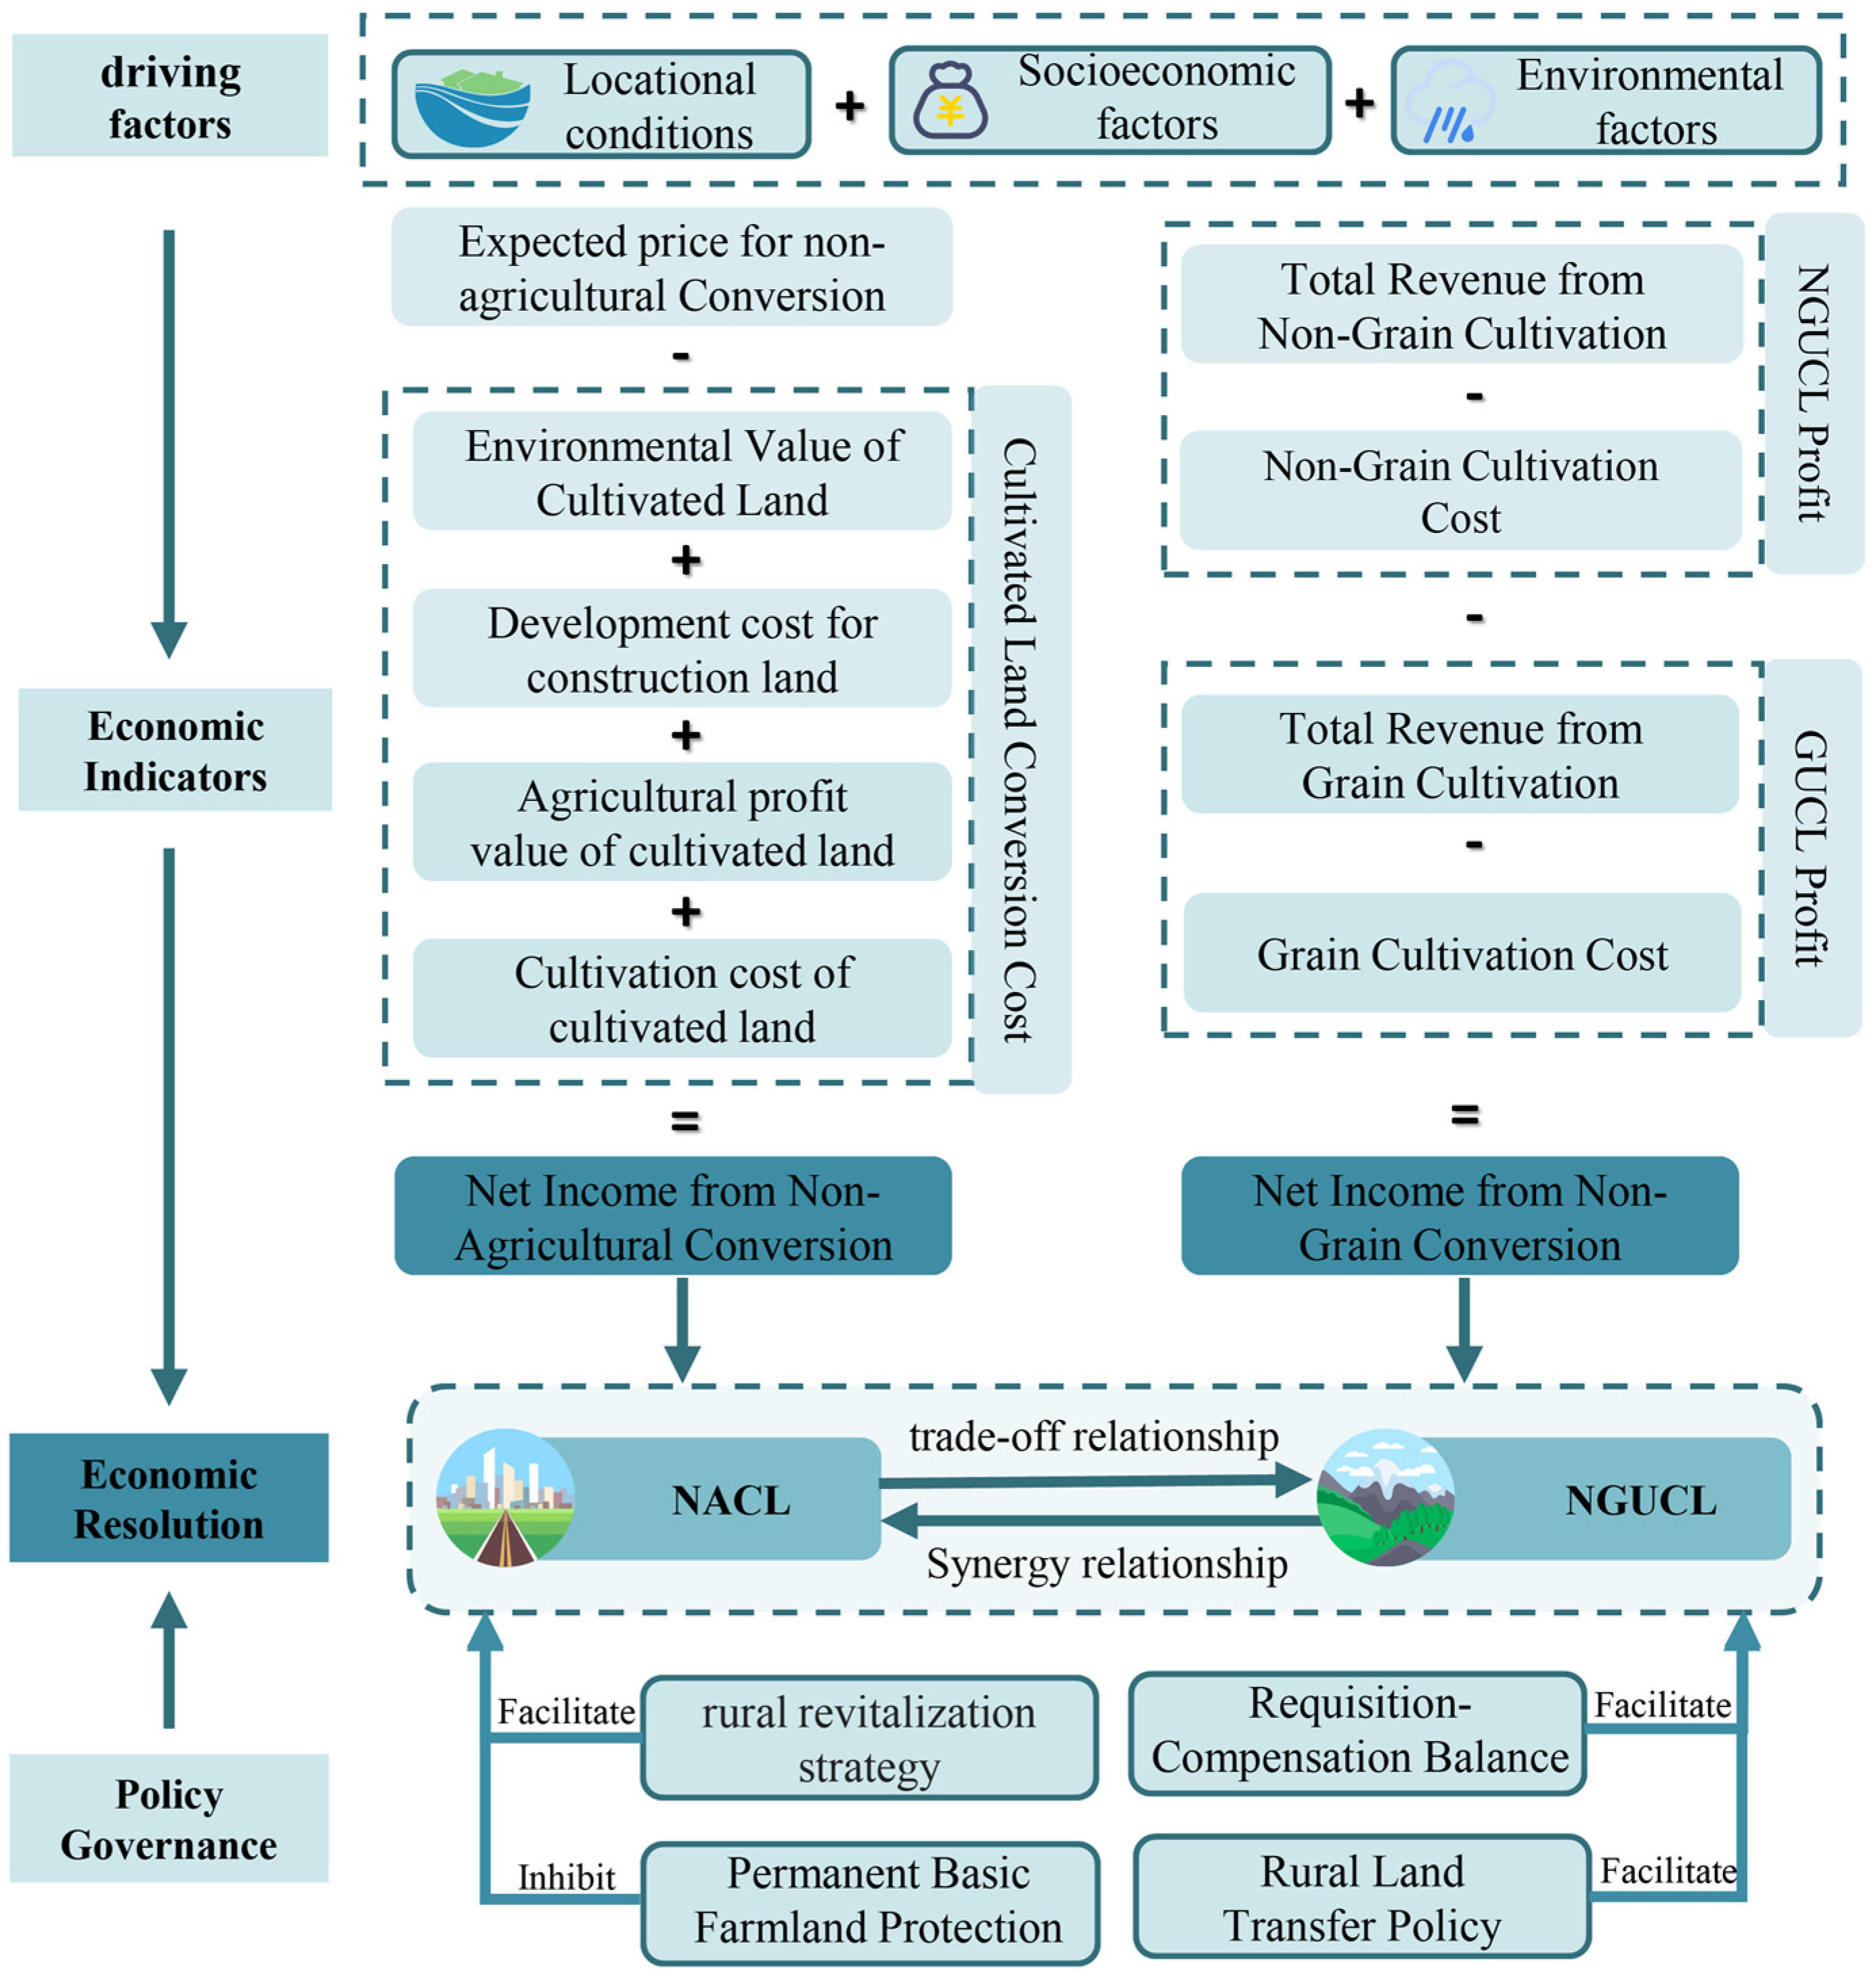
2. Theoretical Explanation of Cultivated Land Transformation

The NGU driven by shifts in crop planting structures is primarily shaped by market dynamics and farmers’ perceptions [38], resulting in short-term behavior with limited impact on cultivated land quality. Conversely, NGU stemming from the conversion of cultivated land to other agricultural uses is a long-term transformation that significantly compromises the food production capacity of the land, rendering restoration challenging and posing a serious threat to regional grain production. Given this distinction, this paper focuses on examining the spatial correlation patterns between the NA transformation and the NGU transformation linked to the conversion of cultivated land into alternative agricultural uses, such as forests, orchards, livestock farming, and aquaculture, which are observed within a 10-year span in our study case.

2.1. Theoretical Explanation of NA and NGU Transformation

2.1.1. Theoretical Explanation of NA Transformation

The economic value of cultivated land used for grain production (i.e., before NA transformation) is determined by multiple aspects, including the value of grain produced, production costs, land use rights, and the environmental value of cultivated land [39]. The net profit from grain production depends on the difference between the market value of grain and its production costs, which in turn is influenced by the land’s production capacity. This capacity is shaped by natural conditions, such as soil fertility, water availability, and climatic suitability, as well as the level of agricultural technology and management skills available to farmers. The value of land use rights is also determined by geographic location in addition to productivity.
Due to the consistent neglect of the environmental value of cultivated land and the systematic underestimation of its agricultural output [40], farmers often receive compensation far below the land’s theoretical value during land conversion [41]. In contrast, once converted to construction land (e.g., for commercial or industrial use), the returns from land development significantly exceed those of grain production. This marked economic disparity strongly incentivizes local governments and developers to accelerate NA transformation, particularly in areas with high urbanization potential [42].

2.1.2. Theoretical Explanation of NGU Transformation

The NGU of cultivated land involves changes in the type of agricultural activities without altering land ownership. Whether cultivated land undergoes NGU transformation is determined by farmers assessing the potential economic returns in light of market demand and regulatory policies [43]. The additional profit from NGU is calculated as the difference between the profit from non-grain agricultural products (total revenue minus production costs) and the profit from grain cultivation (total revenue from grain minus production costs) [44]. Market demand for non-grain products (such as fruits and timber), combined with natural conditions less suitable for grain cultivation, may result in higher economic returns from non-grain crops than from staple grains, thereby driving the shift toward non-grain land use [45].
In response to the increasing emphasis on food security and farmland protection, the Chinese government has implemented several regulatory measures, such as permanent basic farmland protection and the cultivated land requisition–compensation balance policy, to strengthen the restrictions on NA and NGU of cultivated land. However, differing levels of regulatory control over these two types of transformations have led to significant disparities in their spatial distribution [46]. Figure 1 illustrates the formation mechanisms of NA and NGU.

2.2. Explanation of Spatial Correlation Between NA and NGU Transformation

Despite differences in driving mechanisms, there is also an interrelationship between NA and NGU. Both processes are influenced by the balance of agricultural production costs and potential returns. High production costs for grain and low profit margins may prompt a shift to either non-agricultural uses or non-grain crops. As a result, both transformations share common external and internal influencing factors, leading to some degree of spatial interaction and correlation in their distribution patterns.
Land near urban areas benefits from a favorable socioeconomic environment, as well as locational advantages, which lead to significantly higher expected revenues after NA transformation due to the rapid urban expansion in China over the past decade [38]. The profit from converting land to non-agricultural purposes greatly exceeds that of grain cultivation, which leads to frequent NA conversion in the main urban areas. The substantial occupation of cultivated land thereby reduces the available space for agricultural development in these areas. Thus, in general, the socioeconomic and locational advantages of urban areas drive the rapid NA transformation while limiting NGU transformation in the urban areas. As a result, a trade-off often occurs between NA and NGU in rapid urbanization areas.
To maintain the quantity of cultivated land, the Chinese central government has established policies such as the cultivated land requisition–compensation balance, the linkage between urban construction land increase and rural construction land reduction, and permanent farmland protection. These policies have allowed and accelerated the NA of cultivated land in urban areas, to some extent. However, they have also shifted cultivated land towards hinterland rural areas. The hinterland rural areas are usually socioeconomically undeveloped and have unfavorable geographic conditions [47]. Consequently, the benefits generated from the NA transformation of cultivated land in these hinterland areas are less pronounced compared to those in urban areas. In these rural areas, NA transformation was primarily induced by the expansion of rural settlement and industries. Conversely, NGU transformation is more prevalent in hinterland rural areas as a means for local farmers to increase economic returns [48]. This is especially true in mountainous and hilly regions where, due to topographic constraints, newly reclaimed cultivated land, as required by the requisition–compensation balance policy, often lacks good agricultural infrastructure (e.g., roads and water supply) [44]. As a result, the profitability of these cultivated lands is low due to higher investment and low agricultural productivity, and, ultimately, facilitates the marginalization and abandonment of cultivated land in these areas. NGU transformation and large-scale planting are effective strategies to mitigate the marginalization and abandonment of cultivated land in hinterland villages. However, given the challenges of large-scale farming in some rural areas due to fragmented land parcels (especially in hilly areas), these regions tend to adopt NGU transformation as a solution to improve the per-unit value of the cultivated land, converting it to orchards or trees that require low-maintenance but have high values. In some plain areas, farmers, benefiting from favorable terrain and good-quality cultivated land, have gradually engaged in large-scale farming through land transfer policies [49]. However, in order to reduce the agricultural production costs associated with land transfer fees, some farmers opt for non-grain cultivation to improve net returns as well.
In the urban–rural transition zones, the economic development of peri-urban rural areas is relatively active, supported by favorable production conditions (e.g., terrain and water supply). Frequent exchanges of population and goods between urban and rural areas attract a large influx of production resources, including technology, capital, and labor, developing the villages in these areas that are frequently engaged in industries such as manufacturing, commerce, and rental housing [50]. These transformations have driven the increase in NA of cultivated land in peri-urban rural areas. On the other hand, peri-urban rural areas contain a substantial amount of arable land that is suitable for cultivation. Farmers in these areas, benefiting from transportation advantages and proximity to markets, can flexibly adjust cropping patterns to better respond to market changes and demand fluctuations. They may also choose to grow low-maintenance crops to release labor for urban employment, thereby increasing overall household income [51]. Furthermore, since peri-urban areas are focal zones for both agricultural and economic development, land competition is more intense, and the issues of regulatory failure and policy oversight are more pronounced. This situation exacerbates the incentives for illegal actions by developers and farmers, thereby weakening the effectiveness of land use planning and cultivated land protection policies. Consequently, the coexistence of NA and NGU has become pronounced in these areas, posing more challenges to cultivated land protection [50].
In recent years, with the implementation of China’s rural revitalization strategy, the development of rural secondary and tertiary industries—such as rural tourism, greenhouse agriculture, leisure agriculture, and the inflow of industrial and commercial capital—has disrupted the traditional land use behaviors of cultivated land, making the spatial pattern of NA and NGU more complex. In summary, the interaction and spatial correlation patterns between the NA and NGU of cultivated land are shaped by the combined effects of locational conditions, socioeconomic factors, natural conditions, and policy influences. These factors, with their varying impacts across different regions, create diverse interaction patterns between NA and NGU transformation, ranging from trade-offs to synergies. In terms of their spatial correlation patterns, urban areas and hinterland rural regions primarily exhibit a trade-off relationship. In contrast, peri-urban areas and certain rural revitalization villages in the urban–rural transition zones serve as key areas for the coordinated occurrence of NA and NGU transformation.

3. Materials and Methods
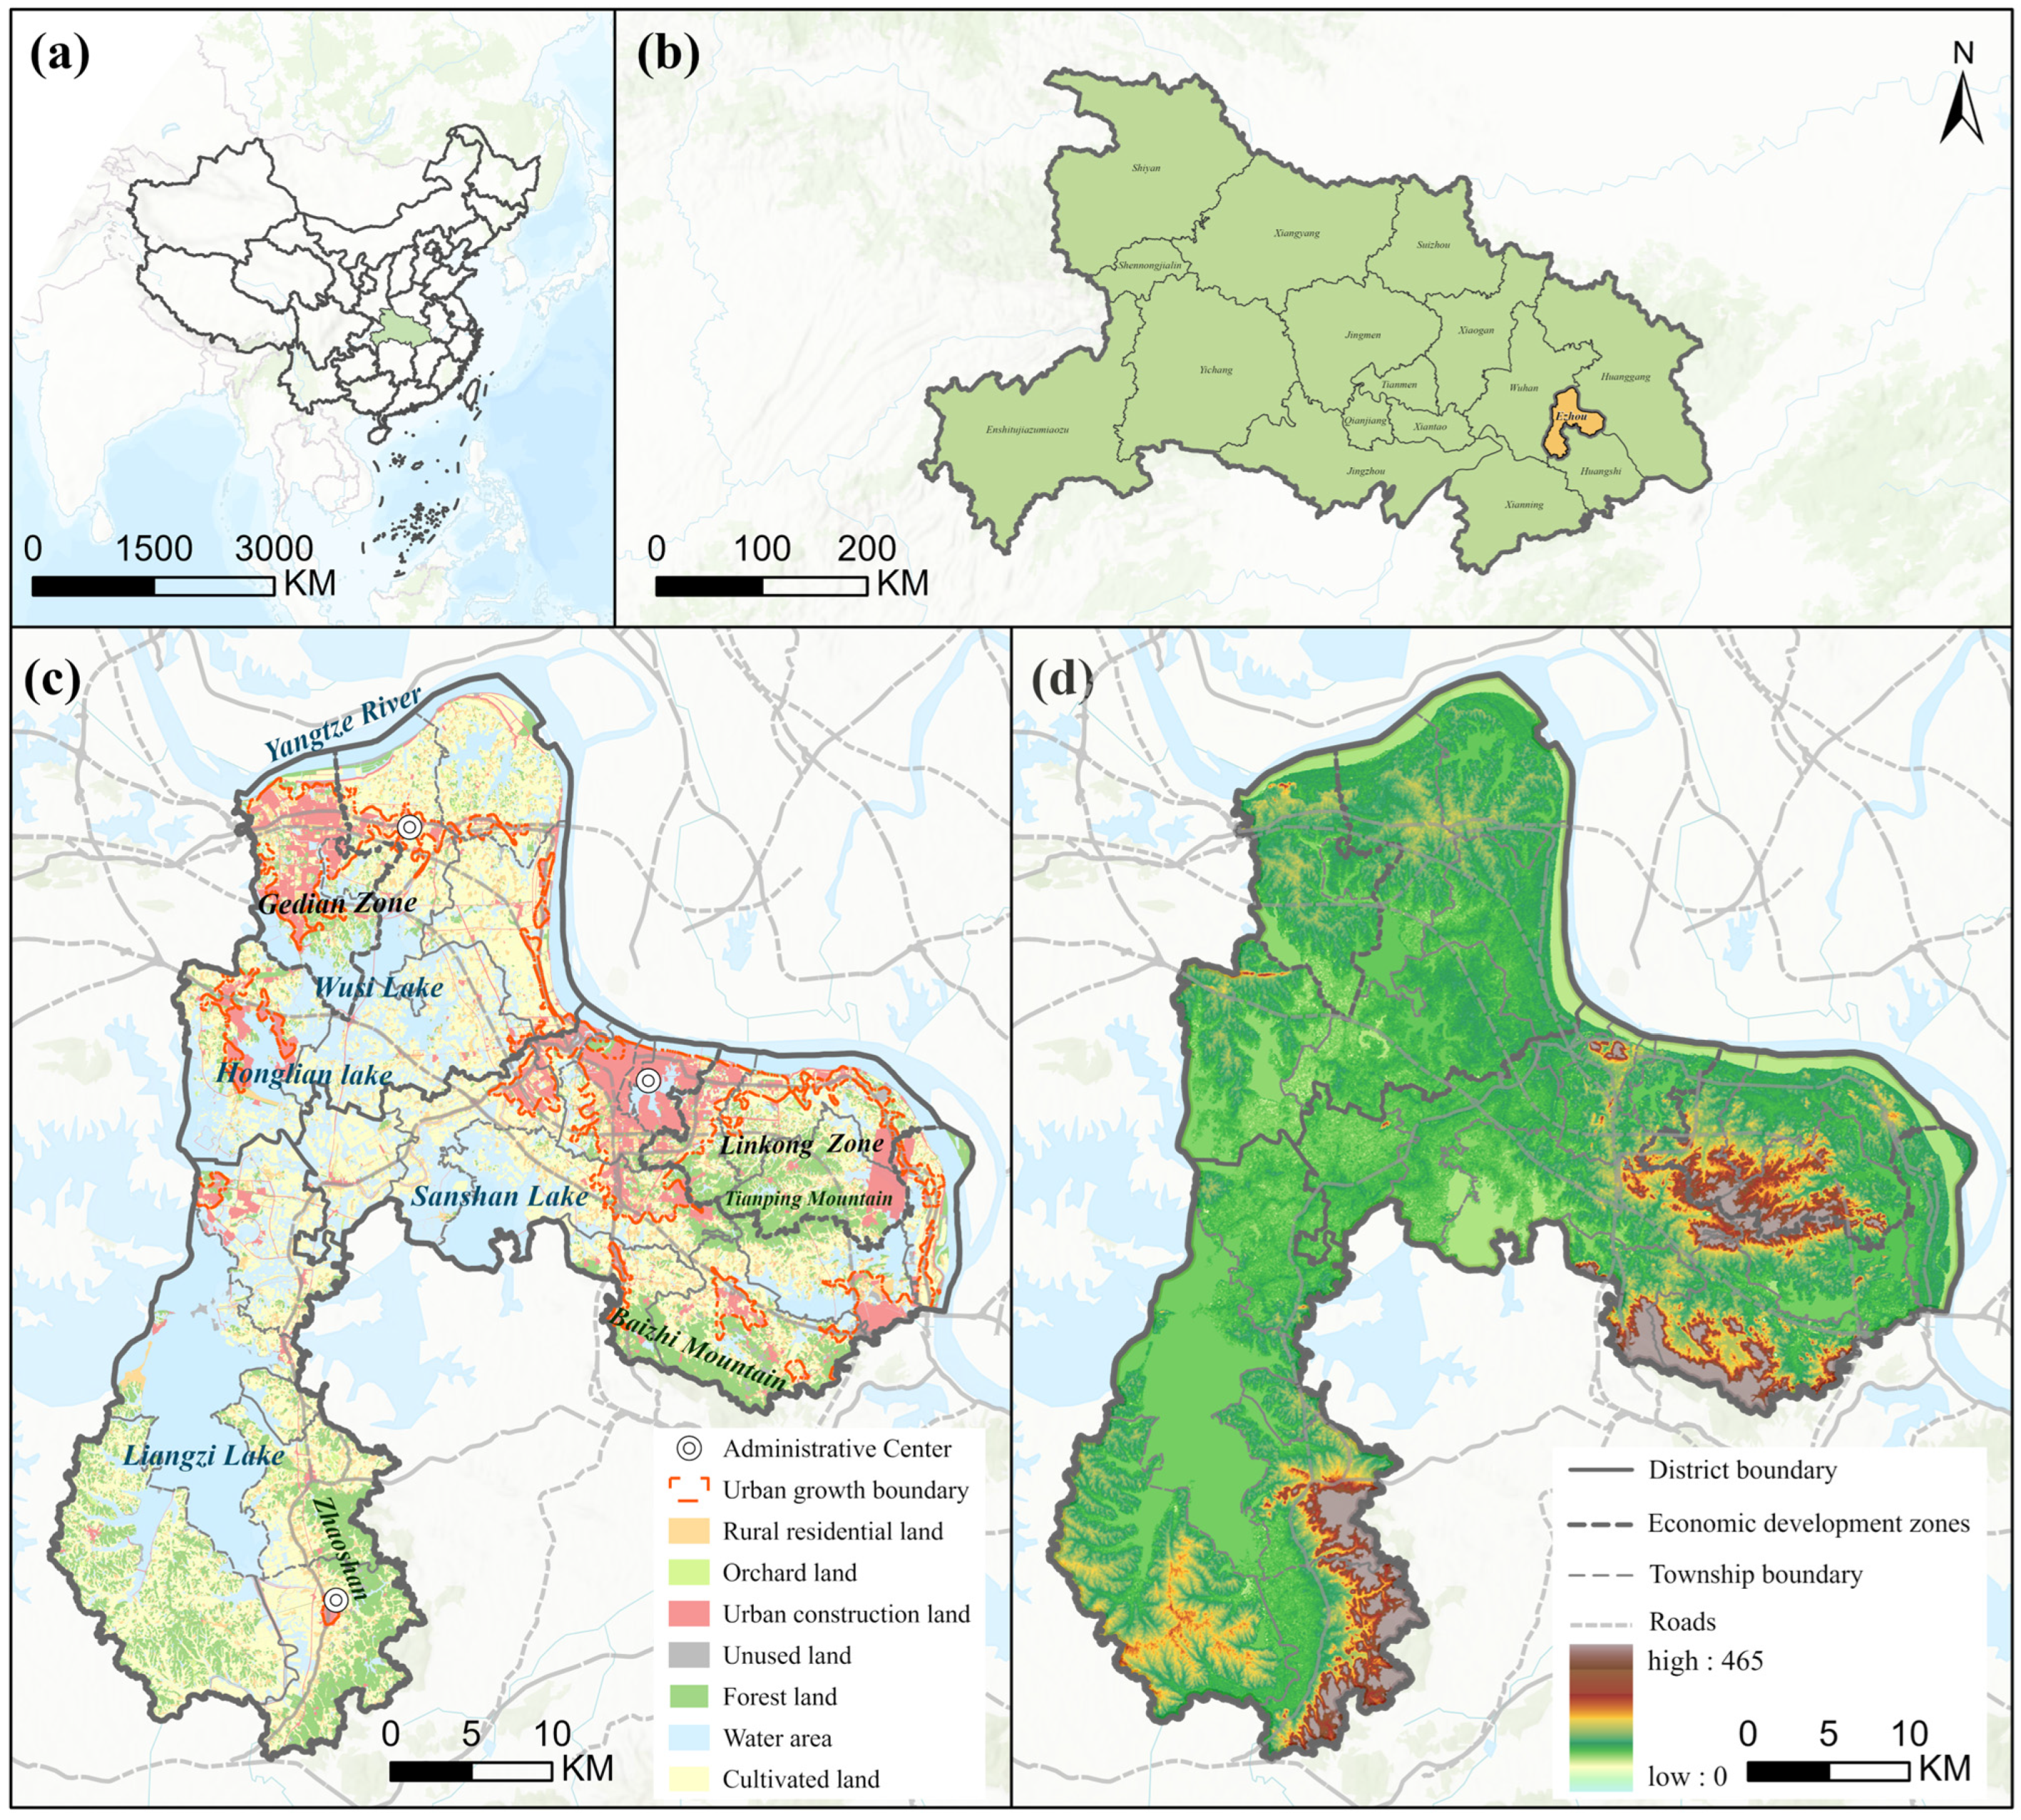
3.1. Study Area

The case study area, Ezhou, is in the middle and lower reaches of the Yangtze River Plain, in the eastern part of Hubei Province, China. The terrain of the study area is high in the southeast and low in the northwest, with a low and flat area in its center. The study area is mainly covered by hilly and plain landscapes (see Figure 2). Ezhou city has three district-level administrative districts, one national-level economic development zone, and one provincial-level economic development zone, with a total of 339 villages. The total area of the study area is 1596.46 km2, of which cultivated land accounts for 30.26%. By the end of 2021, the study area had a population of 1.07 million, with an urbanization rate of 66.72%, and a GDP of RMB 116.23 billion. Ezhou is one of China’s major grain-producing regions, with a wide variety of crops. While maintaining the bottom line of crop production, the study area has largely diversified its agricultural products on cultivated land, such as aquaculture, fruits, vegetables, and floriculture. In recent years, the study area has vigorously promoted urbanization and industrialization, leading to a significant loss of cultivated land. From 2009 to 2020, the area of cultivated land in Ezhou decreased by 14,500 hectares, with an average annual rapid reduction of 1319.89 hectares, due to both the NA and NGU transformation.

3.2. Data Source and Preprocessing

3.2.1. Data Sources

The boundaries for the 339 villages (including communities) in the study area, along with the vector layers for the road networks, water bodies, rural homesteads, and construction land, are obtained from the 2020 Third National Land Survey data for the study area. The cultivated land in 2009 is from the Second National Land Survey data of the study area. The quality of cultivated land parcels is derived from the Cultivated Land Quality Classification Database of the study area. This database classifies cultivated land into 15 grades based on soil fertility, spatial morphology, agriculture infrastructure conditions, and natural factors like terrain and climate. Grades 1–4 are considered premium land with the highest quality, grades 5–8 are high-quality land, grades 9–12 are medium-quality land, and grades 13–15 are low-quality land, each supporting varying crop types and productivity levels. DEM data were obtained from the ALOS Earth Observation Satellite (https://search.asf.alaska.edu/, accessed on 24 July 2023) with a spatial resolution of 12.5 m. The nighttime light data of 2020 are from the Long-term Nighttime Light Dataset of China produced by Zhong et al. (http://www.geodoi.ac.cn/edoi.aspx?DOI=10.3974/geodb.2022.06.01.V1, accessed on 1 August 2023), with a spatial resolution of 1 km. The city- and district-level administrative centers of the study area were from the 2020 National Fundamental Geographic Information Data of China. The permanent farmland layer is provided by the Natural Resources Bureau of the study area. Permanent farmland in China refers to high-quality cultivated land designated by the government for long-term protection, with strict controls on land use to prevent unauthorized conversion or repurposing. Generally, regions with abundant cultivated land tend to have a higher proportion of permanent farmland. The primary purpose of designating permanent farmland is to ensure national food security by safeguarding essential agricultural resources against non-agricultural and non-grain land use, supporting sustainable agricultural development and environmental protection.

3.2.2. Identification of NA and NGU of Cultivated Land in the Study Area

The Chinese government conducted the Second and Third National Land Use Survey program in 2009 and 2019, respectively. The Second and Third National Land Use Surveys demonstrated significant advantages over solely relying on remote sensing interpretation by integrating high-resolution imagery, ground verification, and advanced geospatial technologies. The second survey combined aerial photography with field investigations to enhance classification accuracy, particularly for critical land types such as farmland and construction land, establishing a unified national land use classification system. The third survey further advanced these methods by incorporating high-resolution satellite imagery, GPS technology, and GIS analysis, ensuring precise monitoring of dynamic land use changes. In particular, the third survey further recorded the vegetation types in land parcels that were labeled as cultivated land in the second survey but that were later transformed to non-grain usage, such as livestock, orchards, pastures, and even aquaculture.
Land parcels which were labeled as cultivated land in the Second National Land Survey data, but recorded as used for other agricultural activities (such as aquaculture, sapling, orchards, and floriculture) in the Third National Land Survey data are defined as the NGU of cultivated land induced by converting cultivated land to other agriculture land types [52]. These land plots are regarded as recoverable or restorable for grain cultivation through modest land consolidation and reclamation efforts. Identifying NGU land parcels via this way addresses the limitations of remote sensing, such as misclassification and omission errors, by supplementing it with detailed field validations, resulting in more accurate, reliable, and actionable cultivated land use data that support sustainable management and informed policymaking. The NA transformation of cultivated land was identified as land plots that are cultivated land in the Second National Land Survey but are labeled as construction land in the Third National Land Survey.
The rates of NA or NGU in villages are defined as the ratio of the NA or NGU land area to the total cultivated land area summed from the Second National Land Survey. This study explores the correlation relationship between the NA and NGU of cultivated land observed during 2009–2020 in the study area. The analysis excludes villages (2 in total) where both NA and NGU transformation was not observed, as well as villages (15 in total) largely occupied by reservoirs, fish farms, etc., finally resulting in a total of 322 villages.

3.3. Methodologies

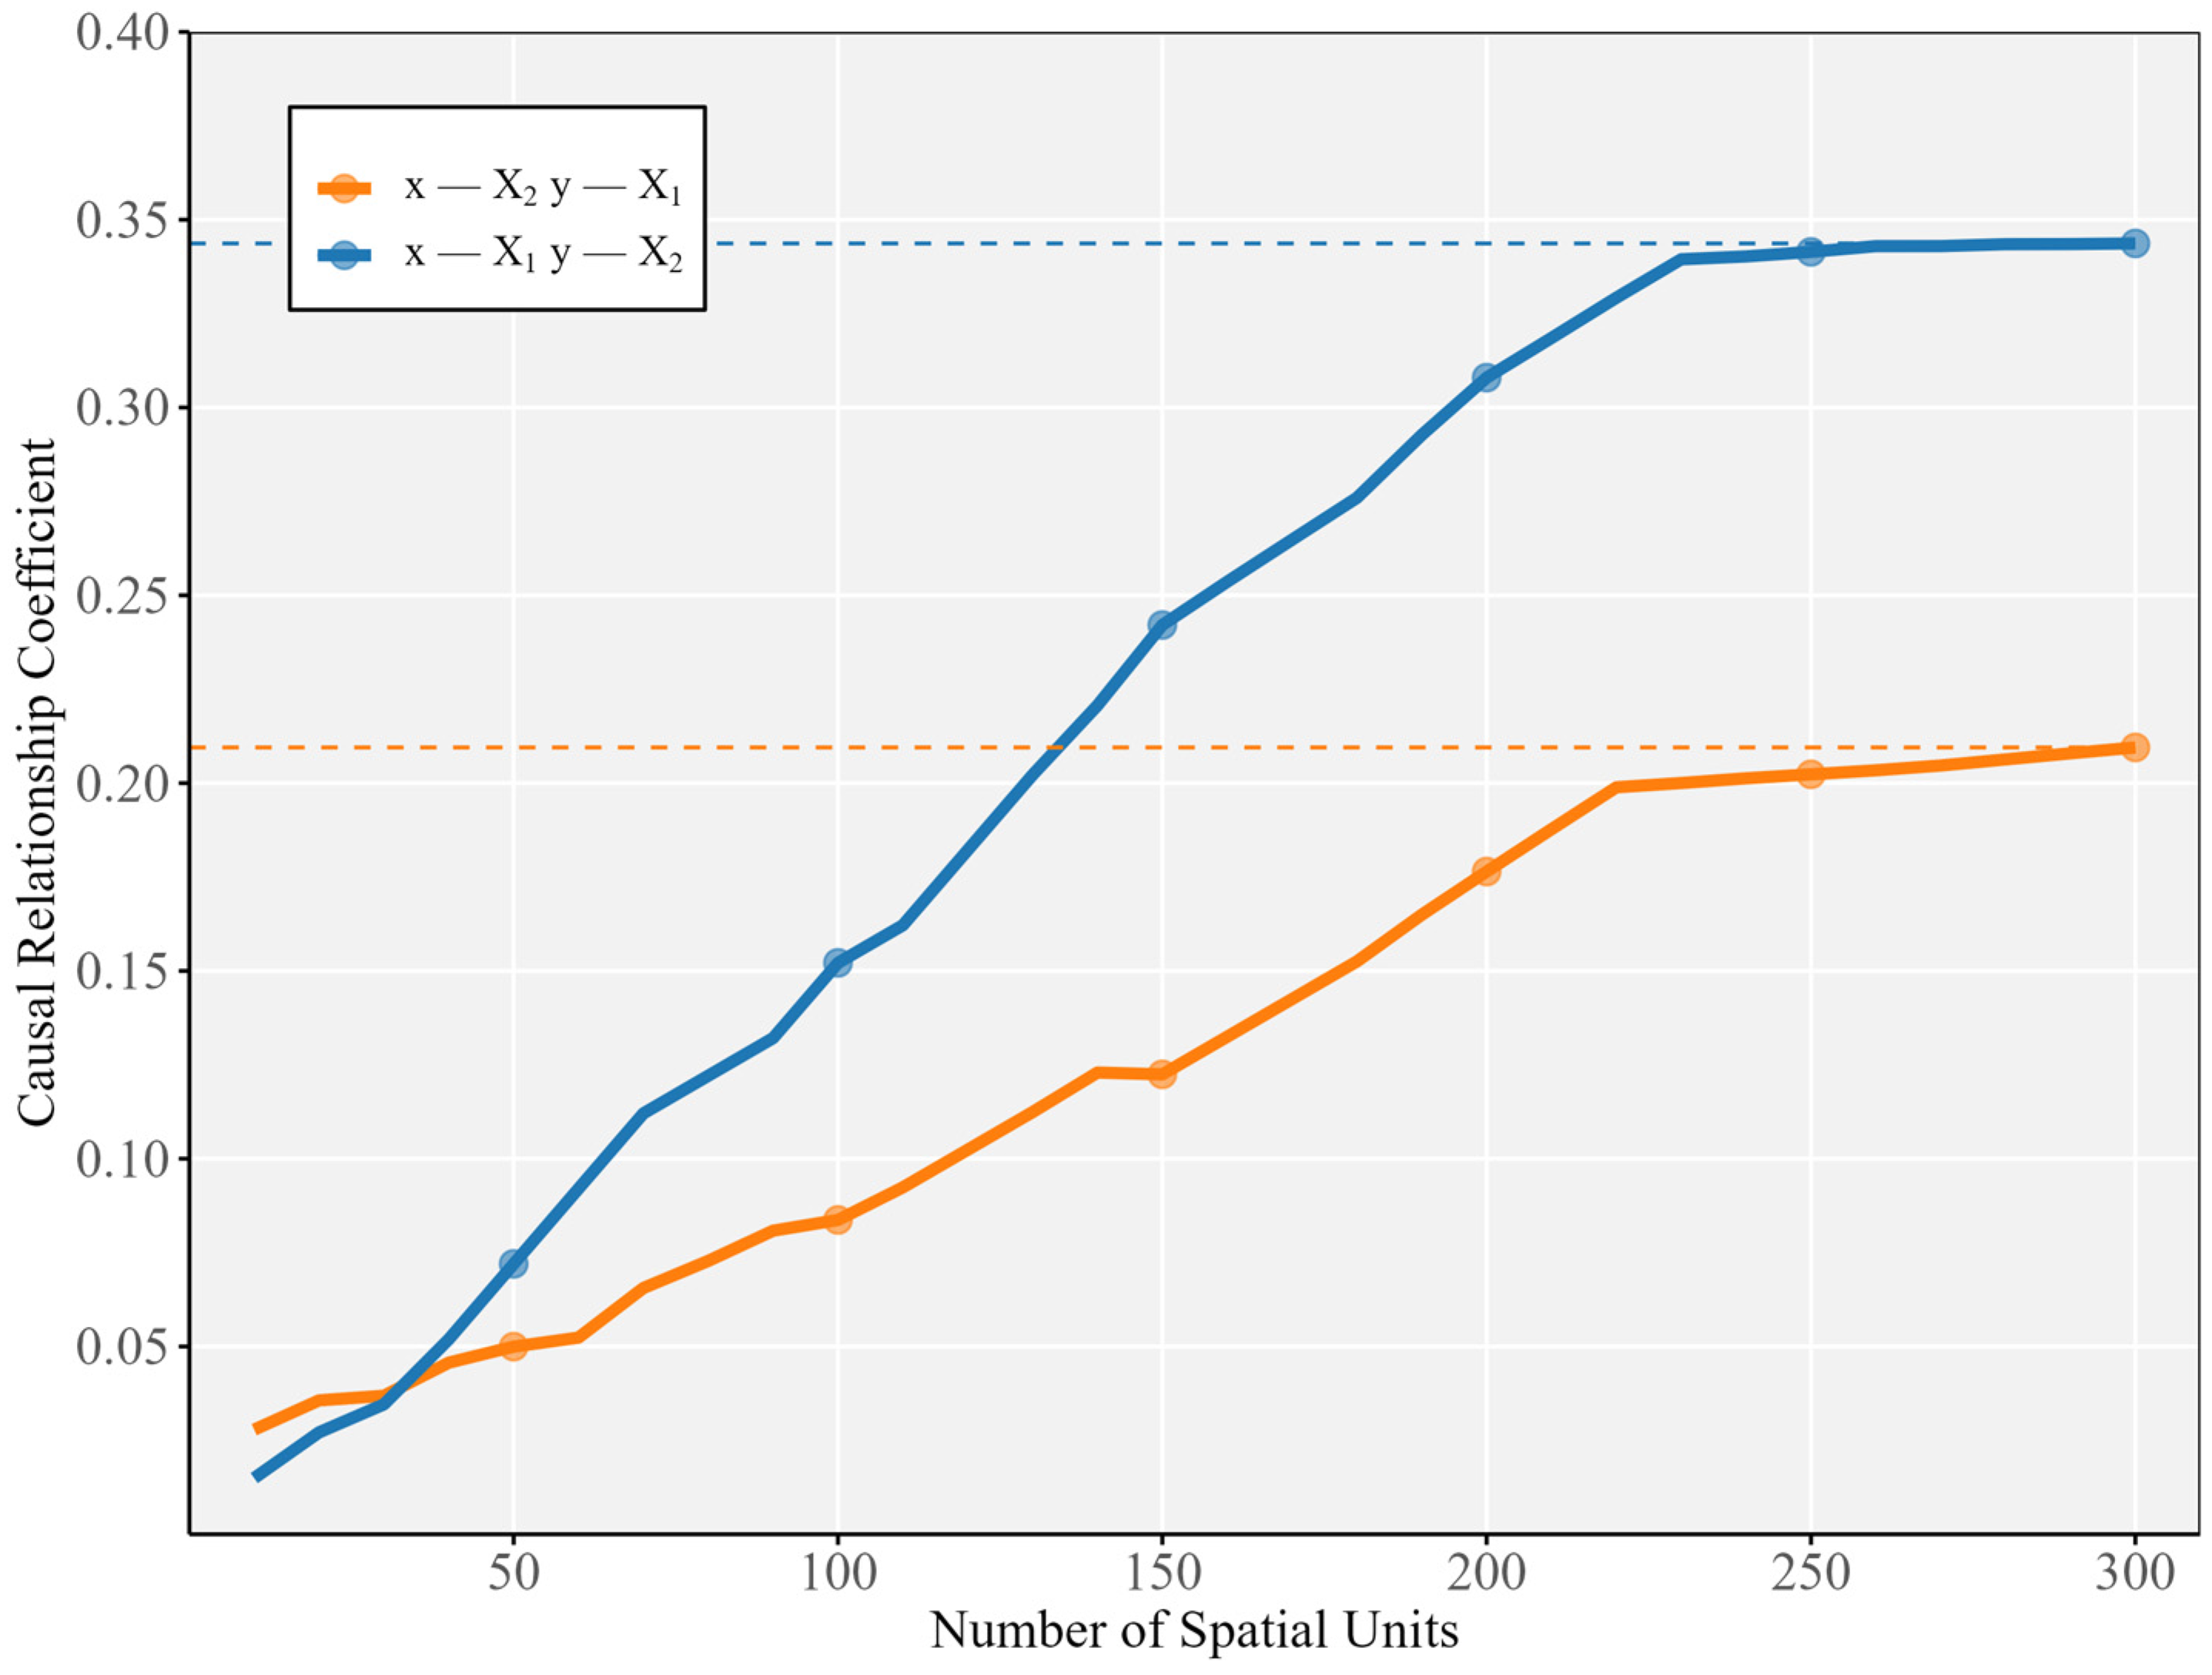
3.3.1. Geographical Convergent Cross Mapping for Identify Causal Correlations

In this study, we use the Geographical Convergent Cross Mapping (GCCM) [36] model to identify the existence of causal correlation between the NA and NGU transformation of cultivated land. The superiority of GCCM in correlation inference lies in its ability to handle spatial cross-sectional data, which traditional temporal models cannot effectively address. To perform causal inference, the GCCM model reconstructs the state space of the system by embedding spatial cross-sectional data, which involves observations from different spatial units at the same time. Based on the generalized embedding theorem, it assumes that if two variables originate from the same dynamical system, their respective states can be mapped onto each other. The model employs cross-mapping prediction, where the value of one variable is predicted using its spatial neighbors, and the strength of the causal relationship is quantified by comparing the prediction accuracy with actual observations. By observing how the prediction skill (measured through a correlation coefficient) converges with increasing spatial observations, GCCM can determine the existence and direction of causality. If variable X reliably predicts variable Y, and not vice versa, X is inferred as the cause. This method allows GCCM to infer both unidirectional and bidirectional causality and is robust against spurious correlations, as it draws from nonlinear relationships. Details for the technique of the GCCM model can be found in the relevant literature [36]. The GCCM model generates a causal inference plot, using the convergence, significance, and confidence intervals of the ρ value (causal coefficient) to determine the existence, direction, and strength of causal relationships. The value of ρ ranges from [0, 1]. When ρ is within [0, 0.2) and the p-value exceeds 0.05, it is considered that there is either no causal relationship or a weak one between the two variables. Conversely, when ρ falls between [0.2,1] and the p-value is less than 0.05, this indicates a strong causal relationship, with larger ρ values suggesting stronger causality. Figure 3 exemplifies the causal correlation between variable X1 and X2 as measured by the GCCM model, showing that X2 exerts a strong inductive (or repulsive) influence on X1, making it a major cause of X1. However, X1 has a weaker inductive (or repulsive) effect on X2.

3.3.2. A Spatial Matching Degree Model for Measuring Correlations

The spatial matching degree model proposed by Shan et al. [53] is used to measure the correlation relationship between the NA and NGU transformation of cultivated land in each village. The formula for calculating the spatial matching degree of a village is as follows:
S M D = P i i m P i × L i i m L i 1 1
where S M D represents the spatial matching degree between NA and NGU transformation in village i ; P i and L i represent the areas of NGU and NA transformation in village i , respectively, and m is the total number of villages (in this study, m = 322 ).
The correlation between NA and NGU in each village is classified into two patterns: synergy or trade-off, based on the ranges of SMD values shown in Table 1. According to Shan et al., a threshold of 0.5 is used for the classification of correlation types of a village to ensure that the number of samples in each category is relatively equal [53]. Furthermore, all villages in the study area are classified into three categories based on the spatial correlation patterns in terms of utilization of cultivated land: non-agricultural-dominated villages, non-grain-dominated villages, and diversified farmland transformation villages.

3.3.3. Spatial Econometric Model

A spatial econometric model is constructed to explore the influencing mechanism of NA and NGU of cultivated land in the study area. The model constructed is as follows [54]:
Y = λ W Y + β X + ϕ W X + μ
μ = ρ W μ + ε
where Y represents the dependent variable, i.e., the non-agriculturalization rate or non-grain utilization rate of cultivated land in the study area; W is the spatial weight matrix; X represents the explanatory variables, i.e., the influencing factors listed in Table 2; μ is the random error term; β reflects the impact of the explanatory variables on the dependent variable; λ represents the influence of the dependent variable in neighboring areas on the dependent variable; ϕ captures the influence of explanatory variables in neighboring areas on the dependent variable; and ρ is the spatial correlation coefficient of the random error term. When ϕ =   ρ   = 0, Equation (2) represents a Spatial Lag Model (SLM); when λ = ϕ = 0, Equation (2) represents a Spatial Error Model (SEM); and when ρ = 0, Equation (2) represents a Spatial Durbin Model (SDM). The specific model to be used depends on the spatial dependence of the data (Moran’s I) and the results of the Lagrange Multiplier Test (LM) and Robust Lagrange Multiplier Test (Robust LM).
In accordance with previous research [28,29], 10 variables (see Table 2) were chosen to perform a spatial regression analysis of the influencing factors of NA and NGU. These variables represent both the preferences of stakeholders and the biophysical and socioeconomic features of cultivated land while also considering the availability of village-level data. Villages located closer to district centers are more likely to experience NA due to increased economic demand and higher land values, making urban expansion more attractive. In contrast, areas further from urban centers may see more NGU as farmers adapt to maximize agricultural returns. Similarly, proximity to rural settlements enhances farming convenience and market access, potentially reducing NA while fostering NGU. Indicators like nighttime light intensity indicate economic development and population density. Higher intensity often correlates with more NA due to increased urban land demand, whereas lower intensity areas may rely more on agriculture, fostering NGU. High densities of construction land reveal greater development, driving NA, while road density can boost both NA and NGU by improving connectivity and market access. Slope and elevation influence agricultural feasibility and costs. Steeper slopes and higher elevations often discourage intensive grain cultivation, favoring NGU, while flatter and lower-lying lands are more conducive to both grain production and NA due to accessibility and development potential. Water accessibility enhances irrigation efficiency, promoting NGU, while high-quality land may deter NGU and retain grain production. Permanent basic farmland policies constrain NA by protecting cultivated land from conversion, but their influence on NGU varies. Farmers may still diversify crops within policy constraints, highlighting the complex interplay of protection measures and economic incentives. Overall, these variables complexly shape the spatial distribution of NA and NGU transformations, reflecting a balance of economic, natural, and policy-driven factors that influence cultivated land use patterns. All variables were standardized to a range of [0, 1]. To remove variables that exhibited multicollinearity, a stepwise regression analysis was applied.

3.3.4. Multinomial Logistic Regression Model

This study employs the multinomial logistic regression (MLR) model [33] to explore the mechanisms of different types of interactive relationship between the NA and NGU of cultivated land, particularly concerning the mechanisms behind the formation of different types of villages. In this context, the dependent variable Y represents the type of village and takes three possible values: 0 (non-agricultural-dominated), 1 (non-grain-dominated), and 2 (diversified farmland transformation). The MLR model generalizes the logistic regression to multiple categories by modeling the probability of each outcome relative to a reference category. For each category j , the probability of the outcome is modeled as follows:
l o g P ( Y = j ) P ( Y = r e f e r e n c e ) = β 0 ( j ) + β 1 ( j ) X 1 + β 2 ( j ) X 2 + + β k j X k
where P ( Y = j ) is the probability of the village type j ; P ( Y = r e f e r e n c e ) is the probability of the reference category (sequentially set for each analysis); β 0 ( j ) , β 1 ( j ) , β 2 ( j ) , , β k ( j ) X k are the regression coefficients for each predictor X 1 ,   X 2 , , X k explaining the influence of factors on village type j . The MLR model helps us to understand how various socioeconomic and land use factors contribute to the likelihood of a village being categorized into one of the three types.

4. Results

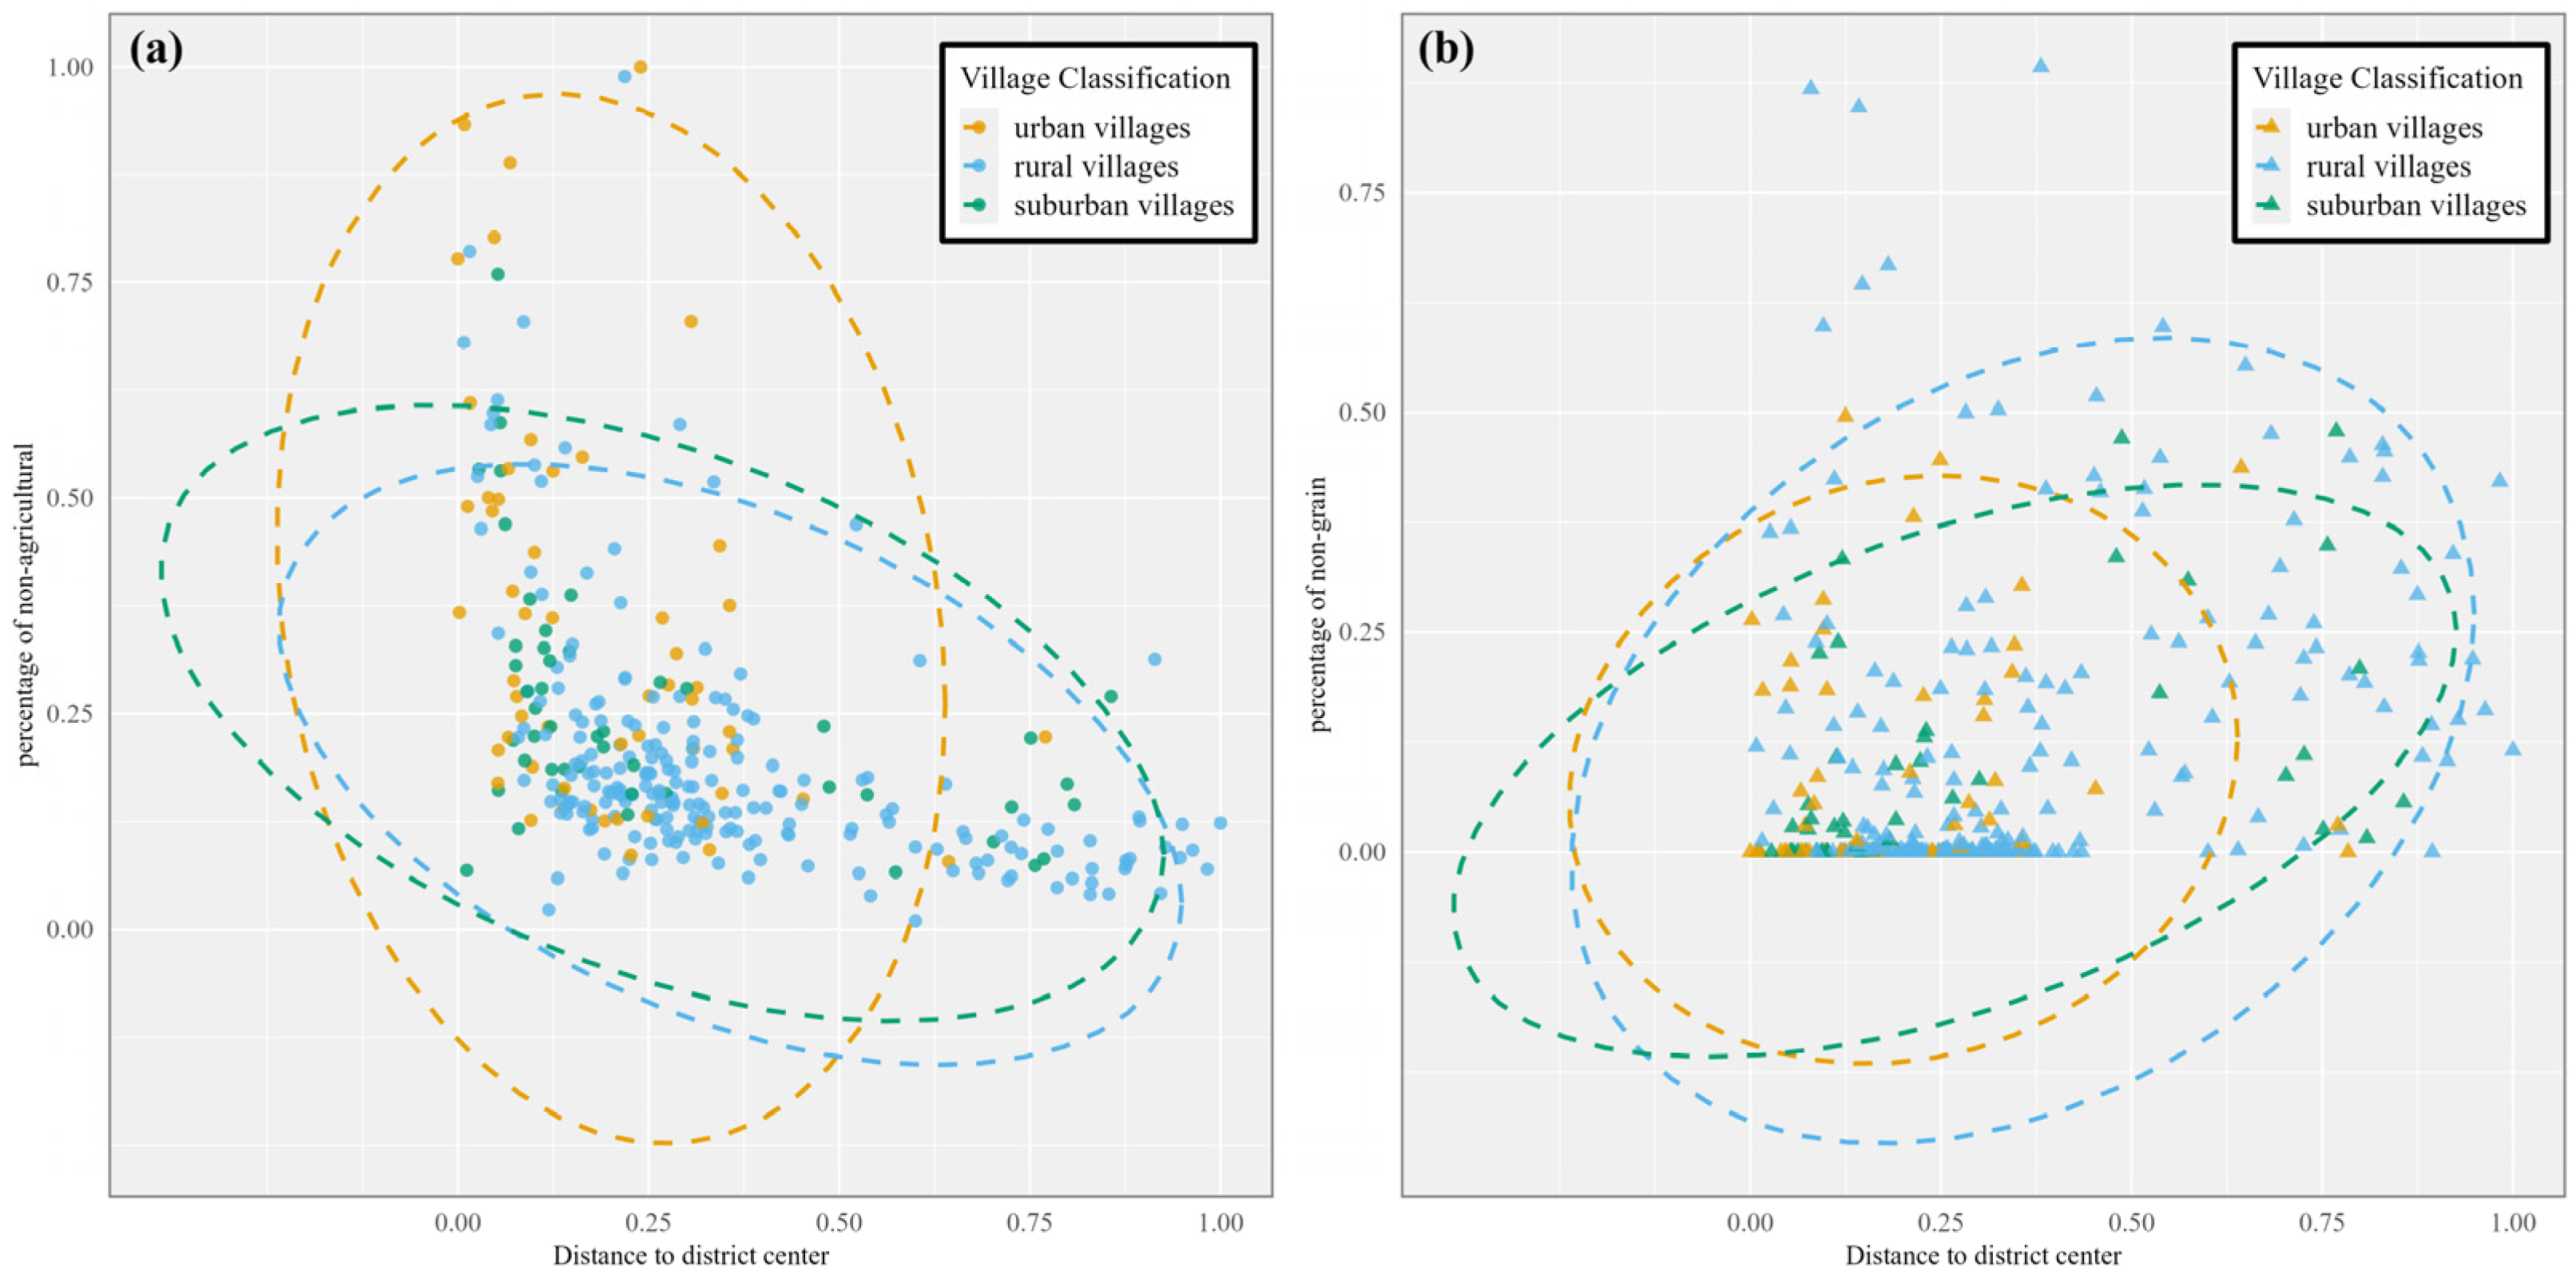
4.1. Spatial Pattern of NA and NGU Transformation in the Study Area

Figure 4 depicts the spatial distribution of NA and NGU transformations of cultivated land in the study area. From 2009 to 2020, the total area of NA transformation amounts to 12,341.26 hectares, representing 19.64% of the cultivated land. In comparison, the total area of NGU transformation is 4776.43 hectares, accounting for 7.6% of the cultivated land area. As shown in Figure 4, villages with high levels of NA are concentrated in the central–western and northwestern urban areas, where intensive urbanization activities have led to apparent NA transformation. In contrast, villages with moderate to high levels of NGU are concentrated in the hinterland rural areas of the study area, particularly around large water bodies and mountainous areas in the southern part. These areas are primarily preserved for grain production and ecological conservation. Under the influence of policies such as “Grain for Green” and the economic benefits of non-grain agricultural activities, NGU is prevalent. Additionally, certain peri-urban villages in the urban–rural transition zones, such as the Honglian Lake Area and the Gedian Development Zone, both have high degrees of NA and NGU transformation. These areas have witnessed the rapid development of rural tourism in the past decade due to the rural revitalization strategy in China, which largely promoted the infrastructure construction (promoting NA transformation) and characteristic agricultural industrialization (promoting NGU transformation).
To further analyze the spatial occurrence of NA and NGU transformation in the study area, all villages are categorized into three groups: urban villages, suburban villages, and rural villages, based on their proximity to the nearest district-level urban centers. A scatter plot is applied to show the relationship between the distance to district center and the rate of NA and NGU of cultivated land in the three groups of villages, as shown in Figure 5. Figure 5 shows a clear negative correlation between the NA transformation of cultivated land and the distance to the district center. The losses of cultivated land due to NA transformation in urban villages, suburban villages, and rural villages are 8097.45, 2111.97, and 2131.84 hectares, respectively, indicating a much stronger correlation in the urban villages. In contrast, NGU transformation exhibits a positive correlation with the distance from the urban areas, with rural villages being most strongly associated with it. The areas of NGU transformation in urban villages, suburban villages, and rural villages amount to 330.10, 710.38, and 3735.95 hectares, respectively. This indicates that the NA and NGU transformations of cultivated land in a village generally present opposite patterns in terms of their distance from the nearest urban centers.

4.2. Factors Influencing NA and NGU Transformation in the Study Area

The statistical test (see details in Supplementary Materials) of the spatial effects in the factors influencing NA and NGU transformation in the study area indicate that the SEM should be chosen for analyzing the influencing factors of NA transformation, and SLM for NGU transformation. Table 3 shows the results of the SEM, considering the spatial error effects of the NA transformation of cultivated land. Among the socioeconomic factors, the density of construction land and intensity of nighttime light are key factors that have a significant positive effect on NA transformation. In contrast, the location-related factors, such as the distance to district center and convenience of grain production, are negatively correlated with NA transformation, suggesting that cultivated land closer to district centers but farther from human settlement is more likely to be occupied by construction land. Among the natural factors, the elevation and the quality of cultivated land have a more pronounced impact on NA transformation. In general, flat terrain, fragmented land, and low-quality cultivated land are more prone to NA transformation. Furthermore, the area of permanent basic farmland in a village is negatively correlated with NA transformation, indicating that policy restriction can, to some extent, hinder the NA process, effectively limiting urban expansion and protecting cultivated land.
Table 4 presents the results of the SLM, considering the spatial lag effects of the NGU of cultivated land in the study area. The influence of natural factors on NGU transformation is pronounced. Factors such as accessibility to water, the proportion of cultivated land, and the quality of cultivated land have significant impacts, indicating that limited water accessibility, fragmented land parcels, and higher quality land are more likely to be used for non-grain crop cultivation. However, average elevation is positively correlated with NGU transformation, suggesting a shift of cultivated land toward hilly areas, but its effect is not significant. This implies that even in plain areas where large-scale farming is being promoted, there is a particular trend toward NGU transformation. The regression coefficients for distance to district center, convenience of grain production, and density of construction land suggest that location-related and socioeconomic factors have a negative impact on transformation to NGU.
Regions with larger areas of permanent basic farmland are subject to stricter protection policies and regulations and are expected to maintain their original grain-production use rather than being converted into NGU, such as orchards or forests. However, in the study area, a positive correlation was observed between the extent of permanent basic farmland and NGU transformation. This suggests that while the protection policies initialized for controlling NA transformation are in place, they lack sufficient effectiveness in limiting NGU transformation, highlighting the need for policy strengthening and reforming in the study area.
The spatial regression analysis in Table 3 and Table 4, in general, shows that locational and socioeconomic factors have distinctive effects on the NA and NGU of cultivated land. Villages close to urban centers have the advantages of economic development, which makes cultivated land more prone to NA transformation to meet the land demands of urban expansion. In contrast, villages farther from urban areas generally are less developed and have poor infrastructures due to constraints in urban planning and regional conditions, and thus they are more reliant on agricultural development. Due to the low net returns from grain crops, farmers are more inclined to planting other high-value products on cultivated land, thus increasing their income. Natural factors such as accessibility to water, the quality of cultivated land, and the proportion of cultivated land have a more significant impact on NGU transformation. Similarly, in the case of NA, the quality and proportion of cultivated land play a critical role in retaining its agricultural use.
Policy factors, through the delineation of permanent farmland, have had a significant inhibitory effect on NA to some extent, restricting urban expansion from encroaching on cultivated land. However, the effectiveness of this policy in preventing NGU transformation was less notable. This is because the initial objective of delineating permanent farmland during the study period (2009–2020) is mainly intended to protect cultivated land from urbanization and industrialization, and has not yet been refined to regulate the use of cultivated land for other agricultural activities. During the study period, the net income per hectare in the study area differed significantly among different crops. Rice generated the lowest income at RMB 9400 per hectare, significantly less than sugarcane at RMB 19,700, citrus at RMB 44,000, eucalyptus at RMB 37,500, and mulberry at RMB 69,500 per hectare, highlighting a considerable disparity in profitability among these crops. Due to these profit differences, farmers are inclined towards NGU in their planting decisions. Although cultivated land protection policies explicitly prohibit non-grain production on permanent farmland, the effectiveness of the policy was undermined due to inadequate enforcement by local governments, with frequent issues such as insufficient oversight and lax enforcement.
The above analysis highlights the varying effects of locational conditions, socioeconomic factors, natural conditions, and policy enforcement on the NA and NGU of cultivated land, laying the groundwork for understanding changes in cultivated land use. However, NA and NGU often coexist in the same region and are significantly interrelated, resulting in complex patterns of transformation. Research focusing on a single aspect may not only lead to biased assessments of the current state and trends of cultivated land loss, failing to adequately reflect policy effectiveness, but may also overlook the complexity of interactions between NA and NGU. This limited perspective can result in an incomplete understanding of regional farmland use changes, making it challenging to meet the practical needs of effective land management and provide meaningful guidance for multi-objective land use. Therefore, the following section will examine the spatial interaction patterns and mechanisms of NA and NGU from an integrated perspective, clarifying how different factors influence their spatial correlation patterns. This investigation aims to provide practical insights into the causal relationships and potential trade-offs and synergies within complex land use systems, thereby helping decision-makers balance the competing demands of urban expansion and agriculture production, especially food production.

4.3. Correlation Between NA and NGU of Cultivated Land in the Study Area

We use the GCCM model to infer the correlation relationship between the NA and NGU transformation of cultivated land. The results from the GCCM model (Figure 6) show a significant bidirectional correlation between the two in the study area. The causal coefficient from NA transformation to NGU is 0.24 (p < 0.01), while the coefficient from NGU to NA is 0.13 (p < 0.05), both of which are statistically significant. The findings show that there is a negative bidirectional causal correlation between NA and NGU transformation in the study area. Furthermore, the repulsive effect of NA on NGU transformation is stronger than the reverse. This is primarily because in urban villages with higher rates of NA, cultivated land is mostly converted to urban residential and industrial use, accounting for 55% of the NA land area. The economic benefits derived from these urbanized uses far exceed those from agricultural production, thus creating greater resistance to NGU transformation in these villages. In contrast, although rural villages with higher rates of NGU have relatively less economic development and industrial growth, the demand for rural infrastructure and improved living conditions driven by rural revitalization policies has, to some extent, also led to the occupation of cultivated land for public facilities and rural settlement.
Furthermore, we use the spatial matching degree index to quantify the type of correlation relationship between NA and NGU transformation in different villages. Afterward, based on the spatial matching degree index, all villages in the study area are classified into three categories based on the correlation relationship: non-agricultural-dominated villages, non-grain-dominated villages, and diversified farmland transformation villages, as shown in Figure 7. Using the identified key factors that significantly influence both NA and NGU as independent variables, and the type of correlation as a dependent variable, a MLR method is applied to identify and analyze the key factors that shape different types of villages with varying types of correlation between NA and NGU transformation. The results of MLR are shown in Table 5.
The MLR results in Table 5 reveal key differences in factors driving different types of villages with differing correlation relationships of NA and NGU transformation. For non-agricultural-dominated villages, proximity to the nearest urban center shows a significant negative impact, indicating that villages closer to urban areas are more likely to convert cultivated land to non-agricultural uses. The convenience of grain production and density of construction land also show significant positive impacts, suggesting that areas with better accessibility and higher development density are more prone to non-agricultural transformation. For non-grain-dominated villages, the distance to district center has a significant positive impact, implying that villages farther from urban centers are more likely to engage in non-grain crop cultivation. Water accessibility is negatively significant, showing that areas with less access to water are more likely to shift to non-grain farming, possibly due to reduced suitability for traditional agriculture. Construction land density also shows a significant negative effect, indicating that areas with lower development intensity are more likely to maintain non-grain agricultural activities. For diversified farmland transformation villages, none of the factors show significant influence, indicating a more complex and balanced transition dynamic where neither proximity to urban areas nor agricultural practices dominate the land use changes. In summary, proximity to urban centers plays a critical role in distinguishing between NA and NGU, with urban expansion driving non-agricultural use and distant areas leaning toward non-grain cultivation.

5. Discussion

5.1. Mechanism of Correlation Between NA and NGU Transformation of Cultivated Land

The internal mechanisms behind the formation of different types of villages with varying relationships between NA and NGU (as shown in Figure 8) reveals that the interaction between NA and NGU is primarily determined by locational conditions, influenced by socioeconomic and natural environmental factors, and regulated by policy mechanisms. This results in two spatial relationships—trade-off and synergy—which manifest in three spatial distribution patterns. The formation of non-agricultural-dominated villages is mainly driven by locational conditions and socioeconomic factors, where high-value land near urban areas is more likely to be converted to non-agricultural uses. Non-grain-dominated villages are found in areas farther from cities with lower agricultural productivity, where land marginalization and natural environmental constraints, along with land protection policies, lead to the use of non-grain crops to increase economic returns. In contrast, diversified farmland transformation villages emerge in regions with favorable locational, socioeconomic, and natural conditions, where multiple development needs coexist, resulting in multifunctional land use. In this process, the trade-off relationship primarily reflects the choice between urban and rural economic demands and agricultural returns, while the synergies relationship arises from the need for joint economic and agricultural development in suburban areas.
In non-agricultural-dominated villages, there is a trade-off relationship between NA and NGU, with NA being significantly higher. The large regression coefficients for distance to district center, construction land density, and nighttime light intensity indicate that locational and socioeconomic factors are the primary drivers of the formation of non-agricultural-dominated villages. The negative effects of the proportion of cultivated land and land quality further support the idea that cultivated land near urban areas is prioritized for meeting non-agricultural demands due to urban expansion and high levels of economic activity [55], significantly squeezing the space for agricultural development. This creates a trade-off between NA and NGU.
In non-grain-dominated villages, a similar trade-off exists, but NGU is much higher than NA. The significant negative impact of locational (distance to the district center, convenience of grain production) and socioeconomic factors (low construction land density, nighttime light intensity) suggest that these villages are at a locational and socioeconomic disadvantage compared to other areas, limiting the space for NA development. Strict policies, such as permanent basic farmland protection and the requisition–compensation balance, tightly regulate the quantity of cultivated land, though they may alter its spatial distribution. Some cultivated land is gradually shifting toward hilly areas, prompting farmers to maximize the use of limited resources by planting high-value non-grain crops to increase net income, making NGU the primary choice.
The formation of diversified farmland transformation villages results from the combined effects of flexible locational and socioeconomic conditions, balanced natural conditions, and weaker policy restrictions. In these villages, NA and NGU coexist in a coordinated manner, allowing for diverse land use practices that meet agricultural production needs while also adapting to certain non-agricultural uses, forming a diversified land use pattern.

5.2. Spatial Correlation Between NA and NGU of Cultivated Land in Other Cities of China

In this research, we additionally select another two cities, Wuhan and Xining, to further confirm the correlation between the NA and NGU transformation of cultivated land. Wuhan is a highly urbanized city in central China, and Xining is on the Qinghai–Tibet Plateau. As a national central city, Wuhan has experienced rapid socioeconomic development and urban expansion in the past decades, creating intense land use conflicts between farmland protection and urban development [56]. Xining is located in a less developed region with a fragile ecosystem, and provides various functions and services. The agricultural activity in Xining is very limited by geographical and climatic conditions [57,58]. The two study cases allow for the further validation of the correlation between NA and NGU transformation across diverse geographies.
In Wuhan, the causal correlation effect of NA transformation on NGU is 0.23, while the effect of NGU transformation on NA is 0.27 (see details in Supplementary Materials). In Xining, the causal correlation effect of NA transformation on NGU is 0.21, while the reverse effect is 0.07 (see details in Supplementary Materials). The significant bidirectional exclusion effect between NA and NGU in Wuhan indicates a strong conflict between rapid urban expansion and cultivated land conservation in recent years [58,59]. This has led to the occupation of cultivated land for urban growth, further shrinking the space for agricultural development. Meanwhile, under the farmland requisition–compensation balance policy, cultivated land previously near urban areas has shifted to suburban areas, widening the urban–rural gap and pushing farmers to choose non-grain crops to increase income. In Xining, the prevailing fragile natural conditions have largely limited the available land for urban and agriculture development. Therefore, land close to urban areas with favorable natural and geographical conditions is prioritized for urban development, which is a similar pattern to that observed in Wuhan and Ezhou. Also, land in suburban areas is constrained by both natural and climate limitations, resulting in lower levels of agriculture production activities; therefore, both NA and NGU transformation is low. Their correlation is insignificant as a result.
The above two case studies further indicate that although regional backgrounds, economic development, and administrative polices can influence the correlation between NA and NGU transformation, to some extent, the correlation between the two is general universal. Differences in critical driving factors of the two kinds of transformations are the main reason for trade-off correlations, while commonalities of critical driving factors foster synergy correlations. Therefore, integrated cultivated land management strategy should be considered to tailor policies for different types of villages based on varying correlation patterns between NA and NGU, as well as different driving mechanisms.

5.3. Policy Implications for Cultivated Land Protection and Management

Globally, many developing countries face challenges like China in the protection and management of cultivated land, including issues related to NA and NGU in regions with differing urban and rural conditions [60,61]. Moreover, under the pressure of retaining the quantity of cultivated land, problems such as land abandonment and low utilization efficiency continue to emerge [62]. Also, balance between food security and dietary structure diversification requires the more reasonable consideration and management of the NGU transformation. Based on the understanding of the spatial pattern and correlation relationships of NA and NGU in China, this study can offer potential approaches for cultivated land protection and management that may provide valuable references for other countries.
First, the spatial arrangement of cultivated land should be optimized through spatial planning [63]. The findings demonstrate that urban areas prioritize the non-agriculturalization of cultivated land due to higher economic returns, leading to the spatially fragmented and dispersed distribution of cultivated land, which results in low utilization efficiency and challenges for large-scale development. To address this, global policy interventions should focus on integrating urban planning with agricultural land protection, thus consolidating and integrate cultivated land into contiguous blocks, thereby improving its productive use [64]. In addition, urban development boundaries can be delineated to contain sprawl and preserve agricultural zones [65]. Incentives for vertical urban development and urban land recycling can minimize the need for outward expansion. In hinterland rural areas, although cultivated land is relatively spatially concentrated, its utilization is often constrained by the dominance of smallholder farmers and decentralized decision-making processes [38]. This limits the adoption of intensive farming practices. To address these challenges, land transfer should be promoted to facilitate land consolidation [66,67]. Mechanisms such as land banking and consolidated land use planning can reduce fragmentation and enhance land use efficiency, fostering a balance between urbanization and agricultural sustainability [68].
Second, cultivated land protection and management policies should coordinate the dual objectives of maintaining the food security baseline and accommodating dietary transformation needs [69]. The results indicate that suburban zones serve as critical regions for coordinated NA and NGU, showcasing synergistic interactions. Policymakers can use this insight to establish flexible land use zoning systems. Land allocation for grain and non-grain usage must be determined based on population dynamics, dietary structure changes, and variations in per-unit yields of cultivated land under the context of dietary diversification. When evaluating regional cultivated land resources and quality, rigid control zones and flexible adjustment zones should be delineated, with explicit rules for differentiated use. The rigid control zones could act as the safeguard for food security, ensuring that high-quality cultivated land is strictly protected and dedicated to long-term grain production. Rigorous control measures should be implemented to maintain stable and continuous agricultural output in these areas. The flexible adjustment zones should focus on maintaining stable topsoil quality and the recoverability of grain production capacity. Under these conditions, a positive and negative list of permissible crops should be established, allowing for feasible non-grain utilization [70]. Policies should encourage the reasonable cultivation of vegetables, fruits, and other high-value crops to meet the diverse dietary needs of residents. This zoning approach not only aligns with the need for staple food security but also promotes dietary diversity while broadening income opportunities for farmers. It seeks to achieve a balance between food security and the agricultural diversification necessary for evolving dietary patterns.
In addition, the findings reveal that the effectiveness of land use regulations varies significantly, with urban expansion often undermining cultivated land protection. Strengthening policy enforcement mechanisms is crucial. For instance, remote sensing and GIS technologies can be deployed for the real-time monitoring of land use changes [71], ensuring compliance with zoning regulations and identifying unauthorized land conversions. Moreover, suburban areas where NA and NGU synergistically interact require integrated policy approaches. By fostering multifunctional land use practices, such as agritourism or urban agriculture, these zones can serve as models for balancing urban development with agricultural innovation. Policymakers should support infrastructure development, such as roads and market access, to enhance the viability of diversified land use patterns in these transitional regions [72]. Finally, in recognizing the diverse dynamics of NA and NGU across regions, policy frameworks must be flexible and adaptive. Internationally, governments should focus on capacity building for local institutions, enabling them to implement region-specific policies effectively [73,74]. Regular policy reviews informed by empirical studies can ensure that land use regulations remain relevant and responsive to changing economic, social, and environmental conditions.

6. Conclusions

This study systematically explores the spatial interaction patterns and mechanisms of NA and NGU transformation of cultivated land, offering novel insights into the complexities of land use transitions. The findings reveal both trade-offs and synergies in the spatial correlation between NA and NGU, shaped by locational, socioeconomic, natural, and policy factors. Specifically, urban areas prioritize NA due to higher economic returns, limiting NGU transformations, while rural areas emphasize NGU as a strategy to enhance land use efficiency under natural and socioeconomic constraints. Suburban zones emerge as key regions for coordinated development, where both NA and NGU interact synergistically to meet diverse demands.
Using Ezhou City as a case study, the research adopts causality inference methods, spatial econometric models, and multinomial logistic regression analysis to quantify the interplay between NA and NGU and identify their respective driving factors. The results emphasize the importance of regional differentiation in land management strategies, addressing the distinct dynamics observed in urban, rural, and transitional zones. These findings underscore the need for integrated cultivated land protection policies that balance food security with economic development, aligning land use practices with evolving societal and dietary demands. This study contributes to a deeper understanding of cultivated land transitions, offering valuable theoretical and empirical guidance for optimizing cultivated land utilization. By examining the interaction between NA and NGU, this research supports the development of tailored policies that enhance agricultural sustainability, promote efficient land use, and facilitate the implementation of China’s new “comprehensive requisition–compensation balance” policy. These insights provide practical references for other regions and countries facing similar challenges in cultivated land use governance and management.
Although, this study provides valuable insights into the spatial interaction patterns and mechanisms of NA and NGU of cultivated land, certain limitations should be acknowledged. First, the analysis primarily focuses on a single case study, limiting the generalizability of the findings to regions with varying socioeconomic and natural conditions. Second, while the research identifies key driving factors, the interplay between policy implementation and individuals’ behavior requires further exploration. Future research should focus on cross-regional comparative studies to validate the spatial patterns and mechanisms identified in this study. Longitudinal data analysis could provide deeper insights into the temporal evolution of NA and NGU and their policy implications. Additionally, integrating high-resolution remote sensing data and participatory approaches can enhance the understanding of the micro-level drivers of land use decisions, contributing to more robust and adaptive land management strategies. These efforts will support the development of comprehensive frameworks to address the challenges of cultivated land protection and sustainable agricultural development globally.

Supplementary Materials

The following supporting information can be downloaded at https://www.mdpi.com/article/10.3390/land14051031/s1, Table S1. Statistical test results of spatial effects. Figure S1. Degree of Non-Agriculturalization and Non-Grain Utilization of Cultivated Land in villages of Wuhan ((a) degree of Non-Agriculturalization of Cultivated Land; (b) degree of Non-Grain Utilization of Cultivated Land; (c) Land use and land cover of Wuhan in 2020). Figure S2. Correlation relationship detection between Non-Agriculturalization and Non-Grain Utilization of Cultivated Land in Wuhan based on GCCM model. Figure S3. Degree of Non-Agriculturalization and Non-Grain Utilization of Cultivated Land in villages of Xining ((a) degree of Non-Agriculturalization of Cultivated Land; (b) degree of Non-Grain Utilization of Cultivated Land; (c) Land use and land cover of Xining in 2020). Figure S4. Correlation relationship detection between Non-Agriculturalization and Non-Grain Utilization of Cultivated Land in Xining based on GCCM model.

Author Contributions

Conceptualization, Y.W.; methodology, Y.W. and J.Y.; software, Y.W.; validation, D.S. and C.L.; formal analysis, M.Y.; investigation, Y.W. and D.S.; resources, J.G.; data curation, S.L.; writing—original draft preparation, Y.W.; writing—review and editing, J.Y.; visualization, S.L.; supervision, J.Y.; project administration, J.G.; funding acquisition, J.Y. All authors have read and agreed to the published version of the manuscript.

Funding

This study was supported by the National Natural Science Foundation of China (No. 42101275) and the Provincial Natural Science Foundation of Hubei, China (No. 2023AFB651).

Data Availability Statement

The data that support the findings of this study are available from the corresponding author upon reasonable request.

Conflicts of Interest

The authors declare no conflicts of interest.

References

  1. Qiu, B.; Hu, X.; Chen, C.; Tang, Z.; Yang, P.; Zhu, X.; Yan, C.; Jian, Z. Maps of cropping patterns in China during 2015–2021. Sci. Data 2022, 9, 479. [Google Scholar] [CrossRef] [PubMed]
  2. Zhang, W.; Qie, R. Spatiotemporal change of cultivated land in China during 2000–2020. PLoS ONE 2024, 19, e0293082. [Google Scholar] [CrossRef] [PubMed]
  3. Zhao, S.; Yin, M. Change of urban and rural construction land and driving factors of arable land occupation. PLoS ONE 2023, 18, e0286248. [Google Scholar] [CrossRef] [PubMed]
  4. Lan, Y.; Xu, B.; Huan, Y.; Guo, J.; Liu, X.; Han, J.; Li, K. Food Security and Land Use under Sustainable Development Goals: Insights from Food Supply to Demand Side and Limited Arable Land in China. Foods 2023, 12, 4168. [Google Scholar] [CrossRef]
  5. Deng, X.; Huang, J.; Rozelle, S.; Zhang, J.; Li, Z. Impact of urbanization on cultivated land changes in China. Land Use Policy 2015, 45, 1–7. [Google Scholar] [CrossRef]
  6. Gong, B. Agricultural reforms and production in China: Changes in provincial production function and productivity in 1978–2015. J. Dev. Econ. 2018, 132, 18–31. [Google Scholar] [CrossRef]
  7. He, C.; Liu, Z.; Xu, M.; Ma, Q.; Dou, Y. Urban expansion brought stress to food security in China: Evidence from decreased cropland net primary productivity. Sci. Total Environ. 2017, 576, 660–670. [Google Scholar] [CrossRef]
  8. Wijesingha, J.; Astor, T.; Nautiyal, S.; Wachendorf, M. Spatial Patterns and Characteristics of Urban—Rural Agricultural Landscapes: A Case Study of Bengaluru, India. Land 2025, 14, 208. [Google Scholar] [CrossRef]
  9. Pravalie, R.; Patriche, C.; Borrelli, P.; Panagos, P.; Rosca, B.; Dumitrascu, M.; Nita, I.; Savulescu, I.; Birsan, M.; Bandoc, G. Arable lands under the pressure of multiple land degradation processes. A global perspective. Environ. Res. 2021, 194, 110697. [Google Scholar] [CrossRef]
  10. Qu, F.; Chen, J.; Chen, W. Theoretical and Empirical Study on the Land Conversion Economic Driving Forces. J. Nat. Resour. 2005, 20, 231–241. [Google Scholar]
  11. Lin, L.; Ye, Z.; Gan, M.; Shahtahmassebi, A.; Weston, M.; Deng, J.; Lu, S.; Wang, K. Quality Perspective on the Dynamic Balance of Cultivated Land in Wenzhou, China. Sustainability 2017, 9, 95. [Google Scholar] [CrossRef]
  12. Liu, L.; Liu, Z.; Gong, J.; Wang, L.; Hu, Y. Quantifying the amount, heterogeneity, and pattern of farmland: Implications for China’s requisition-compensation balance of farmland policy. Land Use Policy 2019, 81, 256–266. [Google Scholar] [CrossRef]
  13. Liu, Y.; Shen, G.; He, T. Cropping and Transformation Features of Non-Grain Cropland in Mainland China and Policy Implications. Land 2025, 14, 561. [Google Scholar] [CrossRef]
  14. Su, H.; Liu, F.; Zhang, H.; Ma, X.; Sun, A. Progress and Prospects of Non-Grain Production of Cultivated Land in China. Sustainability 2024, 16, 3517. [Google Scholar] [CrossRef]
  15. Ge, D.; Long, H.; Zhang, Y.; Ma, L.; Li, T. Farmland transition and its influences on grain production in China. Land Use Policy 2018, 70, 94–105. [Google Scholar] [CrossRef]
  16. Kong, X. The Issue of “Non-Grain Conversion” of Arable Land, Its Causes, and Countermeasures. China Land 2020, 11, 17–19. [Google Scholar]
  17. Yang, Q.; Zhang, D. The influence of agricultural industrial policy on non-grain production of cultivated land: A case study of the “one village, one product” strategy implemented in Guanzhong Plain of China. Land Use Policy 2021, 108, 105579. [Google Scholar] [CrossRef]
  18. Li, M.; Tan, L.; Yang, X. The Impact of Environmental Regulation on Cultivated Land Use Eco-Efficiency: Evidence from China. Agriculture 2023, 13, 1723. [Google Scholar] [CrossRef]
  19. Liang, K.; Jin, X.; Wang, S.; Ying, S.; Qi, Z.; Zhou, Y. Control of Balancing Cultivated Land Conversion by Integrating” Homogeneous Equivalence” and “Loss-Supplement Balance”: Methodology and Empirical Study. China Land Sci. 2023, 37, 77–88. [Google Scholar]
  20. Li, R.; Wang, R.; Li, M. Study on Non-agricultural Scale and Spatial-temporal Collocation of Cultivated Land in Henan Province. Hunan Agric. Sci. 2009, 65–68+72. [Google Scholar] [CrossRef]
  21. Guan, X.; Wang, X.; Zhao, Y. Morphological Characteristics Identification and Optimization of “Non-grain” Cultivated Land along Yellow River Basin. Trans. Chin. Soc. Agric. Mach. 2021, 52, 233–242. [Google Scholar]
  22. Tan, Y.; Wu, C.; Mou, Y. Macro-Analysis of Cultivated Land Non-Agriculturalization in Zhejiang. Sci. Geogr. Sin. 2004, 24, 14–19. [Google Scholar]
  23. Su, Y.; Li, C.; Wang, K.; Deng, J.; Shahtahmassebi, A.R.; Zhang, L.; Ao, W.; Guan, T.; Pan, Y.; Gan, M. Quantifying the spatiotemporal dynamics and multi-aspect performance of non-grain production during 2000–2015 at a fine scale. Ecol. Indic. 2019, 101, 410–419. [Google Scholar] [CrossRef]
  24. Cheng, M.; Liu, Y. Spatial Differentiation and Its Influencing Factors of Non-agricultural Land in Huang Huai-Hai Plain. Areal Res. Dev. 2019, 38, 170–176. [Google Scholar]
  25. Zhang, H.; Song, W.; Zhang, W.; Li, X.; Liu, J.; Li, J. Analysis of Spatial Differentiation Characteristics and Influencing Factors of Non-grain Cultivated Land in Shandong Province. China Land Sci. 2021, 35, 94–103. [Google Scholar]
  26. Ke, S.; Cui, H.; Lu, X.; Hou, J.; Wu, Y. Research on the Spatial-Temporal Pattern and Mechanisms of Green Transition of Farmland Use: A Case of Hubei Province. China Land Sci. 2021, 35, 64–74. [Google Scholar]
  27. Ma, C.; Zhao, L.; Ke, X. Temporal and Spatial Variation of the Pressure of Cropland Non-Agriculturalization in Hubei Province. Resour. Environ. Yangtze Basin 2016, 25, 71–78. [Google Scholar]
  28. Zhang, J.; Liu, Y.; Zhang, E.; Chen, J.; Tan, Q. Dynamics and driving mechanisms of cultivated land at county level in China. Acta Geogr. Sin. 2023, 78, 2105–2127. [Google Scholar]
  29. Zhang, D.; Yang, W.; Kang, D.; Zhang, H. Spatial-temporal characteristics and policy implication for non-grain production of cultivated land in Guanzhong Region. Land Use Policy 2023, 125, 106466. [Google Scholar] [CrossRef]
  30. Lu, D.; Wang, Z.; Su, K.; Zhou, Y.; Li, X.; Lin, A. Understanding the impact of cultivated land-use changes on China’s grain production potential and policy implications: A perspective of non-agriculturalization, non-grainization, and marginalization. J. Clean. Prod. 2024, 436, 140647. [Google Scholar] [CrossRef]
  31. Qiu, T.; Boris Choy, S.T.; Li, S.; He, Q.; Luo, B. Does land renting-in reduce grain production? Evidence from rural China. Land Use Policy 2020, 90, 104311. [Google Scholar] [CrossRef]
  32. Ma, Z.; Ran, R.; Xu, D. The Effect of Peasants Differentiation on Peasants’ Willingness and Behavior Transformation of Land Transfer: Evidence from Sichuan Province, China. Land 2023, 12, 338. [Google Scholar] [CrossRef]
  33. Mustafa, A.; Heppenstall, A.; Omrani, H.; Saadi, I.; Cools, M.; Teller, J. Modelling built-up expansion and densification with multinomial logistic regression, cellular automata and genetic algorithm. Comput. Environ. Urban Syst. 2018, 67, 147–156. [Google Scholar] [CrossRef]
  34. Zhu, Z.; Duan, J.; Li, S.; Dai, Z.; Feng, Y. Phenomenon of Non-Grain Production of Cultivated Land Has Become Increasingly Prominent over the Last 20 Years: Evidence from Guanzhong Plain, China. Agriculture 2022, 12, 1654. [Google Scholar] [CrossRef]
  35. Wang, X.; Song, X.; Wang, Y.; Xu, H.; Ma, Z. Understanding the distribution patterns and underlying mechanisms of non-grain use of cultivated land in rural China. J. Rural. Stud. 2024, 106, 103223. [Google Scholar] [CrossRef]
  36. Gao, B.; Yang, J.; Chen, Z.; Sugihara, G.; Li, M.; Stein, A.; Kwan, M.; Wang, J. Causal inference from cross-sectional earth system data with geographical convergent cross mapping. Nat. Commun. 2023, 14, 5875. [Google Scholar] [CrossRef] [PubMed]
  37. Ma, Y.; Wang, X.; Zhong, C. Spatial and Temporal Differences and Influencing Factors of Eco-Efficiency of Cultivated Land Use in Main Grain-Producing Areas of China. Sustainability 2024, 16, 5734. [Google Scholar] [CrossRef]
  38. Lai, Z.; Chen, M.; Liu, T. Changes in and prospects for cultivated land use since the reform and opening up in China. Land Use Policy 2020, 97, 104781. [Google Scholar] [CrossRef]
  39. Zhang, Z.; Ghazali, S.; Miceikiene, A.; Zejak, D.; Choobchian, S.; Pietrzykowski, M.; Azadi, H. Socio-economic impacts of agricultural land conversion: A meta-analysis. Land Use Policy 2023, 132, 106831. [Google Scholar] [CrossRef]
  40. Su, Y.; Wang, X.; Wang, C.; Zhu, C.; Jiang, Q.; Li, Y. Trade-offs between economic benefits and environmental impacts in non-grain expansion: A case study in the eastern plain of China. Environ. Sci. Pollut. Res. 2024, 31, 15932–15945. [Google Scholar] [CrossRef]
  41. Wang, Y.; Zhang, Y.; Yang, H.; Niu, J.; Chen, X. Effects of Payments for Ecosystem Services and Livelihoods on Non-Grain Agricultural Land Use. Forests 2024, 15, 521. [Google Scholar] [CrossRef]
  42. Han, H.; Peng, H.; Li, S.; Yang, J.; Yan, Z. The Non-Agriculturalization of Cultivated Land in Karst Mountainous Areas in China. Land 2022, 11, 1727. [Google Scholar] [CrossRef]
  43. Ran, D.; Zhang, Z.; Jing, Y. A Study on the Spatial–Temporal Evolution and Driving Factors of Non-Grain Production in China’s Major Grain-Producing Provinces. Int. J. Environ. Res. Public Health 2022, 19, 16630. [Google Scholar] [CrossRef] [PubMed]
  44. Liu, J.; Dong, C.; Liu, S.; Rahman, S.; Sriboonchitta, S. Sources of Total-Factor Productivity and Efficiency Changes in China’s Agriculture. Agriculture 2020, 10, 279. [Google Scholar] [CrossRef]
  45. Pan, S.; Di, C.; Qu, Z.; Ali Chandio, A.; Rehman, A.; Zhang, H. How do agricultural subsidies affect farmers’ non-grain cultivated land production? Evidence from the fourth rural Chinese households panel data survey. Econ. Polit. 2024, 41, 1–24. [Google Scholar] [CrossRef]
  46. Su, Y.; Qian, K.; Lin, L.; Wang, K.; Guan, T.; Gan, M. Identifying the driving forces of non-grain production expansion in rural China and its implications for policies on cultivated land protection. Land Use Policy 2020, 92, 104435. [Google Scholar] [CrossRef]
  47. Zhang, Z.; Zheng, L.; Yu, D. Non-Grain Production of Cultivated Land in Hilly and Mountainous Areas at the Village Scale: A Case Study in Le’an Country, China. Land 2023, 12, 1562. [Google Scholar] [CrossRef]
  48. Lyu, X.; Peng, W.; Niu, S.; Qu, Y.; Xin, Z. Evaluation of sustainable intensification of cultivated land use according to farming households’ livelihood types. Ecol. Indic. 2022, 138, 108848. [Google Scholar] [CrossRef]
  49. Chen, L.; Peng, J.; Zhang, Y. Research on the Impact of Rural Land Transfer on Non-Farm Employment of Farm Households: Evidence from Hubei Province, China. Int. J. Environ. Res. Public Health 2022, 19, 15587. [Google Scholar] [CrossRef]
  50. Wang, X.; Wang, D.; Wu, S.; Yan, Z.; Han, J. Cultivated land multifunctionality in undeveloped peri-urban agriculture areas in China: Implications for sustainable land management. J. Environ. Manag. 2023, 325, 116500. [Google Scholar] [CrossRef]
  51. Zhu, F.; Zhang, F.; Ke, X. Rural industrial restructuring in China’s metropolitan suburbs: Evidence from the land use transition of rural enterprises in suburban Beijing. Land Use Policy 2018, 74, 121–129. [Google Scholar] [CrossRef]
  52. Cheng, X.; Tao, Y.; Huang, C.; Yi, J.; Yi, D.; Wang, F.; Tao, Q.; Xi, H.; Ou, W. Unraveling the Causal Mechanisms for Non-Grain Production of Cultivated Land: An Analysis Framework Applied in Liyang, China. Land 2022, 11, 1888. [Google Scholar] [CrossRef]
  53. Shan, L.; Jiang, Y.; Liu, C.; Wang, Y.; Zhang, G.; Cui, X.; Li, F. Exploring the multi-dimensional coordination relationship between population urbanization and land urbanization based on the MDCE model: A case study of the Yangtze River Economic Belt, China. PLoS ONE 2021, 16, e0253898. [Google Scholar] [CrossRef]
  54. Bivand, R.; Piras, G. Comparing Implementations of Estimation Methods for Spatial Econometrics. J. Stat. Softw. 2015, 63, 1–36. [Google Scholar] [CrossRef]
  55. Wu, X.; Zhao, N.; Wang, Y.; Zhang, L.; Wang, W.; Liu, Y. Cropland non-agriculturalization caused by the expansion of built-up areas in China during 1990–2020. Land Use Policy 2024, 146, 107312. [Google Scholar] [CrossRef]
  56. Tan, R.; Liu, Y.; Zhou, K.; Jiao, L.; Tang, W. A game-theory based agent-cellular model for use in urban growth simulation: A case study of the rapidly urbanizing Wuhan area of central China. Comput. Environ. Urban Syst. 2015, 49, 15–29. [Google Scholar] [CrossRef]
  57. Wei, J.; Tian, M.; Wang, X. Spatiotemporal Variation in Land Use and Ecosystem Services during the Urbanization of Xining City. Land 2023, 12, 1118. [Google Scholar] [CrossRef]
  58. Jiang, Z.; Luo, Y.; Wen, Q.; Shi, M.; Ayyamperumal, R.; Wang, M. Achieving Sustainable Land Use Allocation in High-Altitude Area by 2030: Insights from Circle Structure and Scenario Predictions for Production–Living–Ecological Land in Xining Marginal Area, China. Land 2024, 13, 1241. [Google Scholar] [CrossRef]
  59. Zhai, H.; Lv, C.; Liu, W.; Yang, C.; Fan, D.; Wang, Z.; Guan, Q. Understanding Spatio-Temporal Patterns of Land Use/Land Cover Change under Urbanization in Wuhan, China, 2000–2019. Remote Sens. 2021, 13, 3331. [Google Scholar] [CrossRef]
  60. Bren D Amour, C.; Reitsma, F.; Baiocchi, G.; Barthel, S.; Güneralp, B.; Erb, K.; Haberl, H.; Creutzig, F.; Seto, K.C. Future urban land expansion and implications for global croplands. Proc. Natl. Acad. Sci. USA 2017, 114, 8939–8944. [Google Scholar] [CrossRef]
  61. van Vliet, J. Direct and indirect loss of natural area from urban expansion. Nat. Sustain. 2019, 2, 755–763. [Google Scholar] [CrossRef]
  62. Ustaoglu, E.; Collier, M.J. Farmland abandonment in Europe: An overview of drivers, consequences, and assessment of the sustainability implications. Environ. Rev. 2018, 26, 396–416. [Google Scholar] [CrossRef]
  63. Wang, L.; Zheng, W.; Tang, L.; Zhang, S.; Liu, Y.; Ke, X. Spatial optimization of urban land and cropland based on land production capacity to balance cropland protection and ecological conservation. J. Environ. Manag. 2021, 285, 112054. [Google Scholar] [CrossRef]
  64. Jiang, G.; Zhang, R.; Ma, W.; Zhou, D.; Wang, X.; He, X. Cultivated land productivity potential improvement in land consolidation schemes in Shenyang, China: Assessment and policy implications. Land Use Policy 2017, 68, 80–88. [Google Scholar] [CrossRef]
  65. Yang, Y.; Zhang, L.; Ye, Y.; Wang, Z. Curbing Sprawl with Development-limiting Boundaries in Urban China: A Review of Literature. J. Plan. Lit. 2020, 35, 25–40. [Google Scholar] [CrossRef]
  66. Chen, Y.; Li, M.; Zhang, Z. Does the Rural Land Transfer Promote the Non-Grain Production of Cultivated Land in China? Land 2023, 12, 688. [Google Scholar] [CrossRef]
  67. Guo, Y.; Wang, J. Land Consolidation in Rural China: Historical Stages, Typical Modes, and Improvement Paths. Land 2023, 12, 491. [Google Scholar] [CrossRef]
  68. Zhou, Y.; Li, Y.; Xu, C. Land consolidation and rural revitalization in China: Mechanisms and paths. Land Use Policy 2020, 91, 104379. [Google Scholar] [CrossRef]
  69. Wang, W.; Gu, Z.; Han, Z.; Li, Z. Optimization of land use to accommodate nutritional transformation of food systems: A case study from the Beijing–Tianjin–Hebei region. Front. Sustain. Food Syst. 2024, 8, 1326581. [Google Scholar] [CrossRef]
  70. Zhang, T.; Zhang, F.; Li, J.; Xie, Z.; Chang, Y. Unraveling patterns, causes, and nature-based remediation strategy for non-grain production on farmland in hilly regions. Environ. Res. 2024, 252, 118982. [Google Scholar] [CrossRef]
  71. Zhao, Y.; Abdelkareem, M.; Abdalla, F. Remote sensing and GIS techniques in Monitoring and mapping Land System Change in semi-arid environments. Environ. Earth Sci. 2024, 83, 420. [Google Scholar] [CrossRef]
  72. Spataru, A.; Faggian, R.; Docking, A. Principles of multifunctional agriculture for supporting agriculture in metropolitan peri-urban areas: The case of Greater Melbourne, Australia. J. Rural. Stud. 2020, 74, 34–44. [Google Scholar] [CrossRef]
  73. Fregolent, L.; Vettoretto, L. Land use regulation and social regulation: An unexplored link. Some reflections on the origins and evolution of sprawl in the Veneto “citta diffusa”. Land Use Policy 2017, 69, 149–159. [Google Scholar] [CrossRef]
  74. Osman, T. Restrictive Land Use Regulations and Economic Performance. Int. Reg. Sci. Rev. 2020, 43, 291–315. [Google Scholar] [CrossRef]
Figure 1. Theoretical framework for the explanation of the mechanism of the non-agriculturalization and non-grain utilization transformation of cultivated land (NACL: Non-Agriculturalization of Cultivated Land; NGUCL: Non-Grain Utilization of Cultivated Land).
Land 14 01031 g001
Figure 2. Location of the study area ((a) China; (b) Hubei Province; (c) land use and land cover of the study area; (d) elevation of the study area).
Land 14 01031 g002
Figure 3. Causal relationship diagram between variables X1 and X2.
Land 14 01031 g003
Figure 4. Degree of non-agriculturalization and non-grain utilization of cultivated land in villages of the study area ((a) degree of non-agriculturalization of cultivated land; (b) degree of non-grain utilization of cultivated land).
Land 14 01031 g004
Figure 5. Scatter plot for percentage of non-agriculturalization and non-grain utilization transformation of cultivated land in villages of different types in the study area ((a) non-agriculturalization of cultivated land; (b) non-grain utilization of cultivated land).
Land 14 01031 g005
Figure 6. Correlation relationship detection between non-agriculturalization and non-grain utilization of cultivated land in the study area based on GCCM model.
Land 14 01031 g006
Figure 7. Spatial distribution map of SMD values and associated village classifications ((a) spatial distribution of SMD values; (b) spatial distribution of different types of villages).
Land 14 01031 g007
Figure 8. Driving mechanism of the correlation between non-agriculturalization and non-grain utilization transformation of cultivated land.
Land 14 01031 g008
Table 1. Classification scheme of spatial correlation pattern between non-agriculturalization (NA) and non-grain utilization (NGU) of cultivated land.
Range of SMDCorrelation
Pattern
Explanation of Correlation Pattern Type of Village
SMD ≥ 0.5Trade-offThe NGU rate is significantly higher than the NA rate, and NGU excludes NANon-grain-dominated
0 ≤ SMD < 0.5SynergyBoth NGU and NA are high, with the NGU rate higher than the NA rateDiversified farmland transformation
−0.5 < SMD < 0SynergyBoth NGU and NA are high, with the NA rate higher than the NGU rateDiversified farmland transformation
SMD ≤ −0.5Trade-offThe NA rate is significantly higher than the NGU rate, and NA excludes NGUNon-agricultural-dominated
Table 2. Factors affecting the spatial pattern of non-agriculturalization and non-grain utilization of cultivated land.
FactorsVariablesCalculation MethodExplanation
Location Distance to district centerDistance from the center of a village to the nearest district-level urban centerReflects the degree of connection with the district center, related to land value
Convenience of grain productionProportion of the total area of rural settlement within the 100 m buffer zones of cultivated land Reflects the convenience of agricultural production
Socioeconomic Nighttime light intensityAverage intensity of nighttime light in a village Reflects the economic development and population density of each village, related to land value
Density of construction land Area of construction land/total area of a village Reflects the economic development status of each village, related to land value
Density of road Total area of road/total area of a village Reflects the level of transportation convenience and economic development
Natural ConditionsSlopeAverage slope of cultivated land within a villageReflects the overall steepness of the terrain and cultivation conditions, related to agricultural production efficiency
ElevationAverage elevation of cultivated land within a villageReflects the terrain conditions of the cultivated land, related to agricultural production costs
Accessibility to waterProportion of the total area of water body within 100 m buffer zones of cultivated land Reflects the convenience of irrigation and waterfront landscape value, related to land value and agricultural efficiency
Proportion of cultivated landProportion of cultivated land area to total area of village Reflects the abundance of cultivated land resources, related to agricultural output
Quality of cultivated landQuality of cultivated land is classified into 15 grades based on soil fertility, soil health, agriculture infrastructure conditions, and natural factors like terrain and climateReflects the comprehensive grain production capacity of the cultivated land
Policy Area of permanent basic farmland Total area of permanent farmland in a villageReflects the endowment and level of protection of cultivated land resources
Table 3. Results of the spatial error model for analyzing factors that impact the non-agricultural transformation.
VariablesStandardized Regression CoefficientStandard Errorp-Value
Distance to district center−0.320.0490.000
Convenience of grain production−0.1680.0590.004
Nighttime light intensity0.6080.0450.000
Density of construction land0.6660.0300.000
Density of road0.1050.0710.135
Elevation−0.1650.0710.020
Accessibility to water0.0700.0740.339
Proportion of cultivated land−0.3690.0360.000
Quality of cultivated land−0.1770.0480.000
Area of permanent basic farmland −0.4200.0620.000
Table 4. Results of the spatial lag model for analyzing factors that impact the non-grain transformation.
VariablesStandardized Regression
Coefficient
Standard Errorp-Value
Distance to district center0.0880.0370.017
Convenience of grain production−0.0910.050.069
Nighttime light intensity−0.0780.0460.094
Density of construction land−0.1060.040.008
Density of road0.0240.0640.707
Elevation0.0630.0590.283
Accessibility to water−0.1270.0590.031
Proportion of cultivated land−0.0940.0350.007
Quality of cultivated land0.120.0430.005
Area of permanent basic farmland 0.060.0540.264
Table 5. The multi-classification logistic regression results for villages dominated by different correlation relationship between NA and NGU transformation.
VariablesNon-Agricultural-Dominated VillageNon-Grain-Dominated
Village
Diversified Farmland
Transformation Village
Coefficientp-ValueCoefficientp-ValueCoefficientp-Value
Distance to district center−0.7700.0010.9630.000−0.0970.694
Convenience of grain production0.3200.049−0.3480.0290.0700.649
Nighttime light intensity0.2060.255−0.2930.1170.1300.482
Density of construction land0.4420.025−0.4160.0430.0010.997
Density of road−0.1600.2130.1830.157−0.0440.726
Slope0.0820.5700.0480.715−0.1010.497
Elevation0.2130.124−0.2910.0350.0430.728
Accessibility to water−0.2990.2000.1310.5690.1700.461
Proportion of cultivated land−0.3920.0440.2720.135−0.0250.898
Quality of cultivated land−0.2240.1250.2670.067−0.0270.860
Disclaimer/Publisher’s Note: The statements, opinions and data contained in all publications are solely those of the individual author(s) and contributor(s) and not of MDPI and/or the editor(s). MDPI and/or the editor(s) disclaim responsibility for any injury to people or property resulting from any ideas, methods, instructions or products referred to in the content.

