Article

Uncovering Impacts of Tourism on Social–Ecological Vulnerability Using Geospatial Analysis and Big Earth Data: A Karst Ethnic Village Perspective

College of Architecture and Urban Planning, Guizhou University, Guiyang 550025, China
*
Author to whom correspondence should be addressed.
Land 2025, 14(5), 1030; https://doi.org/10.3390/land14051030
Submission received: 3 April 2025 / Revised: 29 April 2025 / Accepted: 30 April 2025 / Published: 8 May 2025
(This article belongs to the Special Issue GeoAI for Urban Sustainability Monitoring and Analysis)

Abstract

:
The ethnic villages in karst regions, where the ecosystem and social systems are intricately linked, face the dual challenges of poverty and ecological sustainability. Tourism, as an emerging strategy adopted for poverty alleviation, has inevitably posed complex impacts on social–ecological systems (SES). However, due to the particularity of the SES in this region, the mechanisms through which tourism influences social–ecological systems remain unclear, hindering the achievement of eco-friendly economic growth. In this study, we first applied the vulnerability spectrum diagram (VSD) model assessment framework to various remotely sensed and socially sensed data to evaluate ecological and social vulnerability, taking Leishan County, a typical karst region in Guizhou, southwest China as a case study. Then, advanced geospatial analysis methods were adopted to investigate the spatial characteristics of the vulnerability index. Finally, we utilized the geographical detector to identify influencing factors and investigated their synergistic effects. Our results reveal that, within the studied area, social vulnerability is generally lower in the north than the south, while ecological vulnerability shows the other way around. Social vulnerability is significantly influenced by several tourism-related factors, such as transportation convenience and the preservation of traditional dwellings. These factors collectively exert a pronounced effect on social vulnerability mitigation. Moreover, ecological vulnerability, with the exception of rocky desertification, shows significant co-directional changes with social vulnerability, reflecting the fact that tourism factors indirectly shape the ecosystem. The development of ethnic village tourism in villages with better socio-economic conditions tends to effectively improve the quality of the ecological environment, whereas those with poorer conditions tend to exacerbate ecological damage. The findings drawn from this study convey important practical implications that assist in identifying key vulnerable areas in karst ethnic villages and support their sustainable development goals.

1. Introduction

Globally, the negative impact of human activities on rural social–ecological systems (SES) is becoming increasingly significant [1,2,3]. Human activities, including deforestation, improper land use, excessive groundwater extraction, and climate change, are deemed critical disturbance factors contributing to SES [4,5,6,7]. The deterioration of ecological conditions and the rise in social issues are emerging as key factors constraining rural development [8,9,10,11]. Under the boom of rural tourism, the rapid spatial expansion and the continuous emergence of new spatial forms have intensified the impact on cultural resources, leading to ecological imbalance, and prominent community conflicts, such as the impact of commercialization on traditional culture, the unequal distribution of income and the preservation of traditional architecture [12,13]. These issues have increased the vulnerability of villages. Therefore, conducting vulnerability assessments for these villages and promptly implementing interventions are essential to minimize the adverse effects of tourism development [14].
The karst region in southwest China, with its unique geological characteristics and abundant groundwater resources, holds significant importance for regional ecological value. Karst topographies form peculiar landscapes that include underground caves, sinkholes, stalagmites, and stalactites. These possess significant aesthetic value, and some of them have been developed into tourist attractions. However, this area frequently encounters numerous ecological challenges, such as slow soil formation, severe rocky desertification, limited self-purification capabilities, and high susceptibility to external disturbances [15,16], with desertification being the most prominent of these characteristics. Local agricultural development is restricted due to challenges such as rocky desertification, uneven terrain, and small, scattered farmland plots. The ecological vulnerability (EV) is further exacerbated by intensive rural land use and high population density, resulting in significant impacts on local livelihoods and sustainable development [17,18,19]. This exacerbates the EV, threatening ecological sustainability and local livelihoods [20,21].
Additionally, this area is also a concentration of ethnic villages. Ethnic villages are defined as villages where ethnic minority groups are the majority. They are characterized by their simplicity and unique ethnic charm, and they preserve the cultural heritage and traditional festivals of ethnic minorities [13], with most of them being developed into tourist attractions that possess significant cultural and economic value. The SES of karst ethnic villages (KEVs) is formed by the intricate interplay between the natural environment and socio-cultural systems, which necessitates an integrated analysis of its vulnerability [22]. Recent studies have highlighted the complex impact of tourism on social vulnerability (SV), with tourism both mitigating and exacerbating SV through various socio-economic and environmental factors [23,24,25]. On the positive side, the development of tourism resources significantly contributes to attempts at increasing employment [26], promoting transportation development [27,28], and alleviating poverty [29], all of which are critical factors in mitigating the SV. On the negative side, while certain tourism factors can mitigate the SV [30], they can also lead to increased risks of viral infections and environmental destruction [25,31]. Understanding and addressing these impacts on KEVs requires a comprehensive approach that integrates ecological, social, and tourism factors to develop appropriate adaptation strategies for sustainable development [9].
Vulnerability assessment stands as a core topic and method within the field of sustainable development, playing a crucial role in understanding and addressing the challenges that arise from the interactions of SES [9,14]. Vulnerability, initially introduced by Gabor and Griffith [32], has been conceptualized as the capacity of humans to respond to risks such as photochemical events, species invasions, and the efficacy of emergency responses. Over time, research has expanded this concept, evolving it into a multidimensional one that is shaped by disciplinary perspectives. It is now understood as a function of exposure to stressors, sensitivity to potential impacts, and the potential for recovery, also known as resilience or adaptive capacity [9,33,34]. Vulnerability assessment is instrumental in pinpointing vulnerable areas and the extent of their vulnerability within defined geographical scopes, which is vital for devising targeted regional protection and development strategies [35,36]. It serves as an essential tool for decision-makers to comprehend the impacts of natural and anthropogenic factors on SES and is a critical method for identifying and managing the ecological conditions in vulnerable areas [37]. This approach also facilitates policymakers in developing targeted conservation and management measures as well as development strategies for ethnic villages with different resource endowments and geographical scopes.
Against this backdrop, this study, based on the vulnerability spectrum diagram (VSD) model, focuses on a typical karst topography and a cluster of socio-economically disadvantaged ethnic villages in southwest China as the study area. It assessed the vulnerability of randomly selected villages with the objectives to (1) integrate tourism factors of KEVs into vulnerability assessment by establishing a comprehensive indicator system and utilizing it as an exposure indicator to gauge its direct impact on the SV and indirect impact on the EV; to (2) evaluate the vulnerability and subsystem indices of the study area, and delineate their spatial differentiation characteristics; and to (3) identify significant influencing factors and their synergistic effects on vulnerability, then analyze the underlying causes in order to offer a more comprehensive diagnosis of the vulnerability of KEVs.

2. Materials and Methods
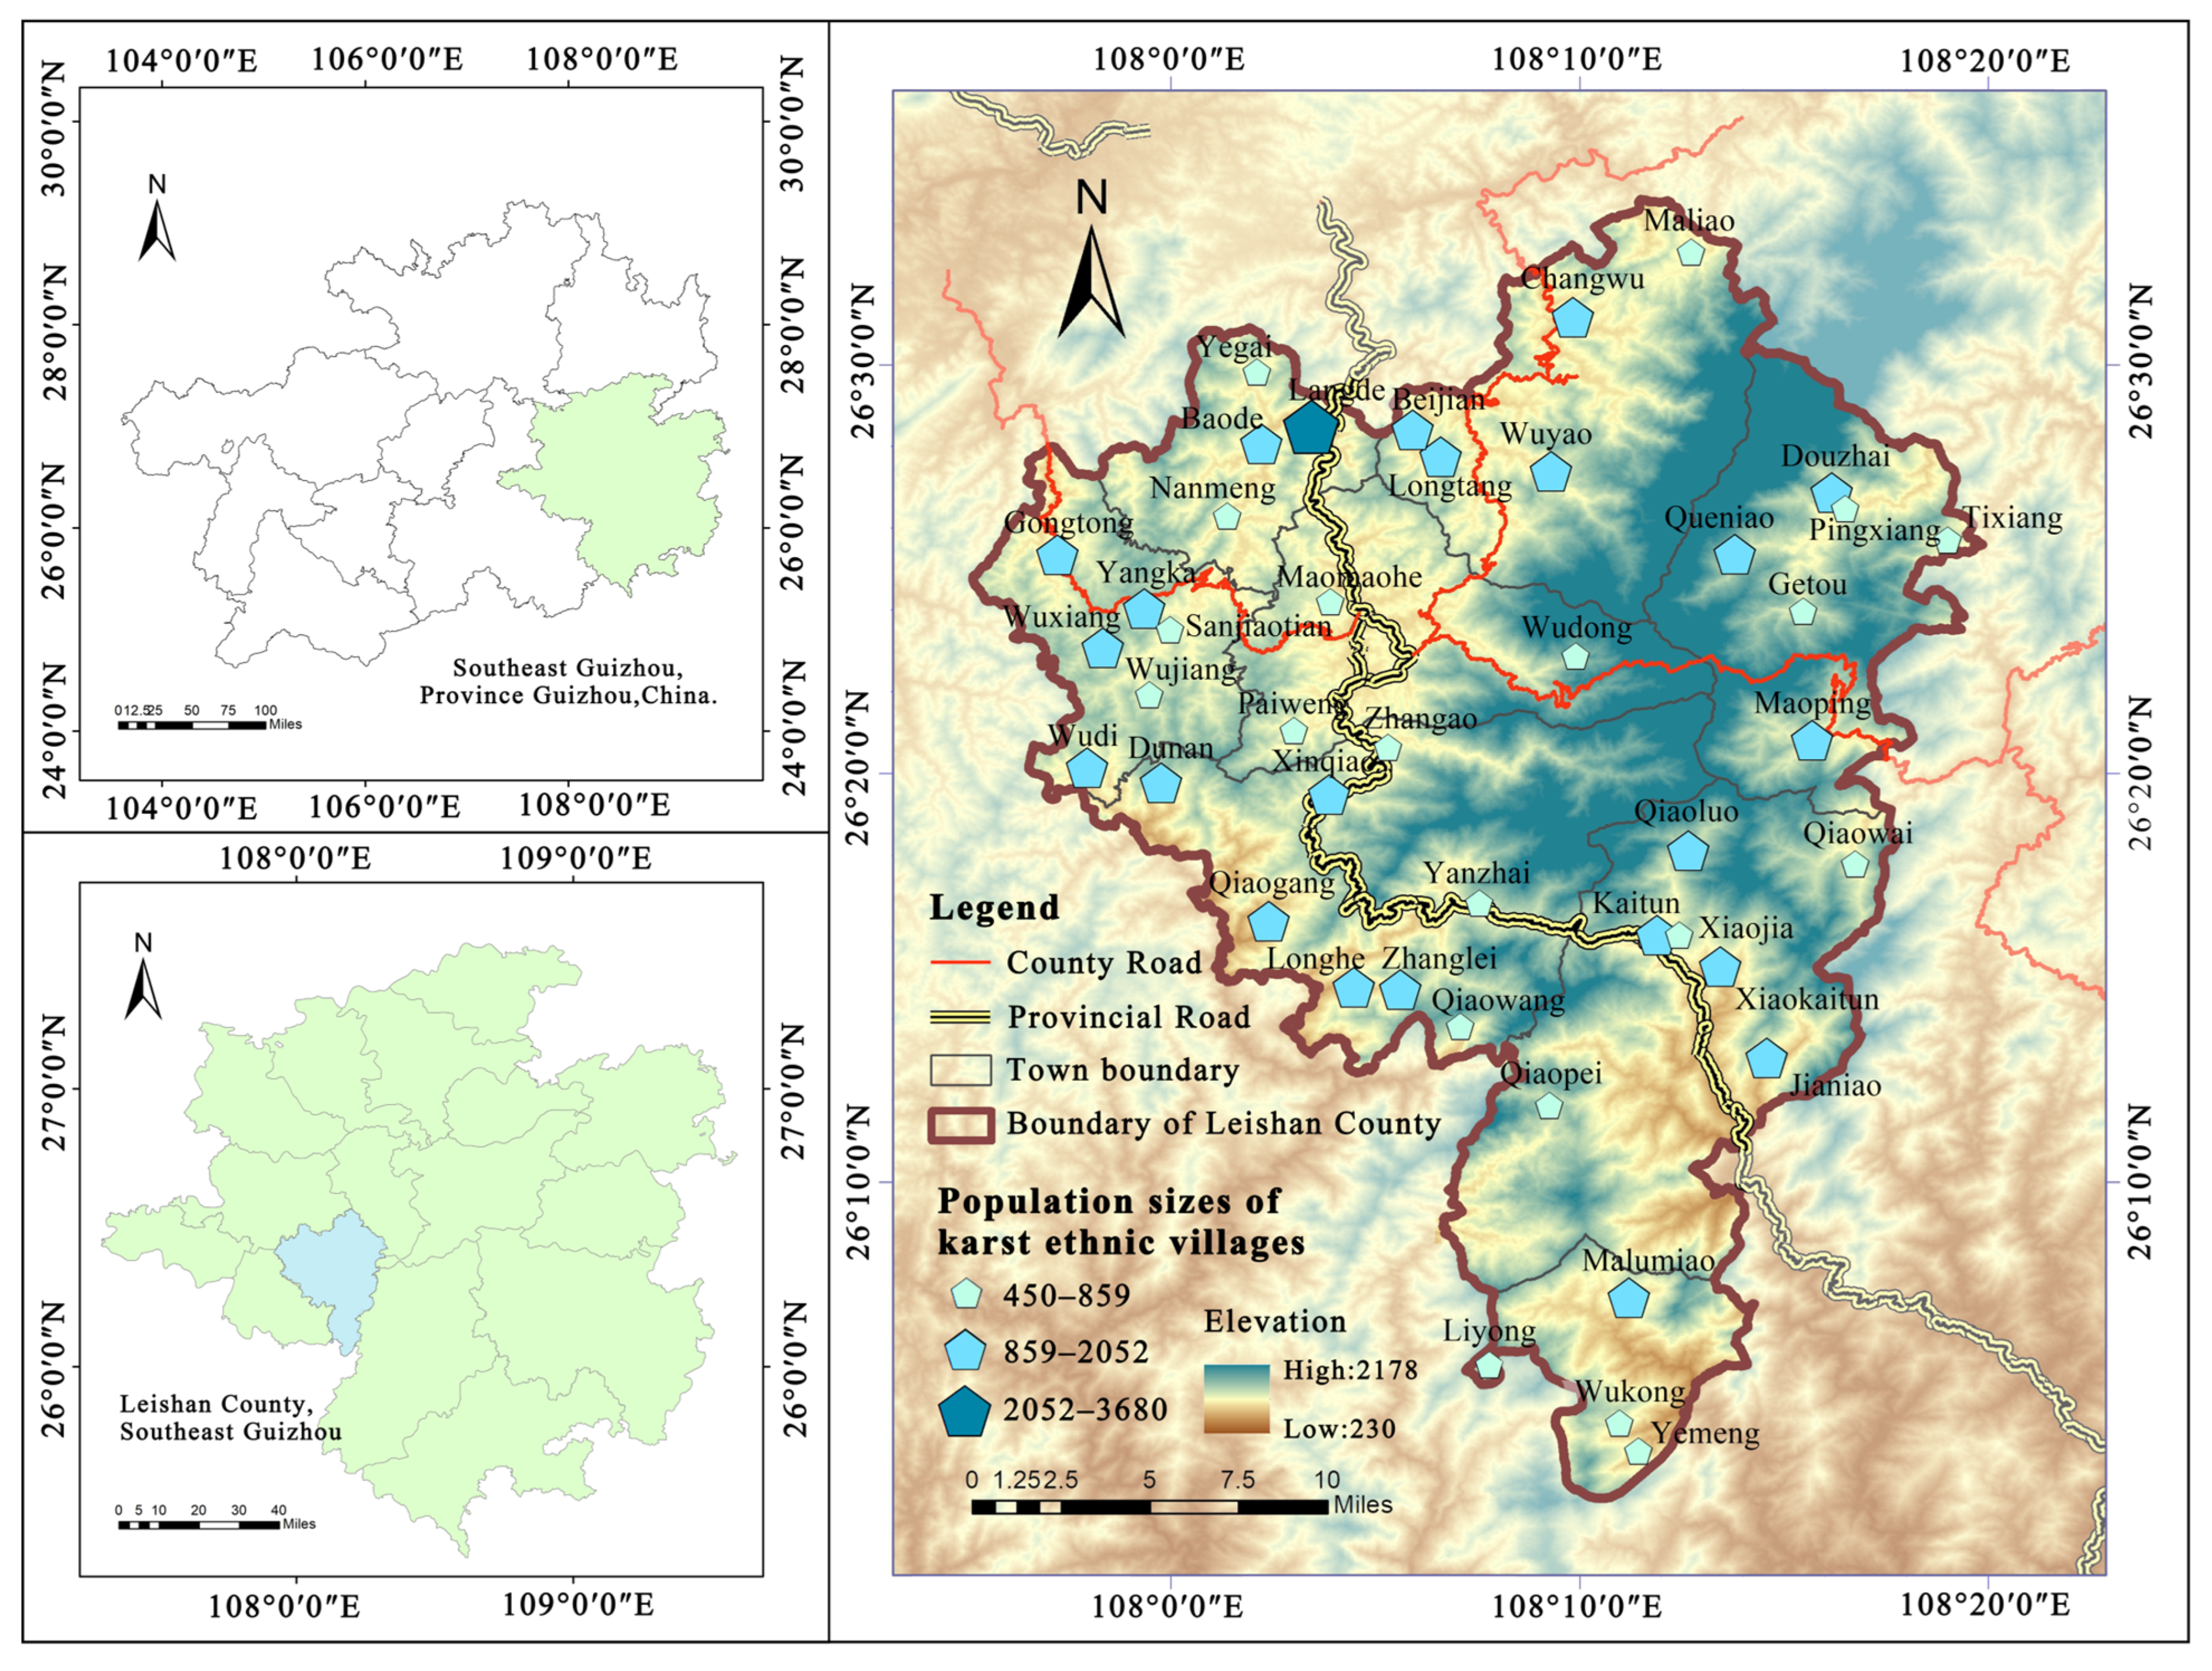
2.1. Study Area

This study focuses on Leishan County, located in Guizhou Province, southwest China, within the geographical coordinates of 107°55′ E to 108°22′ E longitude and 26°02′ N to 26°34′ N latitude (Figure 1).
The spatial construction and folk activities of ethnic villages in the region are closely linked to the natural environment and the ecological–cultural system of residents, forming a unique human–land system [22]. To stimulate economic growth and improve residents’ quality of life, the local government has leveraged the county’s ethnic cultural resources to vigorously develop the tourism industry. As the starting point of China’s Tourism Highway No. 1, Leishan County has effectively promoted rural economic development through the organization of diverse and vibrant folk cultural activities.
In this study, a random sampling method was employed to select 43 ethnic villages from a total of 65, including those recognized for their ethnic characteristics at the provincial and national levels, with a sampling rate of 65.2%.

2.2. Data Sources

The research data for this study are primarily sourced from network data platforms and on-site investigation. The resolution of the remote sensing and topographic data is 30 m. When conducting offline surveys, at the county level, we engaged with the local Housing and Urban–Rural Development Bureau, the Culture and Tourism Bureau, the Rural Revitalization Bureau, and the Bureau of Statistics, where we collected pertinent archives. At the township level, we performed field visits and surveys across 8 township governments and their respective jurisdiction over 43 ethnic village committees. The official statistics gathered encompassed governance, socioeconomics, heritage protection, and historical investments of ethnic villages. All the data are from the year 2023. A detailed depiction of the data collection process is presented in Table 1.

2.3. Methods

2.3.1. Development of Index System

The frameworks and models commonly utilized for vulnerability assessment include a variety of approaches. These encompass the risk-hazard (RH) model; the pressure and release (PAR) model [38]; the household vulnerability (HOP) model; the sensitivity–resilience–pressure (SRP) conceptual model [18]; the driving force–pressure–state–impact–response (DPSIR) model, and its revised version DPSIR(M) [19,39,40]; the exposure–sensitivity–adaptation (ESA) model [41,42]; the vulnerability spectrum diagram (VSD) model, based on ESA [42,43]; and the vulnerability evaluation index (VEI) model [19,39].
For this study, the VSD assessment framework model was selected to assess the EV and SV within the study area. Vulnerability is essentially the interaction among exposure, sensitivity, and adaptive capacity [44]. Exposure refers to the extent of a system’s susceptibility to disturbances and pressures from external environmental pressures or risks. In this study, exposure primarily pertains to the impact of tourism development. Sensitivity denotes the inherent response characteristics of a system when confronted with risks, reflecting its state and often linked to its internal structure, function, and complexity [45]. Adaptive capacity refers to the system’s ability to respond and adapt in the face of destructive risks [45]. It is essential to establish indices on a small scale and that are tailored to specific cases [41]. The VSD model is deemed more appropriate for evaluating the sensitivity of land to desertification [46], and it distinctly delineates the vulnerability of system across the above-mentioned three dimensions, making it well suited for examining the effects of external disturbances, particularly those stemming from social factors, on the system [47]. The technical workflow of this study is shown in Figure 2.
In consideration of the specific conditions of KEVs, the EV assessment indicator system was developed (Table 2). The directional effect represents the impact of the indicator on vulnerability, where “+” indicates an increase in vulnerability and “−” indicates a decrease in vulnerability. The indicator weights are calculated using the entropy method, as described in the subsequent sections. Climate and karst geology, along with human activities such as excessive cultivation and tourism development, are identified as the primary disturbances to the local ecosystem and significant contributors to vulnerability. The average SV value serves as the exposure indicator, while factors such as slope, precipitation, and the degree of rocky desertification are included to represent the natural environmental conditions surrounding the ecosystem. These environmental factors are crucial in determining the ecosystem’s sensitivity to external disturbances [48]. Vegetation coverage is intricately connected to the rate of rocky desertification in karst areas. The normalized difference vegetation index (NDVI), biodiversity index, and arable land area are selected as adaptive indicators to reflect the ecosystem’s capacity to resist and recover from disturbances [49].
Regarding the SV, rural tourism stands as a pivotal industry in the KEVs of Guizhou. The fragile ecological environment and the current state of rural areas under the influence of tourism significantly impact the sustainable development of villages, with SV potentially influencing the ecosystem’s vulnerability. This research has constructed an SV system that is pertinent to tourism development (Table 2). Initially, the annual average number of tourists received by villages, the population engaged in tourism, transportation convenience, construction land area, and construction funds serve as exposure indicators. These represent the degree of external disturbance brought by tourism development and mirror the local population’s reliance on the tourism industry. Subsequently, indicators, such as the degree of hollowing out, aging rate, infrastructure completeness, per capita annual income of households, preservation of traditional dwellings, and preservation of intangible cultural heritage, are employed as evaluation criteria of sensitivity. These reflect the capacity of each village’s infrastructure, demographic factors, and cultural resources to withstand shocks. Finally, the adaptability indicators include community learning and neighborhood relationships, the duration of implemented protection plans, the industrial diversity index, and investment in disaster response funds. These signify the strength of rural communities’ adaptability and their risk-bearing capacity.

2.3.2. Weight Calculation of Evaluation Index

In this research, the entropy weight method [62] was utilized to calculate the weights of the vulnerability indicators. To resolve the issue of varying dimensions among indicators, interval normalization was applied to process the raw data [63]. Acknowledging the distinct positive and negative impacts of each indicator, this research employed different standardization methods accordingly.
  • Positive indices:
Z i j = ( X i j m i n ( X j ) ) / ( m a x ( X j ) m i n ( X j ) )
  • Negative indices:
  Z i j = ( m a x ( X j ) ( X j ) ) / ( m a x ( X j ) m i n ( X j ) )
In the formula, Z i j is the standardized value of the j-th index for the i-th evaluation object, X i j is the original value of each index, and m a x ( X j ) and m i n ( X j ) are the maximum and minimum values of each index, respectively.
The entropy weight method is a mature objective weighting method, and its basic idea is to determine the weight of the index based on the variability of the indicators [64,65]. In other words, the entropy weight method assigns weights to the indices based on the amount of information each indicator provides. The formula for the entropy weight method is as follows [66]:
H i = k j = 1 n f i j ln ( f i j )
f i j = X i j i = 1 m X i j
k = 1 ln i
W i = 1 H i n i = 1 n H i
where f i j is the proportion of X i j   to the sum of   X i j , H i   is the entropy, and W i is the weight. i is the total number of samples and n is the number of indicators.

2.3.3. Comprehensive Evaluation Model

The weight of each indicator is multiplied by its standardized value and summed to obtain the comprehensive evaluation score for each system. This score was used to measure the overall level of each system.
U j = j = 1 n W i j × X i j
where Uj represents the overall level of the i-th system, Wij is the weight of the secondary indicators of the system, and Xij is the standardized value of the secondary indicators of the system. n is the number of indicators for the i-th system.
Using this model, the exposure, sensitivity, and adaptability indices for each village in the study are derived.

2.3.4. Spatially Explicit Resilience–Vulnerability (SERV) Model

Frazier [67], in their vulnerability analysis of Florida, proposed the spatially explicit resilience–vulnerability (SERV) model to integrate the comprehensive impact of exposure, sensitivity, and adaptability on vulnerability. The SERV model addresses the uneven spatial distribution and dependency on indicators, emphasizing the combined impact of the three dimensions of vulnerability. For instance, areas with high vulnerability do not necessarily have high exposure, and areas with low vulnerability are not always low in exposure. This is crucial for disaster reduction, adaptive planning, and effective allocation of limited resources at scales below the county level [43,67]. The static equations of the three dimensions of the SERV model are represented as follows:
V I = [ E I + S I ] A I
For the two subsystems of society and ecology, the specific equation is expressed as follows:
S V I = [ S E I + S S I ] S A I
E V I = [ E E I + E S I ] E A I
In the equations, vulnerability is quantitatively described as an index derived from the addition and subtraction of exposure, sensitivity, and adaptability values. Here, SVI represents the social vulnerability index, SEI represents the social exposure index, SSI represents the social sensitivity index, and SAI represents the social adaptability index. EVI represents the ecological vulnerability index, EEI represents the ecological exposure index, ESI represents the ecological sensitivity index, and EAI represents the ecological adaptability index.

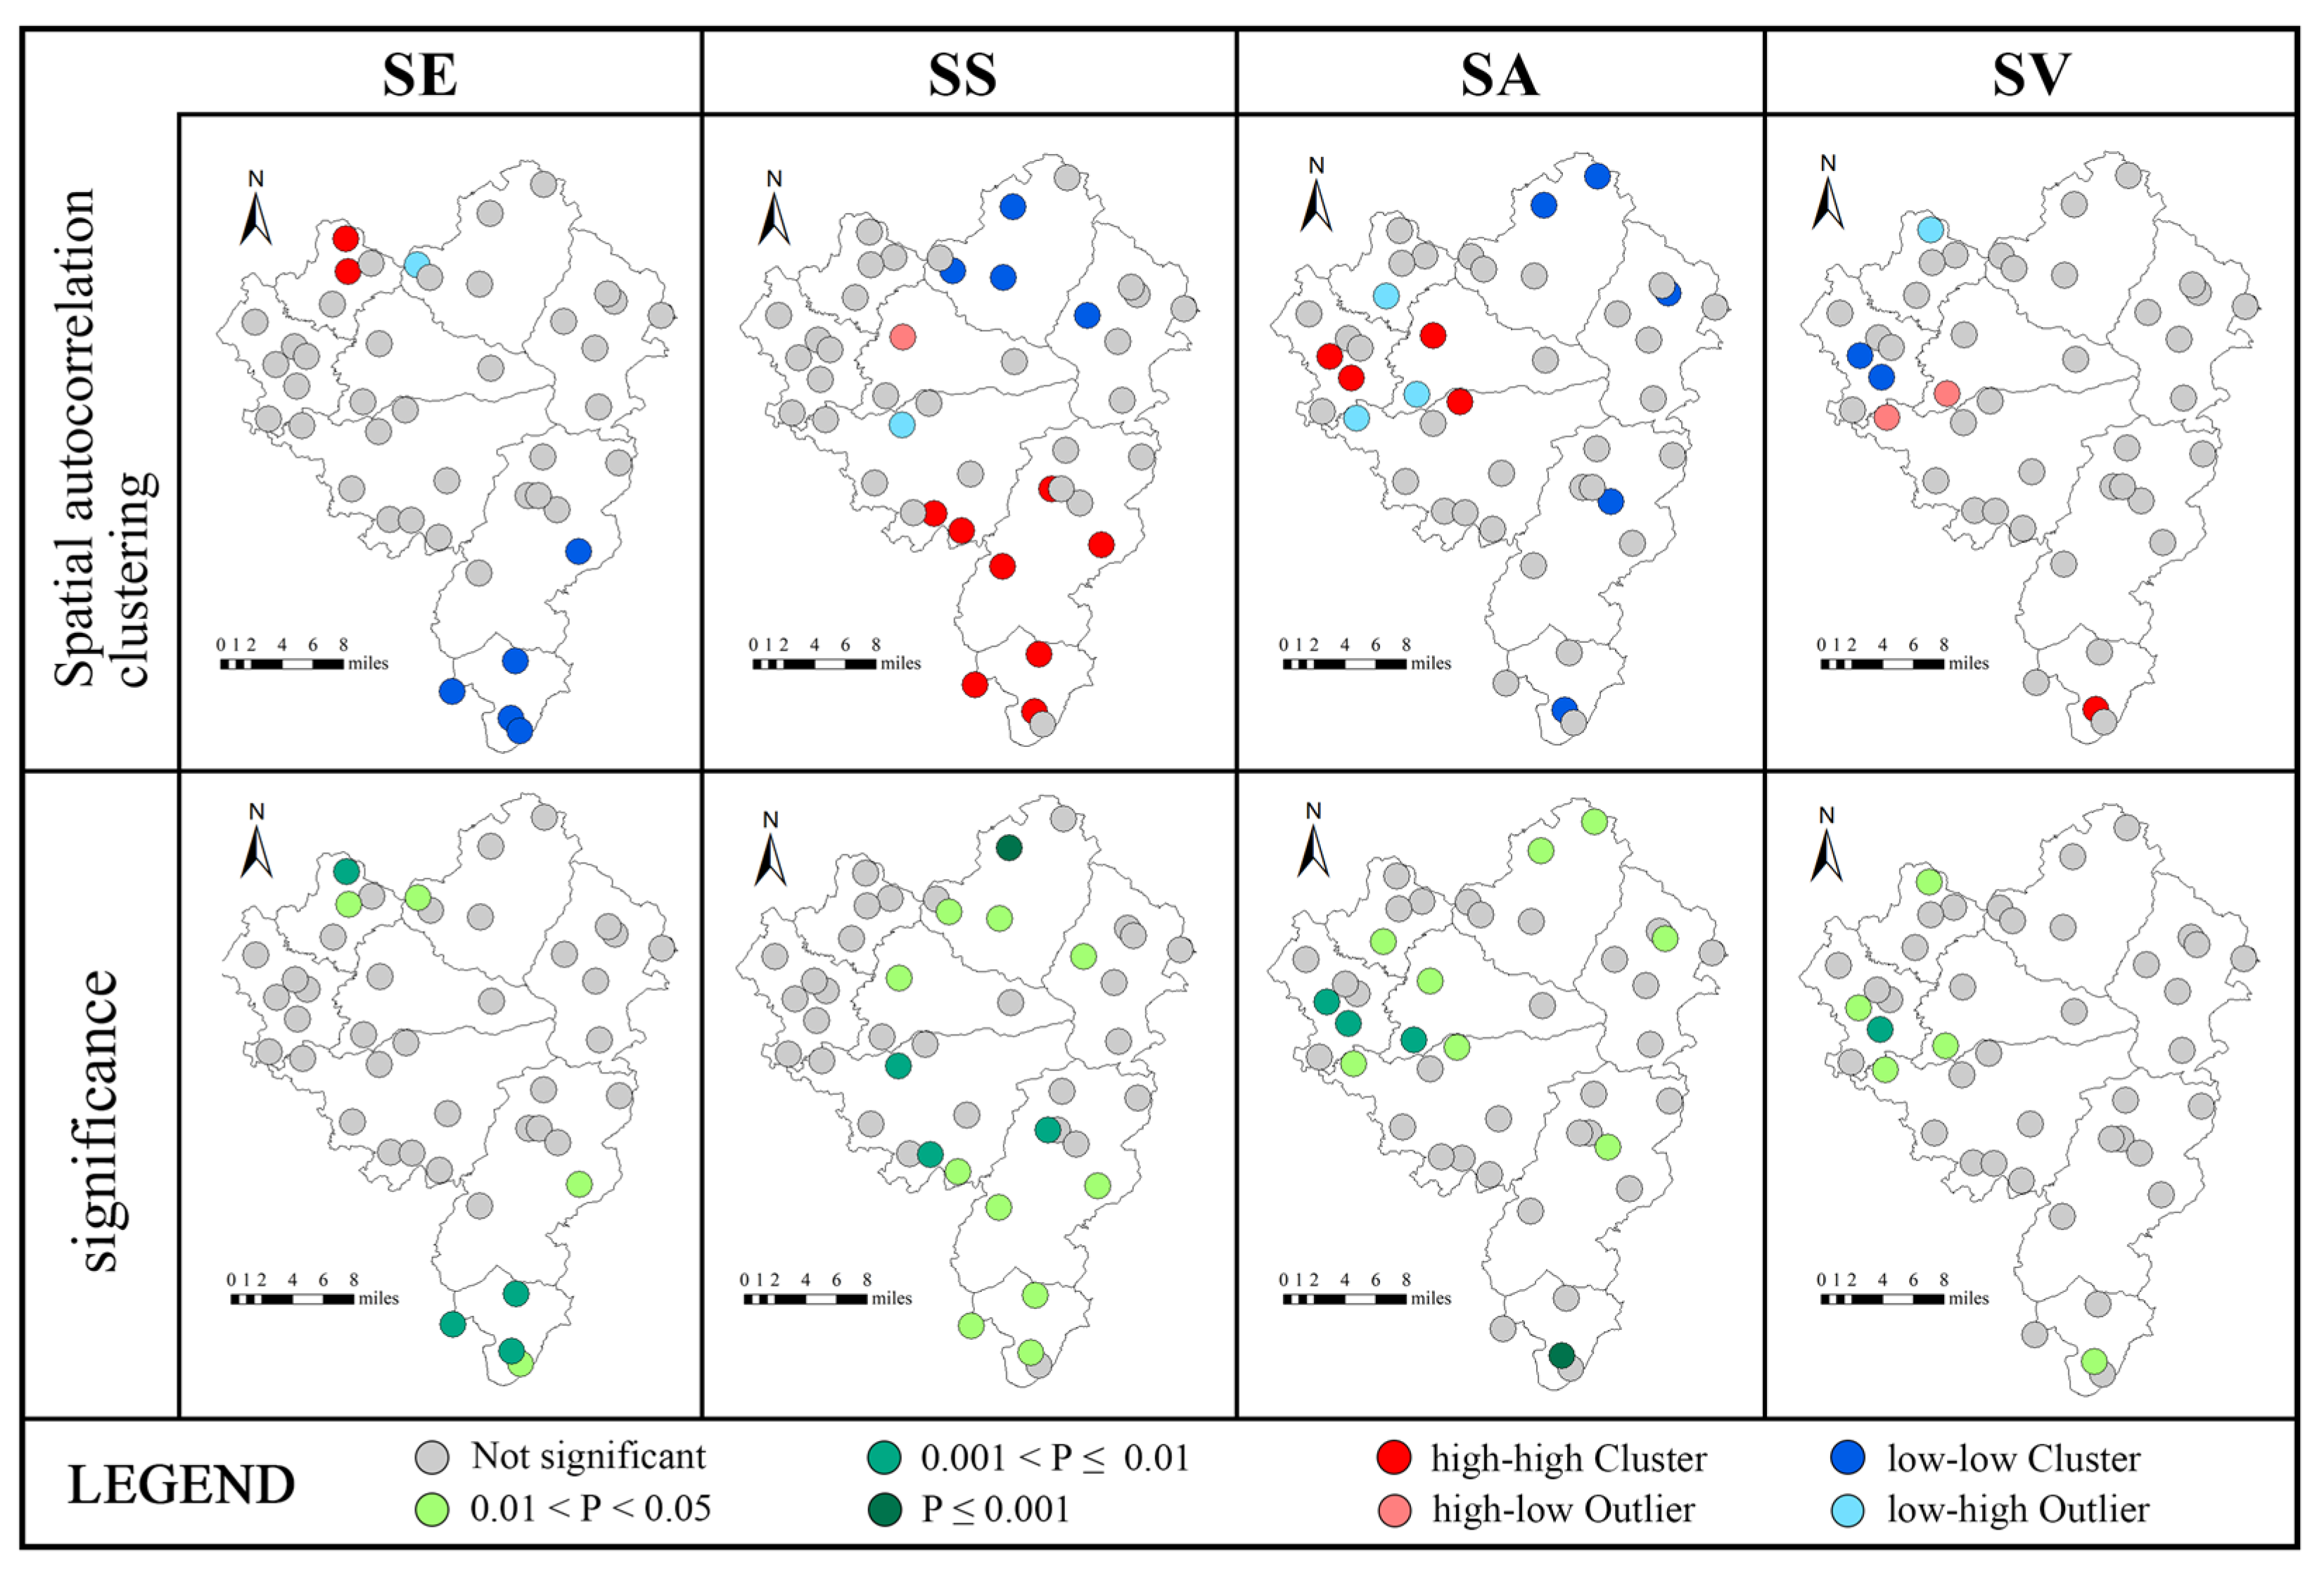
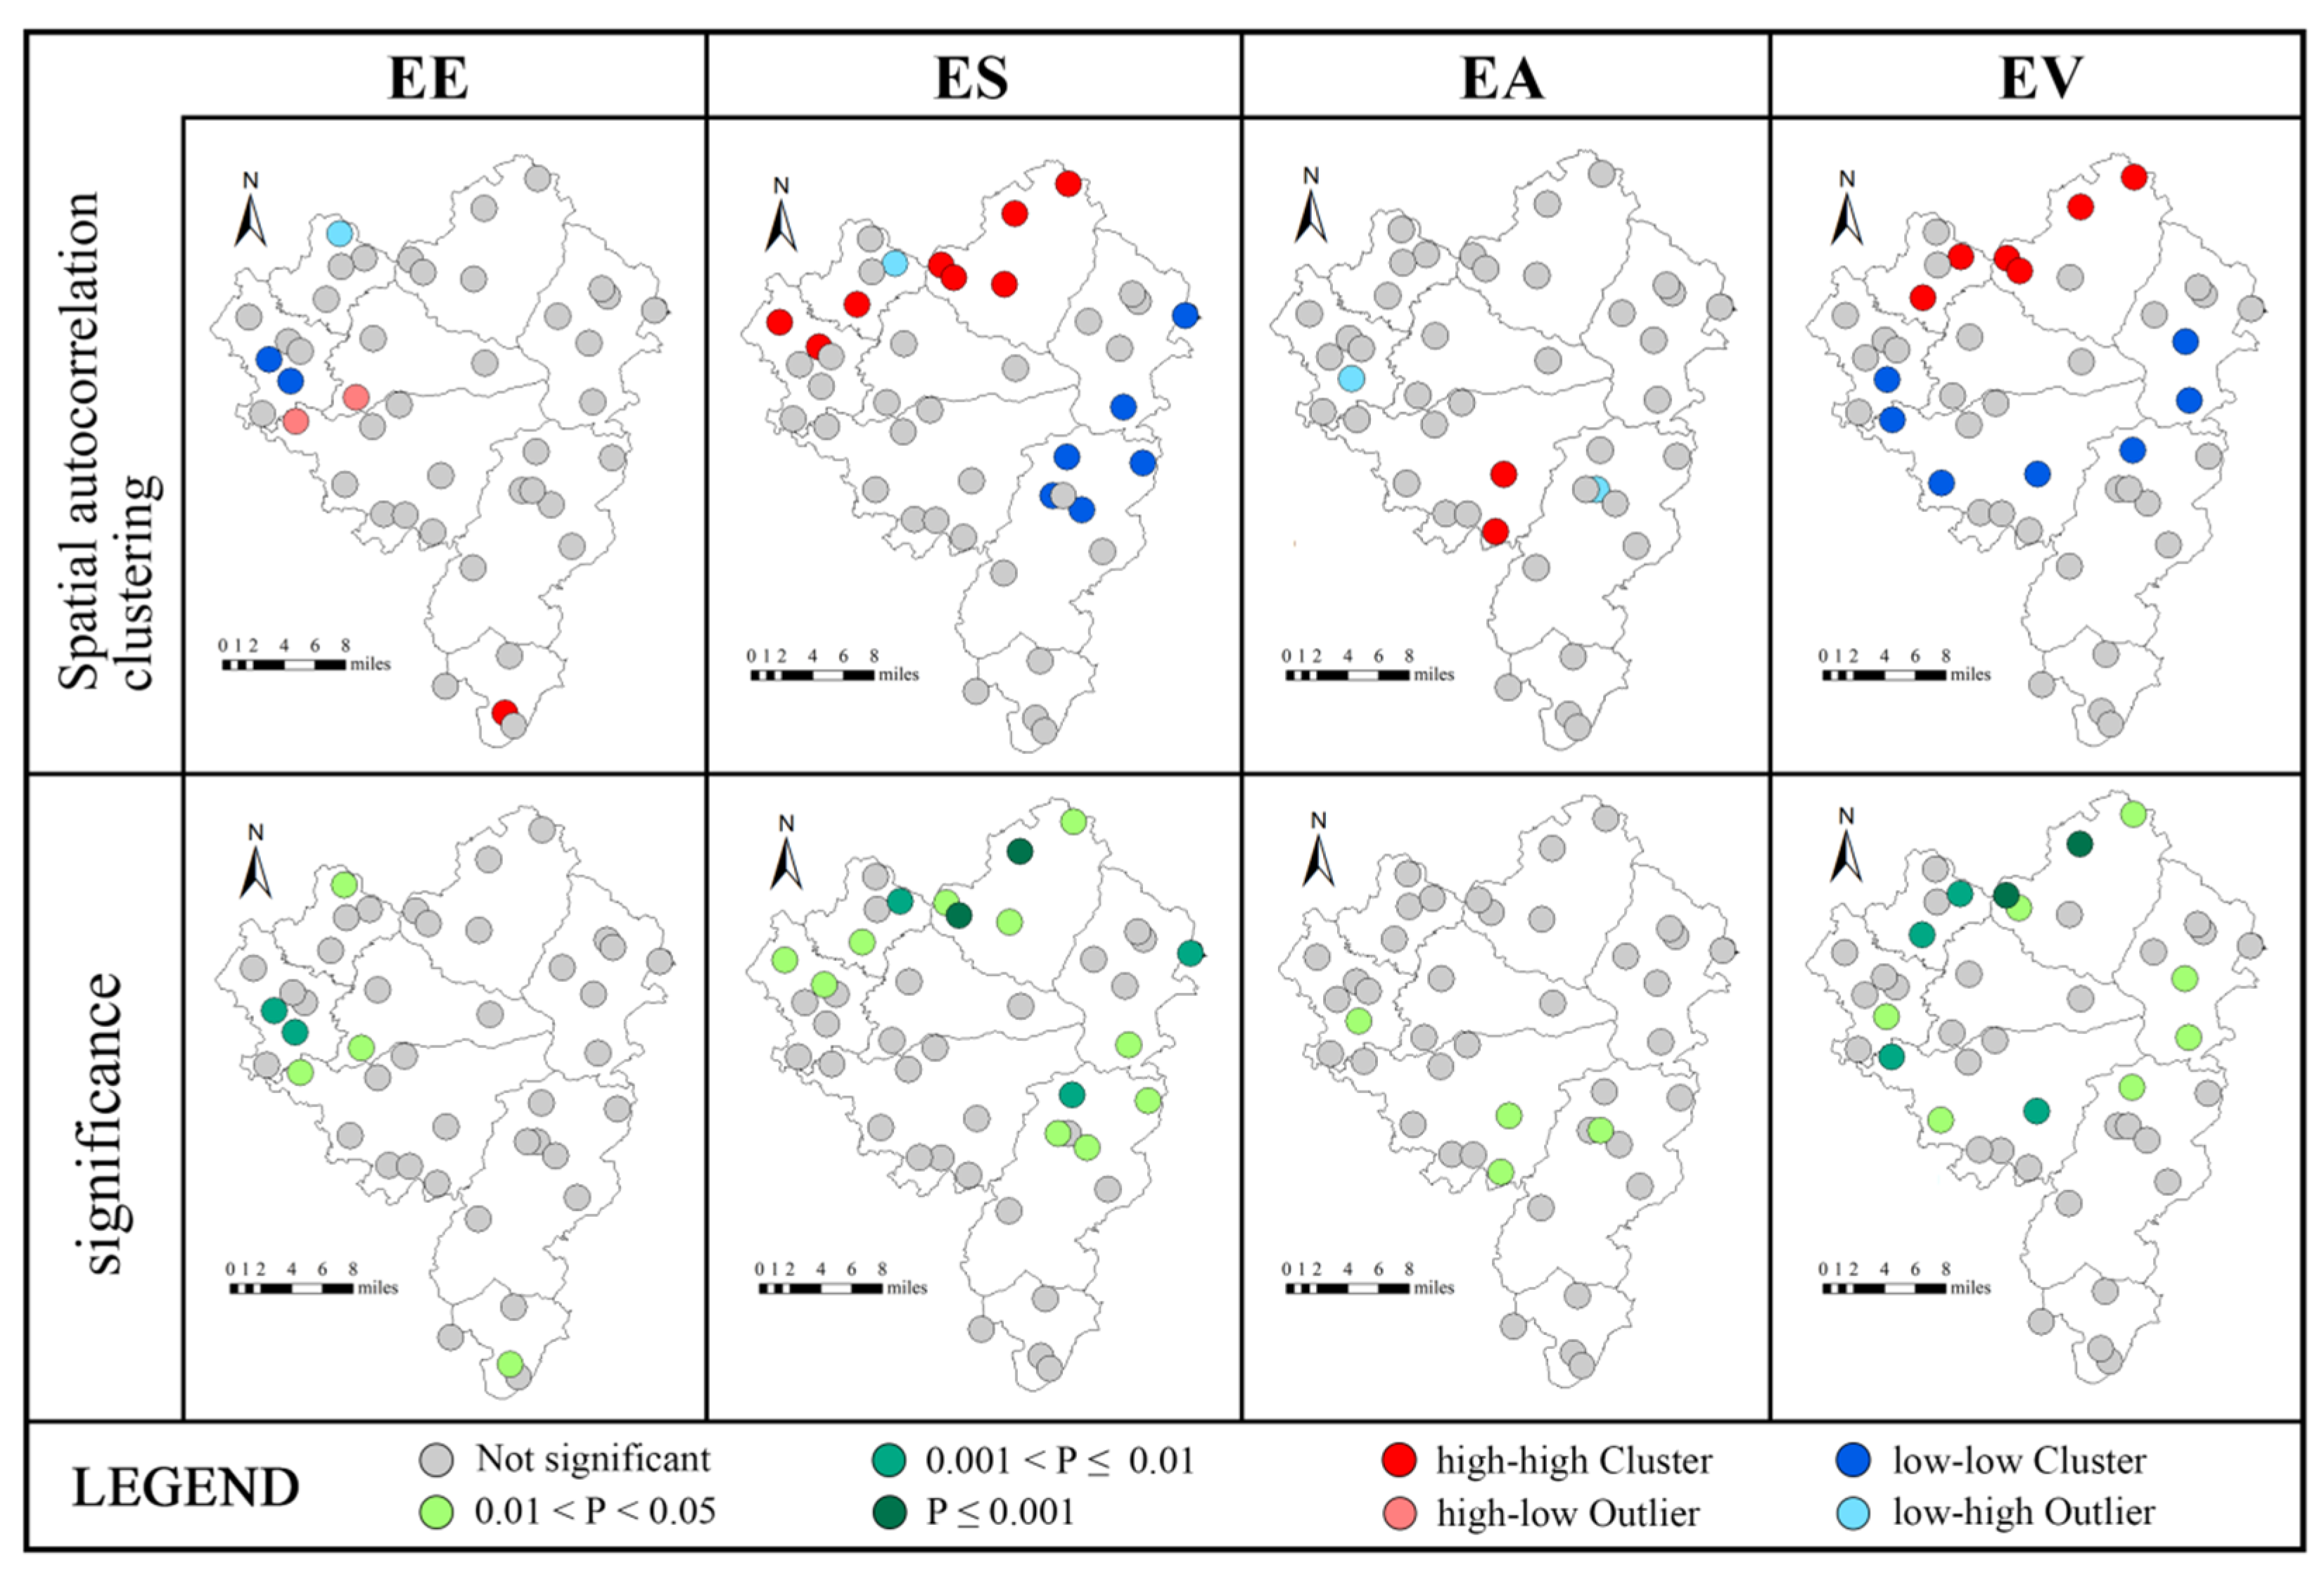
2.3.5. Spatial Autocorrelation

Spatial autocorrelation is an important concept in spatial statistics, a statistical method used to measure the distribution characteristics and interrelationships of spatial data. It reflects the possible dependence or similarity between data values located in adjacent or close positions in space, which typically diminishes or disappears with increasing distance.
Spatial autocorrelation is divided into two types: global spatial autocorrelation and local spatial autocorrelation. The calculation method for the global Moran’s I index is as follows:
I = n i = 1 n j = 1 n w i j P i x ¯ P j x ¯ i = 1 n j = 1 n w i j × i = 1 n P i x ¯ 2
Its value range is [−1, 1], where a positive value indicates positive spatial autocorrelation, meaning that there is a clustering trend of “high-high, low-low” among adjacent elements, and a negative value indicates negative spatial autocorrelation, meaning that there is a distribution trend of “high-low, low-high” among adjacent elements. A value close to 0 indicates a random spatial distribution with no correlation.
Local spatial autocorrelation is used to identify different types of spatial clustering or dispersion phenomena, such as high-value clusters, low-value clusters, high-low outliers, and low-high outliers, within the study area.

2.3.6. Geographic Detector

The geographic detector is a set of statistical methods used to detect spatial heterogeneity and reveal the underlying dynamics. Its core idea is based on an assumption that if an independent variable X has a significant impact on the affected variable Y, the spatial distribution of the independent variable and the affected variable should be similar. The geographic detector mainly includes differentiation and factor detection, interaction detection, risk detection and ecological detection.
Factor detection and interaction detection are the main choices for this study and can be measured by the q value. The range of the q value is [0,1], indicating the degree to which a certain driving factor X explains the vulnerability Y. The higher the q value, the greater the impact on vulnerability, and vice versa. It is calculated using the following formula:
q = 1 h = 1 L N h σ h 2 N σ 2 = 1 S S W S S T
S S W = h = 1 L N h σ h 2 S S T = N σ 2
where h , L represents the layer (category or region) of the dependent variable Y and the independent variable X; N h and N are units of the h layer and region, respectively; σ h 2 and N σ 2 are the variances of layer h and Y values in the region, respectively; SSW is the sum of intra layer variances; and SST is the total variance of a region.
Interaction detection is primarily used to identify interactions between different influencing factors. Specifically, it examines whether the combined effect of influencing factors X1 and X2 enhances or diminishes their explanatory power on the dependent variable (vulnerability), or whether the impact of these factors on vulnerability is independent. Conduct interaction testing is undertaken to evaluate whether the combined effect of two factors (X1 and X2) increases or decreases the explanatory power of the dependent variable Y, or whether these factors have an independent impact on Y.

3. Results

3.1. SV Index and Its Spatial Distribution

The social exposure, sensitivity, adaptability, and vulnerability indices for each village were stratified into five classes using the Jenks natural breaks method, resulting in categories of extremely low, low, moderate, high, and extremely high. The visualization of these results is depicted in Figure 3. (1) The high values of the social exposure index (SEI) constitute 14.0%, predominantly found in the northern region, while other areas generally exhibit moderate values. (2) The social sensitivity index (SSI) shows low values concentrated in the north, making up 41.8%, and high values clustered in the south, accounting for 37.3%. This spatial distribution is closely tied to the intense tourism development in the north and the relative dearth of tourists in the south. (3) High values of the social adaptability index (SAI) are observed in the central and western parts, with the remaining areas showing low values, which represent 60.5%. This pattern is linked to the local government support and higher disaster response funds, particularly in the western region. (4) In total, high values of the social vulnerability index (SVI) account for 48.8%, primarily clustered in the southern part, whereas low values are concentrated in the western and central parts, with the northern areas being of moderate vulnerability, representing 32.6%.
In general, the villages located to the north of the county road exhibit more advanced tourism development and display moderate levels of the SVI. In contrast, those in the central and western regions show lower SVI, attributable to the influx of government support funds. Villages situated further south face increased vulnerability due to their inaccessibility, stemming from inadequate transportation infrastructure and the difficulty associated with reaching tourist destinations. This results in reduced external income and support, consequently elevating their vulnerability.
The results of the analysis of global spatial autocorrelation indicate, as depicted in Table 3, that the Moran’s I indices are all positive, with p-values less than 0.05. Combined with the intervals of z-scores, these results indicate that the spatial distribution of the SEI, SSI, SAI, and the SVI are all statistically significant and exhibit clustering characteristics. Specifically, the spatial clustering characteristics of the SSI are extremely significant. The SAI also manifests a strong spatial agglomeration characteristic, while the SEI and the overall SVI both demonstrate certain spatial clustering tendencies.
The visualization result of local spatial autocorrelation, presented in Figure 4, indicates that, among the 43 villages, the SEI exhibits a distinct clustering effect, characterized by high-high aggregation in the northern regions and low-low aggregation in the southern regions, particularly evident where the county roads intersect in the north. This result is closely related to the more developed tourism industry in the north compared with the less developed tourism in the south of Leishan County. The SSI demonstrates an even stronger clustering effect, with low-low aggregation observed north of the county road and high sensitivity aggregation on the south side. This spatial differentiation is closely associated with the intense tourism development in the northern areas and the relative scarcity of tourists in the southern areas.
Regarding the SAI, the central and western regions generally exhibit high-high aggregation effects, coupled with low-high dispersion. Conversely, the northern, eastern, and southern regions display low-low aggregation effects. Collectively, the adaptability in the western part is relatively high compared with the rest of the areas, which are comparatively lower. This trend is linked to the local government’s support and the allocation of higher disaster response funds in the western region. The spatial distribution of the SVI is characterized by low-low aggregation, primarily in the west, low-high dispersion in the north, and high-high aggregation in the south.

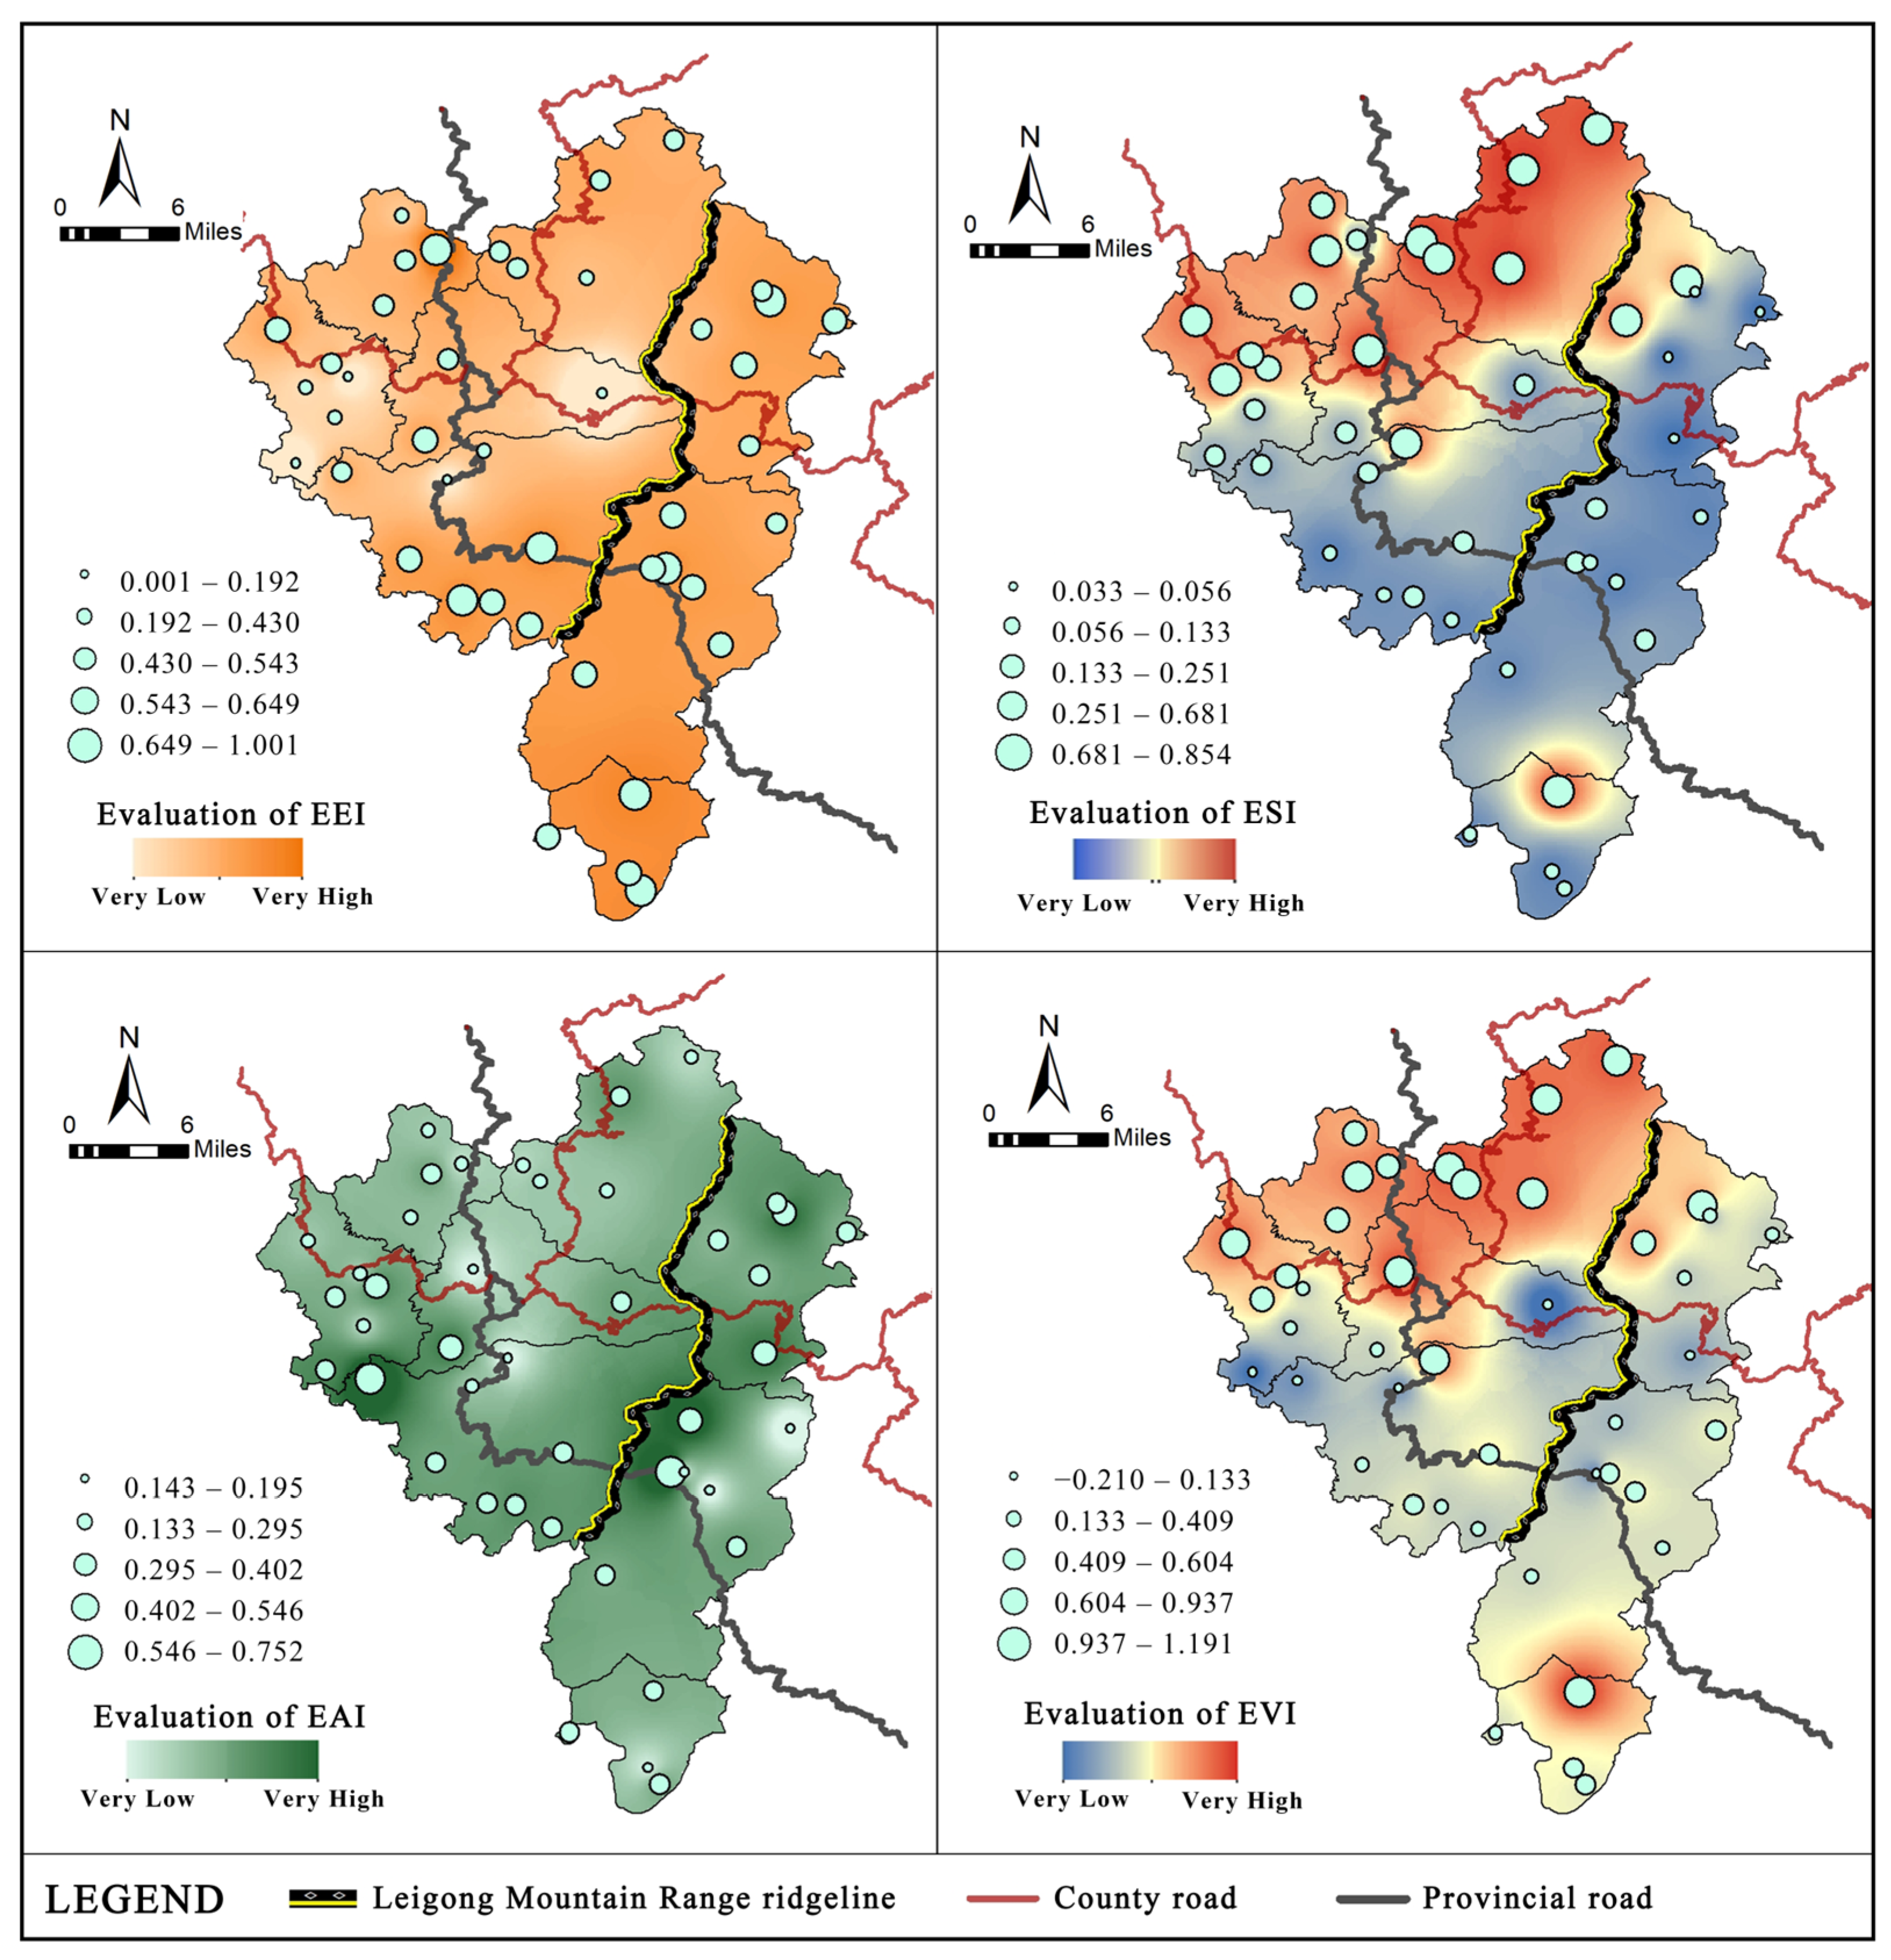
3.2. EV Index and Its Spatial Distribution

Scores were categorized into five classes, as above, to stratify the EV. The results, visualized in Figure 5, are as follows: (1) The ecological exposure index (EEI), based on the SVI, shows high values in 48.8% of the cases, primarily in the southern regions, with moderate values in the north and low values in the central west. (2) The ecological sensitivity index (ESI) exhibits a polarized state between the north and south along the county road, with high values concentrated in the north, accounting for 41.9%, closely related to the inherently high soil sand content in this area. Low values, representing 30.2%, are clustered in the south, where the sensitivity of the karst landscape is lower. (3) The ecological adaptability index (EAI) has high values in only 18.6% of the cases, located in the central west, associated with the high forest coverage in these villages, while the remainder are moderate, making up 44.2%. (4) Overall, the ecological vulnerability index (EVI) scores indicate high values in 41.9% of the cases, with extremely high values reaching 27.9%. The EV is generally higher in the north, with low values in the central region and moderate values mainly in the south, representing 16.3%. The SV has led to an overall increase in the EV in southern impoverished villages.
Overall, the villages located to the north of the county road have more severe ecological conditions, with high sensitivity and low adaptive capacity, making it difficult to support village development through agriculture alone. However, thanks to the development of the tourism industry and the economic feedback, the ecological disadvantages have been alleviated to a certain extent. In contrast, the villages to the south of the county road have relatively better ecological conditions. However, due to poor transportation accessibility and difficulties in constructing infrastructure, it is challenging to develop the tourism industry. As a result, these villages can only rely on agriculture as their economic foundation, which further exacerbates their vulnerability.
The analysis results of global spatial autocorrelation are depicted in Table 4. By considering the sign of Moran’s I, the significance level (p < 0.05), and the interval of the z-score, the spatial distributions of the EEI, ESI, and EVI are statistically significant and exhibit clustering characteristics, whereas the EAI does not show significant features. Specifically, the p-values of ESI and EVI are 0.001, indicating extremely significant spatial clustering features.
The visualization result of local spatial autocorrelation, depicted in Figure 6, indicates that, among the 43 villages studied, the EEI demonstrates a notable low-low clustering effect in the western regions and a high-high clustering effect in the southern regions. The ESI shows an exceedingly strong clustering effect, with several areas in the north exhibiting high-high aggregation, while the eastern regions predominantly display a low-low clustering effect. The spatial distribution characteristics of the EVI reveal high-high aggregation in the northern regions and low-low aggregation in the eastern, western, and central areas. Overall, the northern villages of Leishan County, along with a few villages in the south, exhibit high ecological vulnerability. This is significantly associated with the high degree of rocky desertification and the fragmented nature of agricultural and forested lands in the region. Meanwhile, due to the more developed tourism industry in the northern part, the external disturbances brought about are more pronounced, which has exacerbated the EV, whereas the vulnerability in the central villages is comparatively low.

3.3. Independent Effects of Factors on Vulnerability

In this research, a comprehensive assessment of the SV incorporated a total of 16 evaluative factors. Following geographic detector analysis, as illustrated in Table 5, disaster response funds, the preservation of traditional dwellings, per capita annual income of households, and transportation convenience had been identified as the four most significant factors influencing the SV. Additionally, all four of these factors passed the significance level test (p < 0.05), indicating a very high level of confidence. Among these factors, the preservation of traditional dwellings reflects the cultural heritage embedded in the village, while transportation convenience indicates the ease with which external labor and resources can flow into the village. Both of these are important foundations for tourism development. The per capita annual income of households represents the economic living standard of the villagers, and the disaster response funds reflects the community’s capacity to respond. These two factors directly indicate the economic capacity of the village.
Regarding the EV, seven evaluative factors were encompassed, as illustrated in Table 6. Utilizing geographic detector analysis, the average value of the SV and degree of rocky desertification were pinpointed as the two most impactful factors on the EV by q-value. The p-value affirm that these two factors are associated with a very high level of confidence. The average value of SV reflects the social factors, including tourism, which are significantly correlated with the ecological conditions. The degree of rocky desertification has a direct and important impact on soil and groundwater. Severe rocky desertification can restrict the agricultural foundation of villages.

3.4. Effect of Factor Interactions on Vulnerability

The interaction detector evaluates whether the interaction between any two driving factors enhances the explanatory power of vulnerability. The specific types are shown in Table 7. The result, as shown in Figure 7, indicates that all factors display either a pattern of double-factor enhancement or nonlinear enhancement.
In the SV system, 49 factor combinations exhibit two-factor enhancement, while 70 factor combinations demonstrated nonlinear enhancement. Overall, the three factors of per capita annual household income, preservation degree of traditional dwellings, and disaster response capability (investment funds) has greater impacts on SV when interacting with other factors. The most significant interactions were observed between the preservation of traditional dwellings and the rate of hollowing out, with a q-value reaching 0.955.
In the EV system, eight factor combinations exhibit two-factor enhancement, while twelve factor combinations demonstrated nonlinear enhancement. Overall, the average value of social vulnerability (SV) and soil sand content has greater impacts on EV when interacting with other factors. The most significant interactions were noted between the average value of social vulnerability and soil sand content, with a q-value reaching 0.932.

4. Discussions

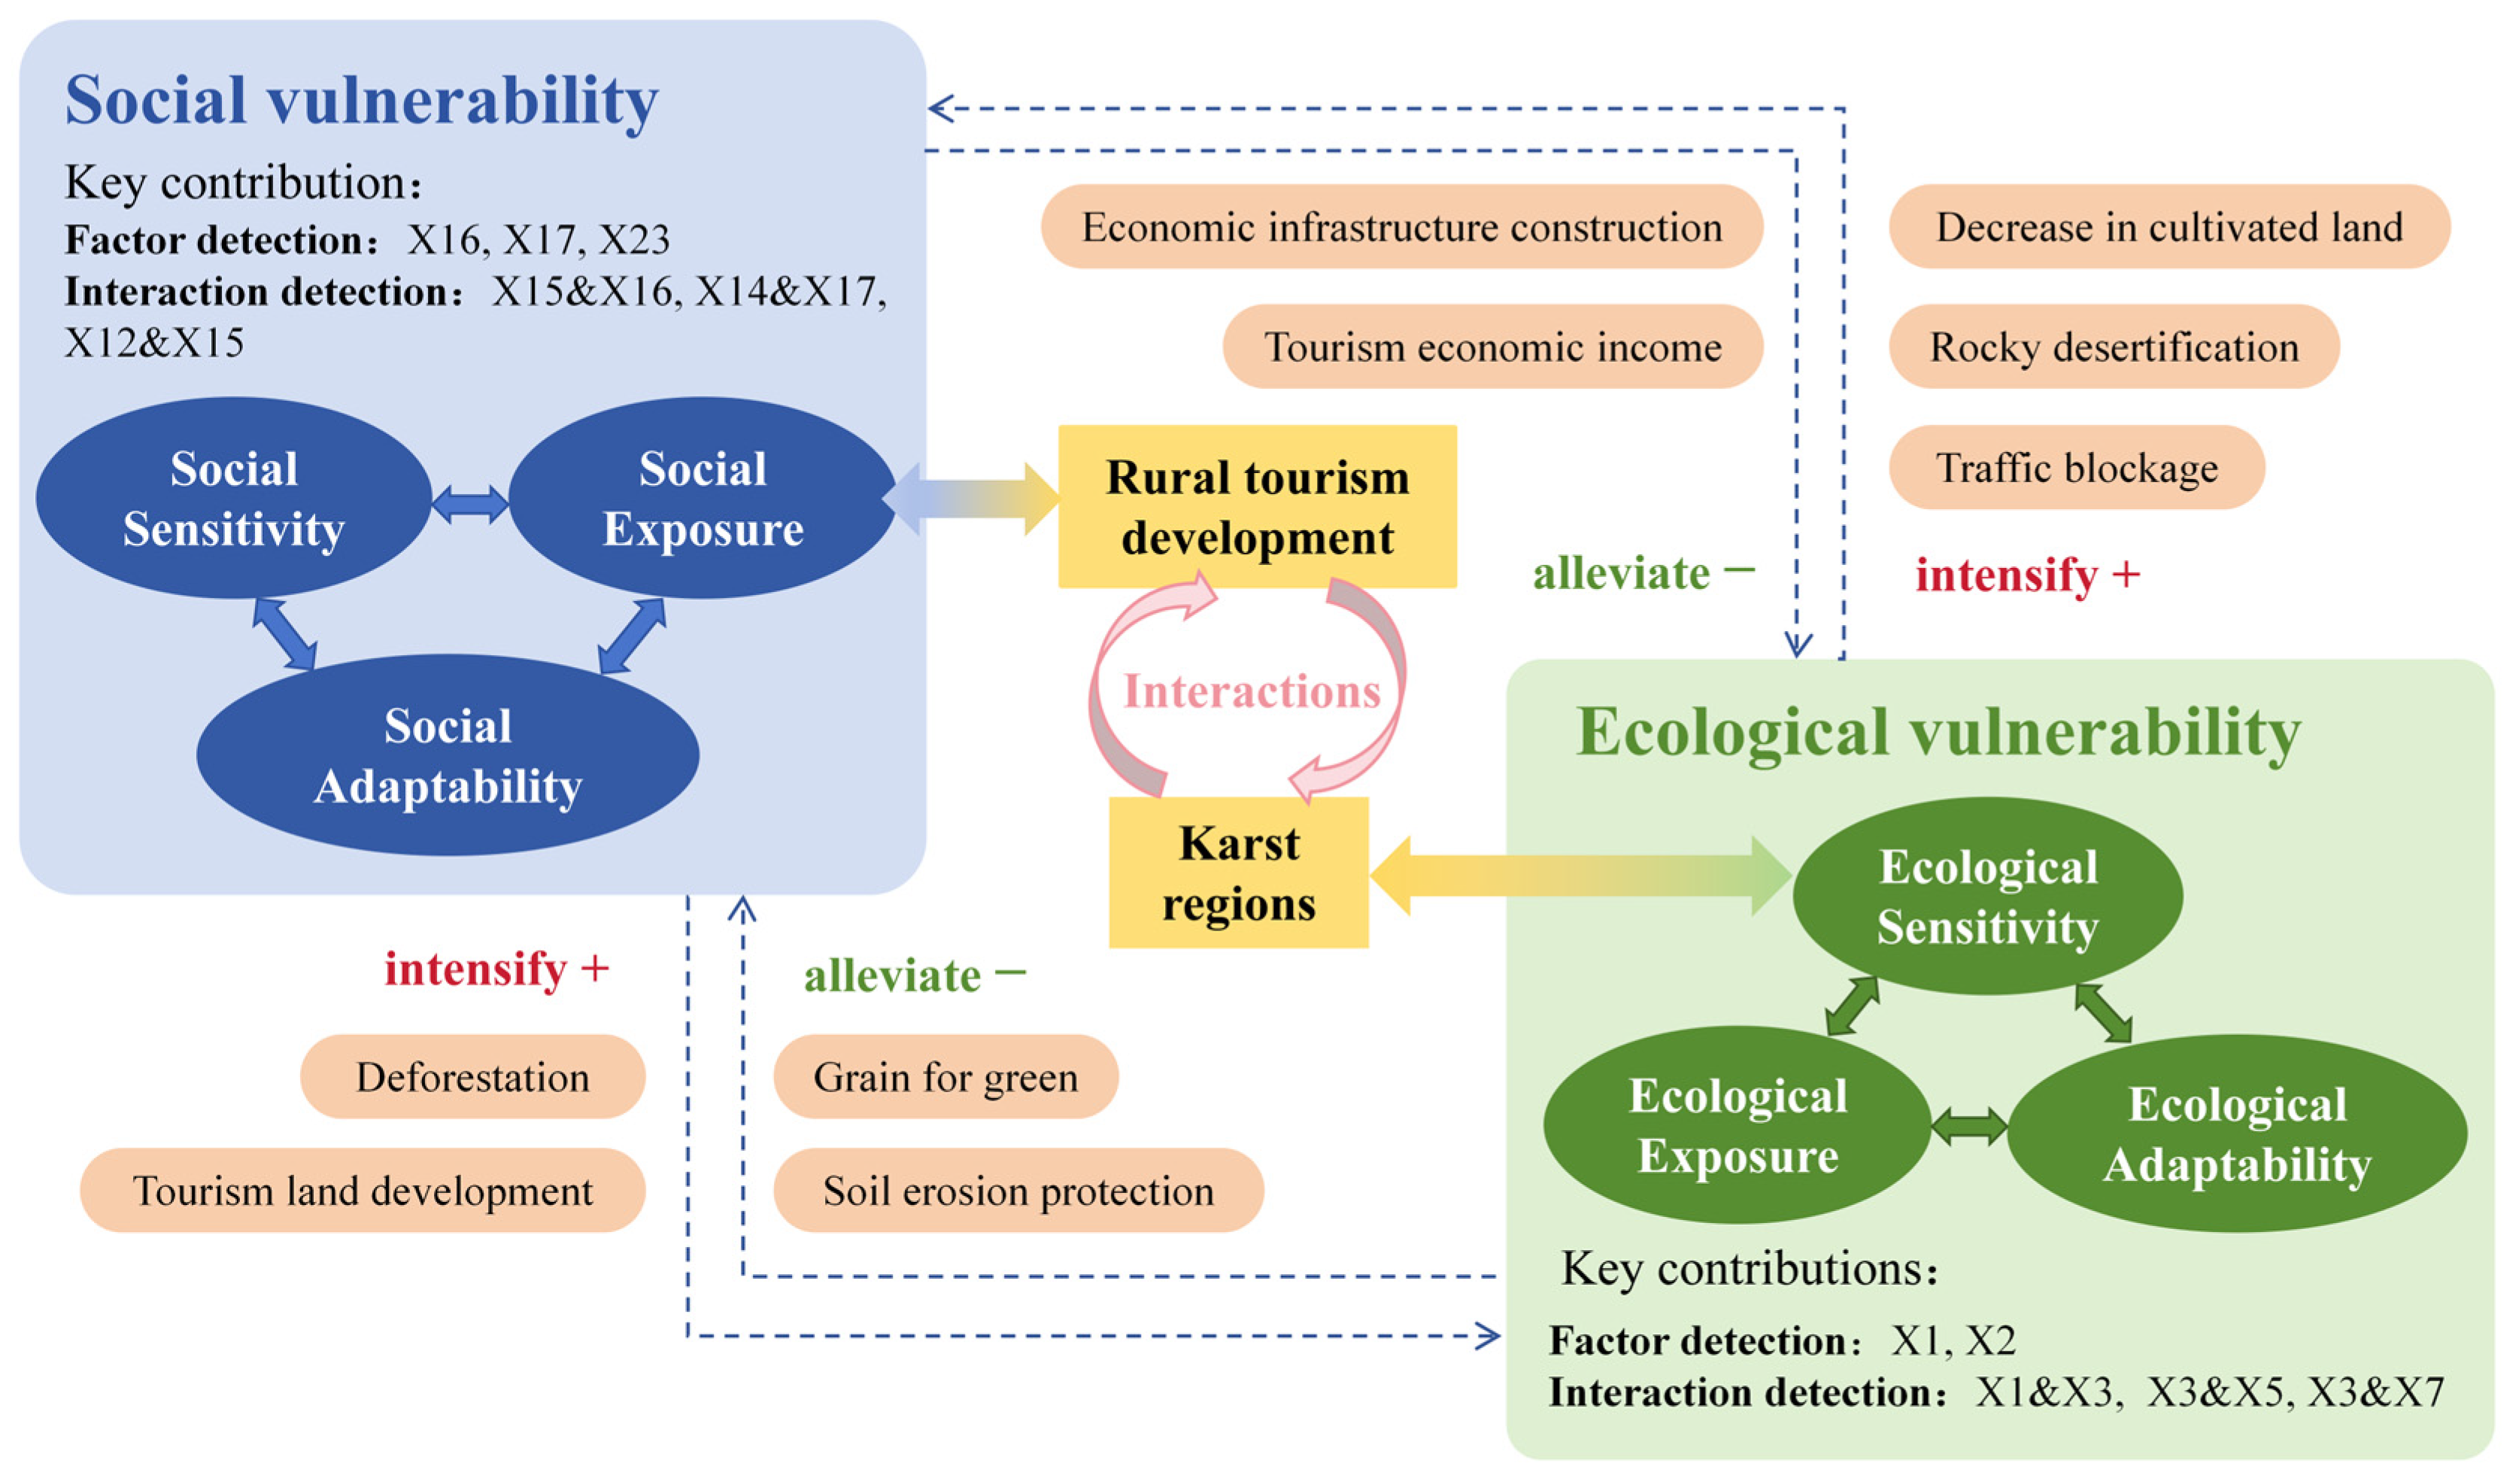
4.1. Mechanism of Action

The KEVs in southwest China confronts the dual challenges of ecological environmental vulnerability and socio-economic poverty, with an intricate interplay between two systems. Ecologically, studies have demonstrated that factors such as rocky desertification and arable land area significantly influence the EV [4]. Socio-economically, human activities including deforestation, improper land use, excessive groundwater extraction, and climate change are deemed critical disturbance factors contributing to the SV [4,5,68]. This study, from the lens of vulnerability, delves into the impact of tourism on the SES of KEVs, highlighting its substantial effect on the SV, which in turn indirectly impacts the EV.
When examining vulnerability, numerous studies have amalgamated ecological and social systems into a single socio-ecological framework. However, this approach often overlooks the autonomy of these systems and tends to regard various external disturbances as a unified entity. In Teng’s study of Qinghai Province, they delineated the ecological and social systems, establishing a framework that linked the two, using the average EV as an exposure indicator for the SV [50]. They discovered that the EV significantly influenced the SV, with the ecological environmental shortcomings limiting the socio-economic development of urban areas. For the sensitive KEVs in southwest China, which is highly reactive to human activities, instituting an independent SV assessment system for static analyses at the county level and below serves as an effective method to monitor the ecological environmental response to social factors. Given that the SV is an underlying structure that can only be measured indirectly [69], employing an independent SV system in the study allows for a clearer observation of the extent to which tourism indirectly affects the EV through the SV. This underscores the substantial influence of social factors on ecological conditions within the karst region.
The impacts of tourism development are primarily derived from two key aspects: the establishment of tourism infrastructures and the activities of tourists [70]. To sustain visitor appeal, tourism infrastructures must be continuously updated, which would result in a decrease in agricultural and ecological land and an expansion of built-up areas [31]. Moreover, the growth and diversification of tourism activities are increasingly exerting environmental pressure on protected ecosystems [70,71]. The construction of communication and transportation infrastructure can better promote exchanges and the flow of resources between regions. The results of the EV assessments indicate that, due to economic backing from local governments and the advancement of county road networks, several villages in the northern part of the county have successfully developed their tourism sectors, thereby bolstering adaptability within these communities. Meanwhile, the process of infrastructure construction creates employment opportunities and increases villagers’ incomes [29]. Regarding tourism activities, accommodations and tourism facilities may lead to the overconsumption of resources and cause environmental pollution. Moreover, over-reliance on the tourism industry may make villages more vulnerable to external factors, such as the impact of pandemics, and may also lead to rising prices. However, tourism activities promote cultural heritage and enhance the cohesion of villages. The income generated from tourism not only improves the living standards of residents but can also be used for ecological restoration projects, such as afforestation. A reciprocally reinforcing dynamic is evident between infrastructure and tourism. For villages with moderate socio-economic conditions, tourism does not substantially contribute to aggravating the EV. In contrast, in regions that are socio-economically disadvantaged but ecologically favorable, tourism development can lead to significant ecological degradation.
Observing the development in KEV, villages with transportation advantages and distinctive cultural characteristics have prioritized tourism development, particularly the socio-economically prosperous Langde Village. The tourism economy has substantially bolstered the adaptability of these villages, alleviating their ecological shortcomings, which affirms that tourism has indeed diminished the SV associated with these factors. Conversely, villages deficient in development capital struggle to cultivate tourism, thus maintaining a persistently low level of social adaptability, and high SV exacerbates their EV.
Different landform types can lead to different primary influencing factors on the EV. Zhao and Xue’s research on Qinghai Province and the Tarim River Basin identified harsh climatic conditions as the predominant cause of regional EV [72,73]. However, the degree of rocky desertification emerges as the most significant factor impacting the EV in KEVs. The result of interactions corroborates those of numerous previous studies, demonstrating a close relationship between rocky desertification, forest coverage, and arable land area.
We summarize the relationship between tourism and the vulnerability of ecosystems and social systems in the karst environment in this study, as shown in Figure 8. This study provides an assessment of the vulnerability in KEVs influenced by tourism development, encompassing both social and ecological systems, and offers novel insights along with valuable theoretical guidance.

4.2. Policy Recommendations

Based on the analysis of vulnerability in KEVs, as well as a comprehensive review of relevant literature, this study offers the following policy recommendations at ecological and social levels:
First, policies should be tailored to local conditions. For villages where tourism has significantly enhanced adaptive capacity, efforts should be made to further attract tourists through the improvement of infrastructure. However, it is crucial to ensure ecological balance in tourism land development and activity organization to avoid excessive ecological disturbances caused by human construction activities. For villages with good ecological conditions but lacking tourism potential, tourism development should not be pursued blindly. Instead, strict control over ecological and agricultural protection boundaries should be maintained, with agriculture and local resources serving as the primary basis for development. In Leishan County, villages in the northern part, which are mainly tourism-oriented, should focus on preventing ecological degradation during development. In contrast, villages in the southern part, which are resource-oriented, should pay more attention to socio-economic issues and leverage the unique mineral resources of KEVs, while characteristic industries should be cultivated to develop a range of products. This will facilitate the conversion of ecological resources into developmental advantages and solidify the achievements of poverty alleviation efforts. However, during the process of industrial structure adjustment, there may be impacts on local traditional agriculture and employment structures. It is necessary to properly manage the transition between old and new industries and address the issue of labor force reallocation.
Second, it is essential to establish a new indicator system to assess the effectiveness of rocky desertification control measures, while continuing efforts in ecological restoration and protection. This should focus on maintaining soil and water balance, adjusting land use structure, and optimizing arable land allocation. This requires a significant investment in equipment and specialized personnel, that is, higher financial and human resource costs. Moreover, during the adjustment of land use and the optimization of arable land allocation, issues related to villagers’ land rights and interest distribution may arise, which can easily lead to conflicts and disputes. Additionally, comprehensive pollution prevention and drought monitoring and early warning systems should be established, along with the development of soil and water databases across various spatiotemporal scales. These measures will help prevent groundwater pollution and extreme drought events, thereby enhancing ecological risk prevention and control.
Finally, the construction and management of service facilities in tourist villages require specialized talent. However, there is a severe brain drain in the local area, making it difficult to attract and retain such personnel. Policy recommendations should focus on several key areas: encouraging rational migration between urban and rural areas, increasing investment in educational resources, and improving the industrial chain and service system in tourist villages. Additionally, the industrial structure of resource-based villages should be adjusted to create more non-agricultural employment opportunities. These measures will help promote coordinated regional development, enhance socio-economic resilience, and consolidate the achievements of ecological protection.
In the quest to diminish the SV, Cheng underscored the critical role of both top-down policies and bottom-up initiatives [74]. Specifically, land management strategies at the governmental level are essential in easing the pressures faced by residents. This perspective is reinforced by Vilhar [5], who demonstrated that prudent land management can yield tangible benefits for the community. The implementation of soil protection programs serves a dual purpose: it is a direct measure of environmental conservation and a fundamental aspect of local community education [75]. Recent studies have highlighted the pivotal function of education in elevating public awareness regarding the delicacy of KEVs. Through educational initiatives, particularly those targeting the younger demographic, there is an enhanced understanding of the significance of karst environments and their natural resources. This encompasses not only environmental preservation but also the recognition of the sustainable utilization of natural resources, which is crucial for the conservation of KEVs and the promotion of sustainable natural resources.

5. Conclusions

This study, grounded in ecological and social data from 43 randomly selected villages in Leishan County, aims to reveal the spatial distribution characteristics of the SV and EV among the KEVs of southwest China, particularly under the influence of tourism development, and to pinpoint key influencing factors and their interactions. Utilizing the VSD conceptual model, the research develops an evaluation indicator system to assess the SVI and EVI of study area. Subsequently, we employed spatial autocorrelation analysis and geographical detector method, explored the underlying driving factors and arrived at the following conclusions:
(1) Leishan County in Guizhou Province presents overall high levels of SVI and EVI. The areas with the severe EVI are mainly concentrated in the northern part of the county, while those with severe SVI are concentrated in the southern part.
(2) Disaster response funds, the preservation of traditional dwellings, per capita annual income of households, and transportation convenience are the four most significant factors affecting the SV in ethnic villages of karst regions. The average value of the SVI (reflecting the combined impact of tourism development and local social factors) and degree of rocky desertification are the two most significant factors affecting the EV in ethnic villages of karst regions.
(3) The three factors of per capita annual household income, preservation degree of traditional dwellings, and disaster response capability (investment funds) has greater impacts on SV when interacting with other factors. In terms of the EV, the average value of the SV and degree of rocky desertification has greater impacts.
(4) Tourism development has a significant impact on the SV, generally showing an effect of alleviation. Villages with different ecological and social conditions respond differently to the SV. Villages with better socio-economic conditions can effectively feedback the ecological environment, while those with poorer socio-economic conditions may exacerbate ecological damage.
Drawing from the vulnerability assessment findings presented herein, this research offers policy recommendations to mitigate the negative impact of tourism development on KEVs. The aim is to furnish scientific guidance and pragmatic reference for fostering sustainable development in these areas.

Author Contributions

Conceptualization, C.W.; Methodology, H.Z.; Formal analysis, Y.B.; Investigation, C.W.; Data curation, Y.B.; Writing—original draft, Y.B.; Writing – review & editing, Y.B.; Supervision, C.W. All authors have read and agreed to the published version of the manuscript.

Funding

This research was funded by the National Natural Science Foundation of China (52468005): Science and Technology Program of Guizhou Province (ZK[2023]061).

Data Availability Statement

Data is contained within the article.

Conflicts of Interest

The authors declare no conflict of interest.

References

  1. Huang, C.; Xu, N. Quantifying urban expansion from 1985 to 2018 in large cities worldwide. Geocarto Int. 2022, 37, 18356–18371. [Google Scholar] [CrossRef]
  2. Huang, C.; Tang, Y.; Wu, Y.; Tao, Y.; Xu, M.; Xu, N.; Li, M.; Liu, X.; Xi, H.; Ou, W. Assessing Long-Term Thermal Environment Change with Landsat Time-Series Data in a Rapidly Urbanizing City in China. Land 2024, 13, 177. [Google Scholar] [CrossRef]
  3. Ou, Y.; Zheng, J.; Liang, Y.; Bao, Z. When green transportation backfires: High-speed rail’s impact on transport-sector carbon emissions from 315 Chinese cities. Sustain. Cities Soc. 2024, 114, 105770. [Google Scholar] [CrossRef]
  4. D’Ettorre, U.S.; Liso, I.S.; Parise, M. Desertification in karst areas: A review. Earth-Sci. Rev. 2024, 253, 104786. [Google Scholar] [CrossRef]
  5. Vilhar, U.; Kermavnar, J.; Kozamernik, E.; Petrič, M.; Ravbar, N. The effects of large-scale forest disturbances on hydrology—An overview with special emphasis on karst aquifer systems. Earth-Sci. Rev. 2022, 235, 104243. [Google Scholar] [CrossRef]
  6. Zhang, M.; Chen, E.; Zhang, C.; Liu, C.; Li, J. Multi-Scenario Simulation of Land Use Change and Ecosystem Service Value Based on the Markov–FLUS Model in Ezhou City, China. Sustainability 2024, 16, 6237. [Google Scholar] [CrossRef]
  7. Kwak, Y.; Chen, S. Integrating seasonal climate variability and spatial accessibility in ecosystem service value assessment for optimized NbS allocation. Urban Clim. 2025, 59, 102314. [Google Scholar] [CrossRef]
  8. Kates, R.W.; Clark, W.C.; Corell, R.; Hall, J.M.; Jaeger, C.C.; Lowe, I.; McCarthy, J.J.; Schellnhuber, H.J.; Bolin, B.; Dickson, N.M.; et al. Environment and development. Sustainability science. Science 2001, 292, 641–642. [Google Scholar] [CrossRef]
  9. Turner, B.L.; Kasperson, R.E.; Matson, P.A.; McCarthy, J.J.; Corell, R.W.; Christensen, L.; Eckley, N.; Kasperson, J.X.; Luers, A.; Martello, M.L.; et al. A framework for vulnerability analysis in sustainability science. Proc. Natl. Acad. Sci. USA 2003, 100, 8074–8079. [Google Scholar] [CrossRef]
  10. Huang, C.; Xu, N. Climatic factors dominate the spatial patterns of urban green space coverage in the contiguous United States. Int. J. Appl. Earth Obs. Geoinf. 2022, 107, 102691. [Google Scholar] [CrossRef]
  11. Huang, X.; He, J.; Zhang, Q.; Wu, Z.; Wu, Y. Evaluating wetland ecosystem services value and dominant functions: Insights from the Pearl River Delta. J. Environ. Manag. 2024, 371, 123069. [Google Scholar] [CrossRef] [PubMed]
  12. Huang, Z.; Huang, R. Research on Rural Culture under the Background of Urbanization and Tourism Development: Academic Controversy and Research Directions. Geogr. Res. 2018, 37, 233–249. [Google Scholar]
  13. Ma, D.Y.; Zhang, C. Study of the Main Social Problems of Tourism Development in Ethnic Villages. In Proceedings of the 2017 6th International Conference on Energy and Environmental Protection (ICEEP 2017), Zhuhai, China, 29–30 June 2017; pp. 268–271. [Google Scholar]
  14. Lee, Y.-J. Social vulnerability indicators as a sustainable planning tool. Environ. Impact Assess. Rev. 2014, 44, 31–42. [Google Scholar] [CrossRef]
  15. Ford, D.; Williams, P. Introduction to Karst. In Karst Hydrogeology and Geomorphology; John Wiley & Sons: Hoboken, NJ, USA, 2007; pp. 1–8. [Google Scholar]
  16. Van Beynen, P.; Townsend, K. A Disturbance Index for Karst Environments. Environ. Manag. 2005, 36, 101–116. [Google Scholar] [CrossRef]
  17. Wang, L.; Chen, Q.; Zhou, Z.; Zhao, X.; Luo, J.; Wu, T.; Sun, Y.; Liu, W.; Zhang, S.; Zhang, W. Crops planting structure and karst rocky desertification analysis by Sentinel-1 data. Open Geosci. 2021, 13, 867–879. [Google Scholar] [CrossRef]
  18. Ma, J.; Li, C.X.; Wei, H.; Ma, P.; Yang, Y.J.; Ren, Q.S.; Zhang, W. Ecological Vulnerability Assessment of Three Gorges Reservoir Area. J. Ecol. 2015, 35, 7117–7129. [Google Scholar]
  19. García-Sánchez, I.-M.; Almeida, T.A.d.N.; Camara, R.P.d.B. A proposal for a Composite Index of Environmental Performance (CIEP) for countries. Ecol. Indic. 2015, 48, 171–188. [Google Scholar] [CrossRef]
  20. Burrell, A.L.; Evans, J.P.; De Kauwe, M.G. Anthropogenic climate change has driven over 5 million km2 of drylands towards desertification. Nat. Commun. 2020, 11, 3853. [Google Scholar] [CrossRef]
  21. UNCCD. Conference of the Parties to the United Nations Convention to Combat Desertification in Those Countries Experiencing Serious Drought and/or Desertification, particularly in Africa (8th sess.: 2007: Madrid). In Report of the Conference of the Parties on its 8th session, held in Madrid from 3 to 14 September 2007; Part 1, Proceedings; UN: Geneva, Switzerland, 2007. [Google Scholar]
  22. Zhao, D.; Liu, F. Indigenous Forest Knowledge (IFK) and Nature Reserve Workers’ Perceptions of IFK: A Case Study of Leigongshan National Nature Reserve, China. J. Sustain. For. 2022, 41, 721–744. [Google Scholar] [CrossRef]
  23. Ciacci, A.; Ivaldi, E.; Mangano, S.; Ugolini, G.M. Environment, logistics and infrastructure: The three dimensions of influence of Italian coastal tourism. J. Sustain. Tour. 2023, 31, 1583–1607. [Google Scholar] [CrossRef]
  24. Okumus, F.; Kocak, E. Tourism and economic output: Do asymmetries matter? Ann. Tour. Res. 2023, 100, 103570. [Google Scholar] [CrossRef]
  25. Qiu, R.T.R.; Park, J.; Li, S.; Song, H. Social costs of tourism during the COVID-19 pandemic. Ann. Tour. Res. 2020, 84, 102994. [Google Scholar] [CrossRef] [PubMed]
  26. Khan, A.; Bibi, S.; Lyu, J.; Latif, A.; Lorenzo, A. COVID-19 and sectoral employment trends: Assessing resilience in the US leisure and hospitality industry. Curr. Issues Tour. 2021, 24, 952–969. [Google Scholar] [CrossRef]
  27. Kanwal, S.; Rasheed, M.I.; Pitafi, A.H.; Pitafi, A.; Ren, M. Road and transport infrastructure development and community support for tourism: The role of perceived benefits, and community satisfaction. Tour. Manag. 2020, 77, 104014. [Google Scholar] [CrossRef]
  28. Ou, Y.; Zheng, J.; Li, S.; Chen, K.; Bao, Z. High-speed rail development and economic performance: A perspective on urban-rural disparities in the treatment and spillover effects. Res. Transp. Bus. Manag. 2025, 59, 101287. [Google Scholar] [CrossRef]
  29. Yang, E. Spatiotemporal role of tourism in mitigating social vulnerability. J. Hosp. Tour. Manag. 2024, 60, 291–302. [Google Scholar] [CrossRef]
  30. Alvarez, S.; Bahja, F.; Fyall, A. A framework to identify destination vulnerability to hazards. Tour. Manag. 2022, 90, 104469. [Google Scholar] [CrossRef]
  31. Zhao, J.; Li, S. The Impact of Tourism Development on the Environment in China. Acta Sci. Malays. 2018, 2, 1–4. [Google Scholar] [CrossRef]
  32. Gabor, T.; Griffith, T.K. The assessment of community vulnerability to acute hazardous materials incidents. J. Hazard. Mater. 1980, 3, 323–333. [Google Scholar] [CrossRef]
  33. Adger, W.N. Vulnerability. Glob. Environ. Change 2006, 16, 268–281. [Google Scholar] [CrossRef]
  34. De Lange, H.J.; Sala, S.; Vighi, M.; Faber, J.H. Ecological vulnerability in risk assessment—A review and perspectives. Sci. Total Environ. 2010, 408, 3871–3879. [Google Scholar] [CrossRef] [PubMed]
  35. Ling, H.; Guo, B.; Zhang, G.; Xu, H.; Deng, X. Evaluation of the ecological protective effect of the “large basin” comprehensive management system in the Tarim River basin, China. Sci. Total Environ. 2019, 650, 1696–1706. [Google Scholar] [CrossRef] [PubMed]
  36. Nguyen, A.K.; Liou, Y.-A.; Li, M.-H.; Tran, T.A. Zoning eco-environmental vulnerability for environmental management and protection. Ecol. Indic. 2016, 69, 100–117. [Google Scholar] [CrossRef]
  37. Chen, J.; Yang, X.; Yin, S.; Wu, K.; Deng, M.; Wen, X. The vulnerability evolution and simulation of social-ecological systems in a semi-arid area: A case study of Yulin City, China. J. Geogr. Sci. 2018, 28, 152–174. [Google Scholar] [CrossRef]
  38. Blaikie, P.; Cannon, T.; Davis, I.; Wisner, B. At Risk: Natural Hazards, People’s Vulnerability and Disasters, 2nd ed.; Routledge: Abingdon, UK, 2014. [Google Scholar] [CrossRef]
  39. Hambling, T.; Weinstein, P.; Slaney, D. A Review of Frameworks for Developing Environmental Health Indicators for Climate Change and Health. Int. J. Environ. Res. Public Health 2011, 8, 2854–2875. [Google Scholar] [CrossRef]
  40. Zhou, S.; Ye, J.; Li, J.; Zhang, G.; Duan, Y. Identifying intrinsic drivers to changes in riparian ecosystem services by using PSR framework: A case study of the Grand Canal in Jiangsu, China. Environ. Dev. 2022, 43, 100728. [Google Scholar] [CrossRef]
  41. Beroya-Eitner, M.A. Ecological vulnerability indicators. Ecol. Indic. 2016, 60, 329–334. [Google Scholar] [CrossRef]
  42. Polsky, C.; Neff, R.; Yarnal, B. Building comparable global change vulnerability assessments: The vulnerability scoping diagram. Glob. Environ. Change 2007, 17, 472–485. [Google Scholar] [CrossRef]
  43. Chen, J.; Yang, X.J.; Ying, S.; Wu, K.S. Evolution and simulation of social ecosystem vulnerability in semi-arid regions based on VSD framework. Geogr. J. 2016, 71, 1172–1188. [Google Scholar] [CrossRef]
  44. Marshall, N.A.; Marshall, P.A.; Tamelander, J.; Obura, D.; Malleret-King, D.; Cinner, J.E. A Framework for Social Adaptation to Climate Change: Sustaining Tropical Coastal Communities and Industries; IUCN: Gland, Switzerland, 2010. [Google Scholar]
  45. Yu, Z.Y.; Li, B.; Zhang, X.S. Analysis of Social Ecological System and Vulnerability Driving Mechanism. J. Ecol. 2014, 34, 1870–1879. [Google Scholar]
  46. Coluzzi, R.; Bianchini, L.; Egidi, G.; Cudlin, P.; Imbrenda, V.; Salvati, L.; Lanfredi, M. Density matters? Settlement expansion and land degradation in Peri-urban and rural districts of Italy. Environ. Impact Assess. Rev. 2022, 92, 106703. [Google Scholar] [CrossRef]
  47. Jiang, H.; Yu, Y.; Chen, M.-M.; Huang, W. The climate change vulnerability of China: Spatial evolution and driving factors. Environ. Sci. Pollut. Res. 2021, 28, 39757–39768. [Google Scholar] [CrossRef] [PubMed]
  48. Guo, B.; Zang, W.; Luo, W. Spatial-temporal shifts of ecological vulnerability of Karst Mountain ecosystem-impacts of global change and anthropogenic interference. Sci. Total Environ. 2020, 741, 140256. [Google Scholar] [CrossRef] [PubMed]
  49. Wei, J.; Guo, Y.M.; Sun, L.; Jiang, T.; Tian, X.P.; Sun, G.D. Evaluation of ecological environment vulnerability for Sanjiangyuan area. Chin. J. Ecol. 2015, 34, 1968–1975. [Google Scholar]
  50. Teng, Y.; Zhan, J.; Liu, S.; Agyemanga, F.B.; Li, Z.; Wang, C.; Liu, W. Integrating ecological and social vulnerability assessment in Qinghai Province, China. Phys. Chem. Earth Parts A/B/C 2022, 126, 103115. [Google Scholar] [CrossRef]
  51. Lu, D.; Shi, Y.; Li, W.; Yang, X. Spatiotemporal change of vulnerability in counties of northwest China. Prog. Geogr. 2017, 36, 404–415. [Google Scholar]
  52. Zhang, W.; Wen, L. An Examination of the Variables Affecting the Growth of the Tourist Sector in Guizhou Province. Sustainability 2022, 14, 11297. [Google Scholar] [CrossRef]
  53. Gao, J.; Wu, B. Revitalizing traditional villages through rural tourism: A case study of Yuanjia Village, Shaanxi Province, China. Tour. Manag. 2017, 63, 223–233. [Google Scholar] [CrossRef]
  54. Wang, H.; Yang, Z.; Chen, L.; Yang, J.; Li, R. Minority community participation in tourism: A case of Kanas Tuva villages in Xinjiang, China. Tour. Manag. 2010, 31, 759–764. [Google Scholar] [CrossRef]
  55. Zhang, B.; Zhang, R.; Jiang, G.; Cai, W.; Su, K. Improvement in the quality of living environment with mixed land use of rural settlements: A case study of 18 villages in Hebei, China. Appl. Geogr. 2023, 157, 103016. [Google Scholar] [CrossRef]
  56. Li, R.; Chen, J.; Yang, X.; Yin, S.; Shi, R.; Bai, Y.; Xu, L. The impact of population change on social-ecological systems’ vulnerability: A case of the Qinling-Daba Mountains of Southern Shaanxi in China. J. Clean. Prod. 2024, 476, 143682. [Google Scholar] [CrossRef]
  57. Sun, Y.; Ou, Q. Research on the traditional zoning, evolution, and integrated conservation of village cultural landscapes based on “production-living-ecology spaces” —A case study of villages in Meicheng, Guangdong, China. Open Geosci. 2021, 13, 1303–1317. [Google Scholar] [CrossRef]
  58. Yang, W.; Fan, B.; Tan, J.; Lin, J.; Shao, T. The Spatial Perception and Spatial Feature of Rural Cultural Landscape in the Context of Rural Tourism. Sustainability 2022, 14, 4370. [Google Scholar] [CrossRef]
  59. Tang, C.; Yang, Y.; Liu, Y.; Xiao, X. Comprehensive evaluation of the cultural inheritance level of tourism-oriented traditional villages: The example of Beijing. Tour. Manag. Perspect. 2023, 48, 101166. [Google Scholar] [CrossRef]
  60. Zhang, Y.; Min, Q.; Zhang, C.; He, L.; Zhang, S.; Yang, L.; Tian, M.; Xiong, Y. Traditional culture as an important power for maintaining agricultural landscapes in cultural heritage sites: A case study of the Hani terraces. J. Cult. Herit. 2016, 25, 170–179. [Google Scholar] [CrossRef]
  61. Zheng, G.-h.; Jiang, D.-f.; Luan, Y.-f.; Yao, Y. GIS-based spatial differentiation of ethnic minority villages in Guizhou Province, China. J. Mt. Sci. 2022, 19, 987–1000. [Google Scholar] [CrossRef]
  62. Zhang, Y.; Zhou, D.; Li, Z.; Qi, L. Spatial and temporal dynamics of social-ecological resilience in Nepal from 2000 to 2015. Phys. Chem. Earth Parts A/B/C 2020, 120, 102894. [Google Scholar] [CrossRef]
  63. Qiu, B.; Li, H.; Zhou, M.; Zhang, L. Vulnerability of ecosystem services provisioning to urbanization: A case of China. Ecol. Indic. 2015, 57, 505–513. [Google Scholar] [CrossRef]
  64. Yang, W.; Xu, K.; Lian, J.; Ma, C.; Bin, L. Integrated flood vulnerability assessment approach based on TOPSIS and Shannon entropy methods. Ecol. Indic. 2018, 89, 269–280. [Google Scholar] [CrossRef]
  65. Zhao, J.; Ji, G.; Tian, Y.; Chen, Y.; Wang, Z. Environmental vulnerability assessment for mainland China based on entropy method. Ecol. Indic. 2018, 91, 410–422. [Google Scholar] [CrossRef]
  66. Li, S.; Wei, H.; Ni, X.; Gu, Y.-W.; Changxiao, L. Evaluation of urban human settlement quality in Ningxia based on AHP and the entropy method. Ying Yong Sheng Tai Xue Bao = J. Appl. Ecol./Zhongguo Sheng Tai Xue Xue Hui Zhongguo Ke Xue Yuan Shenyang Ying Yong Sheng Tai Yan Jiu Suo Zhu Ban 2014, 25, 2700–2708. [Google Scholar]
  67. Frazier, T.G.; Thompson, C.M.; Dezzani, R.J. A framework for the development of the SERV model: A Spatially Explicit Resilience-Vulnerability model. Appl. Geogr. 2014, 51, 158–172. [Google Scholar] [CrossRef]
  68. Ou, Y.; Bao, Z.; Ng, S.T.; Song, W.; Chen, K. Land-use carbon emissions and built environment characteristics: A city-level quantitative analysis in emerging economies. Land Use Policy 2024, 137, 107019. [Google Scholar] [CrossRef]
  69. Cutter, S.L. The origin and diffusion of the social vulnerability index (SoVI). Int. J. Disaster Risk Reduct. 2024, 109, 104576. [Google Scholar] [CrossRef]
  70. Baloch, Q.B.; Shah, S.N.; Iqbal, N.; Sheeraz, M.; Asadullah, M.; Mahar, S.; Khan, A.U. Impact of tourism development upon environmental sustainability: A suggested framework for sustainable ecotourism. Environ. Sci. Pollut. Res. 2023, 30, 5917–5930. [Google Scholar] [CrossRef]
  71. Li, L.; Feng, R.; Xi, J.; Huijbens, E.H.; Gao, Y. Distinguishing the impact of tourism development on ecosystem service trade-offs in ecological functional zone. J. Environ. Manag. 2023, 342, 118183. [Google Scholar] [CrossRef]
  72. Xue, L.; Wang, J.; Zhang, L.; Wei, G.; Zhu, B. Spatiotemporal analysis of ecological vulnerability and management in the Tarim River Basin, China. Sci. Total Environ. 2019, 649, 876–888. [Google Scholar] [CrossRef]
  73. Zhao, D.; Wu, S. Vulnerability of natural ecosystem in China under regional climate scenarios: An analysis based on eco-geographical regions. J. Geogr. Sci. 2014, 24, 237–248. [Google Scholar] [CrossRef]
  74. Cheng, Y.; Gao, S.; Li, S.; Zhang, Y.; Rosenberg, M. Understanding the spatial disparities and vulnerability of population aging in China. Asia Pac. Policy Stud. 2018, 6, 73–89. [Google Scholar] [CrossRef]
  75. Ardoin, N.M.; Bowers, A.W.; Gaillard, E. Environmental education outcomes for conservation: A systematic review. Biol. Conserv. 2020, 241, 108224. [Google Scholar] [CrossRef]
Figure 1. Location of the study area, showing 43 ethnic villages, town boundaries, and altitude.
Land 14 01030 g001
Figure 2. Technical workflow of vulnerability assessment and analysis.
Land 14 01030 g002
Figure 3. Spatial distribution of the SEI, SSI, SAI, SVI level.
Land 14 01030 g003
Figure 4. Spatial autocorrelation cluster map and significance map of the SE, SS, SA and SV.
Land 14 01030 g004
Figure 5. Spatial distribution of the EEI, ESI, EAI, EVI levels.
Land 14 01030 g005
Figure 6. Spatial autocorrelation cluster map and significance map of EE, ES, EA and EV.
Land 14 01030 g006
Figure 7. Interaction detection results for each indicator.
Land 14 01030 g007
Figure 8. The vulnerability relationship between social systems and ecosystems based on tourism and karst environments.
Land 14 01030 g008
Table 1. Basic data and sources.
Raw DataData SourceProcessing MethodIndicator Collection
Terrain dataGeographic spatial data cloud
(https://gscloud.cn/, accessed on September 2023)
Spatial analysisSlope
Meteorological data Environment, and data platform (https://www.resdc.cn/, accessed on September 2023)Statistical analysisPrecipitation
Land use patternEarth Big Data Science Project of the Chinese Academy of SciencesSpatial analysisBiological richness index, vegetation coverage rate
Statistical yearbook dataNational Bureau of Statistics (https://www.stats.gov.cn/, accessed on September 2023)Statistical analysisFarmland area, population, and economic indicators
Land resources dataNational Glacier, Frozen Soil and Desert Science Data Center
(https://www.ncdc.ac.cn/portal/, accessed on September 2023)
Spatial analysisSoil sand content
Resident social life dataTraditional Village Protection Plan and Archives and Construction Project List
(obtained through offline visits on July 2023)
Statistical analysisTransportation convenience, tourism revenue, aging population, cultural heritage, industrial diversity, community relations, etc.
Table 2. Vulnerability assessment indices system based on the VSD model.
Target LayerDimension LayerIndex NumberIndexEffect DirectionWeightReference
Ecological vulnerabilityExposureX1The average value of social vulnerability+0.0390[50]
SensitivityX2Slope+0.1184[48]
X3Degree of rocky desertification (soil sediment content)+0.4572[48]
X4Annual precipitation0.0949[48]
AdaptabilityX5Forest coverage index (NDVI)+0.0397[49]
X6Biological richness index+0.0826[49]
X7Cultivated area0.1682[51]
Social vulnerabilityExposureX8Annual average tourist reception volume+0.2728[52]
X9Tourism participation population+0.2344[53]
X10Funds for construction0.0234[51]
X11Construction land area+0.0336[51]
X12Transportation convenience (distance from the county seat)+0.0100[54]
bbSensitivityX13Completeness of public facilities0.0135[55]
X14Per capita annual household income+0.0205[56]
X15Preservation degree of traditional dwellings+0.0156[57]
X16Hollow out rate (proportion of migrant workers)0.0166[56]
X17Aging rate0.0316[56]
X18Preservation degree of intangible cultural heritage0.0034[58]
AdaptabilityX19Neighborhood relations (number of folk activities)+0.0638[59]
X20Community learning (traditional skills training)+0.0435[60]
X21Disaster response capability (investment funds)+0.1679[60]
X22Industrial Diversity Index+0.0320[61]
X23Implementation time of protection plan+0.0174[57]
Table 3. Evaluation results of Moran’s I index for the SV.
SEISSISAISVI
Moran’s I0.0390.39460.18320.1521
Z-Score2.02114.31202.16381.9635
p-value0.0470.0010.030.047
Spatial patternClusteredClusteredClusteredClustered
Table 4. Evaluation results of Moran’s I index for the EV.
EEIESIEAIEVI
Moran’ s I0.1520.4781−0.04340.3826
Z-Score1.96354.7234−0.18693.7180
p-value0.0470.0010.4630.001
Spatial patternClusteredClusteredNot significantClustered
Table 5. q-value of driving factors for the SV.
Driving Factorsq-ValueDriving Factorsq-Value
Annual average tourist reception volume0.2116Preservation degree of traditional dwellings0.6460
Tourism participation population0.2520Hollow out rate0.1042
Funds for construction0.2712Aging rate0.0996
Construction land area0.1241Preservation degree of intangible cultural heritage0.2067
Transportation convenience0.3532Neighborhood relations0.2792
Implementation time of protection plan0.3032Community learning0.0356
Completeness of public facilities0.1189Disaster response capability0.7130
Per capita annual household income0.4684Industrial diversity index0.0622
Table 6. q-value of driving factors for the EV.
Driving Factorsq-ValueDriving Factorsq-Value
The average value of social vulnerability0.5456Forest coverage index (NDVI)0.1677
Annual precipitation0.1340Degree of rocky desertification0.6996
Cultivated area0.3303Biological richness index0.2694
Slope0.0459
Table 7. Types of interactions.
Basis for JudgmentTypes of the Interaction
q(X1∩X2) < Min(q(X1), q(X2))Non-linear attenuation
Min(q(X1)), q(X2)) < q(X1∩X2) < Max(q(X1), q(X2))Single-factor nonlinearity attenuation
q(X1∩X2) > Max(q(X1), q(X2))Two-factor enhancement
q(X1∩X2) = q(X1) + q(X2)Independent
q(X1∩X2) > q(X1) + q(X2)Non-linear attenuation
Disclaimer/Publisher’s Note: The statements, opinions and data contained in all publications are solely those of the individual author(s) and contributor(s) and not of MDPI and/or the editor(s). MDPI and/or the editor(s) disclaim responsibility for any injury to people or property resulting from any ideas, methods, instructions or products referred to in the content.

