Abstract
Urban waterfront spaces are key venues for residents’ physical activity, and their spatial environment significantly impacts usage efficiency. Existing studies predominantly employ linear models and focus on single waterfront types, making it difficult to reveal differences across various types and the nonlinear mechanisms of influencing factors. To address this, this study investigates three types of waterfront spaces in Shenzhen—riverfront, lakeshore, and seafront spaces—integrating multi-source data and machine learning techniques to systematically analyze the differential impacts of the same elements on physical activity. The results indicate: (1) In terms of transportation accessibility, public transport is the most important factor for riverfront and lakeshore spaces, while road network accessibility is most critical for seafront spaces. (2) Regarding natural landscapes, the dominant factors are normalized difference vegetation index (NDVI) for riverfront spaces, green view index for lakeshore spaces, and distance to the shoreline for seafront spaces. (3) For facility services, the core factors are building density (riverfront), number of sports facilities (lakeshore), and number of leisure facilities (seafront). (4) The study further reveals nonlinear relationships and threshold effects of multiple elements. For instance, a turning point in physical activity intensity occurs when the distance to a subway station reaches 2–2.5 km. The green view index shows a threshold of 30% in the overall model, while dual-threshold phenomena are observed in the lakeshore and seafront models. (5) Synergistic effects between elements vary by waterfront type: in riverfront and seafront spaces, activity is more vibrant when areas are close to subway stations and have a low sky view index, whereas the opposite pattern is observed in lakeshore spaces. A combination of a high green view index and greater distance to the shoreline promotes activity in lakeshore spaces, while a high green view index combined with proximity to the shoreline has the most significant promotional effect in riverfront and seafront spaces. This study provides a scientific basis for health-oriented, precise planning and design of urban waterfront spaces.
1. Introduction
Physical inactivity is a leading cause of declining health levels. According to the World Health Organization, approximately 27.5% of adults do not meet the recommended levels of physical activity (PA). Insufficient PA is a major risk factor for global mortality and accounts for about 6% of deaths worldwide [1]. As a factor that directly impacts human health, adequate PA can improve mental health and reduce the risk of cancer and mortality [2,3,4]. The built environment, serving as a key medium for quantifying urban open spaces, often functions as an independent variable in studies on urban human activity. Existing research has established that the built environment of urban open spaces has a direct impact on PA [5,6,7]. Therefore, improving the built environment of urban open spaces is of significant importance for promoting PA among urban residents.
Urban waterfront spaces, serving as quintessential examples of urban open spaces, constitute a critical interface connecting water bodies with public activity areas, catering to fundamental daily needs such as recreation, exercise, and relaxation for urban residents. The quality of planning and design in urban waterfront spaces directly influences their usage efficiency and their role in promoting public health. For instance, well-designed waterfront spaces can encourage active engagement in PA, thereby enhancing citizen well-being and health [8]. Conversely, waterfront areas with poor accessibility tend to inhibit such activities [9]. Existing research has demonstrated that the development of urban waterfront spaces plays a vital role in facilitating PA and improving public health.
Urban waterfront spaces are not homogeneous entities; they exhibit significant variations in form, scale, ecological function, and cultural perception. These inherent typological characteristics can, to some extent, influence population preferences for PA through visual, psychological, and activity-type-related pathways [10,11,12]. However, few studies have conducted differentiated analyses of various waterfront types at a consistent spatial scale, thereby limiting a deeper understanding of the complex relationship between the waterfront environment and health behaviors. There is an abundance of waterfront spaces in the coastal areas of southern China, with the Pearl River Delta (PRD) region being particularly rich in this resource. Shenzhen, an emerging megacity located within the PRD and bordered by the sea to the south, encompasses various types of waterfront spaces, including seafront, lakeshore, and riverfront. This provides a practical foundation for an in-depth investigation into the patterns of citizen usage of urban waterfront spaces.
Existing research on human activities in urban waterfront spaces has primarily focused on examining the impact of the waterfront built environment on PA [8]. While fruitful, these studies are subject to the following limitations. Regarding the selection of built environment elements, there has been an over-reliance on conventional influencing factors such as the quantity of various POIs, building density, and street network density. This reliance may lead to an incomplete exploration of the underlying patterns [13]. Furthermore, in terms of study area selection, prior research has often treated waterfront spaces as a homogeneous entity or concentrated on a single type. This approach overlooks the heterogeneous effects arising from inherent typological differences. This fragmented research perspective makes it difficult to systematically reveal the differential impact mechanisms of the same elements on PA across different types of urban waterfront spaces within a unified analytical framework, thereby creating a blind spot in understanding how specific factors operate within distinct waterfront typologies. Simultaneously, regarding analytical methods, previous studies have predominantly employed ordinary least squares (OLS) and geographically weighted regression (GWR) models to uncover linear relationships and spatial effects between environmental elements and human activities. However, according to environmental preference theory, the influence of various elements in urban waterfront spaces on human activities may involve nonlinear relationships or threshold effects [14,15]. Sole reliance on OLS and GWR is inadequate for capturing the complex nonlinear influences of multiple factors.
To address these research gaps, this study integrates multi-source big data and explainable machine learning to achieve the following objectives: (1) To conduct a comparative analysis. This aims to contrast the heterogeneity of elements influencing PA across the three different types of urban waterfront spaces under a consistent scale and methodological framework. (2) To uncover nonlinear relationships. This objective seeks to move beyond the assumptions of traditional linear models by revealing the nonlinear influences and specific thresholds of key environmental elements on PA within different waterfront spaces. (3) To explore interaction mechanisms. This involves identifying the complex synergistic or antagonistic effects among environmental elements within the different waterfront typologies. Therefore, in this investigation, we supplement fundamental built environment data with streetscape imagery metrics to explore the environmental impact on PA from multiple perspectives. Simultaneously, the urban waterfront spaces of Shenzhen are selected as the primary study area. Following the Shenzhen Bidao System Construction Master Plan (2020—2035) (https://swj.sz.gov.cn/ydmh/ghjh/content/post_8381733.html (accessed on 24 November 2025)), the research areas are delineated into the three distinct waterfront types: seafront, lakeshore, and riverfront. Subsequently, a methodology combining machine learning with the explainable model SHAP is employed. This approach is used to investigate whether the influence of identical elements on PA differs across the three waterfront types, and to identify the ranking of these differential importances and their underlying nonlinear impact mechanisms.
2. Literature Review
2.1. Quantification of PA
Existing research on quantifying PA primarily employs methods such as questionnaires and big data measurements. Additionally, some researchers have utilized image recognition techniques to assess human activity through visual data. Firstly, traditional approaches to PA quantification have predominantly relied on questionnaire surveys and manual observation [16,17,18]. A key advantage of these manual methods is their low cost and ease of implementation. However, they also suffer from limitations, including small sample sizes and low accuracy. Furthermore, the disparity in data scale between small-sample questionnaire data and large-scale GIS data can impose constraints on research findings.
Secondly, the proliferation of mobile devices and social media has facilitated the recording of vast amounts of big data, including human trajectory information and geotagged photos. Consequently, novel crowdsourced data sources (e.g., Tencent Heat Maps, 2bulu) are being widely adopted in research [19,20,21]. Compared to traditional questionnaire methods, big data-based quantification, while less accurate for capturing fine-grained activity at a micro-scale, is highly effective at revealing macro-level patterns and global variations in PA across urban areas. For example, Li et al. utilized Baidu Heat Maps to quantify urban human activity and subsequently analyzed the commonalities and differences in activity within leisure-oriented urban spaces (LUSs) [22]. Similarly, Niu et al. employed WeChat data to measure PA intensity and then applied a hash algorithm to validate the fit between a waterfront space vitality model and the observed activity in Suzhou [23]. Beyond these, advancements in machine learning and deep learning have led to the increasing application of street view image recognition for quantifying PA. For instance, Jiang et al. integrated Google Street View imagery with Baidu AI pedestrian detection technology to estimate pedestrian counts within each research grid [24]. However, different big data sources represent PA in distinct ways. A significant limitation is that many datasets are used to quantify general human presence or activity, which does not necessarily equate to PA. Therefore, the selection of data for quantification must be more precisely targeted towards metrics that are specifically indicative of PA.
2.2. Research on Waterfront Spaces and PA
As high-quality public spaces within urban areas, urban waterfronts have long been recognized as important settings for daily recreation, relaxation, and physical exercise. A substantial body of research has explored the relationship between the built environment and human activity, and it is widely acknowledged that the built environment of waterfront spaces exerts a significant influence on PA [5]. For instance, Liu et al. established a database of outdoor activity characteristics by setting up 121 observation points across six typical waterfront public spaces in Shanghai. Utilizing both multiple linear regression and non-linear neural network models to analyze different types of activity data, they concluded that microclimatic factors in urban waterfront spaces have a more pronounced effect on walking and resting activities [18]. In another empirical study in Shanghai utilizing big data, Liu et al. employed a structural equation model to investigate the impacts of open space design, transportation accessibility, surrounding population density, and service facilities on user density and stability. Their findings indicated that site design, population density, and service facilities had significant positive effects on vitality, whereas transportation accessibility exhibited a negative influence, providing a scientific basis for enhancing the usage vitality of waterfront spaces [8]. However, much of the current research on waterfront spaces concentrates on a single specific type, validating the impact of the built environment on human activities within that homogeneous category. This approach lacks an investigation into how the heterogeneity of characteristic elements across different spatial types influences human activity. For instance, Hu et al. investigated the role of Riverfront walkways in promoting outdoor activities among the elderly, finding that older adults place greater importance on safety facilities, green landscape indices, and the quantity of seating facilities [25]. Similarly, Luo et al. selected green spaces within a riverfront area as their study zone, discovering that people prefer low-intensity activities in spaces with a low sky view index and high-intensity activities in those with a high sky view index [11]. Fortes et al. categorized Seafront spaces as recreational and entertainment areas, observing higher cycling participation among women in these zones, attributing this to the safer and more comfortable cycling environment, which alleviates concerns about traffic safety and crime risk [10]. Consequently, such studies, to some extent, limit the applicability of their findings for informing the planning and construction of diverse waterfront spaces.
Furthermore, in studies investigating the impact of waterfront space elements on human activities, the predominant methodological approaches have been dominated by linear regression models (OLS) and spatial regression models (GWR). For example, Jiang et al. selected 170 waterfront neighborhoods in three cold-region Chinese cities. They employed correlation analysis to identify six key factors significantly associated with the U-value and subsequently used regression analysis to elucidate the underlying influence mechanisms [26]. Similarly, Ding et al. conducted a case study in the Qinhuai River waterfront area of Nanjing. They applied both a global model (OLS) and a local model (Multi-scale Geographically Weighted Regression, MGWR) to reveal the influences of both the objective built environment and subjective spatial perception on human activity [27]. While the OLS model can, to some extent, reveal the global influence of independent variables on the dependent variable [28], it fails to capture local variability and cannot account for the non-stationary characteristics of influencing factors across geographical space. Although MGWR, by allowing independent variables to operate at their optimal bandwidths, can depict the spatial heterogeneity of variable influences and thus partially mitigate the limitations of OLS, it remains fundamentally a linear modeling framework. Consequently, it is limited in its capacity to decipher the complex, non-linear relationships—such as threshold and interaction effects—that are prevalent in real-world scenarios. A review of the research on PA and waterfront space is presented in Appendix A.
In summary, technological advancements have introduced new data sources and methodologies, thereby enhancing our capacity to investigate the intrinsic relationships between the built environment and PA. Notwithstanding these advancements, existing research is constrained by two primary limitations. Firstly, regarding data acquisition, traditional studies have relied excessively on questionnaires and telephone interviews, which are often characterized by small sample sizes and high costs. Secondly, in terms of analytical methods, approaches such as OLS and multiple linear regression are heavily dependent on strict classical assumptions. However, real-world data frequently exhibit complexity, non-linearity, and multicollinearity. Although GWR can address spatial non-stationarity in data, it is fundamentally a local fitting technique within the linear model framework. Consequently, its ability to capture global complex patterns and non-linear spatial relationships remains limited.
Therefore, to systematically address the aforementioned limitations, this study first employs Strava crowdsourced data to quantify PA, ensuring a more focused measurement of activity specifically within waterfront spaces. Secondly, in selecting independent variables, it incorporates human-scale micro-built environment data (derived from Baidu Street View imagery) and water quality data of the waterfront spaces. This integration addresses a critical gap in existing literature by accounting for previously underexplored micro-spatial elements and the intrinsic attributes of the water body itself. Finally, the study categorizes the urban waterfront spaces within the research scope into three types—seafront, lakeshore, and riverfront—for comparative analysis. Methodologically, it leverages machine learning to capture the non-linear relationships between the built environment and PA. This is complemented by explainable AI techniques, specifically SHAP (SHapley Additive exPlanations), to quantify the contribution of each feature to the predictive outcomes. The ultimate objective is to identify the non-linear influences and differential effects exerted by distinct waterfront space types on PA.
3. Materials and Methods
3.1. Study Area
This study selects the six southern coastal districts of Shenzhen as its research area (Figure 1). Shenzhen, one of China’s emerging and rapidly developing cities, is situated in the southern coastal region of Guangdong Province, bordering the South China Sea to the south. According to statistics up to the end of 2024, Shenzhen covers a total area of 1997 square kilometers, with a population of 17.9895 million. As a quintessential high-density megacity in China, Shenzhen possesses an extensive coastline along its southern border. Furthermore, its interior is characterized by a dense and numerous network of rivers and lakes, resulting in a rich diversity of urban waterfront space types.
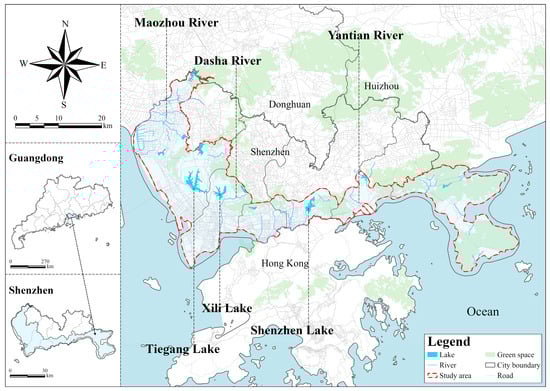
Figure 1.
Location of the study area.
This study focuses on a comparative analysis of three types of waterfront spaces in Shenzhen: riverfront, lakeshore, and seafront. To concentrate specifically on these categories, the primary study area is delineated as the six southern coastal districts of Bao’an, Nanshan, Futian, Luohu, Yantian, and Dapeng New District.
Based on the typical usage range of populations in waterfront spaces, a 2 km buffer was created around the major rivers, lakes, and coastlines within the aforementioned six districts to generate the primary study zone. This zone was then subdivided into sample units using a grid network. Considering the significant scale variations among different waterfront types and the large scale of Shenzhen’s functional urban clusters, a 500 m by 500 m grid cell size was selected for this delineation.
3.2. Data Sources
3.2.1. Strava Data
Strava (v441.12) is a fitness-tracking application that records over 30 types of athletic activities, including running, cycling, and hiking. The trajectories of its users are logged and visually represented as heat maps on its platform [29], where highlighted areas indicate high concentrations of human activity, and lighter shades correspond to lower activity levels. By the end of 2023, Strava had amassed a global user base of 120 million, thereby enabling its data to effectively map the patterns of PA in urban settings (Figure 2). Compared to traditional questionnaires and other big data sources, Strava data offers a more precise focus on PA.
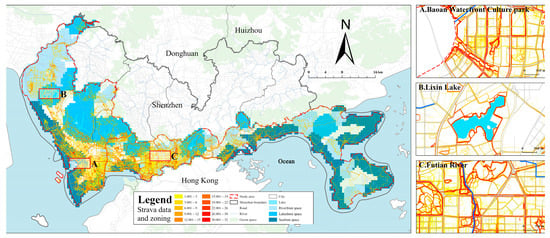
Figure 2.
Strava data and three types of waterfront spaces.
Using Python 3.8, we acquired Strava data for May 2025, which provides a detailed representation of PA trajectories within the study area. Subsequently, utilizing geospatial tools including ArcGIS Pro, the Strava data from various areas were quantified and aggregated into each 500 m × 500 m grid cell. This process yielded the final dataset on PA, which was then used for subsequent spatial analysis.
3.2.2. Baidu Street View Data (BSVD)
Baidu Street View Data (BSVD) is a panoramic street-level imagery service provided by Baidu Maps. It captures 360-degree panoramic images of urban and rural locations by deploying various collection equipment, such as dedicated vehicles and tripods, on roads. These images are geotagged with metadata including geographic coordinates. Through proportional cropping, the data can be processed to obtain street-level imagery that effectively simulates a pedestrian’s perspective of the urban environment. Standard BSVD typically provides imagery from four cardinal directions (0°, 90°, 180°, and 270°) at each sampling point. Researchers commonly integrate this data with various image recognition techniques—such as semantic segmentation, object detection, and perceptual assessment—for subsequent analytical studies.
In this study, we acquired a total of 988,920 Baidu Street View images from Shenzhen, with data collection starting in 2022. By integrating the DeepLabV3+ semantic segmentation technique, we accurately identified the proportional area occupied by 19 distinct element categories within these street view images (Figure 3). From the segmentation results, the green view index (GVI) and sky view index (SVI) for a given location were derived by calculating the proportion of green and sky pixels, respectively, within the panoramic street view image. Similarly, walkability was quantified by calculating the proportion of pixels classified as sidewalks or cycling paths in the panoramic image, serving as a metric for pedestrian accessibility at various street locations. The calculation formulas are as follows:
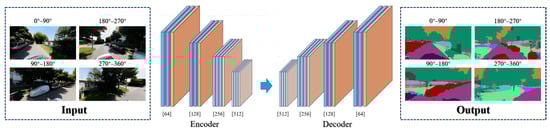
Figure 3.
Semantic segmentation for BSVD.
3.2.3. Variables
Table 1 presents the variable names used in this study along with their corresponding descriptive statistics. The dependent variable is the running index, which was derived by spatially joining Strava data within ArcGIS Pro (v3.0.2). In addition to the variables obtained from Baidu Street View, a total of 11 independent variables were selected across three dimensions: natural landscape and environment, transportation accessibility, and facility services and functions. These include: normalized difference vegetation index (NDVI), water quality, and distance to the nearest shoreline under natural landscape and environment; distance to the nearest metro station, number of bus stops, network quantity penalized by distance (NQPD), and two phase betweenness (TPBt) under transportation accessibility; and number of commercial facilities, number of leisure facilities, number of sports facilities, and building density under facility services and functions.

Table 1.
Descriptive statistics of the variables.
Specifically, the distance to the nearest metro station was calculated by measuring the distance from each grid cell to the nearest metro station. NQPD and TPBt were computed using the sDNA tool within ArcGIS Pro based on processed street network data, representing road network accessibility and road network betweenness centrality, respectively. These metrics have been extensively validated and employed in numerous studies [30,31]. Furthermore, “water quality” data within the study area were compiled from the Shenzhen municipal government website (https://www.dpxq.gov.cn/ztzl/mssszl/hbsw/xgzx/content/post_10568139.html (accessed on 24 November 2025)). The water bodies were classified into five grades (I, II, III, IV, V), with grade I representing the highest water quality. Data for the “number of bus stops” and various points of interest (POI) were sourced from Amap (AutoNavi Map). Building footprint data were derived from remote sensing imagery and subsequently subjected to manual verification and correction.
Figure 4 illustrates the spatial distribution of Strava-based PA data. It reveals a higher concentration of PA in the southwestern part of Shenzhen, compared to a lower level in the southeastern region. This disparity may be attributed to the relatively lower development intensity and less comprehensive infrastructure in the latter area.
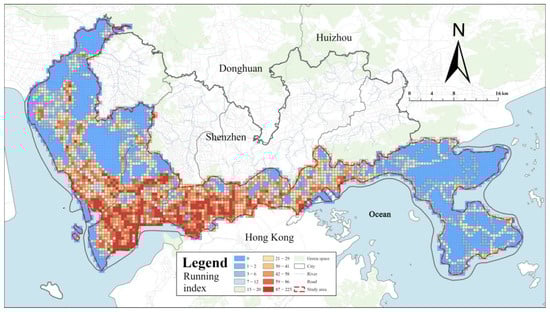
Figure 4.
Spatial distribution of the PA.
3.3. Methodology
3.3.1. LightGBM
Machine learning is a technology that automatically learns patterns and regularities from data to facilitate prediction and decision-making [32]. Machine learning methodologies primarily include supervised learning, unsupervised learning, and reinforcement learning. Among these, supervised learning is the most widely applied paradigm, typically used for classification and regression tasks [33]. To enhance the predictive performance and stability of a single model, multiple models are often combined to make collective predictions, an approach known as ensemble learning. Ensemble learning can significantly mitigate the risk of overfitting and improve the model’s generalizability. Common ensemble learning techniques include bagging, boosting, and stacking [34].
LightGBM is a canonical boosting ensemble algorithm. It operates by iteratively training weak learners, with each subsequent step focusing more on the samples that were misclassified by previous models. This process gradually enhances the overall predictive accuracy, ultimately constructing a strong model [35]. LightGBM evolved from the gradient boosting decision tree (GBDT) model. While traditional GBDT demonstrates strong performance, it suffers from computational inefficiency and slow training speeds when handling large-scale and high-dimensional datasets. To address these limitations, the Microsoft DMTK team introduced LightGBM in 2017, which is optimized for both processing speed and effectiveness on large datasets [36]. In simpler terms, traditional tree growth employs a level-wise strategy (Figure 5a), which splits all leaves at the same depth in each iteration. This approach leads to slower tree growth and consumes considerable computational resources. In contrast, LightGBM adopts a leaf-wise growth strategy with a depth limit (Figure 5b). This method splits only the leaf that yields the maximum gain in each step, thereby reducing the number of splits and avoiding unnecessary memory consumption inherent in the level-wise strategy [37]. Consequently, the leaf-wise strategy enables a faster reduction in the loss function, thereby enhancing the model’s fitting capability and overall accuracy. Furthermore, LightGBM supports the direct input of categorical features and the automatic handling of missing values, eliminating the need for extensive pre-processing and thereby reducing the complexity of data preparation.
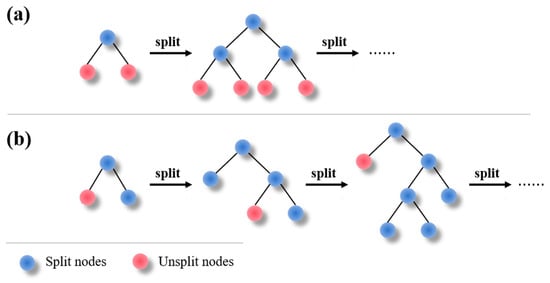
Figure 5.
Two approaches to decision tree growth. (a) Level-wise growth approach. (b) Leaf-wise grith approach.
Prior to employing the LightGBM model for prediction, it is essential to tune its hyperparameters. Key hyperparameters include the learning rate, tree depth, number of leaves, and feature sampling ratio. An appropriate configuration of these parameters can significantly enhance both learning efficiency and predictive performance. Common hyperparameter tuning methods include random search, grid search, and Bayesian optimization. In this study, we employed grid search for automated hyperparameter optimization.
3.3.2. SHAP
Although machine learning models often achieve high predictive accuracy, they are frequently regarded as “black boxes”, making it difficult to interpret why a particular prediction is made. To address this limitation, SHAP (SHapley Additive exPlanations) was introduced. It provides a theoretically sound and highly interpretable framework for quantifying the contribution of each feature to the model’s output [38,39]. SHAP is a model interpretation method rooted in cooperative game theory, with its core concept derived from the Shapley value. The Shapley value determines the average marginal contribution of a feature across all possible feature combinations, thereby quantifying its overall importance to the prediction. Compared to traditional feature importance methods, SHAP offers a dual advantage: it can provide both a global interpretation by ranking the overall importance of all features, and a local interpretation by explaining the prediction for any individual instance.
In the equation, denotes the Shapley value for variable i, representing the average marginal contribution of feature i to the model’s prediction across all possible feature combinations. The set N encompasses all input features. S represents a subset of N that excludes feature i. The function f(S) signifies the model’s predicted output when using only the feature subset S.
The Shapley value is characterized by its fairness, order invariance, capacity for both global and local interpretation, and its ability to assign both positive and negative contributions. Firstly, grounded in the principle of fair distribution from cooperative game theory, the Shapley value satisfies the properties of efficiency, symmetry, dummy, and additivity. This ensures that the contribution assigned to each feature is both reasonable and unique. Secondly, by averaging the marginal contributions across all possible permutations of features, the Shapley value eliminates bias that could arise from the specific order in which features are introduced. Furthermore, the Shapley value facilitates both global and local feature interpretations. Global interpretation reveals the extent and direction (positive or negative) of each feature’s average influence on the model output across the entire dataset. Local interpretation, achieved by calculating the SHAP value for each feature in a single prediction, elucidates the impact of individual variables on that specific outcome [40,41]. In this study, the Python shap library was employed for all SHAP value computations. The research framework of the article is shown in Figure 6.
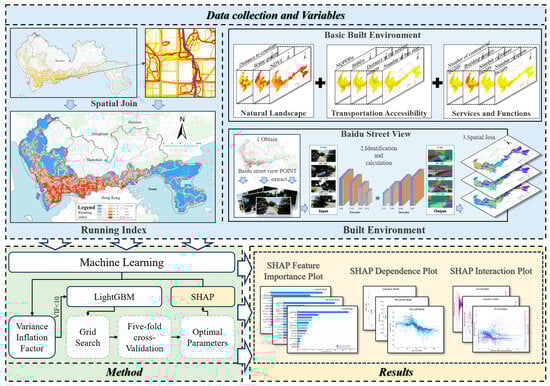
Figure 6.
Research framework.
4. Results
Prior to the formal analysis, we conducted tests for variable multicollinearity and performed model hyperparameter tuning. To assess potential multicollinearity among the predictor variables, a variance inflation factor (VIF) test was performed. As presented in Table 2, all variables yielded VIF values below the threshold of 10, indicating the absence of significant multicollinearity. Consequently, all fourteen variables were retained for subsequent analysis.
Table 2.
Variable VIF values.
To validate the robustness of our model selection, we compared the performance of the LightGBM and XGBoost models. Under identical 5-fold cross-validation settings, LightGBM achieved performance comparable to, and marginally superior to, that of XGBoost (Table 3), while also demonstrating higher training efficiency. Consequently, LightGBM was selected as the final model for this study.
Table 3.
Comparison of the LightGBM and XGBoost models in terms of performance.
Subsequently, to enhance model performance, we employed a randomized grid search for hyperparameter tuning. The search ranges for key parameters were first defined as follows: num_leaves from 30 to 120 in steps of 1; max_depth from −1 to 15 in steps of 1 (where −1 indicates no constraint on tree depth); and learning_rate from 0.005 to 0.05 in steps of 0.001. The GridSearchCV library was then utilized to conduct the grid search and identify the optimal parameter set, while all other parameters were maintained at their default values. Finally, to ensure a robust evaluation of model performance, the mean root mean square error (RMSE) and mean absolute error (MAE) from a five-fold cross-validation procedure were adopted as the evaluation metrics. This process was used to determine the optimal hyperparameter combination for each model (Table 4).
Table 4.
Hyperparameters used in this study.
4.1. Relative Importance of Predictors
The SHAP summary plot illustrates the distribution of SHAP values for each feature’s contribution to the model output. In this plot, each dot represents an individual sample. The horizontal axis denotes the SHAP value, which indicates both the magnitude and direction of a feature’s impact on the prediction. The vertical axis lists features ranked in descending order of their mean absolute SHAP value; thus, features positioned higher exert a greater overall influence on the model. The color gradient represents the actual value of the feature for each sample, allowing for the interpretation of the relationship between feature magnitude and its directional contribution.
Overall, PA across the three types of urban waterfront spaces exhibits a positive correlation with NDVI, NQPD, number of sports facilities, number of bus stops, GVI, TPBt, and number of leisure facilities. Conversely, it shows a negative correlation with distance to the nearest metro station, building density, distance to the nearest shoreline, and number of commercial facilities.
Figure 7 presents the feature importance rankings for the four PA models. The SHAP value of a feature represents its impact on the model output; a larger absolute SHAP value indicates a more significant influence of that feature on the final prediction. The results indicate that, across the three waterfront types, the overall importance ranking of the three aggregated indicator categories consistently follows the order: transportation accessibility > natural landscape and environment > facility services and functions. Specifically, transportation accessibility constituted the highest proportion (50.15%) in the seafront model. In contrast, natural landscape and environment were the most dominant category (33.74%) for lakeshore spaces, while facility services and functions accounted for the largest share (20.76%) in the riverfront model.
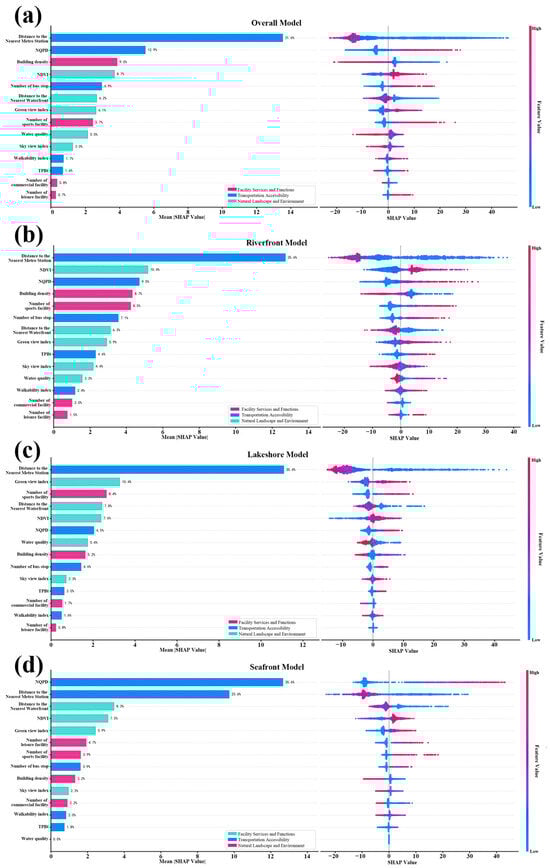
Figure 7.
Relative importance of predictors and SHAP summary plot for four models. (a) Overall model. (b) Riverfront model. (c) Lakeshore model. (d) Seafront model.
First, the overall importance of transportation accessibility varied across the different waterfront types, accounting for 49.16% in riverfront, 50.15% in lakeshore, and 61.89% in seafront spaces. Within the transportation accessibility category, the constituent features—distance to the nearest metro station, NQPD, and number of bus stops—all ranked highly in importance. Notably, distance to the nearest metro station alone constituted 25.6% in riverfront, 35.4% in lakeshore, and 23.6% in seafront environments. It is worth noting that NQPD was particularly prominent in seafront spaces, with a contribution of 30.6%. In contrast, its importance was considerably lower in both riverfront and lakeshore spaces, accounting for only 9.5% and 6.5%, respectively.
Second, the category of natural landscape and environment accounted for 30.08%, 33.74%, and 24.11% of the overall importance in riverfront, lakeshore, and seafront spaces, respectively. Within riverfront spaces, the top three contributing features were: NDVI (10.4%) > distance to the nearest shoreline (6.3%) > GVI (5.9%). For lakeshore spaces, the ranking was: GVI (10.4%) > distance to the nearest shoreline (7.8%) > NDVI (7.6%). In seafront spaces, the order emerged as: distance to the nearest shoreline (8.3%) > NDVI (7.5%) > GVI (5.9%).
Finally, the category of facility services and functions accounted for 20.76%, 16.11%, and 14.00% of the overall importance in riverfront, lakeshore, and seafront spaces, respectively. Within riverfront spaces, the top three features by contribution were: building density (8.7%) > number of sports facilities (8.5%) > number of commercial facilities (2.0%). In lakeshore spaces, the importance of influencing factors presented the following order: number of sports facilities (8.4%) > building density (5.2%) > number of commercial facilities (1.7%). For seafront spaces, the order of influential factors was: number of leisure facilities (4.7%) > number of sports facilities (3.9%) > building density (3.2%).
4.2. Non-Linear Effects of Predictors
In the partial dependence plots of the features, the independent SHAP value for each feature reflects the degree of its impact on the final prediction outcome as the feature value changes. Each sample grid data point corresponds to a single point in the plot. The relationship between distance to the nearest metro station and PA in the overall waterfront model is shown in Figure 8a. Overall, a nonlinear association is observed. When the distance is less than 2 km, it is generally associated with higher levels of PA. Conversely, beyond the 2 km threshold, the association shifts towards reduced PA, even exhibiting a negative influence. Examining the results by waterfront type, Figure 8b–d illustrates the influence of the distance to the nearest metro station on PA in riverfront, lakeshore, and seafront spaces, respectively. Similar to the overall model, all three waterfront types exhibit a nonlinear trend. The distinction lies in their spatial critical points: the threshold is 2.5 km for both riverfront and seafront spaces, but 2 km for lakeshore spaces.
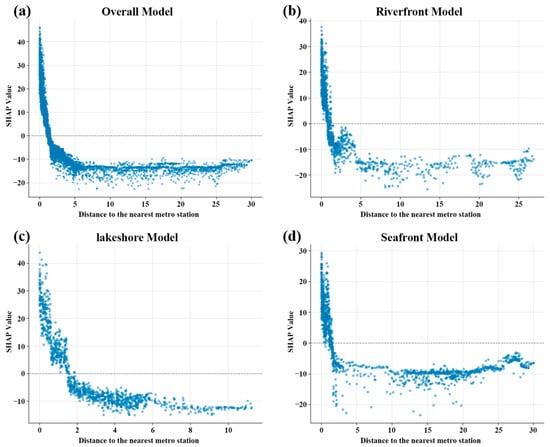
Figure 8.
Non-linear effects of distance to the nearest metro station. (a) Overall model. (b) Riverfront model. (c) Lakeshore model. (d) Seafront model.
The results of the overall model analyzing the relationship between the GVI and PA in waterfront spaces are presented in Figure 9. In general, a significant nonlinear relationship is observed between the GVI and PA (Figure 9a). Moderate levels of the GVI are associated with more frequent PA. Conversely, both excessively high and low values are linked to a reduction in activity. The results indicate that this optimal threshold is 30%.
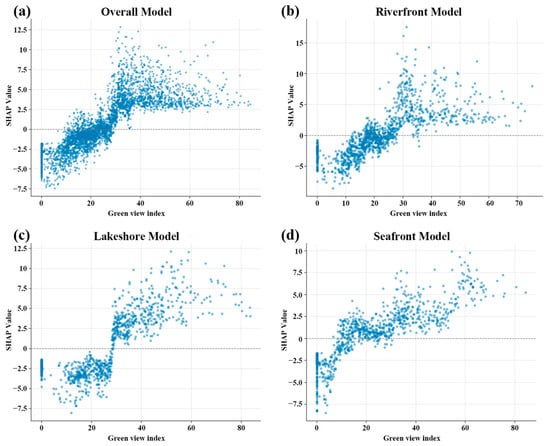
Figure 9.
Non-linear effects of GVI. (a) Overall model. (b) Riverfront model. (c) Lakeshore model. (d) Seafront model.
When examined by type, the results for riverfront spaces are largely consistent with the overall model (Figure 9b). For lakeshore spaces (Figure 9c), the trend aligns with the overall model in that a moderate GVI is associated with higher levels of PA. The key difference is that the optimal threshold here is 60%. It is noteworthy that, in the predictions for this type, the influence of the GVI on PA transitions from negative to positive correlation at approximately 30%, accompanied by a marked increase in the SHAP value. For seafront spaces (Figure 9d), the trend and the optimal threshold are similar to those of lakeshore spaces. However, the transition point from negative to positive correlation differs. The model results show that PA is most frequent at a GVI of 60%, and the influence shifts from negative to positive at a value of 16%.
The results of the overall model analyzing the relationship between the SVI and PA in waterfront spaces are presented in Figure 10. Overall, a significant nonlinear relationship is observed between the SVI and PA (Figure 10a). PA is most frequent when the SVI is around 17%. Conversely, both higher and lower values are associated with lower levels of activity.
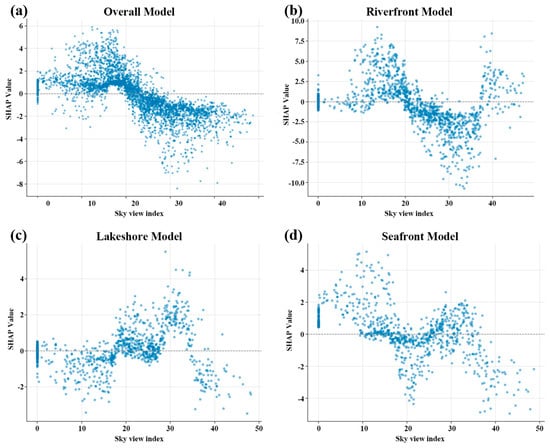
Figure 10.
Non-linear effects of SVI. (a) Overall model. (b) Riverfront model. (c) Lakeshore model. (d) Seafront model.
Figure 10b–d depicts the influence of the SVI on PA in riverfront, lakeshore, and seafront spaces, respectively. The model results in Figure 10b indicate a U-shaped relationship between the SVI and PA in riverfront spaces. Higher activity levels are associated with the index around 17% and 40%, whereas the values in between are linked to lower activity levels. The results show a negative correlation between the index and PA when it falls within the range of 20% to 37%, with the lowest point occurring at 35%. The model results in Figure 10c reveal an inverted U-shaped (n-shaped) relationship for lakeshore spaces. A moderate SVI, around 30%, is associated with the highest levels of PA, while both excessively high and low values correspond to decreased activity. Furthermore, the model indicates a negative effect on PA when the SVI is below 20% or above 35%. A positive effect is observed when the value lies between these two thresholds. The model results in Figure 10d demonstrate a complex nonlinear pattern of “decrease–increase–decrease” for the influence of the SVI on PA in seafront spaces. Lower values of the index are generally associated with high levels of PA. In contrast, higher values are significantly correlated with a reduction in activity.
4.3. Interaction Effects of Main Variables
SHAP interaction plots can reveal how features interact synergistically to influence the model’s final predictions. To gain deeper insights into the interactive effects on PA in waterfront spaces, we computed the results for all possible feature pairs. Given the volume of results, we have selected for presentation those interactions deemed to be of particular research value.
First, Figure 11a presents the interaction results between distance to the nearest metro station and the SVI from the overall model across the three waterfront types. In the plot, color represents the value of the SVI, the x-axis denotes the distance to the nearest metro station, and the y-axis represents the combined SHAP interaction value. It can be observed that at shorter distances to a metro station (0–2 km), the SHAP interaction value is maximized (3.8) when the SVI is approximately 15% (represented by purple data points). Conversely, the interaction value is minimized (−6.3) when the SVI exceeds 25%. This indicates a significant synergistic effect between these two features on PA in waterfront spaces.
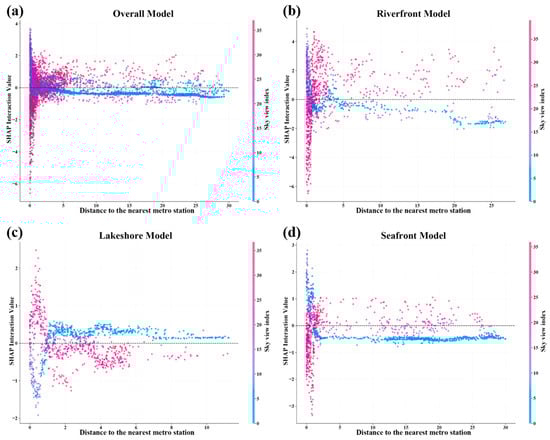
Figure 11.
Location interaction effects of distance to the nearest metro station variables with SVI variables. (a) Overall model. (b) Riverfront model. (c) Lakeshore model. (d) Seafront model.
Second, Figure 11b–d presents the interaction results between distance to the nearest metro station and the SVI for the riverfront, lakeshore, and seafront spatial models, respectively. On one hand, the model results reveal that both riverfront and seafront spaces exhibit interaction patterns similar to the overall model. Specifically, at shorter distances to a metro station, a lower SVI exerts a positive effect on PA, whereas a higher SVI exerts a negative effect. It is noteworthy that, under these conditions, the riverfront model exhibits higher absolute SHAP values for both the positive and negative influences.
Figure 12a presents the interaction results between the GVI and distance to the nearest shoreline from the overall model across the three waterfront types. It can be observed that when the GVI exceeds 25% and the distance to the nearest shoreline is greater than 1.5 km, the synergistic effect intensifies as the GVI increases.
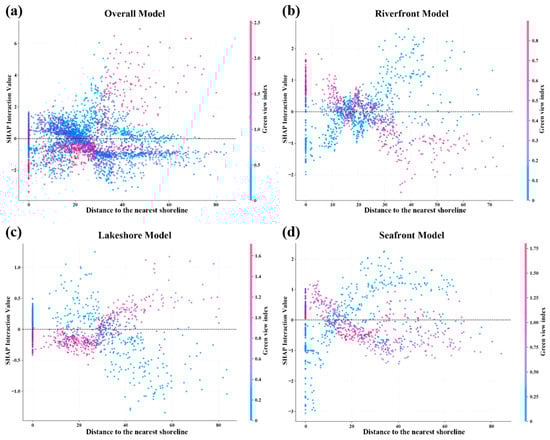
Figure 12.
Location interaction effects of GVI variables with distance to the nearest shoreline variables. (a) Overall model. (b) Riverfront model. (c) Lakeshore model. (d) Seafront model.
Examining the results by type, Figure 12c displays the model results for lakeshore spaces, indicating an interaction trend similar to that of the overall model. Figure 12b,d presents the partial interaction effects for riverfront and seafront spaces, respectively. The riverfront space model reveals that the SHAP interaction value is notably high when the GVI exceeds 25% and the distance to the nearest shoreline is less than 0.2 km. Similarly, for seafront spaces, high levels of PA are observed when the GVI is above 15% and the distance to the nearest shoreline is under 0.25 km.
5. Discussion
This study set out to investigate the differential drivers of PA across various types of urban waterfront spaces. A key finding is that waterfront typology—namely, riverfront, lakeshore, and seafront—exerts a significant moderating effect on both the strength and the pattern of influence exerted by factors related to transportation accessibility, natural landscape and environment, and facility services and functions. The following discussion interprets the findings presented in the Section 4 in greater depth.
5.1. Spatial Heterogeneity in Feature Importance
First, regarding transportation accessibility, the results indicate that distance to the nearest metro station ranked highly across all three waterfront types, underscoring public transport accessibility as a critical factor influencing PA in these spaces. This finding aligns with studies by Gao, Che, et al., which posit that enhancing public transport accessibility to waterfronts improves their connectivity with external functional zones, thereby increasing visit frequency and spatial vitality [42,43]. It also highlights the reliance on the metro network in a transit-oriented development (TOD) city like Shenzhen, resonating with the TOD model proposed by Calthorpe based on New Urbanism theory [44]. However, this finding contrasts with the conclusions of Liu et al. from their study of the Shanghai Huangpu River waterfront, where transportation accessibility exhibited a negative influence [8]. We speculate that this discrepancy may stem from Shenzhen’s more pronounced TOD characteristics and our study’s specific focus on PA, as opposed to general urban vitality. It is worth highlighting that seafront spaces demonstrated a greater reliance on road network accessibility compared to the other two types. This result corresponds with Hill’s “Natural Movement” theory, which posits a strong correlation between the spatial distribution of pedestrian flow and the spatial accessibility of the road network [45]. A plausible explanation is that Seafront spaces often function as tourist destinations, attracting visitor groups, frequently families, who may carry recreational equipment, thereby increasing their dependence on private vehicles and road networks. In contrast, riverfront and lakeshore spaces typically serve as venues for daily leisure activities, where visitors likely prioritize transport convenience, making them more sensitive to pedestrian-friendly access and public transport connectivity.
Second, regarding natural landscape elements, the results identify distinct key features for each waterfront type: NDVI for riverfront, the GVI for lakeshore, and distance to the nearest shoreline for seafront spaces. Riverfront spaces are often linear and primarily cater to slow-moving activities, placing a greater emphasis on overall green volume (NDVI) to enhance environmental comfort. In contrast to riverfronts, lakeshore spaces feature expansive water bodies, where visual enclosure and landscape quality are paramount. The GVI serves as a direct measure of this perceptual quality, explaining its significant influence on PA in these areas. This aligns with the findings of Macdonald et al. in Vancouver, who also identified green space as a critical factor influencing people’s stay in waterfront areas [46]. The distinctiveness of seafront spaces lies in their strong hydrophilic character. The openness of the beach encourages direct water-contact activities, which elucidates why distance to the nearest shoreline emerges as a pivotal factor. Surprisingly, water quality did not exhibit a strong influence in our models. This could be attributed to minimal variation in water quality across our study area, or its effect may be masked by more immediate visual and accessibility factors.
Finally, concerning facility services and functions, the results demonstrate that the number of sports facilities is a key factor influencing PA in both riverfront and lakeshore spaces, whereas the number of leisure facilities is the dominant factor in seafront spaces. This divergence can likely be explained by the distinct usage patterns of these spaces. Riverfront and lakeshore spaces often serve as primary venues for residents’ daily activities, frequently accommodating routine exercises and other physical activities, thereby creating a higher dependency on sports facilities. This observation is supported by Shi et al., whose research also indicated that public service facilities promote walking activity in waterfront areas. In contrast, seafront spaces often function as tourist destinations, catering more to non-local visitors and citizens engaging in holiday recreation. The primary purpose shifts from physical exercise to leisure and amusement, which explains why the number of leisure facilities, rather than sports facilities, is the critical determinant of PA levels there.
5.2. Nonlinear Influences and Threshold Effects of Elements Across Waterfront Typologies
As indicated by the feature importance rankings, distance to the nearest metro station is a significant factor influencing PA across all three waterfront typologies. The model results reveal a strong threshold effect for PA intensity when the distance to the nearest metro station reaches 2–2.5 km, a pattern consistent in both the overall model and the individual typology models. This relationship is characterized by a negative, L-shaped nonlinear curve. This critical distance aligns with the World Health Organization (WHO) recommendation of 30 min for walking-based PA [47,48,49], which corresponds to a distance of approximately 2–2.5 km at an average walking speed and is known to promote public health. Therefore, to enhance the spatial accessibility and proximity of urban waterfront spaces, public transport infrastructure—such as metro and bus stations—should be situated within a 2 km radius [50].
Beyond elements exhibiting consistent influence trends, certain features exert differential effects under the moderating influence of distinct waterfront typologies. The GVI and SVI serve as representative examples of this phenomenon. It is noteworthy that, compared to traditional built environment metrics, the streetscape indicators did not demonstrate a marked superiority in the SHAP importance rankings. However, their value lies in being more closely aligned with the authentic human perceptual scale, thereby offering stronger explanatory power for behavioral responses. Moreover, in practical terms, they provide designers with more intuitive and actionable guidance—such as specific vegetation arrangement and sky exposure control—rather than just macro-level prescriptions like overall NDVI.
Firstly, the model results indicate that, across all waterfront typologies, the influence of the GVI on PA is not a simple linear relationship but exhibits a nonlinear pattern consistent with the principle of “more is not always better”. This finding aligns with the work of Yang et al. at the city scale, suggesting that the underlying mechanism governing the impact of the GVI on human activity may be universal, applicable not only to general urban spaces but also to specific recreational settings like waterfronts and parks [51]. The results identify 30% as a critical threshold for most waterfront spaces. We posit that when the GVI reaches 30%, the accumulated greenness attains a threshold for forming high-quality environmental characteristics: trees begin to form continuous canopies, plant communities start to exert significant ecological functions, and environmental comfort and restorative potential are substantially enhanced, thereby encouraging PA. More importantly, this study reveals the moderating role of waterfront typology on this relationship. Although both lakeshore and seafront spaces exhibit nonlinear patterns, their optimal GVI threshold is 60%, and their transition points from negative to positive influence are 30% and 16%, respectively. We propose two potential explanations for these similarities and differences. On one hand, compared to the linear and often narrower riverfront spaces, lakeshore and seafront areas offer more expansive vistas. Creating a comparable sense of enclosure in these open settings requires more substantial three-dimensional greening, thus allowing for and benefiting from a higher overall green volume. On the other hand, a GVI of around 30% at lakeshore spaces can foster an enclosed, tranquil, and verdant atmosphere conducive to activity. In contrast, for seafront spaces where the sea is the dominant feature, a 16% GVI is sufficient to provide necessary shade, color, and a sense of ecology while preserving the openness and visibility of the seascape, thereby promoting PA. Therefore, tailored greening strategies should be implemented for different urban waterfront typologies to respond to the specific usage needs and viewing expectations inherent to each distinct setting [52].
Secondly, this study found that the SVI exerts a common nonlinear influence on PA in waterfront spaces, and its mechanism of effect is moderated by waterfront typology. This phenomenon can be plausibly explained through environmental behavior theories. The 17% threshold identified in the overall model strongly aligns with Appleton’s “Prospect-Refuge” theory. An increase in the SVI from a very low value signifies a transition from a highly enclosed space to a slightly more open one. This change can alleviate feelings of oppression and confinement, fostering positive psychological responses that encourage people to stay and be active. However, a continual increase in the SVI exerts a negative influence. This conforms to Appleton’s theory, which posits that humans in an environment have dual needs: for “prospect” (open views to survey opportunities or threats) and for “refuge” (elements providing a sense of protection and security) [53]. An excessively high SVI (>17%) implies a severe lack of refuge. Spaces that become overly open and exposed significantly diminish people’s willingness to linger and engage in activities, leading to a reduction in PA. It is noteworthy that the optimal range for the SVI varies across different urban waterfront typologies, highlighting the moderating role of spatial function and form on the effect of environmental features. For riverfront spaces, the influence on PA gradually shifts from negative to positive when the SVI exceeds 35%. This is likely because rivers, often appearing as linear elements in cities compared to lakes and the sea, benefit from a higher SVI and openness, which facilitate the creation of expansive visual corridors that encourage walking, running, and other activities along the river. Lakeshore spaces, in contrast, exhibit a typical need for moderate openness, peaking at 30%. This finding is consistent with Zhu et al., who reported that a sky openness below 0.2 negatively impacts vitality perception, with the effect turning positive beyond this value [54]. This suggests that lakeshore spaces require a balance, avoiding both excessive enclosure and excessive openness, to harmonize the viewing experience with the need for refuge.
5.3. Interaction Effects Among Elements
The interaction effect between distance to the nearest metro station and the SVI reveals a critical planning insight: an inseparable synergy exists between transport convenience and spatial environmental quality, and the nature of this relationship varies across different waterfront typologies. Firstly, for both riverfront and seafront spaces, PA levels are higher when public transport is highly accessible and the environment offers a relatively high degree of overhead enclosure (a lower SVI). This is likely because urban rivers, as linear spaces within the city, often function as composite corridors for transport and commerce. Furthermore, visits to the riverfront are frequently integrated into daily routines, creating a high overlap with the demand for metro commuting. Secondly, lakeshore spaces exhibit the opposite pattern: under conditions of good public transport accessibility, more open spaces (with a higher SVI) are associated with greater activity. We hypothesize that this result stems from the primary purposes of visits to lakeshores—sightseeing, recreation, and socializing. An open environment with good sightlines not only enhances the viewing experience but also fosters a greater sense of safety and spatial orientation, which aligns with the inherent need for visual permeability around a lake basin.
Beyond this, the interaction effect between the GVI and distance to the nearest shoreline profoundly reveals the fundamental differences in dominant activity types across waterfront spaces. This study identifies two primary synergistic modes of PA. The overall model and the lakeshore spaces represent a “distant view-high greenery” mode, which can be termed the “Viewing-Oriented Mode”. In this mode, a certain distance provides the vantage point needed for panoramic views of the water body, while a high GVI ensures environmental comfort. Together, they support leisurely activities such as strolling and sightseeing. This aligns with the findings of Hu, Zhang, et al. In stark contrast, riverfront and seafront spaces exhibit a strong “proximity-high greenery” mode, which we define as the “Water-Access-Oriented Mode”. The strongest interaction effects for both typologies occur in areas closest to the shoreline. This finding directly reflects the intrinsic nature of their activity types: riverside jogging and cycling, as well as seafront-specific activities like wading and beach sports, inherently require close physical proximity to the water. Furthermore, this finding strongly supports the view of White et al. that distance to the nearest shoreline is a key metric influencing vitality in such spaces. We argue that the root cause of this divergence likely lies in spatial morphology. Lakes typically feature expansive water surfaces and a grand scale, which limit direct water-access activities and thus encourage “viewing.” In contrast, rivers and coastlines provide linear and accessible edges that inherently support and promote various “water-access” physical activities. Therefore, in the planning of Riverfront and Seafront spaces, implementing high-quality greening design in the immediate riparian zone is crucial for promoting PA.
6. Conclusions
Urban waterfront spaces are among the preferred locations for public PA, making the underlying mechanisms linking different waterfront typologies to PA intensity a subject worthy of in-depth investigation. This study employed an integrated approach combining machine learning and explainable ML techniques to investigate threshold and interaction effects between environmental elements and PA in these spaces. The key findings are as follows: (1) The feature importance ranking across the three waterfront typologies consistently followed the order: transportation accessibility > natural Landscape and environment > facility services and functions. Public transport accessibility emerged as a core influencing factor, with road network accessibility being particularly critical for seafront spaces. (2) The influence of various factors on PA intensity exhibited typical threshold effects. For instance, a strong L-shaped threshold effect was observed around 2–2.5 km for distance to the nearest metro station across all typologies. The GVI showed an optimal threshold of 30% in the overall model, while lakeshore and seafront spaces accommodated a higher green volume, with a threshold of 60%. The SVI in the overall model displayed an initial increase followed by a decrease, peaking at 17%. Riverfront spaces exhibited a u-shaped relationship, lakeshore spaces an n-shaped one, and seafront spaces a complex “decrease–increase–decrease” pattern, where lower values were associated with higher activity. These patterns are closely linked to the viewing demands inherent to each specific waterfront typology. (3) Synergistic effects were identified among the predictive factors.
This study carries significant practical and theoretical implications. The findings provide empirical evidence and a theoretical foundation for health-oriented urban planning and the refined design of blue-green infrastructure. Firstly, in terms of transport planning, the study confirms the universal value of enhancing public transport accessibility, particularly within the 2–2.5 km range. This offers a theoretical basis for integrated transport planning aimed at promoting PA. Simultaneously, the specific reliance of seafront spaces on road network accessibility highlights the need to synchronize tourism development with the optimization of the road network system. This integrated approach is crucial to prevent disparities in accessibility from leading to inequitable distribution of health benefits.
Secondly, in landscape design, the nonlinear influences and varying thresholds of the GVI and SVI propel the field beyond traditional qualitative approaches towards a quantitative and human-centered scientific paradigm. This necessitates that, in blue-green infrastructure planning, alongside quantitative targets, we must also coordinate and optimize the perceptual quality and spatial sequence of the GVI and SVI, while paying attention to the marginal benefits of greening investments. For instance, riverfront spaces require the creation of shaded, comfortable linear corridors. This can be achieved by combining small trees and low shrubs to ensure an environmental greenness (GVI) of approximately 30%, while maintaining a relatively low SVI. In contrast, lakeshore spaces demand a balance between open vistas and green enclosure. A three-layered planting approach—comprising trees, shrubs, and herbaceous plants—can be employed. Specifically, selecting tall trees for the canopy layer can enhance the GVI while still allowing for a more open SVI, thereby directly responding to the “Prospect-Refuge” theory from environmental psychology.
Finally, regarding variable interactions, coordinated adjustments between factors are more conducive to promoting PA. Moreover, the synergistic mechanisms of the same variable pairs can differ significantly across waterfront typologies. Future waterfront regeneration should therefore emphasize interdisciplinary co-design, integrating transport hubs, landscape engineering, and activity facilities into a unified plan. This holistic approach is essential to activate synergistic effects among environmental elements and maximize health benefits. For example, in the overall model, the local interaction between distance to the nearest metro station and the SVI is most pronounced when the distance is between 0 and 2 km. However, the interaction mechanisms for the three distinct waterfront typologies are more complex and, in some cases, opposing. On one hand, for both riverfront and seafront spaces, PA is promoted when the distance to the nearest metro station is short and the SVI is low. Consequently, planning for these areas should aim to reduce the SVI around nearby metro stations by integrating architectural features like pavilions and pergolas with landscaping to create activity environments of a pleasant, human scale. Specifically, multi-layered green belts, comprising trees and shrubs, can be established along primary routes connecting metro stations to the waterfront, interspersed with structures such as arcades and gazebos. On the other hand, for lakeshore spaces, PA is positively promoted when the distance to the nearest metro station is short and the SVI is high. Thus, the design of lakeshore spaces should prioritize visual openness around metro stations. This can be achieved by reducing planting density and optimizing spatial layout to ensure clear and unobstructed visual corridors between the station and the lakefront. The findings of this study enlighten planners to avoid a one-size-fits-all strategy in waterfront resource allocation and urban governance. Recognizing the fundamental differences in the mechanisms driving PA across waterfront typologies is a crucial prerequisite for advancing environmental health equity and maximizing the return on finite public resources.
Although this study provides robust evidence for the differential influences of various factors on PA across urban waterfront typologies, several limitations should be acknowledged. Firstly, the user base of Strava primarily comprises younger, physically active demographics, potentially introducing bias regarding the PA patterns of older adults. Future research could therefore supplement these findings by specifically investigating waterfront space usage and PA within elderly populations. Secondly, while the 500 m grid used in this study effectively captures macro-level patterns, it may not fully unravel complex micro-scale influences. Future work could employ a multi-scale analytical framework to test the robustness of these nonlinear thresholds across different spatial granularities. Finally, this study utilized streetscape imagery to investigate its impact on objective human activity. Beyond this, as noted by Wu et al., streetscape data also significantly influence subjective human perception [55,56]. For instance, Ogawa et al. identified seven streetscape elements significantly affecting subjective perception, finding that elements like roads and buildings positively influenced perceptions of liveliness but negatively impacted perceptions of tranquility [57]. Similarly, Xu et al. employed large models to extract both objective and subjective perceptual factors from street views, analyzing their relationship with cycling preference. Their findings indicated that factors such as beauty, vegetation, liveliness, safety, and buildings significantly influenced cycling preferences [58]. Consequently, future research could explore the mechanisms influencing PA in different waterfront typologies from an integrated objective–subjective perceptual perspective. Although the specific thresholds identified in this study may require localized calibration in other urban contexts, the core mechanisms revealed—namely, the fundamental moderating role of waterfront typology and the prevalence of nonlinear threshold effects—provide a universal theoretical framework and analytical pathway for the refined, health-oriented planning of similar cities worldwide.
Author Contributions
L.H.: Writing—original draft, Methodology, Formal analysis, Conceptualization. B.Y.: Writing—review and editing, Methodology, Funding acquisition, Formal analysis, Conceptualization. Y.J.: Writing-review and editing, Validation. Y.Y.: Writing—review & editing, Validation. H.Q.: Writing—review and editing. H.F.: Writing—review and editing, Validation, Formal analysis. All authors have read and agreed to the published version of the manuscript.
Funding
This study was supported by the National Natural Science Foundation of China (No. 52208034, No. 52508088, No. 52508086).
Data Availability Statement
The original contributions presented in the study are included in the article, further inquiries can be directed to the corresponding author.
Conflicts of Interest
The authors declare that they have no known competing financial interests or personal relationships that could have appeared to influence the work reported in this paper.
Appendix A
Table A1.
Review of the research on PA and the waterfront space.
Table A1.
Review of the research on PA and the waterfront space.
| Reference | Author(s) | Study Area | Dependent Variables(s) | Independent Variable(s) | Analytical Method(s) | Key Findings |
|---|---|---|---|---|---|---|
| [8] | Song Liu et al., 2021 | Huangpu River waterfront space, Shanghai, China | Real-time Tencent User Density Data | Vitality density Vitality stability | Structural Equation Modeling | Service facilities and similar factors had a significant positive effect on vitality. |
| [16] | Hayley Christian et al., 2011 | Perth, Australia | Questionnaire | Objective: walkability index, NDVI Perceived: NEWS Scale | Linear Regression | Safety from crime was negatively correlated with BMI. |
| [17] | Cynthia Carlson et al., 2012 | Manchester and Portsmouth, USA | Questionnaire | Objective: sidewalk quality, road connectivity Perceived: reported barriers to walking | Multilevel Models | Sidewalk quality was positively associated with walking behavior. A bidirectional feedback loop existed between health and walking. |
| [18] | Mengxuan Liu et al., 2023 | Six typical waterfront spaces in Shanghai, China | Pedestrian activity data collected at observation points | Microclimatic parameters, Spatial characteristics | Multiple Linear Regression Neural Network Models | Service facilities had the greatest impact on activity in waterfront spaces. |
| [22] | Xinyang Li et al., 2025 | Different types of LUSs (Leisure Urban Spaces) in the main urban area of Nanjing, China | Spatial Type, Location, Time | Baidu Heat Map Data, Meituan Dianping Data | Descriptive statistics, Spatial clustering, Sentiment scoring | Leisure districts demonstrated superior performance across multiple dimensions. |
| [23] | Yingxiang Niu et al., 2021 | Waterfront spaces in the historic city center of Suzhou, China | WeChat Heat Map Data | Multivariate data (POI, river attributes, spatial types, road network data, digital elevation) | Hash algorithm | Transportation accessibility was positively correlated with waterfront vitality. |
| [24] | Yuxiao Jiang et al., 2021 | Hong Kong, China | Google Street View Images | 5Ds, Street view imagery | Spatial Lag Model | Theoretically and empirically distinguished two types of walking behavior for the first time, revealing their spatial mismatch. |
| [26] | Jiayang Jiang et al., 2024 | 170 waterfront neighborhoods in three cold-region cities, China | Simulation Data | Built environment data | Regression Analysis, Machine Learning | Identified six core urban morphological factors that most significantly influence the thermal comfort of waterfront areas in cold regions. |
| [27] | Jie Ding et al., 2023 | Qinhuai River waterfront space, Nanjing, China | Baidu Heat Map Data | Physical environment data, spatial experience data | OLS MGWR | Factors such as catering experience had a strong positive influence, while factors like distance from the river exhibited a strong negative influence. |
References
- Bull, F.C.; Al-Ansari, S.S.; Biddle, S.; Borodulin, K.; Buman, M.P.; Cardon, G.; Carty, C.; Chaput, J.-P.; Chastin, S.; Chou, R. World Health Organization 2020 guidelines on physical activity and sedentary behaviour. Br. J. Sports Med. 2020, 54, 1451–1462. [Google Scholar] [CrossRef]
- Kekäläinen, T.; Freund, A.M.; Sipilä, S.; Kokko, K. Cross-sectional and longitudinal associations between leisure time physical activity, mental well-being and subjective health in middle adulthood. Appl. Res. Qual. Life 2020, 15, 1099–1116. [Google Scholar] [CrossRef]
- Matthews, C.E.; Moore, S.C.; Arem, H.; Cook, M.B.; Trabert, B.; Håkansson, N.; Larsson, S.C.; Wolk, A.; Gapstur, S.M.; Lynch, B.M. Amount and intensity of leisure-time physical activity and lower cancer risk. J. Clin. Oncol. 2020, 38, 686–697. [Google Scholar] [CrossRef] [PubMed]
- Lee, D.H.; Rezende, L.F.; Joh, H.-K.; Keum, N.; Ferrari, G.; Rey-Lopez, J.P.; Rimm, E.B.; Tabung, F.K.; Giovannucci, E.L. Long-term leisure-time physical activity intensity and all-cause and cause-specific mortality: A prospective cohort of US adults. Circulation 2022, 146, 523–534. [Google Scholar] [CrossRef] [PubMed]
- Ewing, R.; Cervero, R. Travel and the built environment: A meta-analysis. J. Am. Plan. Assoc. 2010, 76, 265–294. [Google Scholar] [CrossRef]
- Chen, Y.; Yu, B.; Shu, B.; Yang, L.; Wang, R. Exploring the spatiotemporal patterns and correlates of urban vitality: Temporal and spatial heterogeneity. Sustain. Cities Soc. 2023, 91, 104440. [Google Scholar] [CrossRef]
- Yu, B.; Cui, X.; Liu, R.; Luo, P.; Tian, F.; Yang, T. Intergenerational differences in the urban vibrancy of TOD: Impacts of the built environment on the activities of different age groups. Front. Public Health 2022, 10, 994835. [Google Scholar] [CrossRef]
- Liu, S.; Lai, S.-Q.; Liu, C.; Jiang, L. What influenced the vitality of the waterfront open space? A case study of Huangpu River in Shanghai, China. Cities 2021, 114, 103197. [Google Scholar] [CrossRef]
- Zhou, Z.; Yang, F.; Li, J.; Li, J.; Zou, Z. Identification of Critical Areas of Openness–Vitality Intensity Imbalance in Waterfront Spaces and Prioritization of Interventions: A Case Study of Xiangjiang River in Changsha, China. Land 2024, 13, 686. [Google Scholar] [CrossRef]
- Fortes, L.M.; Giannotti, M.; de Freitas, F.S. Gender, class and race uneven access to bike systems across five Brazilian cities. Cities 2024, 148, 104822. [Google Scholar] [CrossRef]
- Luo, X.; Zhao, Y.; Yang, J.; Li, Y.; Luo, Z. Adaptive design strategies for thermal comfort in waterfront campsites during summer in hot and humid regions. Int. J. Therm. Sci. 2024, 199, 108945. [Google Scholar] [CrossRef]
- Sun, D.; Ji, X.; Lyu, M.; Fu, Y.; Gao, W. Evaluation and diagnosis for the pedestrian quality of service in urban riverfront streets. J. Clean. Prod. 2024, 452, 142090. [Google Scholar] [CrossRef]
- Chen, J.; Li, H.; Luo, S.; Su, D.; Zang, T.; Kinoshita, T.; Yang, L. How do economic levels, urbanization, and infrastructure investments influence inequality in urban green space exposure? Insights from Japanese municipalities. Urban For. Urban Green. 2025, 104, 128649. [Google Scholar] [CrossRef]
- He, P.; Yu, B.; Ma, J.; Luo, K.; Chen, S.; Shen, Z. Exploring the non-linear relationship and synergistic effect between urban built environment and public sentiment integrating macro-and micro-level perspective: A case study in San Francisco. Front. Psychol. 2024, 15, 1276923. [Google Scholar] [CrossRef] [PubMed]
- Kaplan, R.; Kaplan, S.; Brown, T. Environmental preference: A comparison of four domains of predictors. Environ. Behav. 1989, 21, 509–530. [Google Scholar] [CrossRef]
- Christian, H.; Giles-Corti, B.; Knuiman, M.; Timperio, A.; Foster, S. The influence of the built environment social environment health behaviors on body mass index. Results from RESIDE. Prev. Med. 2011, 53, 57–60. [Google Scholar] [CrossRef]
- Carlson, C.; Aytur, S.; Gardner, K.; Rogers, S. Complexity in built environment, health, and destination walking: A neighborhood-scale analysis. J. Urban Health 2012, 89, 270–284. [Google Scholar] [CrossRef]
- Liu, M.; Yang, C.; Fan, Z.; Yuan, C. Prediction approach on pedestrian outdoor activity preference under factors of public open space integrated microclimate. Build. Environ. 2023, 244, 110761. [Google Scholar] [CrossRef]
- Zeng, X.; Zhong, Y.; Yang, L.; Wei, J.; Tang, X. Analysis of Forest landscape preferences and emotional features of Chinese Forest recreationists based on deep learning of geotagged photos. Forests 2022, 13, 892. [Google Scholar] [CrossRef]
- Liu, S.; Ma, X. How social networks affect the spatiotemporal planning of smart tourism: Evidence from shanghai. Sustainability 2021, 13, 7394. [Google Scholar] [CrossRef]
- Wei, D.; Wang, Y.; Jiang, Y.; Guan, X.; Lu, Y. Deciphering the effect of user-generated content on park visitation: A comparative study of nine Chinese cities in the Pearl River Delta. Land Use Policy 2024, 144, 107259. [Google Scholar] [CrossRef]
- Li, X.; Kozlowski, M.; Ismail, S.B.; Salih, S.A. Multidimensional Evaluation of Crowd Activity Performance in Leisure Urban Spaces Using Network Big Data: A Case Study from Nanjing, China. J. Urban Plan. Dev. 2025, 151, 05025014. [Google Scholar] [CrossRef]
- Niu, Y.; Mi, X.; Wang, Z. Vitality evaluation of the waterfront space in the ancient city of Suzhou. Front. Archit. Res. 2021, 10, 729–740. [Google Scholar] [CrossRef]
- Jiang, Y.; Chen, L.; Grekousis, G.; Xiao, Y.; Ye, Y.; Lu, Y. Spatial disparity of individual and collective walking behaviors: A new theoretical framework. Transp. Res. Part D Transp. Environ. 2021, 101, 103096. [Google Scholar] [CrossRef]
- Hu, X.; Cao, K.; Huang, B.; Li, X.; Wu, R. Walkability of greenways from the perspective of the elderly: A case study of Huangpu River waterfront greenway. Int. J. Appl. Earth Obs. Geoinf. 2025, 136, 104322. [Google Scholar] [CrossRef]
- Jiang, J.; Pan, W.; Zhang, R.; Hong, Y.; Wang, J. Thermal comfort study of urban waterfront spaces in cold regions: Waterfront skyline control based on thermal comfort objectives. Build. Environ. 2024, 256, 111515. [Google Scholar] [CrossRef]
- Ding, J.; Luo, L.; Shen, X.; Xu, Y. Influence of built environment and user experience on the waterfront vitality of historical urban areas: A case study of the Qinhuai River in Nanjing, China. Front. Archit. Res. 2023, 12, 820–836. [Google Scholar] [CrossRef]
- Jiang, Y.; Sun, Z.; Wei, D.; Zhao, P.; Yang, L.; Lu, Y. Revealing the spatiotemporal pattern of urban vibrancy at the urban agglomeration scale: Evidence from the Pearl River Delta, China. Appl. Geogr. 2025, 181, 103694. [Google Scholar] [CrossRef]
- An, R.; Shen, J.; Yang, Q.; Yang, Y. Impact of built environment on physical activity and obesity among children and adolescents in China: A narrative systematic review. J. Sport Health Sci. 2019, 8, 153–169. [Google Scholar] [CrossRef] [PubMed]
- Li, Q.; Peng, K.; Cheng, P. Community-level urban green space equity evaluation based on spatial design network analysis (sDNA): A case study of central wuhan, China. Int. J. Environ. Res. Public Health 2021, 18, 10174. [Google Scholar] [CrossRef]
- Wu, T.; Lin, D.; Chen, Y.; Wu, J. Integrating Street View Images, Deep Learning, and sDNA for Evaluating University Campus Outdoor Public Spaces: A Focus on Restorative Benefits and Accessibility. Land 2025, 14, 610. [Google Scholar] [CrossRef]
- Yang, L.; Ao, Y.; Ke, J.; Lu, Y.; Liang, Y. To walk or not to walk? Examining non-linear effects of streetscape greenery on walking propensity of older adults. J. Transp. Geogr. 2021, 94, 103099. [Google Scholar] [CrossRef]
- Yang, L.; Yu, B.; Liang, Y.; Lu, Y.; Li, W. Time-varying and non-linear associations between metro ridership and the built environment. Tunn. Undergr. Space Technol. 2023, 132, 104931. [Google Scholar] [CrossRef]
- Ganaie, M.A.; Hu, M.; Malik, A.K.; Tanveer, M.; Suganthan, P.N. Ensemble deep learning: A review. Eng. Appl. Artif. Intell. 2022, 115, 105151. [Google Scholar] [CrossRef]
- Yang, H.; Chen, Z.; Yang, H.; Tian, M. Predicting coronary heart disease using an improved LightGBM model: Performance analysis and comparison. IEEE Access 2023, 11, 23366–23380. [Google Scholar] [CrossRef]
- Li, K.; Xu, H.; Liu, X. Analysis and visualization of accidents severity based on LightGBM-TPE. Chaos Solitons Fractals 2022, 157, 111987. [Google Scholar] [CrossRef]
- Kara, S.; Aksebzeci, B.H.; Kodaz, H.; Güneş, S.; Kaya, E.; Özbilge, H. Medical application of information gain-based artificial immune recognition system (IG-AIRS): Classification of microorganism species. Expert Syst. Appl. 2009, 36, 5168–5172. [Google Scholar] [CrossRef]
- Lan, H.; Hou, H.C.; Gou, Z. A machine learning led investigation to understand individual difference and the human-environment interactive effect on classroom thermal comfort. Build. Environ. 2023, 236, 110259. [Google Scholar] [CrossRef]
- Hou, L.; Dai, Q.; Song, C.; Liu, B.; Guo, F.; Dai, T.; Li, L.; Liu, B.; Bi, X.; Zhang, Y. Revealing drivers of haze pollution by explainable machine learning. Environ. Sci. Technol. Lett. 2022, 9, 112–119. [Google Scholar] [CrossRef]
- Kim, Y.; Kim, Y. Explainable heat-related mortality with random forest and SHapley Additive exPlanations (SHAP) models. Sustain. Cities Soc. 2022, 79, 103677. [Google Scholar] [CrossRef]
- Urista, D.V.; Carrué, D.B.; Otero, I.; Arrasate, S.; Quevedo-Tumailli, V.F.; Gestal, M.; González-Díaz, H.; Munteanu, C.R. Prediction of antimalarial drug-decorated nanoparticle delivery systems with random forest models. Biology 2020, 9, 198. [Google Scholar] [CrossRef]
- Gao, F.; Chen, X.; Liao, S.; Chen, W.; Feng, L.; Wu, J.; Zhou, Q.; Zheng, Y.; Li, G.; Li, S. Crafting a jogging-friendly city: Harnessing big data to evaluate the runnability of urban streets. J. Transp. Geogr. 2024, 121, 104015. [Google Scholar] [CrossRef]
- Che, Y.; Yang, K.; Chen, T.; Xu, Q. Assessing a riverfront rehabilitation project using the comprehensive index of public accessibility. Ecol. Eng. 2012, 40, 80–87. [Google Scholar] [CrossRef]
- Calthorpe, P. The Next American Metropolis: Ecology, Community, and the American Dream; Princeton Architectural Press: New York, NY, USA, 1993. [Google Scholar]
- Penn, A.; Hillier, B.; Banister, D.; Xu, J. Configurational modelling of urban movement networks. Environ. Plan. B Plan. Des. 1998, 25, 59–84. [Google Scholar] [CrossRef]
- Macdonald, E. Urban Waterfront promenades and physical activity by older adults: The case of Vancouver. J. Archit. Plan. Res. 2007, 24, 181–198. [Google Scholar]
- Physical Activity Guidelines Advisory Committee. Physical Activity Guidelines Advisory Committee Report, 2008; US Department of Health and Human Services: Washington, DC, USA, 2008.
- Warburton, D.E.; Charlesworth, S.; Ivey, A.; Nettlefold, L.; Bredin, S.S. A systematic review of the evidence for Canada’s Physical Activity Guidelines for Adults. Int. J. Behav. Nutr. Phys. Act. 2010, 7, 39. [Google Scholar] [CrossRef]
- World Health Organization. Global Recommendations on Physical Activity for Health; World Health Organization: Geneva, Switzerland, 2010; p. 60.
- Zhou, S.; Chen, F.; Xu, Z. Evaluating the accessibility of urban parks and waterfronts through online map services: A case study of Shaoxing, China. Urban For. Urban Green. 2022, 77, 127731. [Google Scholar] [CrossRef]
- Yang, L.; Yang, H.; Yu, B.; Lu, Y.; Cui, J.; Lin, D. Exploring non-linear and synergistic effects of green spaces on active travel using crowdsourced data and interpretable machine learning. Travel Behav. Soc. 2024, 34, 100673. [Google Scholar] [CrossRef]
- Li, J.; Guo, X.; You, J.; He, Z.; Yang, Z.; Wang, L. Perception and drivers of cultural ecosystem services in waterfront green spaces: Insights from social media text analysis. Anthropocene 2025, 50, 100477. [Google Scholar] [CrossRef]
- Appleton, J. Landscape evaluation: The theoretical vacuum. Trans. Inst. Br. Geogr. 1975, 66, 120–123. [Google Scholar] [CrossRef]
- Zhu, J.; Wang, S.; Ma, H.; Shan, T.; Xu, D.; Sun, F. Nonlinear effect of urban visual environment on residents’ psychological perception—An analysis based on XGBoost and SHAP interpretation model. City Environ. Interact. 2025, 27, 100202. [Google Scholar] [CrossRef]
- Wu, C.; Ye, Y.; Gao, F.; Ye, X. Using street view images to examine the association between human perceptions of locale and urban vitality in Shenzhen, China. Sustain. Cities Soc. 2023, 88, 104291. [Google Scholar] [CrossRef]
- Wang, R.; Jiang, Y.; Liu, D.; Peng, H.; Cao, M.; Yao, Y. Is perceived safety a prerequisite for the relationship between green space availability, and the use and perceived comfort of green space? Wellbeing Space Soc. 2025, 8, 100247. [Google Scholar] [CrossRef]
- Ogawa, Y.; Oki, T.; Zhao, C.; Sekimoto, Y.; Shimizu, C. Evaluating the subjective perceptions of streetscapes using street-view images. Landsc. Urban Plan. 2024, 247, 105073. [Google Scholar] [CrossRef]
- Xu, H.; Jiang, Y.; Xue, T.; Wang, Z.; Fang, Y.; Huang, X. Exploring the impact of objective features and subjective perceptions of street environment on cycling preferences. Cities 2026, 168, 106434. [Google Scholar] [CrossRef]
Disclaimer/Publisher’s Note: The statements, opinions and data contained in all publications are solely those of the individual author(s) and contributor(s) and not of MDPI and/or the editor(s). MDPI and/or the editor(s) disclaim responsibility for any injury to people or property resulting from any ideas, methods, instructions or products referred to in the content. |
© 2025 by the authors. Licensee MDPI, Basel, Switzerland. This article is an open access article distributed under the terms and conditions of the Creative Commons Attribution (CC BY) license (https://creativecommons.org/licenses/by/4.0/).