Abstract
In the context of new-type urbanization and high-quality development, this study aims to construct a multi-objective synergistic land-use mechanism to tackle the “growth-equity-ecology” trilemma in the Chengdu–Chongqing Urban Agglomeration (CCUA). By building an economic–social–ecological benefit evaluation index system and applying TOPSIS with entropy weighting, the coupling coordination degree (CCD) model, and the spatial Durbin model (SDM), we systematically explore the spatiotemporal patterns of land-use benefit synergies and their driving mechanisms. The results reveal the following: (1) From 2015 to 2023, CCUA’s land-use CCD generally improved but showed marked core–periphery polarization. Chongqing’s economic agglomeration worsened regional gaps, while Sichuan’s intra-regional policies boosted internal balance; cross-jurisdictional collaboration eased border disparities but failed to stop overall polarization. (2) Spatial clustering identified hotspots in Chongqing’s main urban and suburban areas and cold spots in eastern Sichuan, reflecting the coexistence of factor agglomeration and cross-border policy synergy. (3) Road network expansion directly hindered CCD, and neighboring ecological protection triggered resource-competition spillovers, emphasizing the key role of cross-regional governance in balancing the “ecology-development” trade-off. This study puts forward spatially differentiated strategies and cross-jurisdictional coordination mechanisms to optimize land-use structures and advance sustainable development in urban agglomerations.
1. Introduction
Land, a fundamental resource for human society, is pivotal for regional economic–social–ecological sustainability. Land use efficiency, defined as human-driven land use outputs [1], embodies multi-dimensional (economic–social–ecological) outputs. Global urbanization has intensified conflicts between land scarcity and multifunctionality, with extensive development triggering ecological degradation and human–land imbalances—key bottlenecks to regional sustainability [2]. Between 1978 and 2023, China’s urbanization rate climbed from 17.9% to 66.16%, yet regional land development disparities persisted [3]. For example, eastern coastal cities’ per capita Gross Domestic Product (GDP) far exceeds that of western regions, highlighting spatial development inequities [4]. The Chengdu–Chongqing Urban Agglomeration (CCUA), as China’s fourth economic pole and a Yangtze River ecological hub, faces unique pressure: balancing rapid industrialization with strict upper-basin conservation [5]. Its land use faces three core challenges. First, economic–ecological trade-offs exist as urban expansion encroaches on ecological zones, degrading services and resources. Second, social–spatial inequities are evident, as regional gaps and urban–rural dualism fuel land conflicts, with unequal public service/industrial land allocation undermining equity [6]. Third, systemic risks emerge from nonlinear couplings among economic, social, and ecological factors, driving inefficient growth, service shortages, and ecological risks.
Resolving this conflict demands innovative land-use coordination, positioning the CCUA—an economic–ecological frontier that is critical for emerging economy sustainability research. While existing studies have advanced land use efficiency research across multiple dimensions, their application to complex regions like the CCUA remains inadequate. Notably, although recent CCUA-focused studies have begun to explore urbanization–ecology coupling [7], eco-efficiency dynamics [8], and ecological security [9], both the volume and systemic depth of the investigation still trail behind more established regions. For instance, research on mature clusters such as Beijing–Tianjin–Hebei provides more refined analyses of subsystem coupling mechanisms like water resources carrying capacity [10], while studies on the Yangtze River Economic Belt offer advanced frameworks for quantifying multi-functional synergies and trade-offs [11]. Theoretically, land as a “natural–social–economic” composite system has shifted from unidimensional to multi-system coupling paradigms. Early studies explored double-benefit interactions, whereas current research increasingly employs “economic–social–ecological” three-dimensional models [12]. Yet, empirical applications of these models to regions such as the CCUA, which balance economic growth and upper Yangtze conservation, remain limited. Methodologically, research has shifted from single-economic analysis to multi-technique integration. Early studies quantified economic benefits through land exchange value theory, whereas recent advances employ diverse approaches, including entropy-weight methods [13], comprehensive evaluation models [14], coupled coordination models [15], gray prediction systems [16], and entropy-weighted TOPSIS [17]. Additionally, Random Forest Regression [18], geographically weighted regression [19], and geodetectors analyze driving factors [5]. Nevertheless, existing studies have yet to fully address spatial interaction effects, regional specificity, and multi-dimensional dynamics—key factors in explaining land-use efficiency within complex urban agglomerations like the CCUA. Spatially, most existing research focuses on provincial or municipal levels [20,21], while county-level analyses remain underrepresented.
In light of the identified gaps in previous studies, this research centers on the Chengdu–Chongqing Urban Agglomeration (CCUA) to investigate three interconnected issues: how the economic, social, and ecological benefits of land use evolve and interact across space and time, to what extent these multidimensional benefits are coupled and coordinated and what spatial patterns this coordination exhibits, and which key factors shape such coordinated development. To address these questions, the study pursues three sequential objectives. First, it constructs an evaluation framework based on the entropy-weighted TOPSIS method to assess land-use benefits across all study units from 2015 to 2023, thereby delineating regional characteristics and temporal trends. Subsequently, it applies a coupling coordination model to analyze spatio-temporal variations in the synergy among these benefits and to identify regional strengths and weaknesses in achieving coordinated development. Finally, a spatial Durbin model is employed to systematically examine the driving factors, probing their directional influence, magnitude, and spatial interdependencies in order to pinpoint the key determinants of land-use coordination. The findings are intended to offer theoretical insights and practical guidance for optimizing land-use structures, enhancing comprehensive land-use benefits, and advancing sustainable human–land coordination within the CCUA.
Following this introduction, the paper proceeds with four sections. Section 2 describes the study area, data, and analytical framework, including the multi-dimensional evaluation system and spatial econometric models. Section 3 presents the spatio-temporal patterns of land-use benefits, their coupling coordination degree, and the driving mechanisms derived from spatial regression. Section 4 interprets these findings, discusses their theoretical and policy implications, and proposes an institutional innovation framework with spatially differentiated governance strategies. Section 5 summarizes the key results, outlines the study’s contributions and limitations, and suggests future research directions.
2. Study Area and Methodology
2.1. Study Area and Data Sources
The CCUA is located in the western part of China, which is the strategic intersection hub of the Yangtze River Economic Belt and the Belt and Road Initiative (BRI). As the core ecological barrier in the upper reaches of the Yangtze River, the region features complex topography spanning plains, hills, and mountains, with significant climatic diversity and rich ecosystems, combining high ecological sensitivity and potential for economic development. However, rapid urbanization has led to disorderly land expansion and spatial fragmentation, resulting in intensified human–land conflicts and increased ecological vulnerability. As the core growth pole of the western region, with a population of nearly 100 million and GDP exceeding CNY 60 trillion [22], its land use and sustainable development paths are of key significance in balancing regional development and environmental protection. Therefore, this study focuses on 15 prefecture-level cities in Sichuan Province and 29 districts and counties in Chongqing Municipality, as illustrated in Figure 1, to provide a scientific basis for the optimal allocation of land resources in ecologically sensitive urban agglomerations by analyzing the coupled and coordinated mechanisms and spatial-temporal evolution laws of the economic, social, and ecological benefits of land use.
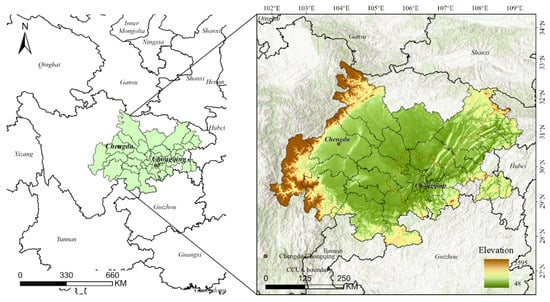
Figure 1.
Study area.
The sources of all raw data used in this study are listed in Table 1. Some of the data were derived from calculations based on the raw data, while certain attribute information was extracted from original vector datasets. The study integrates multi-source data covering parts of Chongqing Municipality and Sichuan Province for the years 2015, 2020, and 2023. All spatial data have been unified to a consistent coordinate system and resolution. Several data limitations should be noted. The normalized difference vegetation index (NDVI) data, derived from the monthly composites of the MOD13A3 dataset and averaged to represent annual values, enhance the stability of inter-annual comparisons by integrating vegetation signals across the entire year, though this is at the cost of losing finer seasonal dynamics such as peak growing-season variation. Missing values in socioeconomic statistical indicators were filled using interpolation or mean imputation, which may smooth out actual short-term fluctuations. Regarding spatial data, the 30 m land-use classification may exhibit mixed-pixel errors in urban–rural transition zones, and nighttime light data are susceptible to influences from sensor performance and atmospheric conditions. Additionally, the digital elevation model (DEM) and administrative boundary data are based solely on the 2023 version, under the assumption that changes over the study period are negligible; this approach may overlook the potential effects of local terrain modifications or minor boundary adjustments. These limitations should be taken into account when interpreting the results.

Table 1.
Data sources.
The analytical framework of this research is structured as follows, in Figure 2.
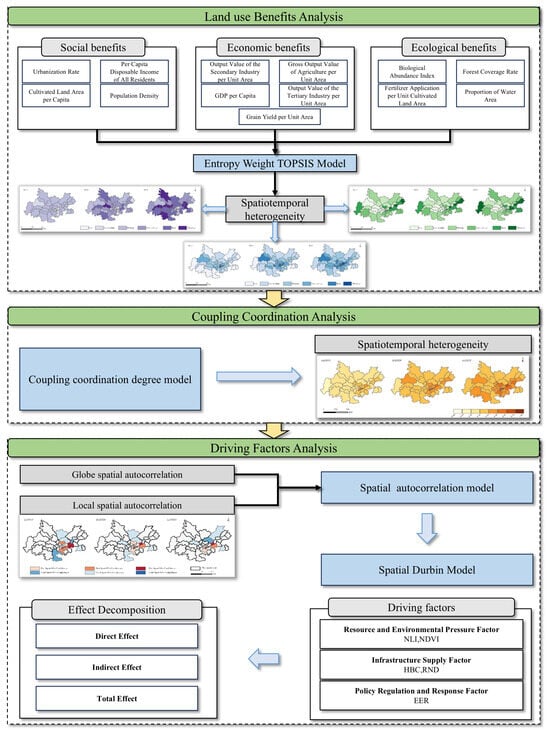
Figure 2.
Analytical framework.
2.2. Methodology
2.2.1. Construction of the Indicator System
To evaluate the comprehensive benefits of land use, this study establishes a multi-dimensional assessment system based on the “economy–society–ecology” sustainability framework, which emphasizes synergistic integration. This approach aligns with the concept of coupling coordination used to analyze socioeconomic–ecological interactions at a national scale [23]. Methodologically, it also draws on advances in simulating the dynamics of such coupled systems under different scenarios within critical regions [24], applying this perspective to the CCUA. Following the principles of science, representativeness, and operability, and considering local conditions, we construct an index system to assess the economic, social, and ecological benefits.
The indicators are classified according to their principal function within the sustainability framework [25]. Economic indicators directly capture land’s productivity and value-generation capacity. GDP per capita is included here as a measure of economic output efficiency per person. Social indicators address human well-being and development-related pressures. They include positive welfare metrics (e.g., disposable income) and potential pressures such as urbanization rate and population density marked “–” to reflect their potential strain on public services and quality of life. Cultivated land per capita is treated as a social indicator due to its direct link to food security. Ecological indicators evaluate ecosystem health and anthropogenic impacts, covering natural endowment (e.g., biological abundance, water area proportion as a key component of aquatic ecosystems, and regional water resource capacity) and pressures (e.g., fertilizer use). This approach systematically reveals synergies and trade-offs, offering a balanced evaluation of land-use patterns. Details are in Table 2.
Table 2.
Integrated land-use efficiency indicator system.
2.2.2. Entropy TOPSIS Method
The entropy value TOPSIS method is used to assign the weights of each index. According to the basic principle of information theory, information is a measure of the degree of orderliness of a system, while entropy is a measure of the degree of disorder of a system; both are equal in absolute value, but opposite in sign [26].
Data standardization is performed first:
where refers to the weight of the ith sample data under the jth indicator for that indicator.
where refers to the entropy value of the jth indicator; , which satisfies .
where refers to the information entropy redundancy.
where is the weight of the jth indicator.
Find the weights of the indicators:
Based on the weight sets derived above, the positive ideal solution, , and the negative ideal solution, , are determined for each indicator:
Calculate the distances and of each scheme from the positive ideal solution, , and the negative ideal solution, :
where denotes the value of the jth indicator of the ith program.
Calculate the evaluation index (relative distance from positive and negative ideal solutions) for each scenario:
where , and the larger , the higher the land-use benefits.
2.2.3. Degree of Coupling Coordination
The degree of coupling coordination measures the level of harmonious interaction among the economic, social, and ecological systems, with a higher value indicating greater synergy [23]. This concept is grounded in the theory of coupled social–ecological systems, which emphasizes the interdependence and co-evolution of human and natural components [27]. The degree is calculated according to the following formula:
In the formula, is the comprehensive evaluation index of the economic, social, and ecological systems. Assuming equal importance for the three systems, the interaction parameters , , and are all set to 1/3. , , and represent the evaluation indices for economy, society, and ecology, respectively.
This study constructs a coupled coordination grading system via a data-driven policy articulation and academic inheritance framework. Using ArcGIS Pro (version 3.4; Esri, Redlands, CA, USA)’s natural discontinuity grading, we identify inflection points in coordination degrees across 132 spatial units in the CCUA to avoid subjective classification bias. This aligns with the “Chengdu–Chongqing Urban Agglomeration Territorial Spatial Plan” requirement (“coordination degree ≥ 0.45” as basic synergy), with the interval [0.40, 0.45] established as a mild disorder; inheriting Liao Chongbin’s dynamic threshold mechanism [28], the system achieves adaptive boundary optimization, categorized into eight grades, as detailed in Table 3.
Table 3.
Stage division of CCD.
2.2.4. Spatial Autocorrelation
Spatial autocorrelation is used to determine whether the examined variables are spatially dependent. A common measure of spatial autocorrelation is the Moran index. The global Moran index reflects the spatial clustering of the examination variable in the whole space. The local Moran index reflects the spatial clustering of the study variable in the vicinity of a certain region [29]. The specific formula is as follows:
where is the CCD of three benefits of land use in research unit , is the average value of the CCD of three benefits of land use in the research unit, and is the spatial geographic weight matrix after row normalization. In this paper, after several regressions and tests, this is selected as the more effective geo-economic nested matrix.
2.2.5. Spatial Measurement Models
- (1)
- Construction of Driver Indicator System
This study selects drivers of land-use efficiency from three dimensions: resource endowments, economic activity, and infrastructure. These factors constitute the fundamental dynamics shaping land-use benefits. It should be noted that land-use patterns and their outcomes are fundamentally constrained and guided by institutional factors such as territorial spatial planning and ecological compensation mechanisms. For instance, spatial planning defines the layout and intensity of land development, while compensation mechanisms regulate the distribution of interests between conservation and development. Indicators such as NDVI, nighttime light intensity, and road network density adopted in this study inherently reflect, to a considerable extent, the outcomes of such institutional regulation. However, we acknowledge that the use of composite NDVI may not fully capture intra-annual ecological dynamics, which could influence the estimation of resource-related drivers in seasonally sensitive areas. This data-related limitation and its potential implications are further discussed in the Section 4.4. Due to constraints in the spatial continuity and consistency of directly measured institutional data, these factors were not included as independent variables in the quantitative model. Nevertheless, their potential influence will be qualitatively examined in light of regional policy contexts. The selection of these drivers aligns with established frameworks in land-use change analysis, which emphasize the foundational roles of resource endowment [30], economic activity [31], infrastructure [32], and policy intervention [33]. The selected drivers are presented in Table 4.
Table 4.
Evaluation index system of driving factors related to CCD.
- (2)
- Model Construction and Specification
Spatial econometric models, which formally address the spatial dependence and heterogeneity neglected by traditional ordinary least squares (OLS) regression, provide the appropriate framework for analyzing interconnected regions [34]. In urban agglomerations, where socioeconomic interdependencies are strong, driving factors generate substantial spatial spillovers. Consequently, the CCD of a region is shaped by both local conditions and the influence of neighboring areas. To capture these cross-regional spillovers, this study utilizes the spatial Durbin model (SDM). For comparative analysis, the spatial lag model (SLM) and spatial error model (SEM) are also constructed, enabling a comprehensive exploration of the drivers behind land-use benefit synergies [35].
Spatial lag modeling (SLM), which assumes that there is a strong spatial dependence between the explanatory variables, incorporates a spatial lag term for the explanatory variables in the model:
In the spatial error model (SEM), a spatial lag term of spatial error term is added to the model, due to the presence of other factors that are not taken into account that have an impact on the coupling and harmonization of the three benefits of land use:
The spatial Durbin model (SDM) incorporates both the spatial lag term of the explanatory variables and the spatial lag and spatial error terms of the explanatory variables in the model:
In the formula, and denote the region effect and time effect, respectively, and denotes the spatial autoregressive coefficient. In order to simplify the formula of the spatial Durbin model, denotes all independent variables for adding spatial lag terms. denotes the spatial weight matrix.
3. Results
3.1. Temporal and Spatial Patterns of Economic, Social, and Ecological Benefits from Land Use
The spatial and temporal variations in the economic–social–ecological benefits of land use are illustrated in Figure 3. Based on the spatial and temporal differentiation characteristics of land-use benefits in the CCUA from 2015 to 2023, the economic, social, and ecological benefits show the following differentiated patterns:
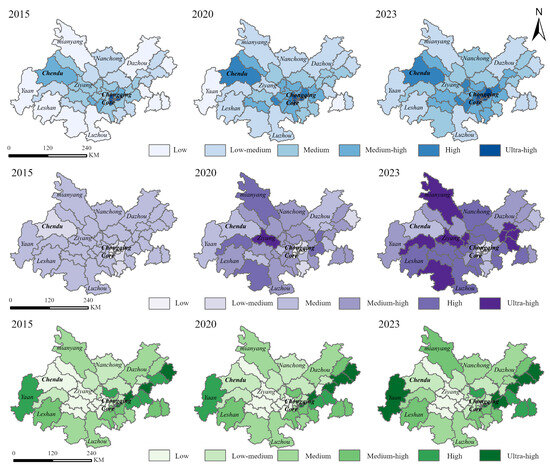
Figure 3.
Spatial and temporal variations in the economic–social–ecological benefits of land use.
- (1)
- Economic Benefits: Uneven Growth and North–South Spatial Polarization
The economic benefits exhibited a “core polarization and peripheral radiation” spatial pattern. In 2015, high-value areas clustered in Chongqing’s main urban areas, while Chengdu constituted a medium–high-value zone, and low-value areas were distributed in the periphery of the CCUA in the form of a ring. By 2023, the economic benefits had significantly improved, forming a dual-core radiation pattern centered on Chengdu and Chongqing’s main urban areas. Medium–high-value zones extended along the Chengdu–Chongqing axis, and low-value zones largely vanished, though localized economic depressions persisted in Sichuan–Chongqing border regions like Ziyang and Suining. Secondary growth poles performed remarkably: Yibin and Mianyang achieved annual growth rates of 17.95% and 16.41%—significantly exceeding Chengdu’s 11.12%—thus validating the “core polarization–edge response” mechanism.
Regionally, Chongqing’s 2023 average economic benefit of 0.21 surpassed Sichuan’s 0.10, with the Jiulongpo and Bishan Districts driving this gap via their 10.84% annual growth. Sichuan exhibited pronounced internal disparities: Ya’an City achieved 28.49% annual growth, whereas Dazhou City reached only 6.26%. In Sichuan–Chongqing border regions such as Neijiang and Luzhou, industrial chain synergies emerged, with growth rates ranging from 6.39% to 9.17%.
- (2)
- Social Benefits: Multi-Center Synergy and Gradient Evolution
Spatio-temporal variations in social benefits exhibited early-stage weak differentiation and late-stage gradient intensification. In 2015, high social benefit values appeared sporadically in the Chengdu Plain and Chongqing’s outer suburbs, such as Deyang (0.62) and Changshou (0.58), while Chongqing’s core urban areas remained low. By 2023, the spatial pattern had evolved into a core-depressed concentric pattern. Main urban areas lagged behind peripheral areas, and Sichuan’s average social value of 0.61 exceeded Chongqing’s 0.57. Notably, Ziyang achieved a 6.28% annual growth in social benefits through rural infrastructure and social security upgrades, rising to a medium–high value of 0.65. In contrast, Chongqing’s core areas lagged in social benefits, with Dadukou at 0.43 and Shapingba at 0.47 trailing significantly behind.
Sichuan–Chongqing border districts, such as Luzhou (0.62) and Jiangjin (0.63), featured convergent social service networks with less than 2% variation, reflecting cross-district policy synergy. Sub-cities in Sichuan such as Mianyang City (0.59) and Deyang City (0.61) achieve stable growth through a balanced allocation of resources, with an average annual growth rate of 2.54–4.12%, while Chongqing’s remote Tongnan District (0.55) relies on the policy overlay to grow at a rate of 7.5%.
- (3)
- Ecological benefits: gradient differentiation and restoration effects
An ecological benefit gradient characterized by high values in peripheral areas and low values in core regions was observed. In 2015, middle-high-value zones were concentrated in Chongqing’s Three Gorges Reservoir Region (TGRR), Wuling Mountains, and Ya’an City. By 2023, the pattern had evolved into a three-tier structure: peripheral native ecological high-value zones, peri-urban artificial restoration medium-value zones, and core regeneration low-value zones. Chongqing’s main urban areas, excluding Jiulongpo and Nanan, grew at 0.38–1.24% annually through ecological facility upgrades; Sichuan’s peripheral cities, such as Chengdu and Mianyang, achieved stable 0.50–0.97% growth through land intensification policies.
Regionally, Chongqing’s 2023 average ecological value of 0.35 surpassed Sichuan’s 0.25, driven by ecological function optimization in the Jiangbei District and peri-urban barrier construction in the Beibei District, with 9.0% growth. Sichuan relied on arable land conservation and eco-agriculture, such as Mianyang City’s growth rate of 0.97%, with emerging ecological synergies in the Luzhou–Qijiang transboundary zone.
3.2. Spatial and Temporal Distribution Pattern of the Coupled Coordination Degree of the Three Benefits of Land Use
According to Figure 4, the coupled coordination degree (CCD) of land-use benefits in the CCUA generally shows an upward trend from 2015 to 2023. Temporally, regional CCD averaged a rapid increase from moderate disorder (0.452) in 2015 to good coordination (0.534) in 2023, with a 12.4% annual growth rate, reflecting the overall optimization of social, economic, and ecological synergy. This improvement stems from core-area polarization effects and peripheral gradient catch-up. Chongqing’s main urban areas, such as Jiangbei District, which achieved CCD growth from good coordination (0.605) to quality coordination (0.805) through industrial upgrades and ecological infrastructure, thereby became regional synergy cores; Chengdu, relying on the radiation effect of the central city, has had its CCD value increase from mild disorder (0.448) to primary coordination (0.536), with a growth rate of 2.4%, driving secondary cities in the Sichuan Basin, such as Mianyang City, which transitioned from mild disorder (0.407) to being on the verge of dysfunctional (0.498). However, in eastern Sichuan’s hilly areas, Dazhou faced transportation bottlenecks, with the 2023 CCD stagnating at moderate disorder (0.476) and a growth rate of only 1.8%, underscoring the intra-regional imbalance.
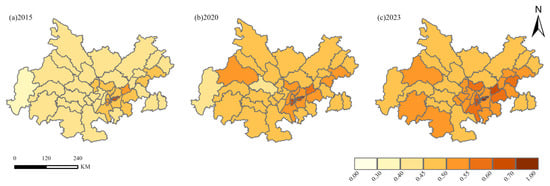
Figure 4.
Spatial and temporal variations in the degree of harmonization of coupled economic–social–ecological benefits of land use.
The pattern of spatial differentiation shows a hierarchical structure of “strong poles in the dual core-radiation in the axis-collapse at the edge”. The average CCD value for Chongqing’s entire region reached 0.556 (intermediate coordination) in 2023, which was significantly higher than Sichuan’s 0.491 (on the verge of dysfunction). This disparity stems from the agglomeration of high-end elements in main urban areas, such as high-quality coordination in the Jiangbei District, and the transformation of peri-urban industries into ecological industries, such as a 17.3% increase in the Changshou District’s CCD. By contrast, Sichuan Province exhibits a polycentric and balanced pattern. The Chengdu Plain Urban Agglomeration, including Deyang and Mianyang, grew at an average annual rate of 2.6–2.9%, with both cities reaching the primary coordination level by 2023. However, eastern Sichuan has long remained in a state that is on the verge of dysfunction, due to geographic isolation and lagging policies. Notably, the difference rate in the Sichuan-Chongqing junction belt is less than 7%, including 0.493 in Luzhou City and 0.566 in Jiangjin District. Cross-domain industrial chain division of labor and ecological corridor co-construction has effectively promoted synergy level convergence, confirming the positive effect of policy linkage.
The evolution of intra-regional differences reveals diverging trajectories. The extreme difference between the main city of Chongqing and the far suburbs widens from 0.177 to 0.287, with increased polarization effects.
3.3. Spatial Autocorrelation Analysis
The global spatial autocorrelation analysis of the coupled coordination degree of land-use benefits in the CCUA is carried out based on the standardized economic and geographic distance nested weight matrix using Moran’s I. The coupled coordination degree of the three benefits of land use in the CCUA shows a significant high spatial agglomeration characteristic from 2015 to 2023, which verifies the long-term spatial dependence. Although the index decreases slightly from 0.475 in 2015 to 0.459 in 2023, the strong agglomeration trend persists in Table 5.
Table 5.
Global Moran index for 2015, 2020, and 2023CCD.
According to Figure 5, hotspots are concentrated in Chongqing’s main city and its suburbs, such as the Nanan and Jiangbei Districts, forming a core cluster, with Nanan District as the regional synergy core. Conversely, cold spots are distributed in the eastern edge of Sichuan, including Dazhou and Guang’an City, the mountainous areas of northeastern Chongqing, and the border areas of CCUA such as Ziyang City and Luzhou City. These areas face topographical and industrial constraints, exhibiting peripheral marginalization. Further analysis reveals temporal variations in spatial agglomeration. In 2015, hotspots were mostly at the 95% confidence level; by 2020, some areas, such as the suburban Jiangjin District, dropped to 90% confidence and became non-significant by 2023. Notably, 99% confidence hotspots, like core zones in the Nanan and Jiangbei Districts, remained stable, suggesting that high agglomeration has concentrated in core areas, while cold spot numbers declined between 2015 and 2023. The number of cold spot zones gradually decreased from two 95% confidence zones and four 90% confidence zones in 2015 to only three 90% confidence zones, such as Dazhou City and Pengshui County in 2023, reflecting that the scope of inefficient agglomeration in the fringe zones has shrunk, though without the intensity, it has not significantly improved.
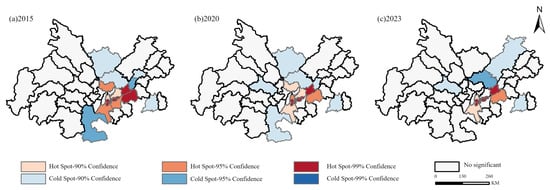
Figure 5.
Spatial pattern of hot spots and clod spots of CCD.
3.4. Land Use Three-Benefit Coupling Harmonization Degree Correlation Analysis with Drivers
As shown in Table 6, the results of general OLS regression and LM test for coupling coordination, respectively, show that the p-value passes the 1% or 5% significance test under both the LM test and the Robust-LM test, which indicates the existence of spatial error effect and spatial lag effect, the rejection of using mixed-panel regression, and the initial selection of the spatial Durbin model.
Table 6.
LM test results.
Hausman was then used to determine the use of the fixed-effects model or random-effects model, according to the test results in Table 7; to reject the original “coefficient of difference is not systematic” hypothesis, the fixed-effects model is used. As shown in Table 7, the results of the LR test and Wald test support the choice of the spatial Durbin model; therefore, this paper chooses the SDM.
Table 7.
Hausman test and Wald test, LR test results.
According to the relevant test results, the spatial measurement regression was carried out using the spatial Durbin model with fixed effects, and the regression results of the SLM and SDM were compared based on the regression using the SDM in this paper, and the regression results of the three models are shown in Table 8.
Table 8.
Estimation results of the spatial panel model.
Comparison of spatial econometric models showed that the within-group goodness-of-fit of the spatial Durbin model (SDM, R2 = 0.939) was significantly higher than that of the spatial lag model (SLM, R2 = 0.247) and the spatial error model (SEM, R2 = 0.755), which indicated that the SDM had a stronger explanatory power in explaining spatial differences in the degree of coordination of land use in the region and the mechanism of the variables’ effects. The spatial autoregressive coefficients of the SDM (ρ = 0.547, p < 0.01), SLM (ρ = 0.918, p < 0.01), and SEM (ρ = 0.956, p < 0.01) were all significant at 1% level, confirming that there is a significant spatial dependence within the study samples, i.e., CCD in a certain region will be significantly affected by neighboring regions’ influence. In addition, the σ2 coefficients of the three models are all close to zero and significant, indicating that the model settings can effectively control the spatial heterogeneity of the error terms and ensure the robustness of the results.
The regression coefficient of the core variable road network density (lnRND) in the SDM is −0.047 (p < 0.01), which is significantly different from the estimates of the SLM (0.013) and SEM (−0.044), indicating that the use of different spatial econometric models will lead to differences in parameter estimation, and ignoring spatial dependence may cause parameter bias. In the framework of the SDM, for every 1% increase in road network density, the coupled coordination of land-use efficiency decreased significantly by 0.047%, with a local effect of −0.047 (p < 0.01), implying that the local road network expansion was significantly negatively correlated with the coordination of land use.
The local effect coefficient of medical resources clustering (lnHBC) in the SDM is 0.029 (p < 0.1), showing that the increase in medical resources in the region has a weak promotion effect on the local land use coordination, but the spatial lag term (Wx = 0.025) was insignificant, and the indirect effect of 0.090 (Table 9) also failed to pass the significance test, suggesting that the cross-region driving effect of medical resources is not obvious. In contrast, the significance of the coefficient of lnHBC in SLM is raised to 0.031 (p < 0.05), which again indicates that there is an influence from the model selection on the estimation of policy effects. Fiscal input for environmental protection (FEPR) showed positive significance in the SLM (β = 0.012, p < 0.05), but the SDM’s direct effect (0.009) and spatial spillover were insignificant, indicating that the effect of FEPR on the degree of land-use harmonization was uncertain under different model settings.
Table 9.
Direct, indirect, and total effects of the variables.
Nighttime light intensity (lnNLI) was negatively associated with land-use coordination (β = −0.016), while normalized vegetation index (lnNDVI) showed a positive effect (β = 0.219). Notably, NDVI’s spatial interaction coefficient (θ= −2.369, p < 0.001) showed that neighboring vegetation cover increases significantly suppressed local coordination. Despite local positive effects, the total effect (−6.063) was insignificant, due to offsetting positive/negative impacts.
Using Stata 18.0 software, the SDM was still used, and the values of direct, indirect, and total effects decomposed by the regression results of the model are specifically given in Table 9.
Spatial econometric regression shows that in infrastructure, the spatial lag coefficient of neighboring road network density (RND) is Wx = −0.103 (p < 0.1), meaning local coordination decreases by 0.103 units on average for each 1% increase in neighboring RND, reflecting “competitive inhibition” in transportation infrastructure. Meanwhile, local RND has a direct effect coefficient of −0.045 (p < 0.01), indicating a 0.045% CCD decline per 1% local RND increase, highlighting core-area transportation expansion’s inhibitory effect on CCD. The total effect coefficient is 0.191 (p > 0.05), suggesting that nonlinear superposition of core siphoning and edge compensatory effects neutralize the overall significance.
For public service allocation, local healthcare resources (HBC) have a direct effect coefficient of 0.031 (p < 0.1), showing a 0.031 unit coordination increase per 1% rise in the number of beds in medical institutions, with public service supply having a marginal positive effect. However, the spatial lagged term of neighboring HBC is not significant (p > 0.1), indicating that the cross-regional spillover effect of healthcare resources is insufficient.
In the dimension of resources and environment, the coefficient of the spatial lag term of the neighboring region’s vegetation cover (NDVI) is Wx = −2.369 (p < 0.01), which indicates that for every unit of the neighboring region’s vegetation cover, the degree of coordination of the local land use will decrease by 2.369 units on average, and this inhibitory effect is highly statistically significant. The total effect coefficient is −6.063 (p > 0.05), indicating that local NDVI gains are offset by neighboring negative spillovers, with no significant overall effect.
In economic activity, neighboring nighttime light intensity (NLI) has a spatial lag coefficient of Wx = −0.043 (p > 0.1), suggesting a potential negative impact from neighboring economic density increases, though local NLI shows no significant model correlation with coordination.
For policy regulation, local financial environmental investment (FEPR) has a direct effect coefficient of 0.011 (p < 0.1), indicating a 0.011 unit local CCD increase per 1% FEPR rise, signaling emerging positive effects from environmental spending. But the spatial lag term of the neighboring region’s FEPR is not significant (p > 0.1), reflecting that cross-regional ecological governance policies have not yet formed effective synergies, and the phenomenon of “neighboring free-riding” is obvious.
4. Discussion
4.1. Synergistic Mechanism of Spatio-Temporal Differentiation and Coupled Coordination Degree of Land Use Ecological–Economic–Social Benefits
Achieving synergistic development among economic, social, and ecological dimensions represents a core challenge in regional sustainability science. Our analysis of the Chengdu–Chongqing Urban Agglomeration (CCUA) reveals that this synergy is not a uniform state but a spatially heterogeneous and dynamically contested process. The observed patterns provide a critical lens to examine how interplay between market forces and institutional arrangements shapes the divergent development pathways within a rapidly growing mega-region.
The multidimensional benefits of land use in the CCUA exhibit significant spatial and temporal differentiation, forming a core-edge gradient pattern with efficiency prioritization in core areas and ecological constraints in edge areas, which aligns with Friedmann’s (1966) “core-edge” theoretical framework [36]. This pattern shares evolutionary logic with other Chinese city clusters but also has unique characteristics. Core areas (Chengdu and Chongqing’s main urban areas) squeeze ecological space via a factor concentration effect (i.e., the siphoning of resources to core regions), creating an imbalance between rapid economic growth and delayed ecological protection, similar to the pattern observed in the core regions of the Yangtze River Delta agglomeration, where economic agglomeration has led to intense ecological pressure [37] and a delayed social response [38]. Unlike Qingdao and Weihai in the Shandong Peninsula, where high environmental protection investment and efficient public services achieve eco-economic synergy [39,40], the CCUA’s marginal areas face dual constraints from arable land protection policies and insufficient ecological compensation, leading to severe spatial mismatches between resource endowments and economic outputs. This reflects that developed regions have entered a phase of central optimization and edge-area development, while the CCUA remains in a polarization–diffusion transition, consistent with general regional development laws.
At the same time, the spatial–temporal differentiation of the social benefits of land use further reveals how land allocation influences the economic–ecological system, exacerbating the economic–ecological conflicts. Core zones’ reliance on land finance has skewed resources toward productive land use, such as industrial, commercial, or residential resources, causing public services to lag behind population growth—a contrast to the Yangtze River Delta cores, with “social sustainability leading but ecological pressure intensifying” [40]. On the other hand, in peripheral areas, land use function conflicts persist; while infrastructure equalization enhances social benefits, resource competition between ecological protection and public services remains. For example, ecological following in the Qinba Mountains improves vegetation cover but may reduce per capita cultivated land or restrict construction land, exemplifying an ecological–social zero-sum dilemma.
This spatial–temporal pattern fundamentally arises from interactions between resource factor flows and institutional barriers, necessitating deeper analysis of multidimensional drivers.
4.2. Influence Mechanism of Multidimensional Driving Factors on the Degree of Coordination of Coupled Ecological–Economic–Social Benefits of Land Use
The mechanism framework of economic–social–ecological synergy in land use is depicted in Figure 6. This study reveals that the coupled coordination of land-use benefits in the CCUA is shaped by interactions among resource environments, economic activities, infrastructure, and policy regulation, with a spatial mechanism characterized by local inhibition and neighboring competition, consistent with its polarization–diffusion transition stage.
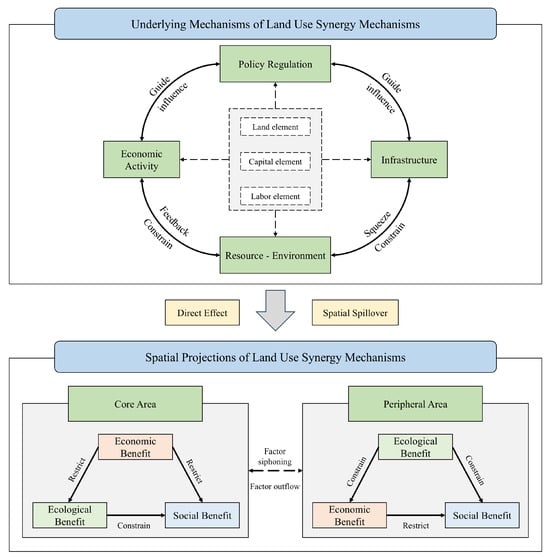
Figure 6.
Mechanism framework of economic–social–ecological synergy in land use.
In infrastructure, road network density exerts a stronger direct than indirect effect on coordination, confirming “polarization effect dominance” law and exacerbating regional imbalance [41]. Core-area transportation agglomeration boosts economic efficiency, but fringe areas face a trade-off between transportation access and ecological fragmentation due to transport-driven radiation effects, aligning with findings on inefficient land urbanization in the Yangtze River Economic Belt’s central-western regions [42]. This contrasts with the Yangtze River Delta study, indicating that the CCUA remains in the polarization phase of Williamson’s inverted U-curve and warrants caution against land fragmentation from excessive transport expansion [40]. Additionally, public service–transport infrastructure interactions amplify the “efficiency–equity” trade-off: healthcare resource agglomeration exhibits weak local effects with no significant spatial spillovers, reflecting how territorialized governance of public services restricts cross-regional benefits.
The resource–environment dimension presents the paradox of local positive effects and negative externalities. While NDVI increases boost local coordination, their spatial lag terms indicate that neighboring ecological protection inhibits development via “ecological red line” constraints and administrative indicator competition, resulting in insignificant total effects. This phenomenon is particularly pronounced in the hilly areas of eastern Sichuan. As noted in existing studies, the region’s topographic fragmentation exacerbates resource competition among neighboring administrative units, with local gains from ecological restoration being offset by cross-domain land-use indicator pressures, thereby creating a rigid conflict between ecological protection and land development [14]. Notably, the CCUA’s core areas achieve factor agglomeration via flat topography, while the peripheral areas’ complex topography hinders eco-benefit synergies, reinforcing core–periphery imbalances. Unlike the CCUA, Beijing–Tianjin–Hebei Plain’s ecological issues stem from the industrial pollution legacy, with lagging control causing direct industrial energy consumption and economic growth conflicts, contrasting sharply with the CCUA [43].
In policy regulation, local fiscal environmental investment (FEPR) has a moderate promoting effect on land-use benefits’ coordination. This effect is primarily achieved via pollution control and ecological restoration funding—for instance, the Qinba Mountains’ carbon sink trading pilot enhanced local vegetation coverage and coordination through financial inputs, aligning with studies showing that financial compensation improves ecological quality by offsetting protection costs [44]. However, the spatial lag term of FEPR in neighboring regions did not reach significance, revealing the lack of cross-regional ecological governance synergy mechanism. Meanwhile, existing studies have shown that the regional imbalance caused by the core–periphery structure of the CCUA is intrinsically related to administrative barriers [45]. Specifically, ecological protection’s positive externalities (e.g., water conservation) are hard to translate into cross-domain compensation under the current policies, disincentivizing peripheral investment and creating ecological protection cost–benefit imbalances between core and fringe areas. This is consistent with the inhibitory effect of neighboring areas’ NDVI enhancement on local coordination in the literature, reflecting local governments’ local prioritization strategies under fiscal decentralization, which hinders cross-domain compensation for marginal ecological protection costs. Economically, NLI exhibits a nonlinear relationship between economic activity density and ecological benefits, where high-density agglomeration intensifies ecological pressures while boosting efficiency.
Collectively, these mechanisms point to a prevailing model of “locally optimized but regionally fragmented” coordination in the CCUA. Positive local effects are often counteracted by negative or neutral spillovers to neighboring areas: a phenomenon exacerbated by administrative boundaries and the lack of mechanisms to reconcile cross-jurisdictional interests. This finding challenges the assumption that infrastructure or environmental investment inherently fosters regional synergy. Instead, it suggests that in transitional regions like the CCUA, the classic Williamson’s inverted-U curve of regional convergence may be stalled not only by economic factors but also by institutional barriers that prevent the transition from polarization to diffusion [45]. Our study thus extends the core–periphery theory by highlighting how ecological policies without compensatory frameworks can inadvertently reinforce spatial competition rather than cooperation.
4.3. Institutional Innovation as a Prerequisite for Synergy
To fundamentally overcome the “locally optimized but regionally fragmented” dilemma, institutional innovations that reshape cross-boundary rules are essential. We propose three institutional pillars: first, a dynamic, performance-based zoning system that integrates ecological, agricultural, and urban boundaries, with explicit transboundary coordination clauses; second, a hybrid ecological compensation mechanism combining government transfers for ecosystem services with a market-based regional platform for trading land-development quotas linked to ecological offsets; and finally, a statutory Cross-Jurisdictional Synergy Council, responsible for coordinating planning, managing a regional development fund, and establishing unified sustainability standards.
These institutional foundations provide the necessary framework for the spatially differentiated land-use strategies outlined below. Core optimization areas focus on internal intensification and decarbonization, mandating green infrastructure in urban renewal and prioritizing land for low-carbon industries through incentives and negative lists. Marginal revitalization areas address the “high ecological value, low economic viability” paradox by strengthening ecological compensation—leveraging funds for horizontal payments and carbon sink trading—and promoting green industry integration through models like “land consolidation + eco-tourism/organic agriculture.” Synergistic transition zones tackle “transportation-driven polarization” and “administrative fragmentation” through ecological connectivity restoration along the Chengdu–Chongqing axis and cross-jurisdictional policy innovations, such as establishing a pilot zone and a synergistic development fund fed by cross-regional revenues.
4.4. Research Limitations and Prospects
First, the time frame of the study does not fully cover the impact cycle of policies such as the 14th Five-Year Plan and, thus, requires long-term tracking to assess their sustained effects. Future studies will expand the time frame to fully assess the policy cycle. Second, this study is subject to limitations in both the indicator system and the underlying data. The current framework lacks key factors that are specific to mountainous regions, limiting its policy relevance for marginalized areas. Additionally, the spatial and temporal resolution of the data (e.g., 30 m land cover and annual composite NDVI) may not fully capture fine-scale land-use mixtures or seasonal ecological dynamics, which could affect the accuracy of local ecological assessments and introduce uncertainty in estimating the effects of resource-based drivers. Future research will incorporate region-specific indicators and refine data sources to enhance regional adaptation and analytical robustness. Third, and more critically, our study underscores a persistent conceptual challenge. While we diagnose institutional barriers as being central to the fragmented coordination pattern, our driver analysis could not fully quantify these complex variables. This limitation points beyond data availability to a gap in prevailing conceptual models. Frameworks like the sustainable development triad are effective for parallel assessment but are less suited to analyzing how institutional architectures actively mediate and often constrain the potential for synergy between the economic, social, and ecological goals across administrative boundaries. Future research should therefore aim not only to better quantify institutional variables but to develop new coupled socioecological–institutional frameworks that can theorize and test how specific governance mechanisms enable or hinder the transition from polarized growth to synergistic regional development.
5. Conclusions
This study yields several key conclusions regarding the coordinated development of land-use benefits in the Chengdu–Chongqing Urban Agglomeration (CCUA). Overall, while the economic, social, and ecological benefits of land use exhibit an overall trend of coupling coordination, their spatial differentiation is pronounced. The core areas of Chongqing and Chengdu demonstrate a distinct imbalance characterized by “economic agglomeration alongside ecological lag.” Conversely, peripheral zones, such as the hilly areas of eastern Sichuan, face a persistent mismatch between “high ecological value and low economic density.” Furthermore, the degree of coupled coordination shows significant spatial agglomeration. Hotspots are concentrated in the main urban area of Chongqing and its adjacent suburbs, whereas cold spots are predominantly distributed in the eastern fringe of Sichuan. A notable inter-provincial disparity exists, with Chongqing exhibiting a polarized pattern and Sichuan a more balanced, polycentric one. This spatial structure, compounded by regional ecological competition and administrative barriers, exacerbates the synergy dilemma of land-use benefits and underscores the urgent need for effective cross-jurisdictional governance mechanisms. In addition, the expansion of the transportation network has reinforced spatial imbalances in land-use efficiency. In core areas, the factor-siphoning effect associated with transport agglomeration intensifies the squeeze on ecological space. In peripheral areas, ecological protection efforts, while locally beneficial, can trigger resource competition with neighboring jurisdictions, highlighting the complex spatial externalities of both development and conservation policies.
This study advances the understanding of land-use synergy in complex urban agglomerations through an integrated framework connecting spatial patterns, processes, mechanisms, and policy. Theoretically, it refines the core–periphery model by identifying a pattern of local optimization alongside regional fragmentation, highlighting the dual role of institutional factors as both enablers and constraints. Methodologically, it demonstrates how spatial econometric modeling combined with coupling coordination analysis can distinguish local effects from spatial spillovers. Practically, it proposes three actionable policy pillars: dynamic performance zoning, a hybrid ecological compensation system, and a cross-jurisdictional governance council, offering a spatially adaptive roadmap for sustainable planning. Future research should extend temporal analysis to capture full policy cycles, incorporate quantified institutional variables into spatial models, and develop coupled socioecological models to simulate long-term synergy under different governance scenarios.
Author Contributions
All authors contributed to the study conception and design. Ideas, methodology, writing—original draft were performed by S.C.; methodology, writing—review and editing, data curation and validation, data collection, analysis and validation were performed by Y.Z. All authors commented on previous versions of the manuscript. All authors have read and agreed to the published version of the manuscript.
Funding
This work was supported by the Key Research Project of the National Foundation of Social Science of China: Community Governance and Post-Relocation Support in Cross District Resettlement [grant numbers 21 and ZD183]; the Fundamental Research Funds for the Central Universities: Research On The Mechanism And Policy Response of Climate Migration Under Climate Change Risks [grant number: B240207112]; and the Fundamental Research Funds for the Central Universities: Study on the Coordinated Development of Sustainable Livelihood and Ecological Protection of Relocated Farmers (grant number: B240207032).
Data Availability Statement
All data included in this study are available upon request by contacting the corresponding author.
Conflicts of Interest
The authors declare no conflicts of interest.
References
- Liang, H.M.; Liu, W.D.; Liu, H.P.; Ling, Y.; Liu, Y. Coupling Relationship between Socio-economy Benefits and Eco-environment Benefits of Land Use in Shenzhen City. Sci. Geogr. Sin. 2008, 28, 636–641. [Google Scholar]
- Wang, S.; Ma, H.; Zhao, Y. Exploring the relationship between urbanization and the eco-environment-A case study of Beijing-Tianjin-Hebei region. Ecol. Indic. 2014, 45, 171–183. [Google Scholar] [CrossRef]
- Tang, F.; Wang, L.; Guo, Y.; Fu, M.; Huang, N.; Duan, W.; Luo, M.; Zhang, J.; Li, W.; Song, W. Spatio-temporal variation and coupling coordination relationship between urbanization and habitat quality in the Grand Canal, China. Land Use Policy 2022, 117, 106119. [Google Scholar] [CrossRef]
- Liao, S.; Wu, Y.; Wong, S.W.; Shen, L. Provincial perspective analysis on the coordination between urbanization growth and resource environment carrying capacity (RECC) in China. Sci. Total Environ. 2020, 730, 138964. [Google Scholar] [CrossRef]
- Lei, K.; Zhang, H.; Qiu, H.; Liu, Y.; Wang, J.; Hu, X.; Cui, Z.; Zheng, D. A two-dimensional four-quadrant assessment method to explore the spatiotemporal coupling and coordination relationship of human activities and ecological environment. J. Environ. Manag. 2024, 370, 122362. [Google Scholar] [CrossRef] [PubMed]
- Zhang, X.; Jie, X.; Ning, S.; Wang, K.; Li, X. Coupling and coordinated development of urban land use economic efficiency and green manufacturing systems in the Chengdu–Chongqing urban agglomeration. Sustain. Cities Soc. 2022, 85, 104012. [Google Scholar] [CrossRef]
- Lei, X.; Liu, H.; Li, S.; Luo, Q.; Cheng, S.; Hu, G.; Wang, X.; Bai, W. Coupling coordination analysis of urbanization and ecological environment in Chengdu-Chongqing urban agglomeration. Ecol. Indic. 2024, 161, 111969. [Google Scholar] [CrossRef]
- Lei, Y.; Xiao, Y.; Wang, F.; Wang, R.; Huang, H. Investigation on the complex relationship between urbanization and eco-efficiency in urban agglomeration of China: The case study of Chengdu- Chongqing urban agglomeration. Ecol. Indic. 2024, 159, 111704. [Google Scholar] [CrossRef]
- Li, W.; Kang, J.; Wang, Y. Spatiotemporal changes and driving forces of ecological security in the Chengdu–Chongqing urban agglomeration, China: Quantification using health- services-risk framework. J. Clean. Prod. 2023, 389, 136135. [Google Scholar] [CrossRef]
- Xu, W.; Jin, J.; Zhang, J.; Yuan, S.; Liu, Y.; Guan, T.; He, R.; Zhu, L. Coupling coordination degree, interaction relationship and driving mechanism of water resources carrying capacity of Beijing-Tianjin-Hebei urban agglomeration in China. J. Clean. Prod. 2025, 504, 145433. [Google Scholar] [CrossRef]
- Zhao, J.; Zhao, Y. Synergy/trade-offs and differential optimization of production, living, and ecological functions in the Yangtze River economic Belt, China. Ecol. Indic. 2023, 147, 109925. [Google Scholar] [CrossRef]
- Yin, Z.; Liu, Y.; Tang, L.; Zhou, W.; Pan, Y. Spatial-temporal evolution of agricultural land utilization benefits and tradeoffs/synergies in the Beijing-Tianjin-Hebei region. Ecol. Indic. 2023, 156, 111110. [Google Scholar] [CrossRef]
- Wang, Z.; Hasi, E. Research on the development of deserticulture and desertification land use benefits evaluation in ordos city. Land 2023, 12, 1254. [Google Scholar] [CrossRef]
- Zhang, W.; Shi, P.; Tong, H. Research on construction land use benefit and the coupling coordination relationship based on a three-dimensional frame model-A case study in the Lanzhou-Xining urban agglomeration. Land 2022, 11, 460. [Google Scholar] [CrossRef]
- Ji, X.; Wang, K.; Ji, T.; Zhang, Y.; Wang, K. Coupling analysis of urban land use benefits: A case study of Xiamen city. Land 2020, 9, 155. [Google Scholar] [CrossRef]
- Li, D.; Fan, K.; Lu, J.; Wu, S.; Xie, X. Research on spatio-temporal pattern evolution and the coupling coordination relationship of land-use benefit from a low-carbon perspective: A case study of Fujian province. Land 2022, 11, 1498. [Google Scholar] [CrossRef]
- Wu, Q.; Cao, Y.; Fang, X.; Wang, J.; Li, G. A systematic coupling analysis framework and multi-stage interaction mechanism between urban land use efficiency and ecological carrying capacity. Sci. Total Environ. 2022, 853, 158444. [Google Scholar] [CrossRef]
- Su, X.; Fan, Y.; Wen, C. Systematic coupling and multistage interactive response of the urban land use efficiency and ecological environment quality. Environ. Manag. 2024, 365, 121584. [Google Scholar] [CrossRef] [PubMed]
- Zhang, K.; Jin, Y.; Li, D.; Wang, S.; Liu, W. Spatiotemporal variation and evolutionary analysis of the coupling coordination between urban social-economic development and ecological environments in the Yangtze River Delta cities. Sustain. Cities Soc. 2024, 111, 105561. [Google Scholar] [CrossRef]
- Liu, J.; Tian, Y.; Huang, K.; Yi, T. Spatial-temporal differentiation of the coupling coordinated development of regional energy-economy-ecology system: A case study of the Yangtze River Economic Belt. Ecol. Indic. 2021, 124, 107394. [Google Scholar] [CrossRef]
- Luo, L.; Wang, Y.; Liu, Y.; Zhang, X.; Fang, X. Where is the pathway to sustainable urban development? Coupling coordination evaluation and configuration analysis between low-carbon development and eco-environment: A case study of the Yellow River Basin, China. Ecol. Indic. 2022, 144, 109473. [Google Scholar] [CrossRef]
- Yao, Z.; Tu, J.; Niu, H.; Ha, L.; Li, J. The research on urban agglomeration spatial structure of Cheng-Yu economic zone. Econ. Geogr. 2017, 37, 82–89. [Google Scholar] [CrossRef]
- He, L.; Du, X.; Zhao, J.; Chen, H. Exploring the coupling coordination relationship of water resources, socio-economy and eco-environment in China. Sci. Total Environ. 2024, 918, 170705. [Google Scholar] [CrossRef] [PubMed]
- Cheng, G.; Li, G.; Pu, X.; Chen, C.; He, Y. Advancing coupling coordination simulation in the social-human-ecological system of the Three Gorges Reservoir Area: A multi-scenario system dynamics approach. Ecol. Indic. 2024, 158, 111504. [Google Scholar] [CrossRef]
- Brundtland, G.H. Our Common Future World Commission on Environment and Development; Harambee University: Adama, Ethiopia, 1987. [Google Scholar]
- Xie, X.J. Coupling coordination relationship and spatio-temporal evolution characteristics of land use benefits in Sichuan Province based on entropy weight TOPSIS and coupling coordination model. J. Soil Water Conserv. 2023, 38, 267–277. [Google Scholar] [CrossRef]
- Berkes, F.; Kislalioglu, M.; Folke, C.; Gadgil, M. Minireviews: Exploring the basic ecological unit: Ecosystem-like concepts in traditional societies. Ecosystems 1998, 1, 409–415. [Google Scholar] [CrossRef]
- Liao, Z.B. Quantitative evaluation and classification system for the coordinated development of environment and economy: A case study of the urban agglomeration in the Pearl River Delta. Trop. Geogr. 1999, 19, 171–177. [Google Scholar]
- Liu, N.; Liu, C.; Xia, Y.; Da, B. Examining the coordination between urbanization and eco-environment using coupling and spatial analyses: A case study in China. Ecol. Indic. 2018, 93, 1163–1175. [Google Scholar] [CrossRef]
- Zhang, Q.; Ye, B.; Shen, X.; Zhu, Y.; Su, B.; Yin, Q.; Zhou, S. Coupling coordination evaluation of ecology and economy and development optimization at town-scale. J. Clean. Prod. 2024, 447, 141581. [Google Scholar] [CrossRef]
- Pan, H.; Du, Z.; Wu, Z.; Zhang, H.; Ma, K. Assessing the coupling coordination dynamics between land use intensity and ecosystem services in Shanxi’s coalfields, China. Ecol. Indic. 2024, 158, 111321. [Google Scholar] [CrossRef]
- Wu, T.; Qiao, Z. Synergistic governance of urban heat islands, energy consumption, carbon emissions, and air pollution in China: Evidence from a Spatial Durbin Model. Environ. Pollut. 2025, 372, 126025. [Google Scholar] [CrossRef]
- Wu, R.; Liu, Q.; Wang, H. Spatial spillover effects of ecosystem service values in northeast China tiger and leopard national park based on spatial Durbin model. Ecol. Indic. 2024, 166, 112509. [Google Scholar] [CrossRef]
- Anselin, L. Spatial Econometrics: Methods and Models; Springer Science & Business Media: Berlin/Heidelberg, Germany, 1988; Volume 4. [Google Scholar]
- Luge, W.; Tianjiao, Z.; Tiyan, S. Spatial-temporal evolution and influencing factors of urban land use structure efficiency: Evidence from 282 cities in China. J. Clean. Prod. 2025, 500, 145275. [Google Scholar] [CrossRef]
- Friedmann, J. Regional Development Policy: A Case Study of Venezuela; MIT Press: Cambridge, MA, USA, 1966. [Google Scholar]
- Ding, T.; Chen, J.; Fang, Z.; Chen, J. Assessment of coordinative relationship between comprehensive ecosystem service and urbanization: A case study of Yangtze River Delta urban Agglomerations, China. Ecol. Indic. 2021, 133, 108454. [Google Scholar] [CrossRef]
- Dong, L.; Liang, L.; Wang, Z.; Chen, L.; Zhang, F. Exploration of coupling effects in the Economy-Society-Environment system in urban areas: Case study of the Yangtze River Delta Urban Agglomeration. Ecol. Indic. 2021, 128, 107858. [Google Scholar] [CrossRef]
- Chen, H.; Liu, L.; Wang, L.; Zhang, X.; Du, Y.; Liu, J. Key indicators of high-quality urbanization affecting eco-environmental quality in emerging urban agglomerations: Accounting for the importance of variation and spatiotemporal heterogeneity. J. Clean. Prod. 2022, 376, 134087. [Google Scholar] [CrossRef]
- Yin, H.; Xiao, R.; Fei, X.; Zhang, Z.; Gao, Z.; Wan, Y.; Tan, W.; Jiang, X.; Cao, W.; Guo, Y. Analyzing “economy-society-environment” sustainability from the perspective of urban spatial structure: A case study of the Yangtze River delta urban agglomeration. Sustain. Cities Soc. 2023, 96, 104691. [Google Scholar] [CrossRef]
- Krugman, P. Increasing returns and economic geography. J. Political Econ. 1991, 99, 483–499. [Google Scholar] [CrossRef]
- Liu, Y.; Yang, R.; Sun, M.; Zhang, L.; Li, X.; Meng, L.; Wang, Y.; Liu, Q. Regional sustainable development strategy based on the coordination between ecology and economy: A case study of Sichuan Province, China. Ecol. Indic. 2022, 134, 108445. [Google Scholar] [CrossRef]
- Li, X.; Lu, Z.; Hou, Y.; Zhao, G.; Zhang, L. The coupling coordination degree between urbanization and air environment in the Beijing (Jing)-Tianjin (Jin)-Hebei (Ji) urban agglomeration. Ecol. Indic. 2022, 137, 108787. [Google Scholar] [CrossRef]
- Cao, H.; Li, M.; Qin, F.; Xu, Y.; Zhang, L.; Zhang, Z. Economic development, fiscal ecological compensation, and ecological environment quality. Int. J. Environ. Res. Public Health 2022, 19, 4725. [Google Scholar] [CrossRef] [PubMed]
- Tu, D.; Cai, Y.; Liu, M. Coupling coordination analysis and spatiotemporal heterogeneity between ecosystem services and new-type urbanization: A case study of the Yangtze River Economic Belt in China. Ecol. Indic. 2023, 154, 110535. [Google Scholar] [CrossRef]
Disclaimer/Publisher’s Note: The statements, opinions and data contained in all publications are solely those of the individual author(s) and contributor(s) and not of MDPI and/or the editor(s). MDPI and/or the editor(s) disclaim responsibility for any injury to people or property resulting from any ideas, methods, instructions or products referred to in the content. |
© 2025 by the authors. Licensee MDPI, Basel, Switzerland. This article is an open access article distributed under the terms and conditions of the Creative Commons Attribution (CC BY) license (https://creativecommons.org/licenses/by/4.0/).