Abstract
The popularity of peri-urban landscapes (PULs) around the world has made them an important part of shaping urban landscapes and promoting sustainable urban development. This study aims to propose sustainable planning guidelines for PULs by analyzing the quantitative evolution of the type, morphology and structure of PULs in Zhengzhou. The methods employed in this study include the Land Cross Transfer Matrix, Morphological Spatial Pattern Analysis, and Landscape Metrics. The results show that agricultural landscapes and artificial landscapes dominate in PULs, and there is an obvious trend of transformation from agricultural PULs to artificial PULs. PULs presents the characteristics mainly in the form of large patches of cores, belt-shaped corridors, and blocks. In terms of structure, PULs show a trenddominated by the fragmentation of natural and semi-natural landscapes. The patch shapes of PULs become more complex and their heterogeneity increases. Based on the evolution trends of PULs, guidelines for planning adapted to local conditions were proposed. This study not only provides a methodological framework for the quantitative evolution analysis of PULs, but also offers insights for the optimization and management of PULs in other regions.
1. Introduction
Global urbanization has led to the accelerated expansion of many urban areas. As a by-product of urbanization, peri-urban landscapes (PULs) have also emerged in an increasing number of regions [1], becoming a distinctive lens through which the dynamic processes of urban evolution can be observed. PULs are dynamic mixtures of natural and artificial land cover, as well as land use associated with green spaces, farmland, and artificially developed areas with varying degrees of urbanization [2,3]. The collision of urban and rural landscapes has shaped unique PULs, highlighting the coupled and harmonious relationship between human activities and natural habitats within a limited space.
According to the Sustainable Development Goal 11: ‘Sustainable Cities and Communities’ [4], PULs, as an increasingly prevalent landscape type in cities, should undoubtedly incorporate sustainability as a fundamental objective in planning. Moreover, many scientists believe that enhancing sustainability is the primary goal of landscape and regional planning, including planning for the conservation, protection, and rational use of land and natural resources [5]. However, in reality, the sustainability of PULs around the world has been continuously declining, primarily due to the widespread threat of natural landscapes being transformed into artificial ones, running counter to the Sustainable Development Goals [6,7,8].
In fact, PULs contribute to the sustainability of the entire urban area and provide regenerative potential for urban systems. Typically, PULs provide a range of resources including natural resources, food production, and urban water supply to contribute to urban sustainability and resilience [9]. However, urbanization has had a strong impact on the sustainability of PULs. Potapov, Hansen [10] analyzed global land cover changes and found that between 2000 and 2020, the built-up area increased by 50%. Urbanization demands an increasing supply of residential, commercial, and transportation infrastructure [11]. This often results in the occupation of natural areas to meet these needs [12,13], leading to the loss of natural PULs [3] and a reduction in ecosystem services [14]. The expansion of transportation infrastructure further fragments ecosystems, creating challenges for landscape restoration and biodiversity conservation [15]. Moreover, new infrastructure facilitates the spread of low-density buildings, which is a typical feature of urban sprawl.
It is precisely the provisioning capacity of PULs for urban areas, together with their increasingly degraded condition, that has made them a focal point in recent research on urban sustainability. For example, Spyra, Cortinovis [7] collected governance cases of PULs from 26 countries and concluded that a diverse set of policy instruments is required to address the dynamic and complex nature of PUL governance. For individual PUL case studies, approaches based on remote sensing data combined with Geographic Information System for spatial pattern analysis are commonly employed [16]. For instance, Salem and Tsurusaki [17] quantified the landscape changes of PULs amid chaotic urban expansion in the Greater Cairo region using Landscape Metrics. Ortiz-Báez, Freire [18] calculated a Land Cross Transfer Matrix based on Land Use/Land Cover data to analyze the evolution of the composition of PULs in Quito.
However, most studies have not explicitly delineated the boundaries between PULs and urban landscapes. Instead, they tend to discuss them as a whole or define PULs simply based on administrative boundaries. Such approaches undoubtedly weaken the distinctiveness of PULs as landscapes differentiated from urban or rural environments, and they also reduce the specificity and feasibility of planning strategies targeted at PULs. Therefore, quantitative analyses of PULs within clearly defined spatial boundaries still represent an academic gap. In addition, Shi, Liu [16] noted that while PULs share certain common characteristics across regions, they also exhibit distinct local features. These regional differences make it difficult to establish a unified planning framework capable of addressing issues in diverse contexts. Therefore, more diverse case studies and targeted planning strategies need to be proposed and synthesized.
Based on the above background, this study aims to clarify the evolutionary characteristics of PULs that distinguish them from urban landscapes in terms of type, morphology, and structure, and to use these insights as a basis for proposing context-specific sustainable planning strategies for PULs. The methods adopted in the process of analyzing PULs in the case study, such as the Land Cross Transfer Matrix, Morphological Spatial Pattern Analysis, and Landscape Metrics, obtain quantitative results to guide planning and also provide insights for related studies. According to these research objectives, we have raised the following research questions:
What are the dominant landscape types in PULs and what are their evolving trends?
Do the four types of PULs exhibit morphological differences, and how do these differences influence the evolution of PULs?
How do the structures of PULs vary? How do they differ from urban landscapes?
What sustainable planning guidelines can be proposed based on the evolution characteristics of PULs?
2. Materials and Methods
2.1. Study Area
Zhengzhou City is an important central city in the central region of China, covering an area of approximately 7565 km2. It consists of six districts, five county-level cities and one county, presenting a spatial pattern of polycentric development [19]. The terrain in the southwest of Zhengzhou is higher, mainly consisting of mountains and hills, while the northeastern part is mostly low-lying plains (Figure 1).
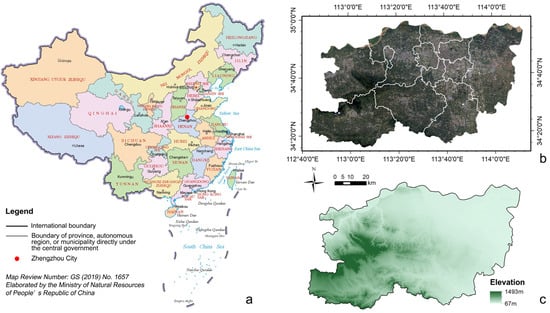
Figure 1.
Location and administrative boundaries of the study area: (a) location of Zhengzhou City in China, (b) administrative boundaries and satellite image of Zhengzhou City in 2020. (c) Topographic map of Zhengzhou City.
During the period from 2000 to 2020, the permanent resident population of Zhengzhou City increased from 6.66 million to 12.62 million, and the urbanization rate also rose from 55.1% to 78.4% [20]. In addition, Zhengzhou City is also a representative of emerging megacities. The peri-urbanization phenomenon of emerging megacities is often at a distinctive stage, which provides favorable conditions for the analysis of PULs [21].
2.2. Data and Processing
To delineate the precise spatial extent of PULs, four datasets were employed: the Global 30 m Impervious Surface Dynamic Dataset [22], the global NPP-VIIRS-like nighttime light data [23], China’s multi-period land use land cover remote sensing monitoring dataset [24], and the WorldPop population data [25]. These datasets were used as input for a Multilayer Perceptron model to delineate the PULs of Zhengzhou for the years 2000, 2010, and 2020. Data processing and computations were conducted following the methodology of Shi, Liu [26].
In this study, representative urban, peri-urban, and rural samples were selected within the study area based on remote sensing imagery in Google Earth Pro, with a total of 500 samples for each year. The data values associated with these samples were used as input to train, validate, and test the model. Through this process, a hidden layer with 66 neurons was constructed, employing the ReLU activation function. The Softmax function was subsequently used as the activation function for the output layer. Training was terminated when the global error reached 0.001, which served as the convergence criterion. After all model parameters were determined, all data within the study area were input to complete the classification of PULs, urban landscapes, and rural landscapes.
Then we classified the PULs based on the land use land cover data. This dataset contains six types of land: agricultural land; forest land; grassland; water body; built-up land; unused land (which is not present within the PULs). We further integrated the forest land and grassland, and eventually obtained four types of PULs: agricultural PULs (agricultural land), green PULs (forest land and grassland), water PULs (water body), and artificial PULs (built-up land).
2.3. Land Cross Transfer Metrics
Land Cross Transition Matrix enables the analysis of category transitions at different spatial scales to identify factors influencing land use changes [27]. Taking the 2020 PUL spatial extent as the standard, and using PUL data of 2000 and 2020, we calculated the Land Cross Transition Matrix, thereby summarizing the transfer trends of various PULs in this spatial range from 2000 to 2020.
2.4. Morphological Spatial Pattern Analysis
Morphological Spatial Pattern Analysis is used to detect the morphological characteristics of images and classify them into seven morphological types: Core, Islet, Loop, Bridge, Perforation, Edge, and Branch [28] (Figure 2). Before conducting this analysis, it is necessary to reclassify the PULs in ArcGIS 10.8.1. The analyzed landscape types are reclassified as the foreground, while other landscape types are reclassified as the background. The reclassified image is then imported into the Guidos Toolbox, where the eight-neighborhood analysis method is selected. The edge width is set to a maximum value of 10. The transition parameter is set to 1 to emphasize the role of linear elements as connectors, thereby highlighting bridging areas rather than patch edges [29]. The intext parameter is set to 0, ensuring no distinction between the interior and exterior of the landscape types. Once these settings are applied, the analysis is executed to obtain the final classification results.
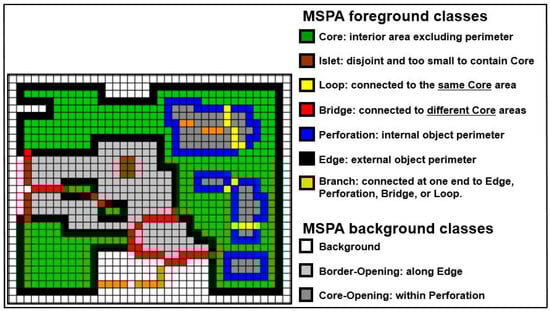
Figure 2.
Classification of landscape types in Morphological Spatial Pattern Analysis (MSPA) and their corresponding definitions. Source: European Commission, Joint Research Centre (JRC). Available online: https://forest.jrc.ec.europa.eu/en/activities/lpa/mspa/ (accessed on 15 November 2025).
2.5. Landscape Metrics
Landscape Metrics are tools used to describe the geometric and spatial characteristics of patches or patch mosaics at a specific point in time. They provide information about the composition of the mosaic, as well as the shape of the landscape elements. Therefore, Landscape Metrics allow for the measurement of the spatial and temporal arrangement of landscape elements [30]. In particular, Landscape Metrics used to assess urban growth provide a range of values that reflect different growth patterns [31,32]. When these metrics are used in combination, they form a comprehensive framework for understanding the complexity of the structure and composition of landscapes undergoing urban expansion [17,33]. For example, Landscape Metrics have been widely applied to analyze the impact of urban growth on the fragmentation of peri-urban farmland [34,35].
Currently, more than one hundred Landscape Metrics exist. Many of these metrics are often highly correlated and can be easily confused. Therefore, when selecting metrics, their relative independence should be considered. In previous studies, methods such as principal component analysis and correlation matrices have been commonly used to filter Landscape Metrics [36]. Building on these studies, we primarily reference the work of Leitao and Ahern [30]. In their study, landscape structure is described as comprising two fundamental components: Composition and Configuration. Based on this structure, a set of fundamental metrics suitable for sustainable planning was proposed.
Composition is a non-spatially explicit characteristic. It does not measure or reflect the geometric shape, geographic location, or spatial arrangement of patches but instead quantifies landscape attributes [36]. The Composition metrics we selected include Percentage of Landscape (PLAND), Patch Density (PD), Mean Patch Area (AREA_MN), and Shannon’s Diversity Index (SHDI) (Table A1).
In contrast, Configuration metrics measure spatial characteristics [5]. The Configuration metrics we selected include Mean Perimeter-Area Ratio (PARA_MN), Total Edge Contrast Index (TECI) (with edge contrast values for different landscape types set as shown in Table 1), and Contagion (CONTAG) (Table A1).

Table 1.
Edge contrast settings for different landscape types.
These Landscape Metrics were calculated using the Fragstats v4.2.1. The analysis of landscape-level and class-level metrics in Fragstats v4.2.1 provides a strong conceptual and theoretical foundation for understanding landscape structure and change [37]. The selected Landscape Metrics were computed at both the landscape and class levels. Subsequently, these metrics were analyzed across spatial and temporal dimensions to identify the structural evolution of PULs.
3. Results
3.1. Evolution of PUL Types
After delineating the precise spatial extent of the PULs (Figure A1), the area of each PUL types in the three years was calculated to analyze its changing trends. Among all PUL types, agricultural PULs and artificial PULs accounted for the largest proportions. In both 2000 and 2010, agricultural PULs was the dominant land type. However, by 2020, the area of artificial PULs surpassed that of agricultural PULs, becoming the most prevalent type. In contrast, green and water PULs occupied relatively small proportions. The area of green PULs showed a slight decline followed by an increase during the study period, while water PULs exhibited a steadily increasing trend (Figure 3).
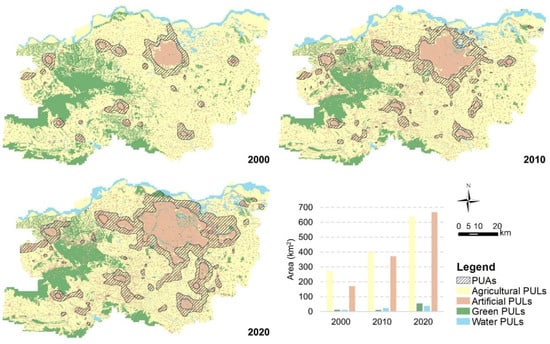
Figure 3.
Distribution maps and area bar chart of PULs.
The Land Cross Transition Matrix reveals a large-scale conversion of agricultural PULs into artificial PULs, reflecting the encroachment of urban expansion on rural areas (Table 2). Additionally, parts of green PULs and water PULs were absorbed by urban expansion, while a small portion of these landscapes was converted into agricultural PULs. Although artificial PULs exhibited an overall expansion, some areas were reclaimed for agriculture or underwent greening. Overall, agricultural and artificial PULs experienced the most significant changes during the peri-urbanization process, whereas green and water PULs exhibited relatively minor changes.
Table 2.
Land Cross Transition Matrix from 2000 to 2020.
3.2. Morphological Spatial Pattern of PULs
Through Morphological Spatial Pattern Analysis, the morphological evolution characteristics of PULs were analyzed. In terms of agricultural PULs, the Core has consistently been the dominant morphological type, with its area continuously increasing. However, the proportion of the Core has been steadily declining (from 59% to 43%), particularly during the period from 2000 to 2010. The overall area and individual patch size of the Bridge and Loop, which exhibit corridor-like properties, remain relatively small but show an increasing trend. As a linear and terminal structure, the Branch has also exhibited stable growth over time. The Islet and Perforation account for the smallest areas in the agricultural PULs. In 2000, the Islet had the smallest area, but by 2020, its area had increased to some extent. Overall, the morphological spatial pattern of agricultural PULs has shown a transition from the Core to more linear and fragmented structures (Figure 4).
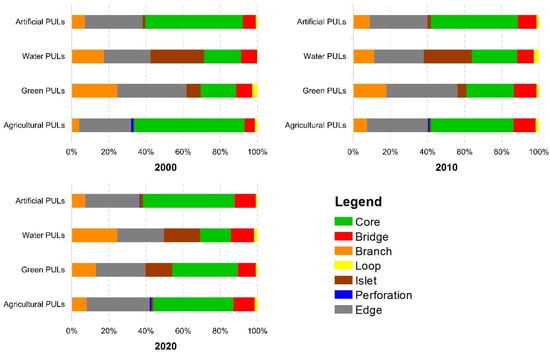
Figure 4.
Proportion of morphological types of PULs.
In artificial PULs, the Core remains the dominant category. Among the corridor-like categories, the area of the Bridge has consistently been larger than that of the Loop. The Bridge exhibits a distinct linear structure and increasingly aligns with roads over time, whereas the Loop shows a less pronounced linear pattern. The Branch is relatively evenly distributed across PULs. The Perforation has maintained the smallest area among all categories across the three years. Overall, the area proportions of different morphological types within the artificial PULs have remained relatively stable, with the Bridge showing a notable increase (Figure 4).
In green PULs, the area proportions of seven morphological types have gradually become more balanced. The area of the Core experienced minimal growth from 2000 to 2010 but expanded several times from 2010 to 2020, making it the dominant category in green PULs by 2020. In 2000, the Branch accounted for a relatively large proportion, but its area proportion steadily declined in the following years (from 24% to 13%). The area proportions of the Bridge, Loop, and Islet remained small, with the Bridge and Islet experiencing significant growth between 2010 and 2020 (Figure 4).
In water PULs, the morphological types also exhibit a relatively balanced distribution, with an overall dominance of linear forms. The area proportion of the Core is not particularly prominent, although it shows an increasing trend. The dominant type in water PULs shifted from the Islet to the Branch: The Islet decreased from 28% to 19%, whereas the Branch increased from 17% to 24%, with significant growth from 2010 to 2020. The Bridge and Loop have the smallest area proportions but show an increasing trend over time (Figure 4).
To explore the differences in morphology between PULs and other landscapes, we also analyzed the urban landscapes as a comparison. The results indicate clear morphological differences between the two types of regions. Urban areas are dominated by artificial landscapes, characterized by highly concentrated morphological structures in which the Core predominates. In contrast, although the Core also accounts for the largest proportion in PULs, the other morphological categories occupy a substantially higher share than in urban landscapes, reflecting a more balanced and dispersed morphological structure (Figure 5).
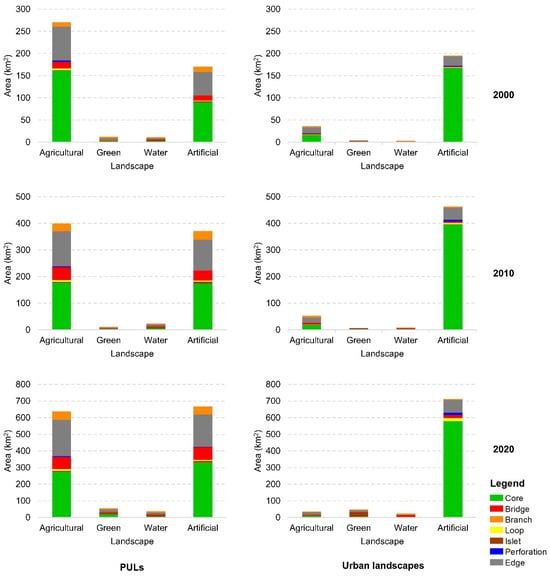
Figure 5.
Comparison of the area of seven morphological types in PULs and urban landscapes.
Across individual landscape categories, the morphological composition of most PULs is also more balanced than that of urban landscapes (Figure 5). Specifically, agricultural urban landscapes are dominated by the Core, with their area proportion declining from 44% to 26% between 2000 and 2020. In green urban landscapes, morphology is relatively homogeneous, with the Islet form being dominant, accounting for an average of approximately 54%.
In water urban landscapes, the dominant forms include the Islet, Bridge, and Branch. From 2000 to 2020, the proportion of the Islet decreased from 46% to 14%, while the Bridge increased from 4% to 34%, and the Branch remained relatively stable at around 28%.
In artificial urban landscapes, the Core areas consistently accounted for more than 80%, resulting in only minor proportions and limited temporal changes in other morphological forms. In contrast, artificial PULs exhibited a lower mean Core proportion (approximately 49%), while other morphological categories occupied a larger share than in urban landscapes; for example, the Bridge increased from 6% to 11%.
3.3. Structure of PULs
3.3.1. Composition Metrics
In Composition metrics, PLAND is a class-level metric, SHDI belongs to landscape-level metrics, while PD and AREA_MN belong to both class-level metrics and landscape-level metrics. Figure 6 presents the calculation results of class-level metrics in the PULs. Table 3 shows the calculation results for landscape-level metrics.
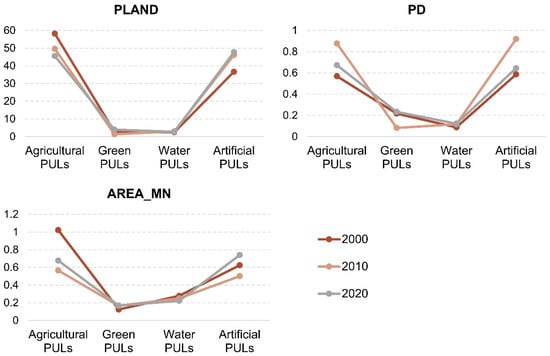
Figure 6.
Class-level Composition metrics in PULs.
Table 3.
Landscape-level Composition metrics in PULs and urban landscapes.
PLAND represents the proportion of each landscape type. Agricultural and artificial PULs dominate over the other two types. The PLAND of agricultural PULs exhibits a decreasing trend year by year, while that of artificial PULs steadily increases, leading to a shift in the dominant PUL type from agricultural to artificial. As for green PULs, PLAND shows a slight decline followed by an increase, whereas the PLAND of water PULs remains relatively stable with minimal variation (Figure 6).
PD and AREA_MN reflect the degree of landscape fragmentation. At the landscape level, PD exhibited a trend of initial increase followed by a decrease from 2000 to 2020 (Table 3). During the period from 2000 to 2010, the overall increase in PD was primarily driven by the rising PD of agricultural and artificial PULs, despite a significant decline in the PD of green PULs. Conversely, from 2010 to 2020, the decrease in PD for agricultural and artificial PULs contributed to the overall decline in PD, while the green PULs continued to exhibit an opposite trend (Figure 6).
At the landscape level, AREA_MN exhibited a trend opposite to that of PD, showing an overall decline (Table 3). From 2000 to 2010, the increase in PD alongside the decrease in AREA_MN indicates that landscape fragmentation intensified during this period. However, from 2010 to 2020, the rise in AREA_MN and the decline in PD suggest a slowdown in the fragmentation process. At the class level, the AREA_MN of agricultural PULs was the largest in both 2000 and 2010, but by 2020, it was surpassed by artificial PULs. Both agricultural and artificial PULs experienced an initial decrease followed by an increase in AREA_MN between 2000 and 2020. Overall, the AREA_MN of agricultural PULs declined, whereas that of artificial PULs increased. Meanwhile, the AREA_MN of green PULs showed a slight upward trend, whereas that of water PULs exhibited a slight decrease (Figure 6).
SHDI reflects the PUL diversity. As shown in Table 3, SHDI slightly decreased between 2000 and 2010 but increased during the period from 2010 to 2020. The overall trend of SHDI during the study period indicates an increase, suggesting that PUL types have become more diverse. This phenomenon aligns with previous studies that have concluded that land use in PULs is characterized by a complex mix.
From 2000 to 2020, the PD of urban landscapes exhibited a continuous increase, while the AREA_MN consistently declined. These changes indicate a clear trend of fragmentation in urban landscapes, a trend that became more pronounced during the 2010–2020 period. In contrast, PULs demonstrated a trend toward reduced fragmentation over the same period (Table 3). At the class level, notable changes included an increase in PD for green urban landscapes and an increase in AREA_MN for artificial urban landscapes, both of which occurred primarily between 2010 and 2020 (Figure 7). The SHDI for urban landscapes was significantly lower than that of PULs, indicating lower landscape diversity (Table 3). Combined with the PLAND, the dominance of artificial urban landscapes suggests that most urban areas are characterized by a homogeneous landscape structure dominated by artificial landscapes (Figure 7).
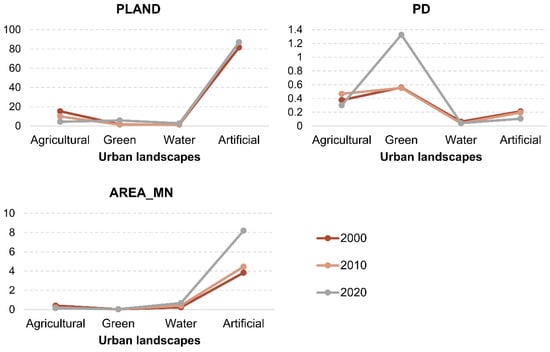
Figure 7.
Class-level Composition metrics in urban landscapes.
3.3.2. Configuration Metrics
Among the Configuration metrics, only CONTAG is a landscape-level metric, while the other metrics apply to both class and landscape levels. The CONTAG of PULs experienced a slight decline from 2000 to 2020, indicating a decrease in the relative aggregation of different PUL types (Table 4). This suggests that landscape types became more dispersed, and individual patches became increasingly fragmented. Furthermore, this process also reflects an increase in the heterogeneity of PULs.
Table 4.
Landscape-level Configuration metrics in PULs and urban landscapes.
PARA_MN measures the complexity of patch shapes. At the landscape level, PARA_MN in PULs followed a trend of initial increase followed by a decrease, reaching its highest value in 2010. This highest value indicates that patch shapes were the most irregular, with more complex boundaries that might have been more susceptible to external disturbances. In contrast, the lowest PARA_MN value was observed in 2000, suggesting that patch shapes were overall more regular (Table 4). At the class level, the PARA_MN of agricultural PULs exhibited a trend consistent with the landscape-level pattern, showing an overall tendency toward more regular patch shapes. Meanwhile, green PULs exhibited a trend completely opposite to that at the landscape level. Both water and artificial PULs displayed a steadily increasing PARA_MN trend, indicating that patch shapes in these landscapes became increasingly complex. Among them, water PULs showed the most significant increase, with the highest PARA_MN values recorded in 2010 and 2020 (Figure 8).
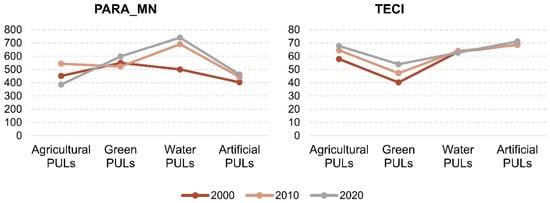
Figure 8.
Class-level Configuration metrics in PULs.
TECI exhibited an increasing trend at the landscape level, indicating a growing number of high-contrast boundaries in PULs, such as those between green and artificial PULs (Table 4). This phenomenon suggests an increase in landscape heterogeneity. Landscapes with high TECI values typically feature more complex ecological interactions but are also more susceptible to human disturbances. At the class level, TECI highlights the contrast intensity at the boundaries between a specific landscape type and other landscapes. The most significant TECI changes occurred in agricultural and green PULs, both of which showed a clear increasing trend. Since agricultural and green PULs have the highest boundary contrast with artificial PULs in this study, this trend reflects an expansion of their contact areas. Meanwhile, the TECI of artificial PULs remained the highest among all landscape types throughout the study period, with no significant temporal variation (Figure 8).
There are some similarities between urban landscapes and PULs. For instance, the TECI values and growth trends of both urban and PULs are quite similar, with increased landscape heterogeneity observed in both (Table 4). However, at the class level, water landscapes exhibit different characteristics. While the TECI of water PULs showed little significant change over time, water urban landscapes exhibited a trend of initial increase followed by a decrease, reflecting the process of hardening and ecological restoration (Figure 9). During the early stages of urban development, most riverbanks within urban areas were transformed into impermeable surfaces to provide space for urban expansion. In 2013, Zhengzhou was approved as a national pilot city for water ecological civilization construction, beginning the development of ecological parks along several water systems within the city. This initiative led to the restoration of most hardened riverbanks to green riverbanks, promoting greater integration between water and green landscapes and reducing the contrast at the boundaries.
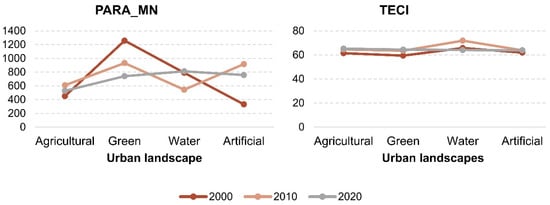
Figure 9.
Class-level Configuration metrics in urban landscapes.
In other Configuration metrics, PULs exhibit characteristics that are quite different from urban landscapes. For instance, compared to PULs, urban landscapes generally have higher PARA_MN values, meaning that the patch shapes in urban landscapes are more irregular than those in PULs. Over time, the PARA_MN of urban landscapes has decreased year by year (Table 4), primarily driven by the increasing regularity of green urban landscapes due to human influence (Figure 9). Green urban landscapes are most likely parks, ecological corridors, and other areas that are actively planned and managed by humans, which is why they tend to have more regular boundaries.
4. Discussion
4.1. Morphology and Function of PULs
In urban planning, the relationship between morphology and function is often closely interlinked. Their interaction also shapes the spatial structure and living environment of PULs. On one hand, morphology influences the realization of functions, while on the other hand, functions also drive the formation of morphology.
- (1)
- Morphology influences Function
The spatial morphology of PULs plays a critical role in shaping the functional performance of PULs. In terms of ecological functions, the morphological classifications derived from the Morphological Spatial Pattern Analysis exhibit considerable alignment with established theories in landscape ecology. For example, the Core corresponds to the Source-Sink Theory. In the spatial morphology of this study area, the Core is the most important morphological type. Both agricultural and artificial PULs dominate this category, occupying an overwhelming proportion. From the perspective of landscape ecology, the Core of agricultural PULs serves as a primary source for various ecological processes in PULs, such as biodiversity conservation [38] and food supply [39]. In general, the Core in artificial PULs tends to play a sink role, often relying on external resource inputs or ecological support.
The Bridge and Loop correspond to the concept of Corridors in Landscape Ecological Patterns. Corridors play a crucial role in landscape ecology by facilitating the movement of species and the flow of ecological processes. The Islet and Branch overlap with the concept of Stepping Stones in Landscape Ecological Patterns. In this context, Stepping Stones provide critical temporary habitats for species migration or dispersion during ecological processes. By incorporating these concepts into the results of the Morphological Spatial Pattern Analysis, it is evident that Corridors are most pronounced in agricultural and artificial PULs. Stepping stones are primarily found in artificial, agricultural, and water PULs. Generally, artificial PULs tend to have lower ecological quality, which limits the ecological functions they can provide. Corridors and Stepping Stones within artificial PULs can enhance their ecological functions through measures such as increasing the amount of artificial green space and improving vegetation diversity.
- (2)
- Function drives Morphology
The functional demands of PULs directly influence their spatial morphology. In Zhengzhou, the morphological evolution of PULs corresponds to the process of urban areas radiating outward and rural areas experiencing bottom-up revitalization. Clearly, PULs have absorbed a considerable portion of the functions of urban areas, resulting in the significant accumulation of artificial PULs. This accumulation manifests in Core patches, such as industrial parks and university towns, which also drive the development of surrounding infrastructure, including roads. PULs are strongly functionally dependent on urban areas, and as such, their morphological composition is primarily characterized by ring-shaped patterns surrounding urban areas and belt-shaped patterns connecting different urban areas. These morphologies facilitate the maintenance of connectivity with urban centers. Simultaneously, during this process, the Core areas of natural or semi-natural landscapes gradually degrade, and Corridors are interrupted. Joniak-Lüthi [40] analyzed the spatial transformations induced by the expansion of road infrastructure in northwest China, arguing that contemporary urban and peri-urban spaces are characterized by uneven and dispersed morphological patterns. In addition, the bottom-up industrial revitalization in rural areas generates a demand for the aggregation of artificial PULs, leading to the formation of block-shaped PULs.
4.2. Fragmentation Phenomenon of PULs
In this study, the use of Landscape Metrics quantitatively presents the fragmentation of natural and semi-natural PULs. Landscape fragmentation affects both ecosystems and human activities [41]. It not only increases the number of patches but also increases the total length of edges associated with these patches. The increase in total edge length is common in PULs [42,43], often associated with anthropogenic modifications such as road and infrastructure development, residential expansion, and other human-driven activities [1].
Therefore, many studies have emphasized the landscape fragmentation caused by urban expansion [17]. Magidi and Ahmed [44] indicated that the degree of landscape fragmentation in Tshwane, South Africa, was positively correlated with urban sprawl. Similarly, research by Fenta, Yasuda [45] and Abedini and Khalili [46] conducted in the cities of Mekelle in Ethiopia and Urmia in Iran also reached similar conclusions. In this study, the fragmentation phenomenon in PULs was more pronounced during the 2000–2010 period, whereas the fragmentation rate significantly slowed down during the 2010–2020 period. This phenomenon can, to some extent, reflect the development intensity in PULs transitioning from rapid to slow. In contrast, the fragmentation of urban landscapes intensified during the 2010–2020 period, which may be associated with the implementation of urban renewal policies in Zhengzhou, particularly the introduction of pocket park initiatives. This is supported by the marked increase in PD observed in green urban landscapes during this period.
The fragmentation of agricultural PULs during urban expansion has been particularly significant and has attracted increasing attention in recent years [47,48,49]. Many cases describe the development of urban land at the cost of agricultural land and the resulting landscape fragmentation [50]. The urban expansion process not only reduces the area of agricultural land but also aggravates the fragmentation of agricultural PULs [34]. In China, the implementation of the strictest farmland protection policies in the 1990s has been shown to have a positive impact on the protection of farmland areas [49,51]. However, with the acceleration of urbanization and the implementation of policies such as returning farmland to forests, agricultural PULs has still faced significant loss. In China, the per capita agricultural land area is only 0.09 hectares, significantly lower than the global average [52]. Moreover, high-quality farmland constitutes the majority of the agricultural land lost to urban expansion, leading to a decline in overall farmland quality [53,54,55]. In response, China proposed the Permanent Basic Farmland policy to further strengthen protection efforts. The rational planning and protection of agricultural PULs remains a critical issue that requires continued attention in the future.
4.3. Sustainable Planning Guidelines for PULs
For the evolutionary characteristics of PULs in Zhengzhou, we have proposed targeted planning guidelines at the regional level.
- (a)
- Conducting spatial and land monitoring to predict future development.
The quantitative identification and spatiotemporal evolution analysis of PULs in this study offer methodological support for government-led spatial monitoring of PULs. By tracking the spatial evolution trends of PULs, it is possible to anticipate the direction of urban development and intervene in advance, guiding urbanization and peri-urbanization toward an efficient and sustainable trajectory while curbing disorderly urban sprawl.
Land use change is one of the most significant transformations within PULs. In many countries, monitoring land use is even a mandatory and priority goal in policies [56,57,58]. In recent years, China has advanced the construction of a Territorial Spatial Planning System, emphasizing dynamic monitoring and refined management. The Farmland Protection Redline Policy ensures that the area of basic farmland does not decrease. These initiatives provide policy support for land monitoring in PULs in Zhengzhou. National strategies such as Smart Cities and Digital Villages also offer technical and financial support for land monitoring in PULs. By monitoring current conditions, the loss of agricultural PULs can be mitigated, and future land-use conflicts in PULs can be predicted in a timely manner, enabling early intervention and resolution.
- (b)
- Maintaining the morphological diversity of PULs.
Given that the morphological diversity of PULs is greater than that of urban landscapes, efforts should be made to preserve this characteristic. Landscape diversity not only contributes to the healthy functioning of ecosystems but also enhances their resilience to environmental changes, supporting biodiversity conservation. From a human perspective, a diverse landscape creates a more attractive living environment, improving quality of life while also providing valuable opportunities for environmental education, research, tourism, and recreation. Therefore, landscape planning and ecological conservation should fully consider the integration of different landscape forms to achieve both ecological and social benefits. By coordinating natural landscape conservation planning with infrastructure planning, the morphological coexistence of natural, semi-natural, and artificial PULs can be ensured. For example, in 2013 Zhengzhou proposed and implemented the construction of an ecological corridor network along two ring roads and thirty-one radial roads. This policy integrates artificial landscapes with green landscapes, achieving the coordinated development of multiple landscape types. In the future, approaches such as establishing country parks or urban farms could be considered to protect and utilize other forms of natural and semi-natural PULs, thereby enhancing morphological diversity.
- (c)
- Enhancing the connectivity of natural and semi-natural landscapes.
In planning, highly fragmented natural and semi-natural PULs can be integrated through land consolidation policies, merging small landscape patches into larger, more continuous units. Additionally, forecasting the impact of unregulated artificial landscape expansion on the overall heterogeneity and connectivity of PULs can help guide timely adjustments in development strategies. To reshape the structure of natural and semi-natural landscapes and improve network systems, green space planning and wetland conservation planning should be incorporated. In the case of Zhengzhou, a regional ecological pattern can be constructed with agricultural landscapes as the background, featuring river corridors led by the Yellow River, green cores dominated by Mount Song, and wetlands and green nodes. Strengthening the connectivity among these landscape elements is expected to enhance overall landscape connectivity and ecological functionality.
5. Conclusions
This study has quantified the evolution of PULs in Zhengzhou through a series of analyses, and has also identified the differences between PULs and urban landscapes. After counting the areas of various PULs, we found that agricultural PULs and artificial PULs are the main landscapes. By calculating the Land Cross Transfer Matrix, we found that the changing trend of PULs is mainly the transformation from agricultural PULs to artificial PULs, and this trend is consistent with the conclusions of most other study areas. For PULs, not only are there differences in morphological evolution among different categories within them, but there are also some differences between them and urban landscapes. The morphology of PULs affects regional functions. Meanwhile, the functional demands for PULs directly influence its morphology. We selected the corresponding Landscape Metrics in the aspects of Composition and Configuration to quantify the structures of PULs. It was found that in PULs, there exists the phenomenon of fragmentation of natural and semi-natural landscapes and aggregation of artificial landscapes, which has similarities and differences with the urban landscape structure. In particular, the evolution of PULs in Zhengzhou City over the two decades from 2000 to 2020 showed some differences. For instance, during the period from 2000 to 2010, agricultural PULs dominated, and the degree of landscape fragmentation increased while diversity decreased. From 2010 to 2020, artificial landscapes gradually took the dominant position, and the green landscape also increased significantly. The fragmentation degree of PULs decreased while diversity increased. These temporal differences reflect the influence of urbanization intensity and the sustainability ideals. Based on these research results, we have proposed PUL planning guidelines tailored to local conditions.
This research on the quantitative evolution of PULs not only contributes to the rational planning and management of PULs, but also provides methodological support in controlling the disorderly urban sprawl, strengthening urban–rural integration, and promoting sustainable planning. However, some limitations are also worth stating. Firstly, the regional differences of PULs make it impossible to fully reflect the evolution characteristics of PULs in different contexts through a single case analysis. Therefore, the scope of application of the proposed planning guidelines is also limited. Moreover, the planning guidelines proposed at the regional scale are relatively general and further detailed research is needed when guiding practical implementation. Additionally, this study did not discuss the differences in morphology and structural evolution among natural landscapes, semi-natural landscapes and artificial landscapes in PULs. In future research, attempts can be made to make more classifications of PULs. Not only can the classification and analysis be considered in terms of land types, but also in terms of human participation, so as to further clarify the influencing factors of PUL evolution.
Author Contributions
Conceptualization, Z.S. and K.F.K.; methodology, Z.S. and X.Z.; software, Z.S. and X.Z.; formal analysis, Z.S.; resources, Z.S.; data curation, Z.S.; writing—original draft preparation, Z.S.; writing—review and editing, Z.S. and K.F.K.; visualization, Z.S.; supervision, K.F.K. All authors have read and agreed to the published version of the manuscript.
Funding
Z.S. and X.Z. were supported by the China Scholarship Council and the Stipendium Hungaricum Programme. The APC was funded by the Hungarian University of Agriculture and Life Sciences.
Data Availability Statement
The raw data supporting the conclusions of this article will be made available by the authors on request.
Conflicts of Interest
The authors declare no conflicts of interest.
Abbreviations
The following abbreviations are used in this manuscript:
| PULs | Peri-urban landscapes |
| PIAND | Percentage of Landscape |
| PD | Patch Density |
| AREA_MN | Mean Patch Area |
| SHDI | Shannon’s Diversity Index |
| PARA_MN | Mean Perimeter-Area Ratio |
| TECI | Total Edge Contrast Index |
| CONTAG | Contagion |
Appendix A
Table A1.
Landscape structure and Landscape Metrics.
Table A1.
Landscape structure and Landscape Metrics.
| Landscape Structure | Landscape Metrics | Annotation |
|---|---|---|
| Composition | Percentage of Landscape (PLAND) | PLAND measures the proportion of each category within a landscape. In PULs, changes in PLAND reveal shifts in landscape patterns by indicating the distribution and prevalence of land expansion. |
| Shannon’s Diversity Index (SHDI) | SHDI measures the diversity of landscape types. A higher value indicates a richer variety of different land cover types in the landscape, signifying greater landscape diversity. | |
| Patch Density (PD) | PD measures the spatial distribution of patches in the landscape. It represents the number of patches per unit area and reflects the degree of landscape fragmentation and heterogeneity. | |
| Mean Patch Area (AREA_MN) | AREA_MN measures the average patch size of a particular patch type. If the AREA_MN is small, it indicates that the landscape is fragmented. | |
| Configuration | Mean Perimeter-Area Ratio (PARA_MN) | PARA_MN measures the shape complexity of patches. A higher value suggests that the patches are irregular in shape with more complex boundaries. |
| Total Edge Contrast Index (TECI) | TECI reflects landscape heterogeneity and edge-effect intensity by measuring boundary contrast between patch types; higher values indicate stronger contrast and more pronounced edge effects. | |
| Contagion (CONTAG) | CONTAG measures the aggregation of patch types at the landscape scale; higher values indicate more clustered patches and a relatively intact landscape. |

Figure A1.
Spatial Extent of PULs and Corresponding Remote Sensing Imagery in 2000, 2010, and 2020.
References
- Lebrasseur, R. From green fingers and green ring to green mitten: Helsinki’s polycentric urbanization and its impact on green structure. Environ. Dev. Sustain. 2025, 22, 16717–16738. [Google Scholar] [CrossRef]
- Amirinejad, G.; Donehue, P.; Baker, D. Ambiguity at the peri-urban interface in Australia. Land Use Policy 2018, 78, 472–480. [Google Scholar] [CrossRef]
- Spyra, M.; Kleemann, J.; Calò, N.C.; Schürmann, A.; Fürst, C. Protection of peri-urban open spaces at the level of regional policy-making: Examples from six European regions. Land Use Policy 2021, 107, 105480. [Google Scholar] [CrossRef]
- Colglazier, W. Sustainable development agenda: 2030. Science 2015, 349, 1048–1050. [Google Scholar] [CrossRef]
- Forman, R.T. Land Mosaics: The Ecology of Landscapes and Regions; Cambridge University Press: Cambridge, UK, 1995; p. 652. [Google Scholar]
- Ronchi, S.; Pontarollo, N.; Serpieri, C. Clustering the built form at LAU2 level for addressing sustainable policies: Insights from the Belgium case study. Land Use Policy 2021, 109, 105642. [Google Scholar] [CrossRef]
- Spyra, M.; Cortinovis, C.; Ronchi, S. An overview of policy instruments for sustainable peri-urban landscapes: Towards governance mixes. Cities 2025, 156, 14. [Google Scholar] [CrossRef]
- Jabareen, Y.R. Sustainable urban forms: Their typologies, models, and concepts. J. Plan. Educ. Res. 2006, 26, 38–52. [Google Scholar] [CrossRef]
- Butt, A. Sustainable, resilient, regenerative? The potential of Melbourne’s peri-urban region. Front. Sustain. Cities 2024, 6, 8. [Google Scholar] [CrossRef]
- Potapov, P.; Hansen, M.C.; Pickens, A.; Hernandez-Serna, A.; Tyukavina, A.; Turubanova, S.; Zalles, V.; Li, X.; Khan, A.; Stolle, F. The global 2000–2020 land cover and land use change dataset derived from the Landsat archive: First results. Front. Remote Sens. 2022, 3, 856903. [Google Scholar] [CrossRef]
- Kudas, D.; Wnęk, A.; Tátošová, L. Land use mix in functional urban areas of selected central European Countries from 2006 to 2012. Int. J. Environ. Res. Public Health 2022, 19, 15233. [Google Scholar] [CrossRef]
- European Commission. Guidelines on Best Practice to Limit, Mitigate or Compensate Soil Sealing; European Commission: Brussels, Belgium, 2012. [Google Scholar]
- Gardi, C.; Panagos, P.; Van Liedekerke, M.; Bosco, C.; De Brogniez, D. Land take and food security: Assessment of land take on the agricultural production in Europe. J. Environ. Plan. Manag. 2015, 58, 898–912. [Google Scholar] [CrossRef]
- Rozas-Vásquez, D.; Spyra, M.; Jorquera, F.; Molina, S.; Caló, N.C. Ecosystem services supply from peri-urban landscapes and their contribution to the sustainable development goals: A global perspective. Land 2022, 11, 2006. [Google Scholar] [CrossRef]
- Crossman, N.D.; Bryan, B.A.; Ostendorf, B.; Collins, S. Systematic landscape restoration in the rural-urban fringe: Meeting conservation planning and policy goals. Biodivers. Conserv. 2007, 16, 3781–3802. [Google Scholar] [CrossRef]
- Shi, Z.; Liu, M.; Tian, G.; Kovács, K.F. Web of science-based literature review of peri-urban areas: A comparison between Europe and China. Eur. J. Remote Sens. 2024, 57, 2414475. [Google Scholar] [CrossRef]
- Salem, M.; Tsurusaki, N. Impacts of Rapid Urban Expansion on Peri-Urban Landscapes in the Global South: Insights from Landscape Metrics in Greater Cairo. Sustainability 2024, 16, 2316. [Google Scholar] [CrossRef]
- Ortiz-Báez, P.; Freire, M.J.; Bogaert, J. Analysis of peri-urban landscape composition and its spatio-temporal transformations: The case of the metropolitan district of Quito. J. Arch. Urban 2023, 47, 1–11. [Google Scholar] [CrossRef]
- Mu, B.; Mayer, A.L.; He, R.; Tian, G. Land use dynamics and policy implications in Central China: A case study of Zhengzhou. Cities 2016, 58, 39–49. [Google Scholar] [CrossRef]
- Zhengzhou Bureau of Statistics; Zhengzhou Survey Team of the National Bureau of Statistics of China 2021. Zhengzhou Statistical Yearbook 2021; China Statistics Press: Beijing, China, 2021; p. 23. [Google Scholar]
- Aguilar, A.G.; Ward, P.M.; Smith, C., Sr. Globalization, regional development, and mega-city expansion in Latin America: Analyzing Mexico City’s peri-urban hinterland. Cities 2003, 20, 3–21. [Google Scholar] [CrossRef]
- Zhang, X.; Liu, L.; Zhao, T.; Gao, Y.; Chen, X.; Mi, J. GISD30: Global 30-m impervious-surface dynamic dataset from 1985 to 2020 using time-series Landsat imagery on the Google Earth Engine platform. Earth Syst. Sci. Data Discuss. 2022, 14, 1831–1856. [Google Scholar] [CrossRef]
- Chen, Z.; Yu, B.; Yang, C.; Zhou, Y.; Yao, S.; Qian, X.; Wang, C.; Wu, B.; Wu, J. An extended time series (2000–2018) of global NPP-VIIRS-like nighttime light data from a cross-sensor calibration. Earth Syst. Sci. Data 2021, 13, 889–906. [Google Scholar] [CrossRef]
- Xu, X.; Liu, J.; Zhang, S.; Li, R.; Yan, C.; Wu, S. China’s Multi-Period Land Use Land Cover Remote Sensing Monitoring Data Set (CNLUCC); Resource and Environment Science Data Platform: Beijing, China, 2018; Available online: http://www.resdc.cn/DOI (accessed on 8 September 2024).
- WorldPop; Center for International Earth Science Information Network (CIESIN); Columbia University. The Spatial Distribution of Population in 2000, 2010, 2020 with Country Total Adjusted to Match the Corresponding UNPD Es-Timate, China. WorldPop (School of Geography and Environmental Science UoSDoGaG, University of Louisville; Departement de Geographie, Universite de Namur) and Center for International Earth Science Information Network (CIESIN), Columbia University. 2018. Available online: www.worldpop.org (accessed on 8 September 2024).
- Shi, Z.; Liu, M.; Wang, Y.; Kovács, K.F. Comparative study of quantitative identification methods for peri-urban areas based on a multi-indicator system. Sci. Rep. 2024, 14, 29516. [Google Scholar] [CrossRef]
- Mamun, M.M.A.; Nijhuis, S.; Newton, C. Sustainable Urban Planning Challenges in the Peri-Urban Landscape: Evaluating LULC Dynamics and the Policy Effectiveness of the Chattogram Metropolitan Region, Bangladesh. Land 2024, 13, 1157. [Google Scholar] [CrossRef]
- Soille, P.; Vogt, P. Morphological segmentation of binary patterns. Pattern Recognit. Lett. 2009, 30, 456–459. [Google Scholar] [CrossRef]
- Valeri, S.; Zavattero, L.; Capotorti, G. Ecological connectivity in agricultural green infrastructure: Suggested criteria for fine scale assessment and planning. Land 2021, 10, 807. [Google Scholar] [CrossRef]
- Leitao, A.B.; Ahern, J. Applying landscape ecological concepts and metrics in sustainable landscape planning. Landsc. Urban Plan. 2002, 59, 65–93. [Google Scholar] [CrossRef]
- Cervelli, E.; Pindozzi, S. The historical transformation of peri-urban land use patterns, via landscape GIS-Based analysis and landscape metrics, in the Vesuvius area. Appl. Sci. 2022, 12, 2442. [Google Scholar] [CrossRef]
- Kaminski, A.; Bauer, D.M.; Bell, K.P.; Loftin, C.S.; Nelson, E.J. Using landscape metrics to characterize towns along an urban-rural gradient. Landsc. Ecol. 2021, 36, 2937–2956. [Google Scholar] [CrossRef]
- Akın, A.; Erdoğan, M.A. Analysing temporal and spatial urban sprawl change of Bursa city using landscape metrics and remote sensing. Model. Earth Syst. Environ. 2020, 6, 1331–1343. [Google Scholar] [CrossRef]
- Yu, D.; Wang, D.; Li, W.; Liu, S.; Zhu, Y.; Wu, W.; Zhou, Y. Decreased landscape ecological security of peri-urban cultivated land following rapid urbanization: An impediment to sustainable agriculture. Sustainability 2018, 10, 394. [Google Scholar] [CrossRef]
- Zhou, Y.; Chen, T.; Feng, Z.; Wu, K. Identifying the contradiction between the cultivated land fragmentation and the construction land expansion from the perspective of urban-rural differences. Ecol. Inf. 2022, 71, 101826. [Google Scholar] [CrossRef]
- McGarigal, K. FRAGSTATS: Spatial Pattern Analysis Program for Quantifying Landscape Structure; US Department of Agriculture, Forest Service, Pacific Northwest Research Station: Portland, OR, USA, 1995; p. 351. [Google Scholar]
- Singh, S.K.; Pandey, A.C.; Singh, D. Land use fragmentation analysis using remote sensing and Fragstats. In Remote Sensing Applications in Environmental Research; Srivastava, P., Mukherjee, S., Gupta, M., Islam, T., Eds.; Springer: Cham, Switzerland, 2014; pp. 151–176. [Google Scholar]
- Li, P.; Lyu, F.; Zhou, Y.; Yu, Z. Assessing whether peri-urban agricultural land or plantation forest is a better green infrastructure for ground arthropods at local and landscape scales. Ecol. Indic. 2024, 158, 111499. [Google Scholar] [CrossRef]
- Rolf, W.; Diehl, K.; Zasada, I.; Wiggering, H. Integrating farmland in urban green infrastructure planning. An evidence synthesis for informed policymaking. Land Use Policy 2020, 99, 104823. [Google Scholar] [CrossRef]
- Joniak-Lüthi, A. Roads in China’s Borderlands: Interfaces of spatial representations, perceptions, practices, and knowledges. Mod. Asian Stud. 2016, 50, 118–140. [Google Scholar] [CrossRef]
- Zambrano, L.; Aronson, M.F.; Fernandez, T. The consequences of landscape fragmentation on socio-ecological patterns in a rapidly developing urban area: A case study of the National Autonomous University of Mexico. Front. Environ. Sci. 2019, 7, 152. [Google Scholar] [CrossRef]
- Hardt, E.; Pereira-Silva, E.F.; Dos Santos, R.F.; Tamashiro, J.Y.; Ragazzi, S.; Lins, D.B.d.S. The influence of natural and anthropogenic landscapes on edge effects. Landsc. Urban Plan. 2013, 120, 59–69. [Google Scholar] [CrossRef]
- Recanatesi, F. Variations in land-use/land-cover changes (LULCCs) in a peri-urban Mediterranean nature reserve: The estate of Castelporziano (Central Italy). Rend. Lincei 2015, 26, 517–526. [Google Scholar] [CrossRef]
- Magidi, J.; Ahmed, F. Assessing urban sprawl using remote sensing and landscape metrics: A case study of City of Tshwane, South Africa (1984–2015). Egypt. J. Remote Sens. Space Sci. 2019, 22, 335–346. [Google Scholar] [CrossRef]
- Fenta, A.A.; Yasuda, H.; Haregeweyn, N.; Belay, A.S.; Hadush, Z.; Gebremedhin, M.A.; Mekonnen, G. The dynamics of urban expansion and land use/land cover changes using remote sensing and spatial metrics: The case of Mekelle City of northern Ethiopia. Int. J. Remote Sens. 2017, 38, 4107–4129. [Google Scholar] [CrossRef]
- Abedini, A.; Khalili, A. Determining the capacity infill development in growing metropolitans: A case study of Urmia city. J. Urban Manag. 2019, 8, 316–327. [Google Scholar] [CrossRef]
- Cheng, L.; Xia, N.; Jiang, P.; Zhong, L.; Pian, Y.; Duan, Y.; Huang, Q.; Li, M. Analysis of farmland fragmentation in China Modernization Demonstration Zone since “Reform and Openness”: A case study of South Jiangsu Province. Sci. Rep. 2015, 5, 11797. [Google Scholar] [CrossRef]
- Pribadi, D.O.; Pauleit, S. The dynamics of peri-urban agriculture during rapid urbanization of Jabodetabek Metropolitan Area. Land Use Policy 2015, 48, 13–24. [Google Scholar] [CrossRef]
- Zheng, S.; Mao, Y.; Li, Z.; Wu, J.; Tian, Y.; Wu, G.; Qiu, Q.; Sun, R.; Li, W.; Wu, B. Evidence on the exposure Index’s substitution effect in assessing brook pollution risk in urban–rural fringe. Ecol. Indic. 2024, 160, 111910. [Google Scholar] [CrossRef]
- Bartels, L.E.; Bruns, A.; Simon, D. Towards situated analyses of uneven peri-urbanisation: An (Urban) Political Ecology perspective. Antipode 2020, 52, 1237–1258. [Google Scholar] [CrossRef]
- Huang, Z.; Du, X.; Castillo, C.S.Z. How does urbanization affect farmland protection? Evidence from China. Resour. Conserv. Recycl. 2019, 145, 139–147. [Google Scholar] [CrossRef]
- Food and Agriculture Organization (FAO). World Food and Agriculture—Statistical Yearbook 2022; Food and Agriculture Organization (FAO): Rome, Italy, 2022. [Google Scholar]
- Hu, Y.; Kong, X.; Zheng, J.; Sun, J.; Wang, L.; Min, M. Urban expansion and farmland loss in Beijing during 1980–2015. Sustainability 2018, 10, 3927. [Google Scholar] [CrossRef]
- Song, W.; Pijanowski, B.C.; Tayyebi, A. Urban expansion and its consumption of high-quality farmland in Beijing, China. Ecol. Indic. 2015, 54, 60–70. [Google Scholar] [CrossRef]
- Wu, Y.; Shan, L.; Guo, Z.; Peng, Y. Cultivated land protection policies in China facing 2030: Dynamic balance system versus basic farmland zoning. Habitat. Int. 2017, 69, 126–138. [Google Scholar] [CrossRef]
- Cegielska, K.; Kukulska-Koziel, A.; Hernik, J. Green Neighbourhood Sustainability Index—A measure of the balance between anthropogenic pressure and ecological relevance. Ecol. Indic. 2024, 160, 15. [Google Scholar] [CrossRef]
- Noszczyk, T. Land use change monitoring as a task of local government administration in Poland. J. Ecol. Eng. 2018, 19, 170–176. [Google Scholar] [CrossRef]
- Sapena, M.; Ruiz, L.Á. Analysis of land use/land cover spatio-temporal metrics and population dynamics for urban growth characterization. Comput. Environ. Urban Syst. 2019, 73, 27–39. [Google Scholar] [CrossRef]
Disclaimer/Publisher’s Note: The statements, opinions and data contained in all publications are solely those of the individual author(s) and contributor(s) and not of MDPI and/or the editor(s). MDPI and/or the editor(s) disclaim responsibility for any injury to people or property resulting from any ideas, methods, instructions or products referred to in the content. |
© 2025 by the authors. Licensee MDPI, Basel, Switzerland. This article is an open access article distributed under the terms and conditions of the Creative Commons Attribution (CC BY) license (https://creativecommons.org/licenses/by/4.0/).