Abstract
Assessing soil fertility is a complex task as it is determined by natural and anthropogenic factors, including specific agronomic interventions (e.g., fertilization and crop rotation) and broader soil management (e.g., tillage and drainage). For agricultural management, soil represents a primary production factor whose chemical–physical characteristics and macro-elements content must be known. This work presents the maps of three macronutrients, i.e., N, K, and P, in the topsoils (0–30 cm layer) of the Emilia-Romagna (21,710.1 km2) region in NE Italy. The maps and associated uncertainty at 100 m resolution were obtained via digital soil mapping (DSM) resorting to Quantile Random Forests using topsoil data from the regional soil database (N = 34,750). As Emilia-Romagna is characterized by two distinct major landforms, i.e., the intensively cultivated alluvial plain and the extensively managed mountain range of the Northern Apennines, each representing nearly half of the region, two distinct sets of numerical and categorical covariates were used as predictors for the DSM estimation of each macronutrient. Results highlight an average N content of approximately 1.57 ± 0.83 (standard deviation) g kg−1 in the alluvial plain and of 1.63 ± 0.49 g kg−1 in the Apennines. For exchangeable potassium (K), concentrations were 275.90 ± 92.6 mg kg−1 and 210.2 ± 86.3 mg kg−1 in the plain and Apennines, respectively. A stark contrast was observed for available phosphorus (P), with mean values of 40.4 ± 11.0 mg kg−1 in the alluvial plain, dropping to 15.2 ± 6.1 mg kg−1 in the Apennines. Such results provide useful information for assessing the fertility of regional soils and provide a reference baseline for soil quality monitoring. The resulting macronutrient maps were eventually compared with those based on the Land Use and Cover Area frame Survey (LUCAS), which represents the reference baselines at the EU scale.
1. Introduction
According to a recent assessment [], a large portion of European soils are unhealthy, with 60–70% showing signs of degradation due to unsustainable management. Nutrient imbalances affect approximately 74% of agricultural land in the EU [], with significant consequences on soil-based ecosystem services, including agricultural productivity, carbon sequestration, and water quality [,,]. Effective nutrient management is therefore essential to maintain soil health, production potential, and environmental quality [,,].
The status of soil nutrients across Europe is highly heterogeneous, being influenced by parent material, climate, land use, and management history, leading to significant regional disparities [,,]. To address this, the proposed EU Soil Monitoring Law (SML) [] aims to establish a harmonized framework for monitoring soil health, with topsoil nitrogen (N) and phosphorus (P) concentrations among its key indicators. As first measurements should be done within three years of the directive’s entry into force, a reference baseline providing the overall status of soil nutrients would be highly desirable as this would also allow to better assess soil degradation costs []. This legislative drive creates then an urgent need for accurate, spatially explicit baseline data on soil nutrients at a management-relevant scale.
Digital soil mapping (DSM) has emerged as a critical tool for quantifying the spatial distribution of soil properties [,]. By coupling soil observation data with environmental covariates through statistical or machine learning models, DSM can produce continuous maps of soil characteristics, possibly leading to improved pedological understanding []. At the continental scale, the Land Use/Cover Area frame statistical Survey (LUCAS) topsoil dataset has been used with Gaussian Process Regression to create baseline maps for N, P, and K at 250 m resolution []. While these maps highlight major drivers of nutrient distribution at a broad scale, their relatively low sample density (~1 sample per 200 km2) and the coarse resolution of some covariates limit their applicability for regional-scale policy implementation and land management. However, the implementation of EU environmental regulations targeting water, soil, and environmental quality [,,], aiming to reduce emissions from agriculture, still requires knowledge gaps to be filled at the national and regional scales to manage the impacts of nutrient losses on terrestrial and aquatic ecosystems on human health [,].
In Italy, the implementation of EU environmental directives like the Nitrates Directive (91/676/EEC) is delegated to administrative regions (NUTS2 level according to the EU Nomenclature of Territorial Units for Statistics) []. This directive defines the discipline on the agronomic use of livestock effluents, vegetation waters from oil mills, and waste waters from agricultural and agri-food companies []. In Emilia-Romagna (NE Italy), a highly productive agricultural region, specific regulations (e.g., Regional Regulation No. 2/2024) require differentiated agricultural practices based on local soil conditions, including nutrient status. This regulatory landscape requires a level of spatial detail and accuracy that EU-scale approaches like LUCAS may fail to provide [].
Consequently, a critical research gap exists between the availability of continental-scale soil nutrient assessments and the precise data needs for effective regional policy and management. There is a pressing need for high-resolution, regional baseline maps to assess the practical applicability of continental models and to provide a reliable foundation for regional decision-making
The goal of this work is to fill this knowledge gap by providing a high-resolution (100 m) assessment of topsoil macronutrients (N, P, and K) in Emilia-Romagna using a robust DSM approach based on a large regional soil database (N = 34,750). Our specific objectives are as follows:
- Produce and validate maps of N, P, and K concentrations and their associated uncertainty using Quantile Random Forests.
- Identify the environmental covariates that most strongly influence the spatial patterns of each nutrient.
- Critically compare our regional maps with the existing LUCAS-based continental maps to quantify discrepancies and evaluate the implications for regional soil health assessment within the framework of the proposed EU Soil Monitoring Law.
2. Materials and Methods
2.1. Study Area: Climate, Soils, and Land Uses
Emilia-Romagna in NE Italy (lat 43°5′ N–45°8′ N; long 9°20′ E–12°40′ E Greenwich, approximately) has an area of 22,509.67 km2 and is characterized by a variety of landforms and landscapes, being the region’s territory divided into two parts with almost equal extensions (Figure 1): the north-eastern one (47.8% of the total surface area) south of the Po River occupied by the Emiliano-Romagnola plain (ca. 12,032 km2) which is delimited to the East by the Adriatic Sea, and the south-western one characterized by the presence of the Apennines range (hilly for 27.1% of the area and mountainous for 25.1%).
Figure 1.
Study area: Pedolandscapes (soil provinces) of Emilia-Romagna. A1: Soils of the coastal plain and delta front; A2: Soils in the lower abandoned Po delta plain (Holocene); A3: Soils in the upper abandoned Po delta plain (Holocene); A4: Soils in the Po meander plain (Holocene); A5: Soils in morphologically depressed areas of the lower Apennine alluvial plain; A6: Soils of the levees and transition areas of the lower Apennine alluvial plain; A7: Soils in the fans and terraces of the upper Apennine alluvial plain (Holocene); A8: Soils in the fans and terraces of the upper Apennine alluvial plain (Holocene); A9: Soils in the terraced fans of the upper Apennine alluvial plain, located near the main river channels; A10: Soils in morphologically high areas of the ancient plain–Apennine fringe (Pleistocene); B1: Soils of the lower Apennines of Pliocene clays and sands; B2: Lower Apennines soils on unstable clays; B3: Lower Apennines soils on mudstones and sandstones; B4: Lower Apennines soils on the Marnosa Arenacea Romagnola (turbiditic marly sandstones); C1: Soils of the middle Apennines on unstable clays; C2: Soils of the middle Apennines on calcareous–marly flysch; C3: Soils of the middle Apennines on arenaceous–pelitic flysch; C4: Soils of the middle Apennines on gypsum and limestones; C5: Soils of the middle Apennines on ophiolitic rocks; D1: Soils of the upper Apennines on sandstones; D2: Soils of the upper Apennines on calcareous–marly flysch and mudstones: D3: Soils of the upper Apennines on ophiolites rocks; CA: water bodies.
The region’s climate varies due to its diverse terrain and to the presence of the sea. The mountains are characterized by a temperate climate (Köppen-Geiger Cfb), with rainy summers followed by cold winters, while in the plain the climate is temperate subcontinental with hot summers (Köppen-Geiger Cfa). The average yearly cumulated rainfall for the reference period 1991–2015 is 927 mm, with a maximum of 1957 mm along the northwestern ridge of the Apennines and a minimum of 616 mm in the Po River delta. The average temperature for the same reference period is equal to 12.8 °C with a minimum in January (0.4 °C) and a maximum in July (27 °C) [].
The regional soil map at the scale of 1:1,000,000 [] identifies 22 pedolandscapes (or soil provinces): ten in the alluvial plain and four, five, and three, respectively, in the low (150–450 m a.s.l.), medium (450–900 m a.s.l.), and high (>900 m a.s.l.) Apennines (Figure 1). These pedolandscapes represent distinct geographical units where soil characteristics are relatively uniform, as they develop under a consistent combination of climate, vegetation, and parent material.
The Apennines (highest elevation in Emilia-Romagna 2165 m a.s.l.) are formed by sediments deposited in four different Meso-Cenozoic paleogeographic domains: (i) the Ligurian Domain, containing a tectonic mix and olistostromes with a high clay content; (ii) the Epi-Ligurian Domain, represented by thick series of calcareous or arenaceous turbidites, clay breccias and olistostromes; (iii) the Sub-Ligurian Domain, characterized by pelitic and evaporitic deposits (mostly gypsum), marine clays, and alternations of marine conglomerates and sands; and (iv) the Tuscan–Umbrian Domain, characterized by strongly cemented turbiditic marly sandstones. The variety of parent materials and terrain morphologies occurring in the Apennines results in twelve distinct pedolandscapes (Figure 1).
The plain area of the region (lowest elevation −8 m b.s.l.) is made up of Pleistocene–Holocene deposits from two different sources: the Po river–delta system, with a W-E orientation, and the Apennine river systems, with a dominant SW-NE orientation. The occurrence of two depositional systems resulted in an extremely complex geomorphological pattern of coastal, deltaic, fluvial, and terraced alluvial deposits, which resulted in ten different pedolandscapes (Figure 1). A description of the dominant soil types occurring in each pedolandscape unit, including their classification according to the USDA Soil Taxonomy (12th Ed., 2014), is provided in the Supplementary Materials (Table S1) along with the distribution of the FAO-WRB Major Soil Groups in the pedolandscapes of Emilia-Romagna (Figure S1).
Figure 2 illustrates the dominant land uses in Emilia-Romagna [], highlighting the strong difference between the highly intensively cultivated plain and the extensively managed mountain rangelands and forests, which characterize 24 agricultural districts: nine in the alluvial plain, eight in the low Apennines (150–450 m a.s.l.), and eight in the medium (450–900 m a.s.l.) and high (>900 m a.s.l.) Apennines.
Figure 2.
Dominant land use and agricultural districts (1–25) of Emilia-Romagna. Districts 1 to 14 are in Emilia; districts 16–24 are in Romagna. Plain districts: 1, 4, 7, 10, 13, 16, 19, 22, and 25; Hills districts: 2, 5, 8, 11, 14, 17, 20, and 23; and Mountain districts: 3, 6, 9, 12, 15, 18, 21, and 24. Administrative provinces: Piacenza (1, 2, and 3), Parma (4, 5, and 6), Reggio-Emilia (7, 8, and 9), Modena (10, 11, and 12), Bologna (13, 14, and 15), Ravenna (16, 17, and 18), Forlì-Cesena (19, 20, and 21), and Rimini (22, 23, and 24).
In the Apennines, oaks (Quercus L.), hornbeams (Carpinus L.), and chestnuts (Castanea sativa Mill.) dominate the broadleaf woodlands which represent more than 60% of the area. Croplands, grasslands, and permanent crops cover 22, 7, and 3% of the hilly and mountain areas, respectively.
In the plain, deep soils sustain intensive agricultural productions that, depending on local climatic conditions, range from typical permanent crops, cereals, and industrial crops in the east to more temperate climate productions such as pastures, cereals, and pig and dairy farming in the west. Orchards are prominent in agricultural districts 19, 16, and 25 located in the Romagna and Ferrara plains, while vineyards primarily grow along the Apennines foothills in the high plain and are also found in the central part of the Modena and Reggio Emilia plains (agricultural districts 10 and 7). The plain permanent meadows are typical of the Parma and Reggio Emilia districts (4 and 7 in Figure 2, respectively), being linked to the local traditional dairy production of the Parmigiano Reggiano cheese.
At the regional level, livestock farming and animal products represent a key economic and social value, accounting for approximately half of the agricultural gross marketable production, which is important for regional development and helps counteract the depopulation of mountain and hillside areas. Historically, Emilia-Romagna has been associated with high-quality products that carry origin designations, making it one of the regions with the highest livestock production in the country. As of June 2021, the region counted nearly 6000 cattle farms with over 570,000 heads (59% in the plain), ca. 2800 pig farms with nearly 1,100,000 heads (61% in the plain), and 421 poultry farms with over 19,377,000 heads (61% in the plain) []. In the agricultural districts of the plain, cow farms occur mainly in districts 4 and 7 (Parma and Reggio Emilia plains), pig farms in districts 10 and 13 (Modena and Bologna plains), and poultry farms in districts 16 and 19 (Ravenna and Forlì-Cesena plains).
2.2. Soil Macronutrient Data
The Geology, Soil, and Seismic Risk Service of Emilia-Romagna provided the soil macronutrient data that laid the foundation for the digital soil mapping (DSM). The overall dataset consists of 36,054 sites with analytical data for the 0–30 cm depth interval, sampled over a time span between 1974 and 2023. The analytical data in the soil database comes from three different sources: 1. Soil observations collected by the Geology, Soils, and Seismic Area (n = 4376, 12.2% of observations); 2. Samples taken as part of technical assistance activities for agriculture, owned by the Planning, Land Development, and Production Sustainability Sector of the Agriculture Directorate (n = 31,191, 86.5% of observations); and 3. Monitoring data from various sources, including the LUCAS dataset [] (n = 487, 1.3% of observations). In this case, only the most recent analytical data were used for DSM.
Macronutrient concentrations were assessed following the Italian official analytical methods [], which are coherent with ISO standards. In the case of nitrogen, the data refer to total content expressed in g kg−1, measured with the Kjeldahl method (ISO 1871:2009) [] or with the combustion method. The Olsen method (ISO 11263:1994) [] was used to determine plant available phosphorus, which is expressed as mg kg−1 P2O5. Exchangeable K2O content in soil was determined using the ammonium acetate method (ISO 22171:2023) [] and is expressed in milligrams per kilogram (mg kg−1) of soil.
In addition to the diversity of data sources, there were also differences in sampling depth which required a preliminary data harmonization over the 0–30 cm reference depth: in the case of multiple values within the 0–30 cm layer, the data were then interpolated using cubic splines [,] in the R environment [] using the R package (v4.4.2) splines2 [].
Successively, the statistical distributions of each nutrient were analyzed to check for possible outliers using Rosner’s outlier test []. Once the critical value was identified, individual cases were evaluated to determine whether it was appropriate to eliminate the “anomalous” data from the dataset. In some cases, for example, it was decided to remove them because they were particularly anomalous and likely associated with sampling taken close to soil fertilization periods (in these cases, two or three elements often result in outliers). Only the N data referring to organic soils, which have particularly high values, were retained for DSM even though the procedure had identified them as outliers.
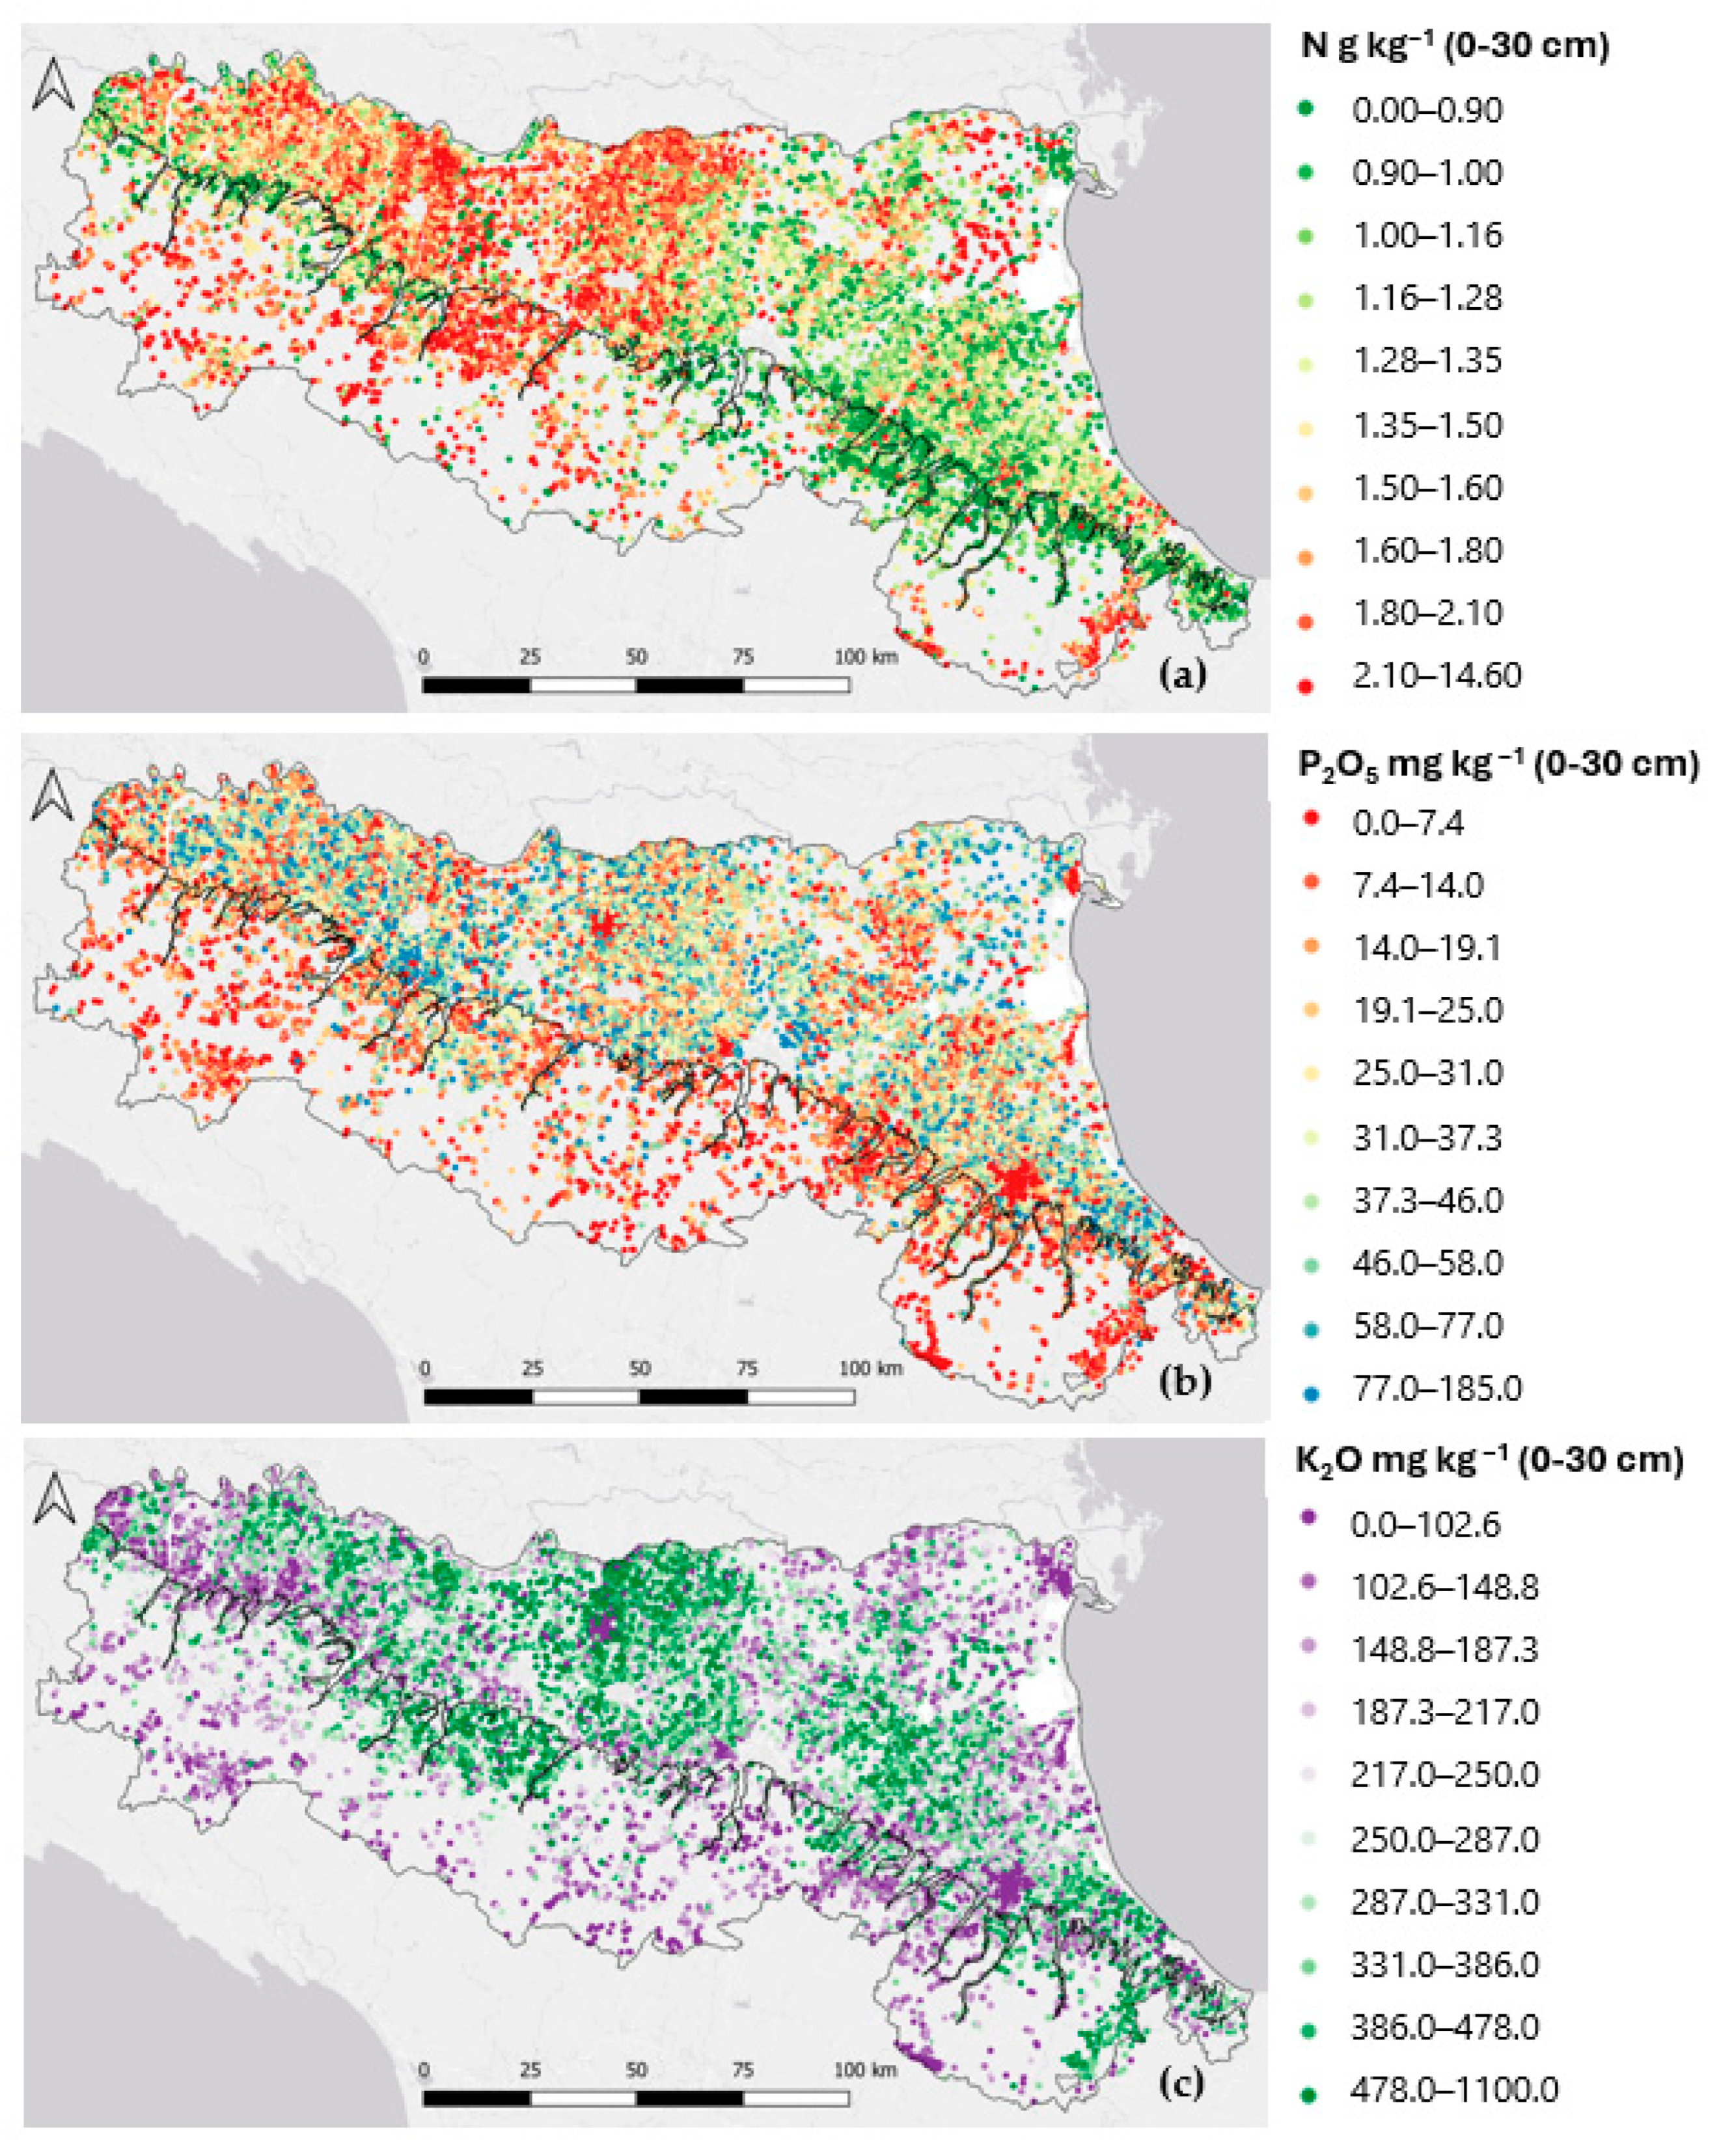
Table 1 summarizes the descriptive statistics of the three soil macronutrients. The overall sampling density (observation per km2) is 1.6, which would be coherent with a 1:50,000 scale, but as the data points in the plain area of the region represent 76% of the total, and considering the differences in land use intensity and the role played by environmental drivers in the two contexts, this led to the implementation of two separate DSM procedures for the plain and for the Apennines. Figure 3 shows the classed post-plots of the three macronutrients’ concentrations for the 0–30 cm reference layer.
Table 1.
Descriptive statistics of N (g kg−1), P (P2O5, mg kg−1), and K (K2O, mg kg−1) concentrations for the plain and the mountainous areas of Emilia-Romagna and for the whole regional dataset. Std. Dev.: standard deviation.
Figure 3.
Classed post-plots of topsoil (0–30 cm) macronutrients’ concentrations: (a) N (g kg−1); (b) P2O5 (mg kg−1); (c) K2O (mg kg−1). Class intervals are defined based on the deciles of the observed distributions.
As the data were collected over a few decades, the existence of possible trends over time of the three macroelements was analyzed by dividing the data sets into 5 groups: data collected in the 1980s or earlier, those collected in the 1990s, data collected up to 2009, data collected between 2010 and 2016, and finally the most recent data from 2017 onwards. For all macronutrients, concentrations in the plain remained stable over time, except for P which decreased in the last period considered. The concentrations of N and K in the Apennine soils, along with their observed variability over time, are linked to the low sample size and to the specific areas where sampling campaigns were conducted. In the case of P, topsoil concentration in the Apennine remained substantially stable over time. Summary results are presented in the Supplementary Table S2, along with localization of sampling points in the five different decades (Figure S2).
2.3. Digital Soil Mapping
A digital soil mapping (DSM) approach was used to assess and map the three soil macronutrients at 100 m resolution in the two areas of the region, i.e., the plain and the Apennines. This approach relied on machine learning (ML) calibrated regression algorithms to estimate the spatial distribution of soil macronutrients using a variable number of covariates as predictors. These are typically continuous variables, such as elevation and other parameters derived from the digital elevation model (DEM), meteorological and climatic variables, and spectral and vegetation indices from remote sensing. Continuous variables are often complemented by categorical variables, such as land use, and soil map units at different scales. In both cases, independently from the original resolution, all covariates covering the entire regional territory were harmonized at 100 m resolution after being reprojected into the same reference system (EPSG:7791) [].
The DSM models were calibrated in the R environment [], using a DSM Workflow developed by ISRIC []. The workflow modelling approach is based on Quantile Random Forest (QRF) [,] and generates soil nutrient maps (median values) with quantified uncertainty as outputs. The workflow implements the ranger package [], with the option quantreg to build QRF [], estimating the cumulative probability distribution of the soil macronutrients at each location from an ensemble of 500 decision trees in the RF. Uncertainty of estimates was assessed by calculating the interquartile ranges of the values calculated for each pixel of the estimation grid. Using 75% of the available data randomly selected for calibration, model performance was evaluated with a 10-fold cross-validation, splitting the datasets into a training and a validation subset. The predictive performance of the models was eventually assessed for the calibration and validation data sets resorting to the following error metrics: mean error (ME), absolute error (AE), root mean squared error (RMSE), coefficient of determination (R2), and index of agreement (IoA). IoA is a dimensionless index with values ranging between 0 and 1, with 0 indicating no agreement at all and 1 indicating a perfect match [].
For the spatial prediction of topsoil macronutrients, a set of 35 covariates was used; these are listed in Table 2 along with the SCORPAN factors [] they refer to.
Table 2.
List of the covariates used in the DSM of the Emilia-Romagna plain and Apennines to estimate soil macronutrients. SCORPAN factor: C, climate; O, organisms; P, parent material; R, relief; S, soil (measured properties of the soil at a point).
Eight covariates were derived from the 10 m resolution DEM and nine were remote sensing indices and spectral bands reflectance derived from Sentinel-2 images retrieved via Google Earth Engine [], taking the mean value of the yearly medians for the reference time interval 2015–2023. Among the numerical soil-based covariates, four covariates were derived via DSM of basic soil properties [], namely topsoil clay and sand contents, soil organic carbon, and pH; two provided the NPK mean concentrations for the LULC classes and for the pedolandscapes within each agricultural district; and one the RUSLE-based soil erosion loss []. Additionally, three categorical covariates describing the soil geography at different hierarchically linked spatial scales, namely 1:1,000,000, 1:250,000, and 1:50,000, were used []. Further categorical covariates used in the DSM of soil macronutrients were the land use map and the map of the geomorphological forms.
To assess the relevance of each covariate in predicting macronutrient concentrations, the workflow performed a Recursive Feature Elimination (RFE) using the caret package []. RFE is a feature selection technique that identifies the most relevant predictors when building a predictive model. The predictive power of each covariate was defined in terms of “node purity,” which describes the homogeneity of the data within each node deriving from the partition of the data based on the values of any given covariate. The node purity is calculated as the difference in terms of the rooted mean squared error (RMSE) before and after the division performed on that specific covariate.
2.4. Postprocessing of Results and Comparison of DSM Outputs at the Regional and the EU Scale
The resulting three macronutrients’ maps were postprocessed considering the 22 functionally distinct pedolandscapes based on the Emilia Romagna Soil Map at scale 1:1,000,000 [] and the 25 agricultural districts. In addition, the regional maps were compared with the topsoil nutrient status maps for the same area based on the 2009–2012 LUCAS dataset, which in Emilia-Romagna include 117 sampling points (density ~1.0 sample per 200 km2) where macronutrients’ content was analyzed following the ISO standards []. To this goal the maps were resampled and reprojected to the same resolution and reference system as the LUCAS maps, i.e., 250 m and EPSG:3035, using a bilinear interpolation algorithm in R. As in LUCAS maps K and P concentrations are given as mg kg−1, the regional estimates for exchangeable K and available P were multiplied by 0.830 and 0.436, respectively. Raster statistics were then computed, and macronutrient concentrations were compared in terms of agricultural districts and pedolandscapes. Figure S3 in the Supplementary Materials shows the location of the LUCAS points in the pedolandscapes of Emilia-Romagna.
3. Results
The DSM procedure allowed the identification of the covariates’ relevance in calibrating the QRF predictive models. Figure 4 shows the covariates’ importance in terms of node purity; the values shown in the figure were normalized to the same 0–1 range to plot together the three macronutrients considered in the two major landforms of RER.
Figure 4.
Importance of the covariates for predicting the levels of soil macronutrients using DSM with QRF in Emilia-Romagna.
The predictors on the Y axis of the bar plot are in decreasing order of importance based on their average ranks and can be separated into five categories: (i) climate covariates (n = 1), (ii) topography covariates (n = 9), (iii) land use land cover covariates (n = 3), (iv) soil covariates (n =10), and (v) surface reflectance covariates (n = 9).
In the case of N concentrations, soil organic matter content ranked first in terms of predictive power in both the plain and the Apennines. The average N concentration per pedolandscape, at the level of agricultural districts, ranked second, showing the same relevance in both the plain and the Apennines. Elevation ranked fourth in the Apennines but only sixth in the plain. In the plain, the normalized node purity value of soil textural fractions (sand and clay) and pH was double that observed in the Apennines; however, these factors were still among the top ten covariates by relevance in that region. In the Apennines, the average temperature of the warmest month and the N concentrations per land cover type at the district level ranked third and fourth, respectively, while showing no predictive power for estimating N concentration in soils of the plain. Among the surface reflectance covariates, only NDVI (calculated as the sum from June to September) ranked among the top ten in the Apennines, whereas three additional topography covariates—mrivbf, vdepth, and twi—demonstrated good predictive power in the plain. Still among the first ten ranking covariates for N concentration prediction were two categorical predictors related to soil geography, i.e., the pedolandscapes in the Apennines (12 classes) and the 1:250,000 soil map units in the plain (59 classes).
As for K topsoil concentration in both the plain and the Apennines, the most relevant predictor was clay content, followed, as in the case of N, by the average concentration per pedolandscape at the level of agricultural districts, again with same relevance in both the plain and the Apennines. Differences between the two major landforms occurred in the relevance of sand and C org contents, ranking third and fourth, respectively, in the Apennines and fifth and third in the plain. Elevation ranked seventh in both landforms, while the categorical covariates describing soil geography at different levels of detail ranked fourth in the plain (1:250,000 soil map units) and sixth in the Apennines (pedolandscapes). Among the ten more relevant covariates, pH ranked sixth in the plain and eighth in the Apennines, and NDVI (sum June–September) ranked fifth and tenth, respectively, in the Apennines and in the plain. As in the case of N concentration, the average temperature of the warmest month proved to be a relevant predictor only in the Apennines, where it ranked ninth, while in the plain the same rank was gained by SWIR. Two additional DEM-derived covariates were among the first ten, namely the slope in the Apennines and the mrivbf in the plain, ranking tenth and eighth, respectively.
The relevance of covariates in predicting P topsoil concentrations highlighted more differences between the two major landforms compared to what was observed in the case of N and K concentrations. Organic C content ranked first in the plain and second in the Apennines, while the average P concentration per pedolandscape at the level of agricultural districts ranked first in the Apennines but only eighth in the plain. Soil pH ranked second in the plain but only 20th in the Apennines, while among the first ten covariates sand and clay contents ranked eighth and tenth in the Apennines and fifth and sixth in the plain, respectively. Elevation ranked third in the plain but only 11th in the Apennines, where the most important DEM-derived predictors were slope (rank 3), nort (rank 5), and vdepth (rank 7). In the plain, though, three additional DEM-derived predictors were among the first ten: mrivbf ranked fourth, vdepth ranked ninth, and twi ranked tenth. Soil erosion ranked ninth in the Apennines, and P is the only macronutrient for which erosion ranks among the top ten covariates: in the case of nitrogen, it ranked 11th, and 16th in the case of potassium. Among the surface reflectance covariates, NDVI (sum June-September) ranked seventh in the plain and fourth in the Apennines where a second predictor from remote sensing, the nir reflectance (Sentinel-2 band 8), ranked sixth. It is interesting to note that in the plain, although not in the group of first ten predictors in terms of importance, a moderate predictive power was observed for nearly all the other remote sensing-based predictors (ndsi, swir, ndwi, sosi, nir, evi, and ndvi), which ranked from 11th to 17th.
Table 3 eventually reports the error metrics for the calibration and the validation datasets of the three soil macronutrients. Overall, the error metrics for the validation data sets highlighted a slightly higher precision in the prediction of soil macronutrients for the plain than for the Apennines, which was expected considering the size of the data sets. However, the DSM performance metrics for the validation data sets in both the plain and the Apennines are in most cases very good, with R2 values between 0.87 and 0.93, IoA values ≥ 0.88, and mean absolute errors ranging from 0.02 to 0.21 g kg−1 for N, from 9.9 to 11.9 mg kg−1 for K, and from 1.9 to 2.5 mg kg−1 for P concentrations.
Table 3.
Error indices for calibration (Train) and validation (Test) datasets.
3.1. Nitrogen Content
N concentrations, as discussed above, are strongly correlated with organic carbon content and, consequently, the distribution of the element across the region closely mirrors that of organic carbon content (Figure 5).
Figure 5.
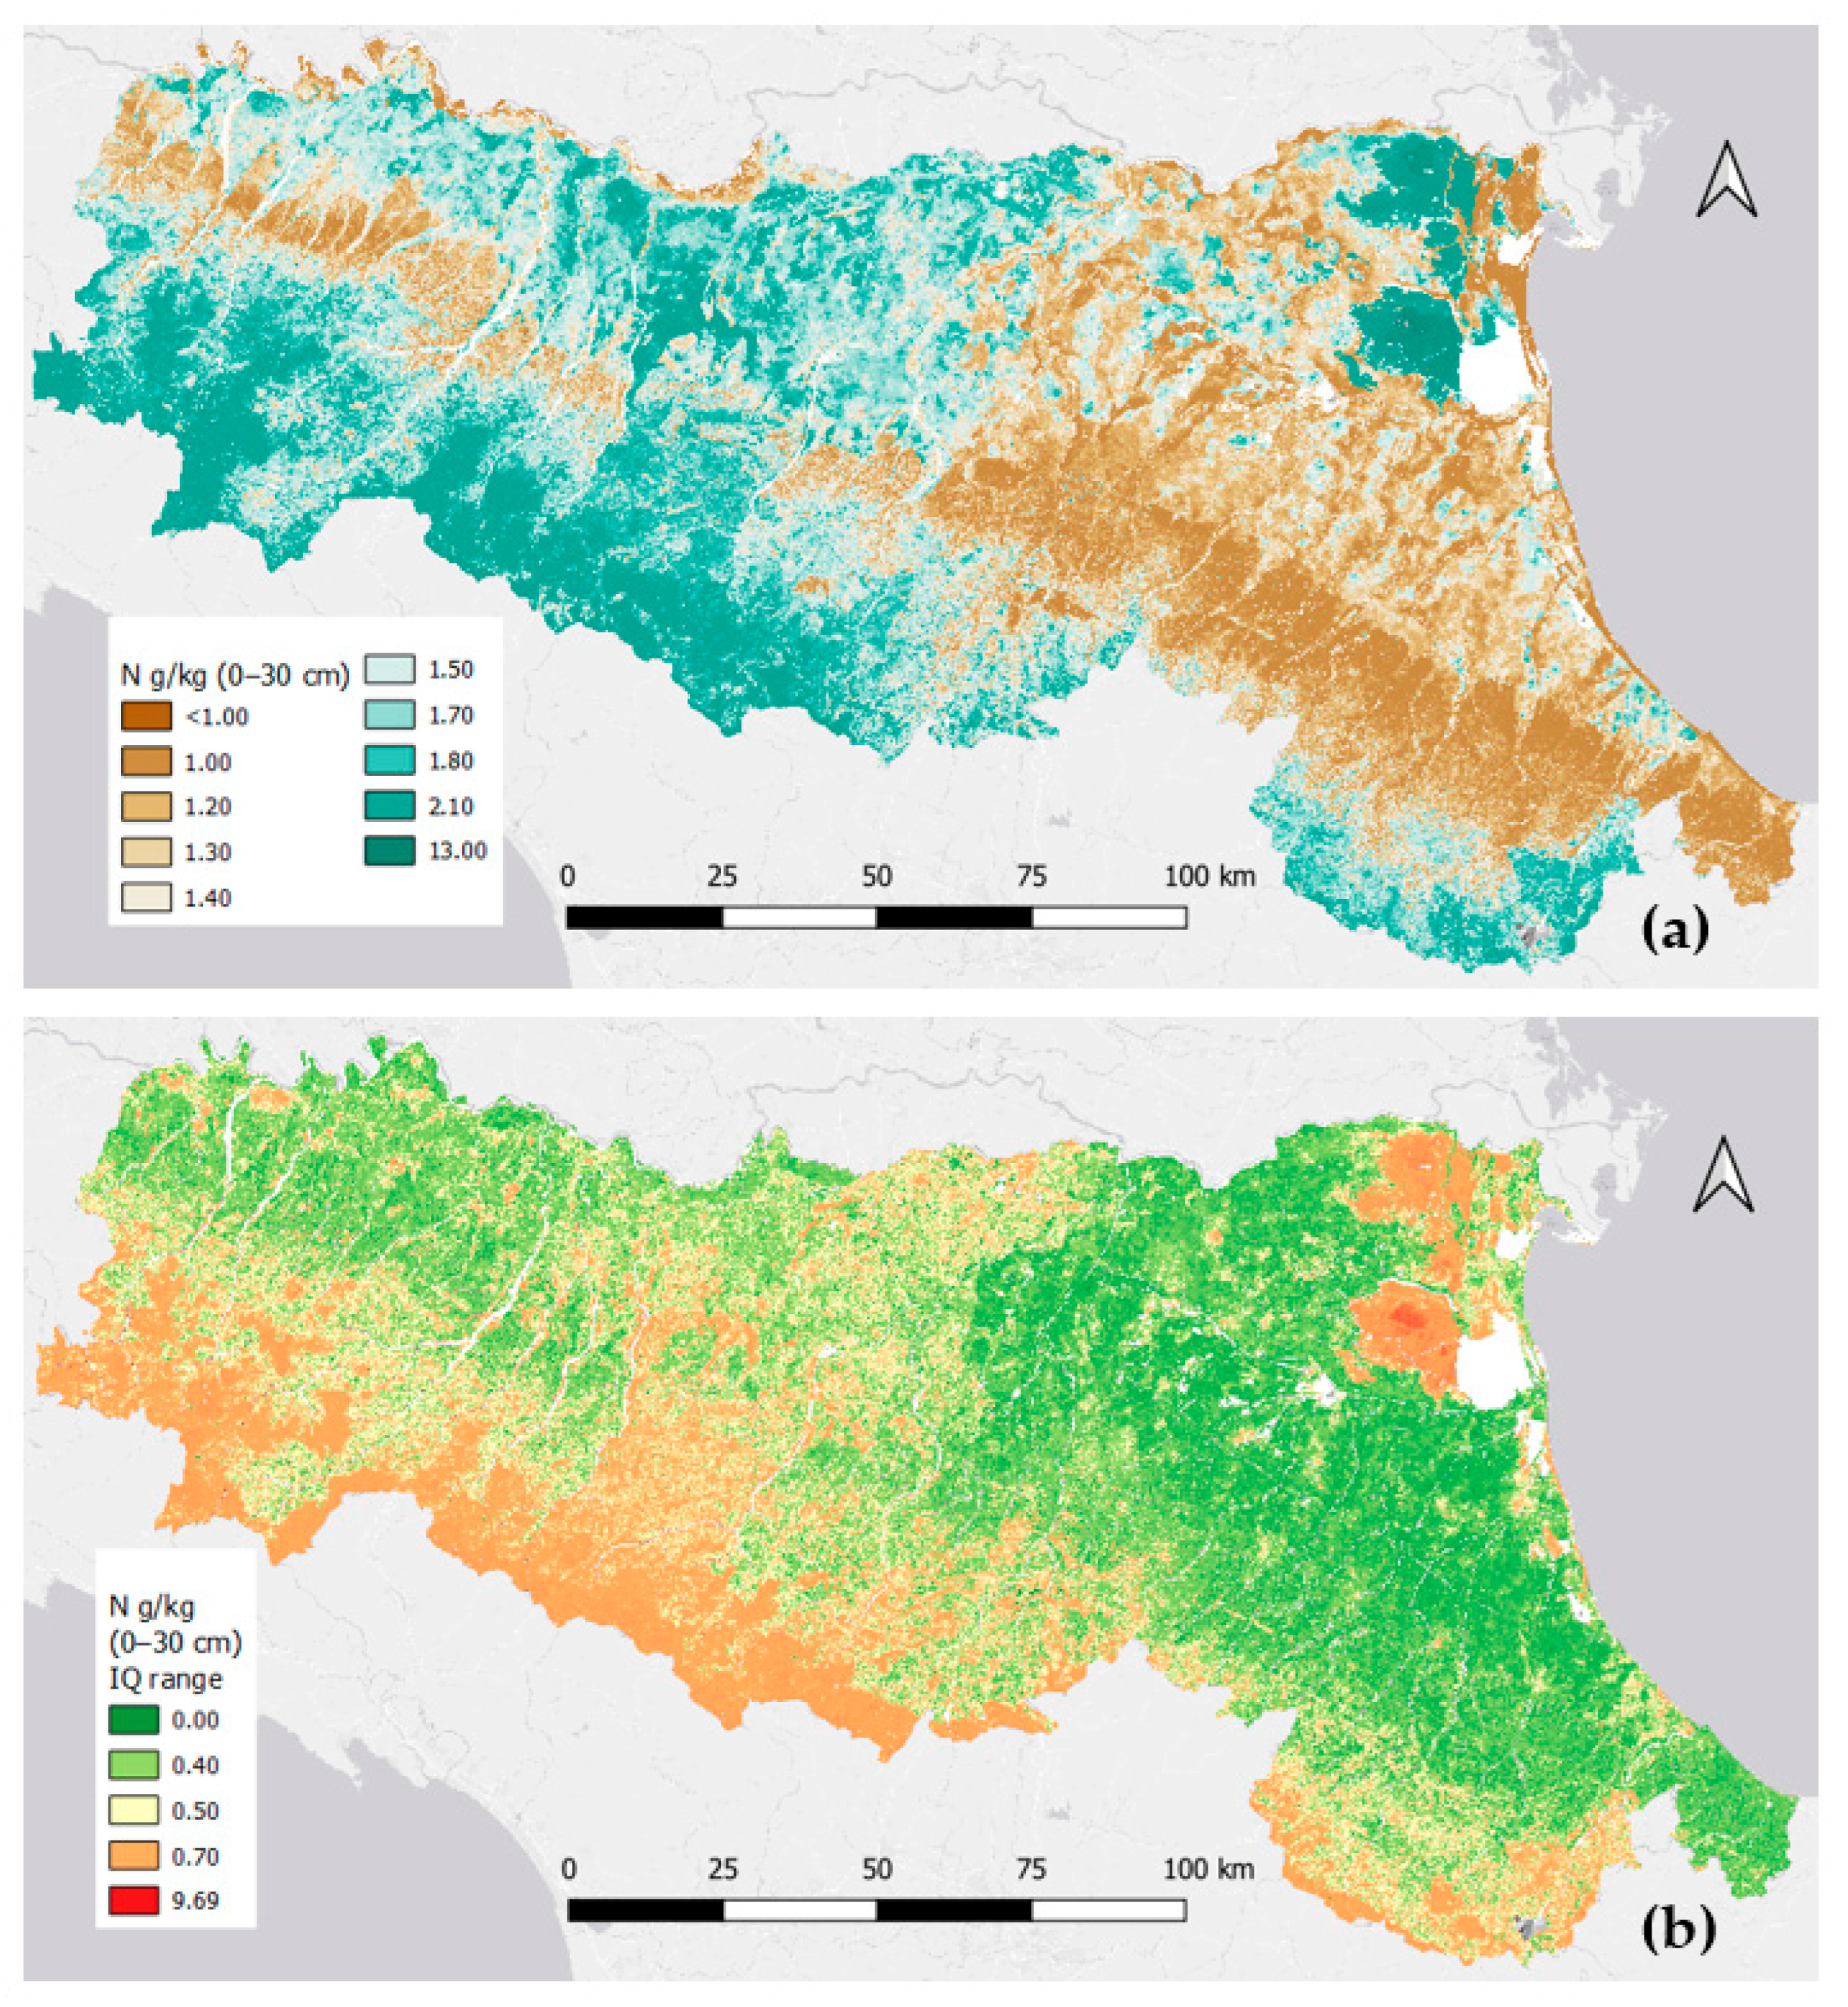
Median N topsoil (0–30 cm) concentrations (g kg−1) estimated with QRF (a), and its spatial uncertainty (b).
At the regional level, N concentrations fall most frequently in the range 1–2 g kg−1. Considering the reference soil depth 0–30 cm the Emilia-Romagna plain is characterized by a mean total N content of ca. 1.57 g kg−1 ± 0.83 (standard deviation). In the Apennines, again for the same depth interval, the mean total N content is ca. 1.63 ± 0.49 g kg−1. Considering the entire region, a mean content of ca. 1.60 ± 0.66 g kg−1 is observed. Figure 5 shows the map of N concentrations (g kg−1) and its spatial uncertainty summarized in terms of interquartile range.
In the plains, the areas with the highest quantities of N are in the lower delta plain (pedolandscape A2) of the Ferrara agricultural district due to the presence of soils developed on peaty deposits of formerly marshy and now reclaimed areas (average 4.3 ± 2.15 g kg−1). In contrast, in the Reggio Emilia district, high N content is attributed to the presence of forage crops, including both rotational and permanent pastures, associated with livestock and dairy production (Parmigiano-Reggiano cheese district).
Pedolandscapes A9, A7, A8, and A5 are particularly rich in N (average values between 2.52 and 1.87 g kg−1). The clayey soils of the floodplains (pedolandscape A5) on the right-hand side of the Taro River in the Parma district are also supplied with N above the regional average (1.86 ± 0.27 g kg−1). In the rest of Emilia (central-western part of the region), moderate levels are found, especially in the floodplains’ pedolandscape unit A5 (1.8 g kg−1 in Modena and Piacenza districts, 1.66 g kg−1 in Ferrara) and on terraces and alluvial fans (units A8, from 1.7 g kg−1 in Parma to 1.65 g kg−1 in Modena).
The large Emilian river natural levees (Taro, Crostolo, Secchia, Panaro) of the lower alluvial plain (pedolandscape A6) show average N contents between 1.75 g kg−1 and 1.61 g kg−1; the situation is different in Romagna (eastern part of the region), where fruit orchards are widespread and N values vary between 1.25 g kg−1 and 1.19 g kg−1, respectively in the Bologna and Forlì-Cesena districts. These low N levels are a consequence of changes in land use and management since the 1950s, with a sharp decline in forage crops and organic fertilization from livestock manure. In recent years, the widespread practice of grassing vineyards and orchards, as well as the reduction in tillage intensity, could help slow the decline in total N stocks. Intermediate values are found on gravelly alluvial fans (pedolandscape A9: average value 1.73 ± 1.6 g kg−1), ranging from 2.53 g kg−1 in the Reggio Emilia to 1.51 g kg−1 in the Modena districts. The lowest N values are found where sandy soils prevail, namely in the coastal plain (pedolandscape A1, 1.16 ± 1.1 g kg−1), and in this area the Forlì-Cesena agricultural district has the lowest value (0.83 g kg−1). Low values are also found in the desaturated soils of the Apennine margin (pedolandscape A10, average 1.24 ± 0.26 g kg−1), particularly in the agricultural districts of Ravenna (0.87 ± 0.13 g kg−1) and Bologna (0.94 ± 0.16 g kg−1).
In the lower Apennines (150–450 m a.s.l.), soils on Pliocene sands and clays (pedolandscape B1) have the lowest average concentrations, equal to ca. 1.08 ± 0.19 g kg−1, with a negative trend from north-west to south-east, characterized by average values between 1.44 and 1.18 g kg−1 in the lower Apennines districts of Reggio-Emilia, Parma, Piacenza and Modena; with values of approximately 1.06 ± 0.18 g kg−1 in the lower Apennines district of Bologna; and between 1.04 and 0.96 g kg−1 in the lower Apennines of Romagna (districts 17, 20 and 23 Figure 2). The B2 pedolandscape on unstable clays has an average value of 1.44 g kg−1 ± 0.3 (the highest on the hills), with a range of average values between 1.82% ± 0.26 in the Reggio Emilia district and 1.01 ± 0.17 g kg−1 in the Forlì district. The mudstones and sandstones of the lower Apennines (pedolandscape B3) have an average content of 1.26 g kg−1 ± 0.22, with higher average values in the Reggio-Emilia district (1.46 g kg−1 ± 0.22) and lower in Rimini (1.09 g kg−1 ± 0.26). Finally, the marly-limestone formation of the Romagna lower Apennines (pedolandscape B4) is characterized by average values of ca. 1.06 g kg−1 ± 0.19.
The mean value of N concentration in the pedolandscapes of the middle Apennines (450–900 m a.s.l.) ranges from 1.98 ± 0.3 g kg−1 of the soils on ophiolitic rocks (pedolandscape C5) to 1.59 ± 0.28 g kg−1 of the soils on calcareous–marly flysch (C2); additionally, the soils on unstable clays (C1) and the soils on arenaceous–pelitic flysch (C3) have estimated concentration equal to ca. 1.82 ± 0.31 g kg−1 and 1.65 ± 0.30 g kg−1, respectively, while higher average contents of 1.83 ± 0.22 g kg−1 are found in soils on gypsum and cavernous limestone (C4). In the C1, C2, and C3 pedolandscapes of the middle Apennines, a generally decreasing trend is observed between the Piacenza and the Bologna districts, a trend that then reverses to rise again in the Romagna provinces with a maximum in the Rimini district.
In the upper Apennines (>900 m a.s.l.), forests and meadows prevail, with higher organic matter contents than arable land, and consequently N contents also follow the same trend. Higher average values are observed in ophiolitic soils, with an average value of 2.42 ± 0.47 g kg−1 (pedolandscape D3), while lower average values (2.16 ± 0.58 g kg−1) characterize soils derived from sandstones (D1). Intermediate values, equal to approximately 2.35 ± 0.33 g kg−1, are observed in soils on calcareous–marly flysch and mudstone (D2). Here too, the Emilian districts (where, moreover, these units are more widespread) show the highest values, Parma and Piacenza in particular.
In terms of estimation uncertainties, the mean IQ range for the whole region is equal to 0.51 ± 0.34 g kg−1; the estimated N concentrations in the plain and in the lower Apennine are characterized by lower mean IQ values, equal respectively to 0.41 ± 0.18 g kg−1 and 0.40 ± 0.09 g kg−1. In the plain, the districts of Emilia have higher mean IQ range values than those of Romagna, with maximum values in Ferrara and Reggio-Emilia, respectively, at 0.57 ± 0.45 g kg−1 and 0.51 ± 0.12 g kg−1, and minimum values in the districts of Bologna and Ravenna, at 0.29 ± 0.03 and 0.31 ± 0.07 g kg−1, respectively. A very similar trend in spatial uncertainty of N concentration estimates is observed in the agricultural districts of the lower Apennine, with maximum mean IQ ranges found in Reggio-Emilia (0.54 ± 0.07 g kg−1) and Modena (0.41 ± 0.05 g kg−1) in Emilia, and minimum in the districts of Ravenna (0.29 ± 0.02 g kg−1) and Forlì (0.32 ± 0.03 g kg−1) in Romagna. In the agricultural districts of the mid- and high Apennines the mean values of the IQ range are always above the regional mean value, ranging between 0.55 ± 0.10 g kg−1 (Forlì district) and 0.72 ± 0.07 g kg−1 (Reggio-Emilia district) in the mid-Apennines and between 1.02 ± 0.18 g kg−1 (Modena district) and 1.69 ± 0.33 g kg−1 (Rimini district) in the high Apennines.
To enhance communication about uncertainty to potential stakeholders, the IQ ranges of estimated N concentration were aggregated at the municipality level and categorized as very low to very high based on the ventiles of the resulting IQ range distribution; the resulting map is presented in Figure S4 in the Supplementary Materials.
3.2. Potassium Content
Figure 6 shows the estimated K concentrations, expressed as exchangeable potassium (K2O, mg kg−1), and its spatial uncertainty in terms of interquartile range.
Figure 6.
Median exchangeable K topsoil (0–30 cm) concentrations (K2O mg kg−1) estimated with QRF (a), and its spatial uncertainty (b).
The clay content in this case strongly influences the resulting patterns, which closely reflect the textural characteristics of the soil parent material. For the 0–30 cm reference depth the estimated mean exchangeable K content (mg kg−1 K2O) is 275.9 ± 92.6 mg kg−1 in the alluvial plain and of 210.2 ± 86.3 mg kg−1 in the Apennines. The regional estimated mean concentration is equal to 244.8 ± 95.6 mg kg−1.
The mean K value in the Apennines is lower than in the plains, but in both cases, there is strong variability, evidenced by the high standard deviation values. As highlighted in Figure 6, the exchangeable K supply is high across much of the region, particularly in the plains and mid-hill areas. Lower values are found in the upper Apennines, in the foothill alluvial fans belt, and in the coarser-textured areas of the outer Po delta and of the coast.
In the plain, the areas with the highest K concentrations are on the clayey soils of the valleys of pedolandscape A5 (389.5 ± 65.0 mg kg−1 K2O), with the highest values in the districts of Modena and Reggio Emilia, followed by soils developed on peaty deposits of formerly marshy areas and now reclaimed in the lower delta plain (A2) in the Ferrara district (311.4 ± 65.5 g kg−1 K2O). Soils of pedolandscapes A7, A6, and A8 have concentrations above 200 mg kg−1 (between 262.0 and 294.0 g kg−1 K2O), and these soils are predominantly medium and medium-fine textured. The soils of the remaining pedolandscapes are characterized by values below 200 mg kg−1: the lowest concentrations are found on the sandy soils of the coast (A1, 142.1 ± 65.1 mg kg−1 K2O) and the desaturated soils of the Apennine margin (A10, 142.5 ± 47.0 mg kg−1 K2O), with the lowest values in the agricultural district of Piacenza.
As regards the lower Apennines, the soils of pedolandscape B4 (Romagnola marly–sandstone formation) have the lowest mean values (163.2 ± 30.4 mg kg−1 K2O), because soils in this unit very rarely have high clay content. This unit is followed by soils on the mudstones and sandstones of the lower Apennines (B3), which have an average content of 216.7 ± 70.6 mg kg−1 K2O with a high variability, and then those on Pliocene sands and clays (B1, 247.5 ± 72.9 mg kg−1), although locally the soils on the sandstones (Bologna and Piacenza districts) are those with the lowest absolute values (<100 mg kg−1 K2O). Unit B2 on unstable clays has a mean concentration of 329.0 ± 98.8 mg kg−1 K2O, which is the highest in the hills and the second in the whole region after the soils of unit A5 on the plain, proving the high correlation between high clay values and exchangeable K contents.
The mean concentration of exchangeable K in the mid-Apennine pedolandscapes varies from 149.2 ± 29.2 mg kg−1 in soils on ophiolitic rocks (C5) to 200.1 ± 55.1 mg kg−1 in soils on calcareous–marly flysch (C2); the soils of pedolandscape C1 (196.0 ± 57.3 mg kg−1) have values comparable to those of C2, but with notable differences between districts: the mean value ranges from 178.8 ± 40.5 mg kg−1 in Bologna to 251 ± 56.9 mg kg−1 in Reggio Emilia. In the case of unit C2 in the Ravenna district, topsoils have an average exchangeable K concentration of 161.9 ± 23.4 mg kg−1, compared to 252.1 ± 54.6 mg kg−1 in Reggio Emilia.
In the case of the pedolandscapes of the upper Apennines, exchangeable K content in soils has low average values (from 111 to 168 mg kg−1). The lowest values are found in soils of ophiolitic origin in the D3 unit (111.3 ± 18.1 mg kg−1) and are comparable to soils derived from sandstones in the D1 unit (117.2 ± 26.7 mg kg−1), while the highest values are found in soils derived from calcareous–marly flysch and mudstones (D2), which generally have medium-textured soils (168.4 ± 34.3 mg kg−1). Even in this latter case, there is some variability among districts, ranging from an average value of 118.4 ± 20.8 mg kg−1 in Bologna to that of 190.9 ± 31.3 mg kg−1 in Piacenza.
The overall spatial uncertainty of the two QRF models’ predictions, expressed as mean IQ range, was equal to 13.5 ± 46 mg kg−1 K2O. Notwithstanding the difference in available data in the two major landforms, the predictions for the Apennines were characterized by a spatial uncertainty slightly lower than that observed for the exchangeable K predictions in the plain. The former has a mean IQ range equal to 12.8 ± 4.3 mg kg−1, while for the latter it is equal to 14.2 ± 4.9 mg kg−1. In the plain, the eastern districts of Emilia have higher mean IQ range values than those of Romagna, except Rimini (17.3 ± 4.6 mg kg−1), with maximum values in Modena (17.8 ± 5.62 mg kg−1), and minimum values in the district of Piacenza (10.3 ± 4.0 mg kg−1). In the agricultural districts of the lower Apennine, the maximum mean IQ ranges are in the districts of Reggio-Emilia (17.8 ± 3.7 mg kg−1) and Parma (14.4 ± 4.8 mg kg−1) in Emilia, and minimum in the districts of Forlì (13.5 ± 3.8 mg kg−1) and Ravenna (12.3 ± 3.3 mg kg−1) in Romagna. Similar local maximum and minimum mean IQ range values are observed for the mountain districts: in Reggio-Emilia and Rimini mean estimation uncertainties were 14.7 ± 4.2 mg kg−1 and 16.9 ± 2.4 mg kg−1, respectively, while minimum IQ ranges were observed in the districts of Ravenna (10.2 ± 1.4 mg kg−1) and Forlì (10.2 ± 2.1 mg kg−1) in Romagna.
As for N concentration, a classed uncertainty map at the municipality level for the estimated K concentration is given in Figure S4 in the Supplementary Materials.
3.3. Phosphorus Content
Figure 7 shows the estimated P concentrations, expressed as plant-available phosphorus (P2O5, mg kg−1), along with its spatial uncertainty in terms of interquartile range.
Figure 7.
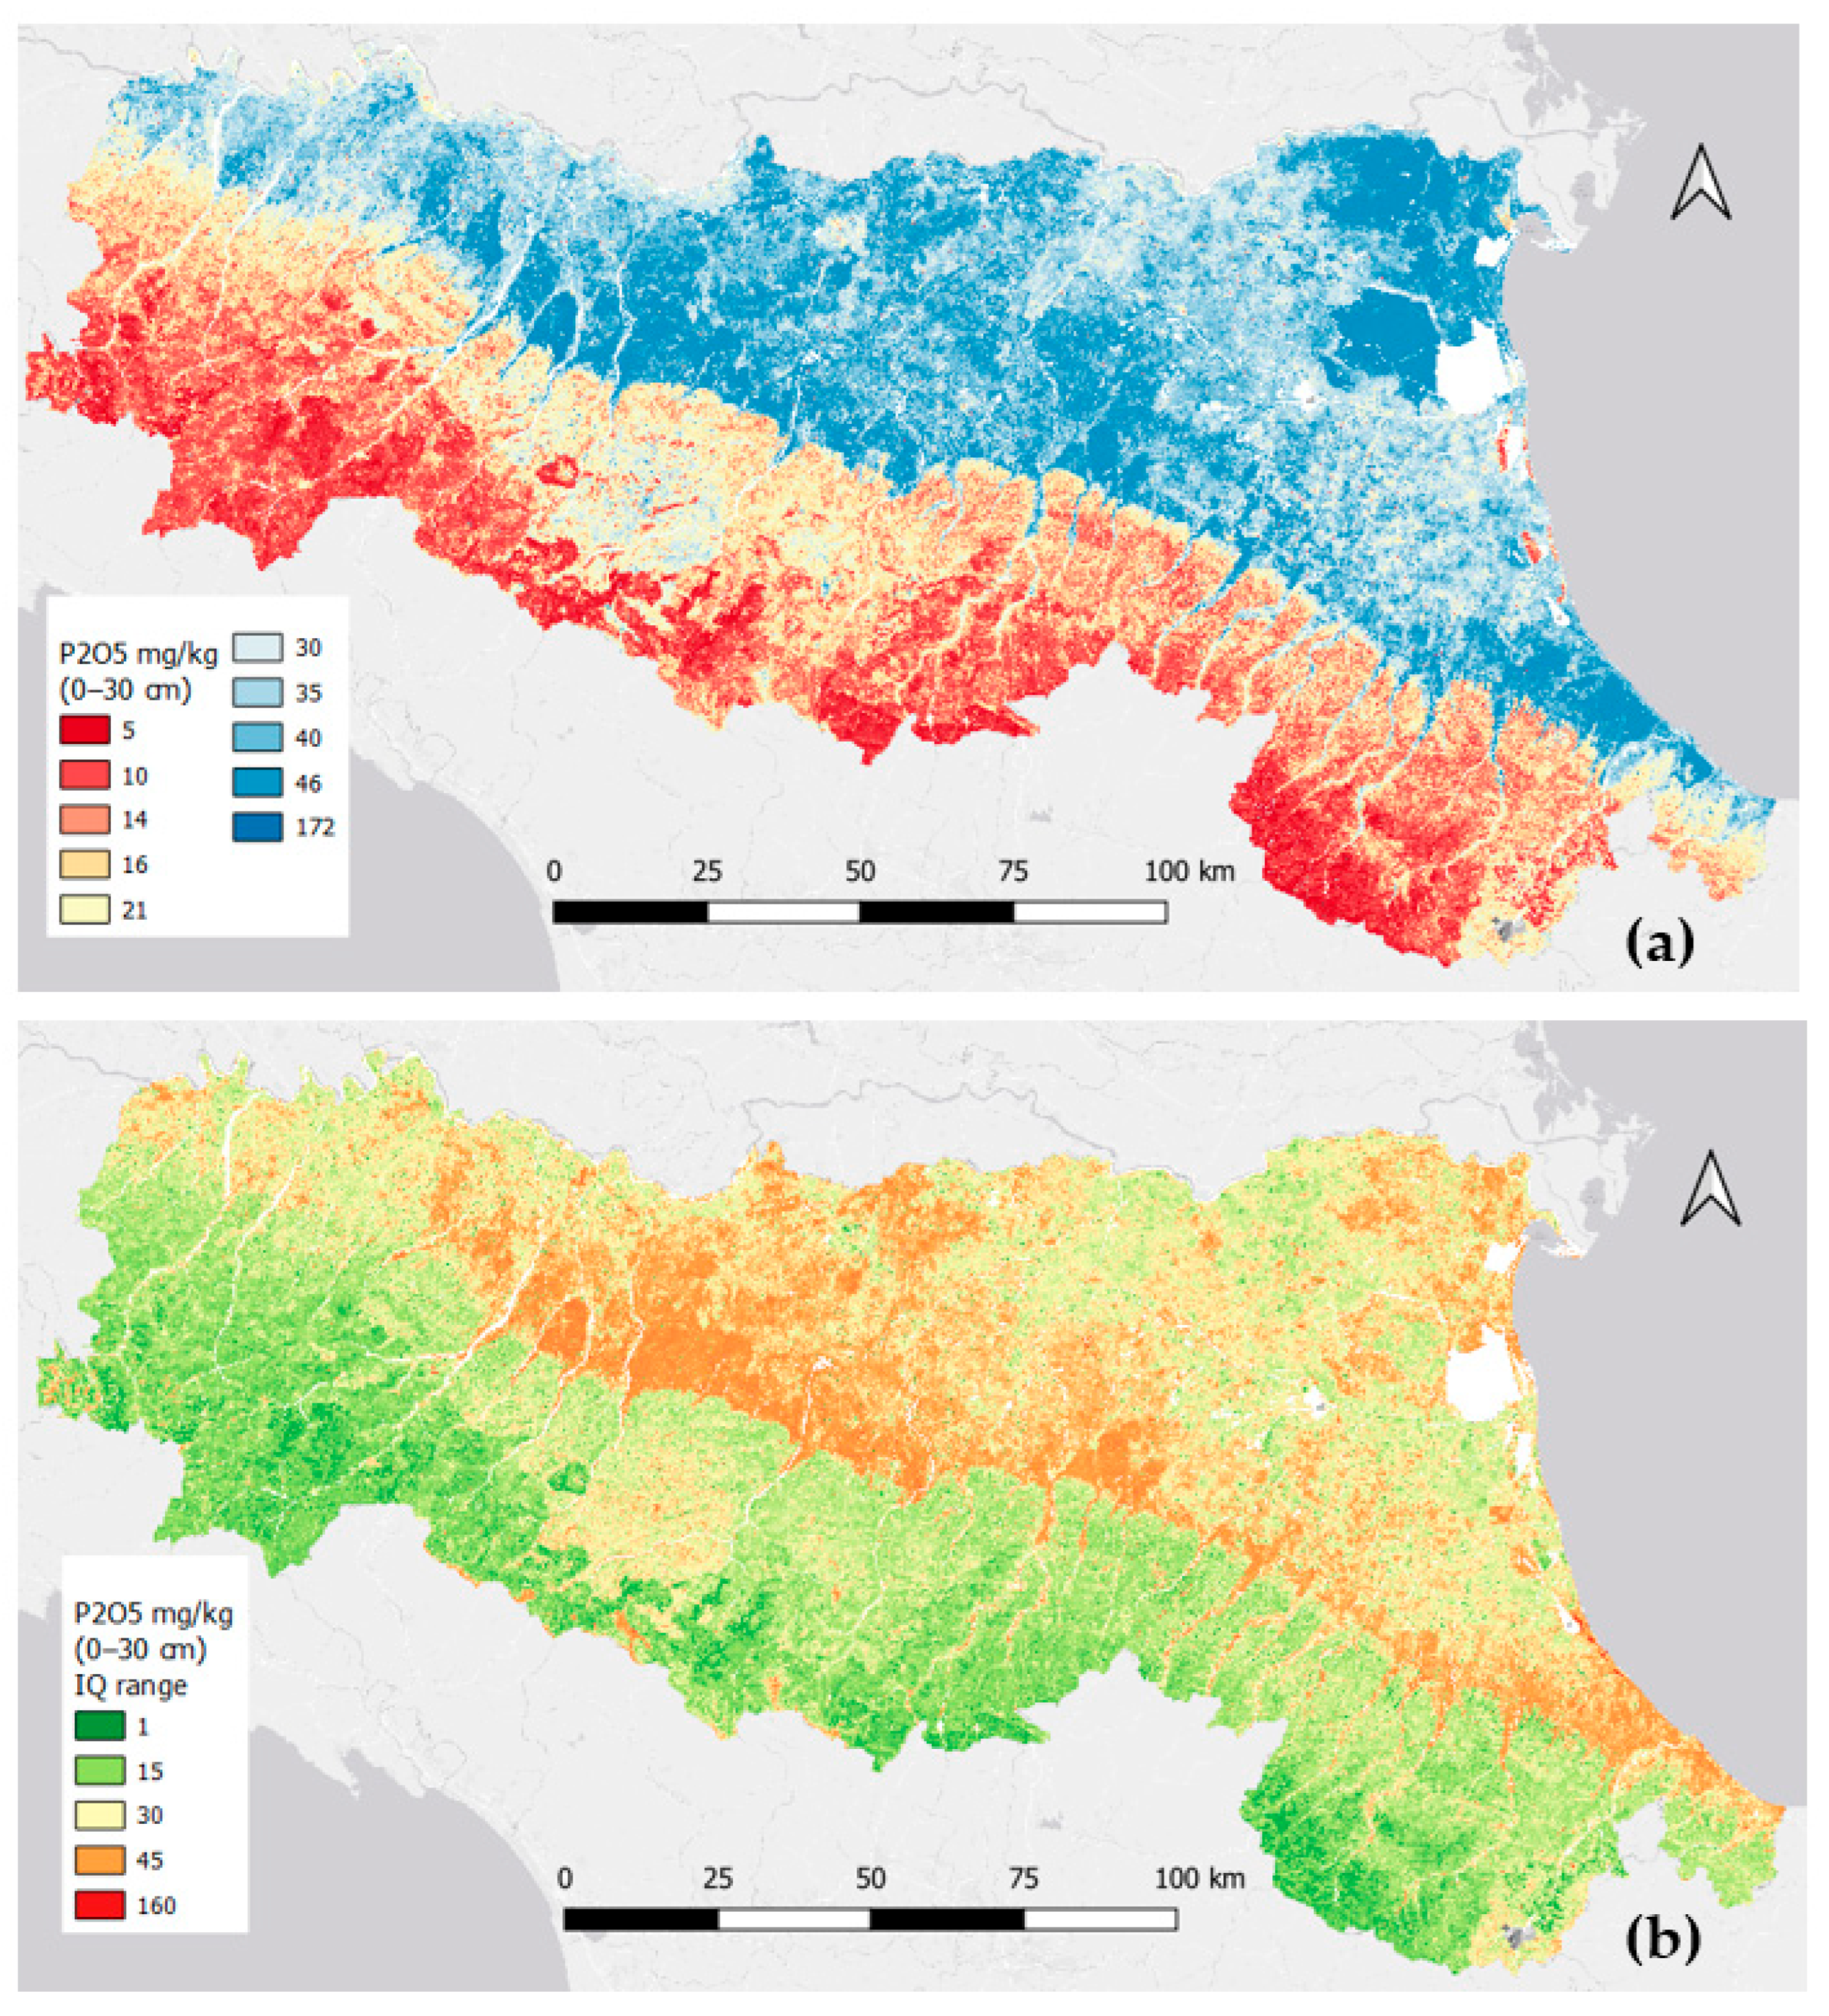
Median available P topsoil (0–30 cm) concentrations (P2O5 mg kg−1) estimated with QRF (a), and its spatial uncertainty (b).
The mean concentration of available phosphorus for the entire region is to 28.2 ± 15.5 mg kg−1 P2O5. However, this regional average is not representative, as values differ significantly between the plains (40.4 ± 11.0 mg kg−1) and the Apennines (15.2 ± 6.1 mg kg−1). Plant-available phosphorus is governed by soil properties that control its sorption and desorption, including clay mineralogy, organic matter content, soil pH, and the concentrations of exchangeable Al, Fe, and Ca [].
Within the plain, the highest P concentration are found in pedolandscape A2, which features a mean value of 60.6 ± 9.7 mg kg−1. This contrasts sharply with the other pedolandscape units, where mean P concentrations range from 33 to 47 mg kg−1 P2O5. Notably high concentrations (above 46 mg kg−1 P2O5) also occur in units A9 and A8. The soils here are completely decarbonated, have a neutral pH (6.5–7.3), and a medium to fine texture, conditions known to increase phosphorus availability. The highest values in this group are found in the soils of unit A9, particularly in the Parma and Piacenza districts (mean concentrations up to 74.3 mg kg−1), which are intensively used for horticultural crops, like tomatoes and onions.
Conversely, the soils of pedolandscape unit A10 have the second lowest mean p values in the plain (34.7 ± 12.9 mg kg−1). These soils are also decarbonated but tend towards a neutral to moderately acidic pH. While phosphorus fixation in acidic soils is a known phenomenon, the predominantly weak acidity to neutrality (pH 6–7.3) of these Alfisols suggests other factors are at play. Significant spatial variation exists within this unit: values are below average in the Bologna and Ravenna districts (24.3 and 28.6 mg kg−1, respectively) but are higher in the Reggio Emilia district (50.0 mg kg−1). These differences likely stem from variations in agronomic management; the practice of organic fertilization (manure and slurry) is more common in the Emilian districts, leading to higher topsoil organic carbon. Furthermore, soil erosion on the steeper slopes of the southern portions of this unit may also contribute to lower P concentrations [].
The lowest available P mean concentration is found in the pedolandscape A4 (33.4 ± 7.1 mg kg−1), with an increasing trend from Piacenza (29.7 ± 6.1 mg kg−1) to Ferrara (34 ± 6.2 mg kg−1). The frequent use of these soils for poplar plantations may be a contributing factor to these lower values.
Finally, similar intermediate mean values (38–40 mg kg−1) are observed in pedolandscape units A3, A6, A5, A7, and A1. These soils have a highly variable texture (from sandy to clayey) but are generally calcareous and moderate alkaline. Their consistent, moderate P levels are likely sustained by continuous fertilization linked to their intensive agricultural use.
In the four pedolandscapes of the lower Apennines, available P mean concentrations vary little (ranging from 15.6 to 18.0 mg kg−1 P2O5). The lowest values are found in the Romagna and Bologna Apennines (probably due to high erosion rates and low organic matter levels), especially in units B1 and B2, while the highest values are found in the provinces of Reggio Emilia and Parma, where they range between 20 and 21 mg kg−1. The highest values are found in the province of Rimini on the soils of pedolandscape B1 (mean value 21.4 ± 6.6 mg kg−1), which, compared to the other provinces, is characterized by more clayey soils.
In the Middle Apennines, land use becomes an important factor influencing available P concentration, as forests occupy approximately 62% of the area. Very low values (average value 10.7 ± 4.1 mg kg−1 P2O5) are found in the acidic soils of ophiolitic origin of the C5 pedolandscape unit. These are followed by the soils of the C3 unit, which are predominantly forested and often non-calcareous (average value 11.0 ± 5.8 mg kg−1) but also with some zonal variability across districts (from 9.3 ± 3.2 mg kg−1 in Forlì-Cesena to 21.1 ± 7.3 mg kg−1 in Reggio Emilia). The soils on the unstable clays of the C1 pedolandscape unit fall midway (14.1 ± 5.3 mg kg−1), with the highest concentrations in the district of Reggio Emilia (22.9 ± 5.7 mg kg−1). The soils of the C2 and C4 units have similar mean available P concentration (15.9 and 16.0 mg kg−1, respectively) but present rather different soils: the soils on the Triassic gypsum of the pedolandscape unit C4 are mostly under forest and natural vegetation while the soils on the calcareous–marly flysch of unit C2 are characterized by different land uses, including grassland and arable land.
Finally, the mean available P concentration in the pedolandscapes of the upper Apennines are particularly low, ranging from 10.0 to 11.2 mg kg−1 P2O5. Land use again plays a role here in interpreting results: forestry prevails (84% of the area), followed by pastures and meadows, while above the upper tree line, blueberry bushes and spikenard meadows predominate. Furthermore, moderately to extremely acidic soils are prevalent, especially at higher altitudes and on arenaceous lithotypes. Where medium- or fine-textured soils prevail, surface pH values are higher (neutral to slightly acidic), as in the D1 units in the district of Modena and Rimini, with mean available P concentrations of 15.0 ± 4.0 mg kg−1 and 17.0 ± 2.9 mg kg−1 respectively.
Available P mapping uncertainty in terms of amplitude of mean IQ range over the entire region is equal to 27.0 ± 12.9 mg kg−1, with the mean values for the plain (33.2 ± 12.0 mg kg−1) being notably higher than those returned for the Apennines (20.2 ± 8.2 mg kg−1). In the plain, lower uncertainty characterizes the agricultural district of Piacenza in the northwestern corner of the plain (27.8 ± 10.3 mg kg−1), while the highest IQ range mean values occur in the Reggio-Emilia district with 41.0 ± 12.3 mg kg−1 and in the Rimini district (38.3 ± 11.2 mg kg−1), at the opposite southeastern corner of the plain. The province of Reggio-Emilia exhibits the highest IQ range mean value also in the Apennine districts of the hills and of the mountains, where their values are equal to 25.0 ± 7.2 mg kg−1 and 26.5 ± 10.1 mg kg−1, respectively. The local IQ range minimum mean values are observed in the hilly district of Bologna (21.4 ± 7.9 mg kg−1) and in the mountain district of Forlì (15.5 ± 6.4 mg kg−1), where estimates for available P concentration have the lowest uncertainty of the region.
The classed uncertainty map for estimated P concentration at the municipality level, along with N and K concentrations, is provided in Figure S4 of the Supplementary Materials.
3.4. Comparing LUCAS and Regional Macronutrients Maps
Figure 8 shows the maps of topsoil macronutrients based on the LUCAS survey data at the EU-scale for Emilia-Romagna, along with the corresponding maps based on regional data (RER maps). The original RER maps of the macronutrients’ content were resampled to match the 250 m resolution of the LUCAS maps; the classes in the legends of the six maps in Figure 8 are those of the LUCAS maps []. Table 4 summarizes the raster statistics for six maps, computed over the entire region and for the two major landforms. At the regional level, macronutrient contents based on LUCAS data resulted systematically above those based on the regional datasets, with a minimum average overestimation of 17.8% in the case of K concentration and a maximum of 48.1% in the case of P; the average overestimation for N concentration in the LUCAS map was equal to 26.2%. The degree of the overestimation observed for the LUCAS-based concentration maps was significantly different in the plain and in the Apennines: in the former it ranged from 7.0% for K concentration to 42.2% for P concentrations, while in the latter the corresponding figures were 29.3% and 59.9% for K and P concentrations, respectively. As for N concentrations, the LUCAS estimates were on average 13.4% and 36% higher than the RER estimates in the plain and the Apennines, respectively.
Figure 8.
RER (a,c,e) and LUCAS (b,d,f) maps of topsoil (0–30 cm) nutrients concentrations in Emilia-Romagna: nitrogen (a,b) (g kg−1), potassium (c,d) (mg kg−1), and phosphorus (e,f) (mg kg−1).
Table 4.
Raster statistics for macronutrient maps at 250 m resolution based on LUCAS and RER datasets. Std. Dev.: standard deviation.
Figure 9 visually summarizes the differences between the maps derived from the two data sets by using violin plots, which illustrate the probability density of three macronutrient concentrations at various values, as well as the median and quartile values of the DSM estimates. In the case of N concentrations, RER estimates are characterized by a narrower IQ range that does not overlap with those of the LUCAS estimates and a more positively skewed distribution; in both cases, the distributions are markedly leptokurtic. The IQ ranges of the two K concentration distributions overlap, but the RER estimates exhibit a moderate bimodality which is not observed in the distribution of the LUCAS estimates, which are more markedly positively skewed and leptokurtic. A noticeable bimodality characterizes the distribution of the RER estimates of P concentrations, reflecting the observed difference in P concentrations between the plain and the Apennines. The distribution of the LUCAS P estimates also exhibits this feature, albeit with a significantly smoother bimodality. The LUCAS estimates are less positively skewed than the RER ones and slightly platykurtic.
Figure 9.
Violin plots displaying the spread of DSM estimates for macronutrient concentrations using the LUCAS (blue) and RER (red) datasets.
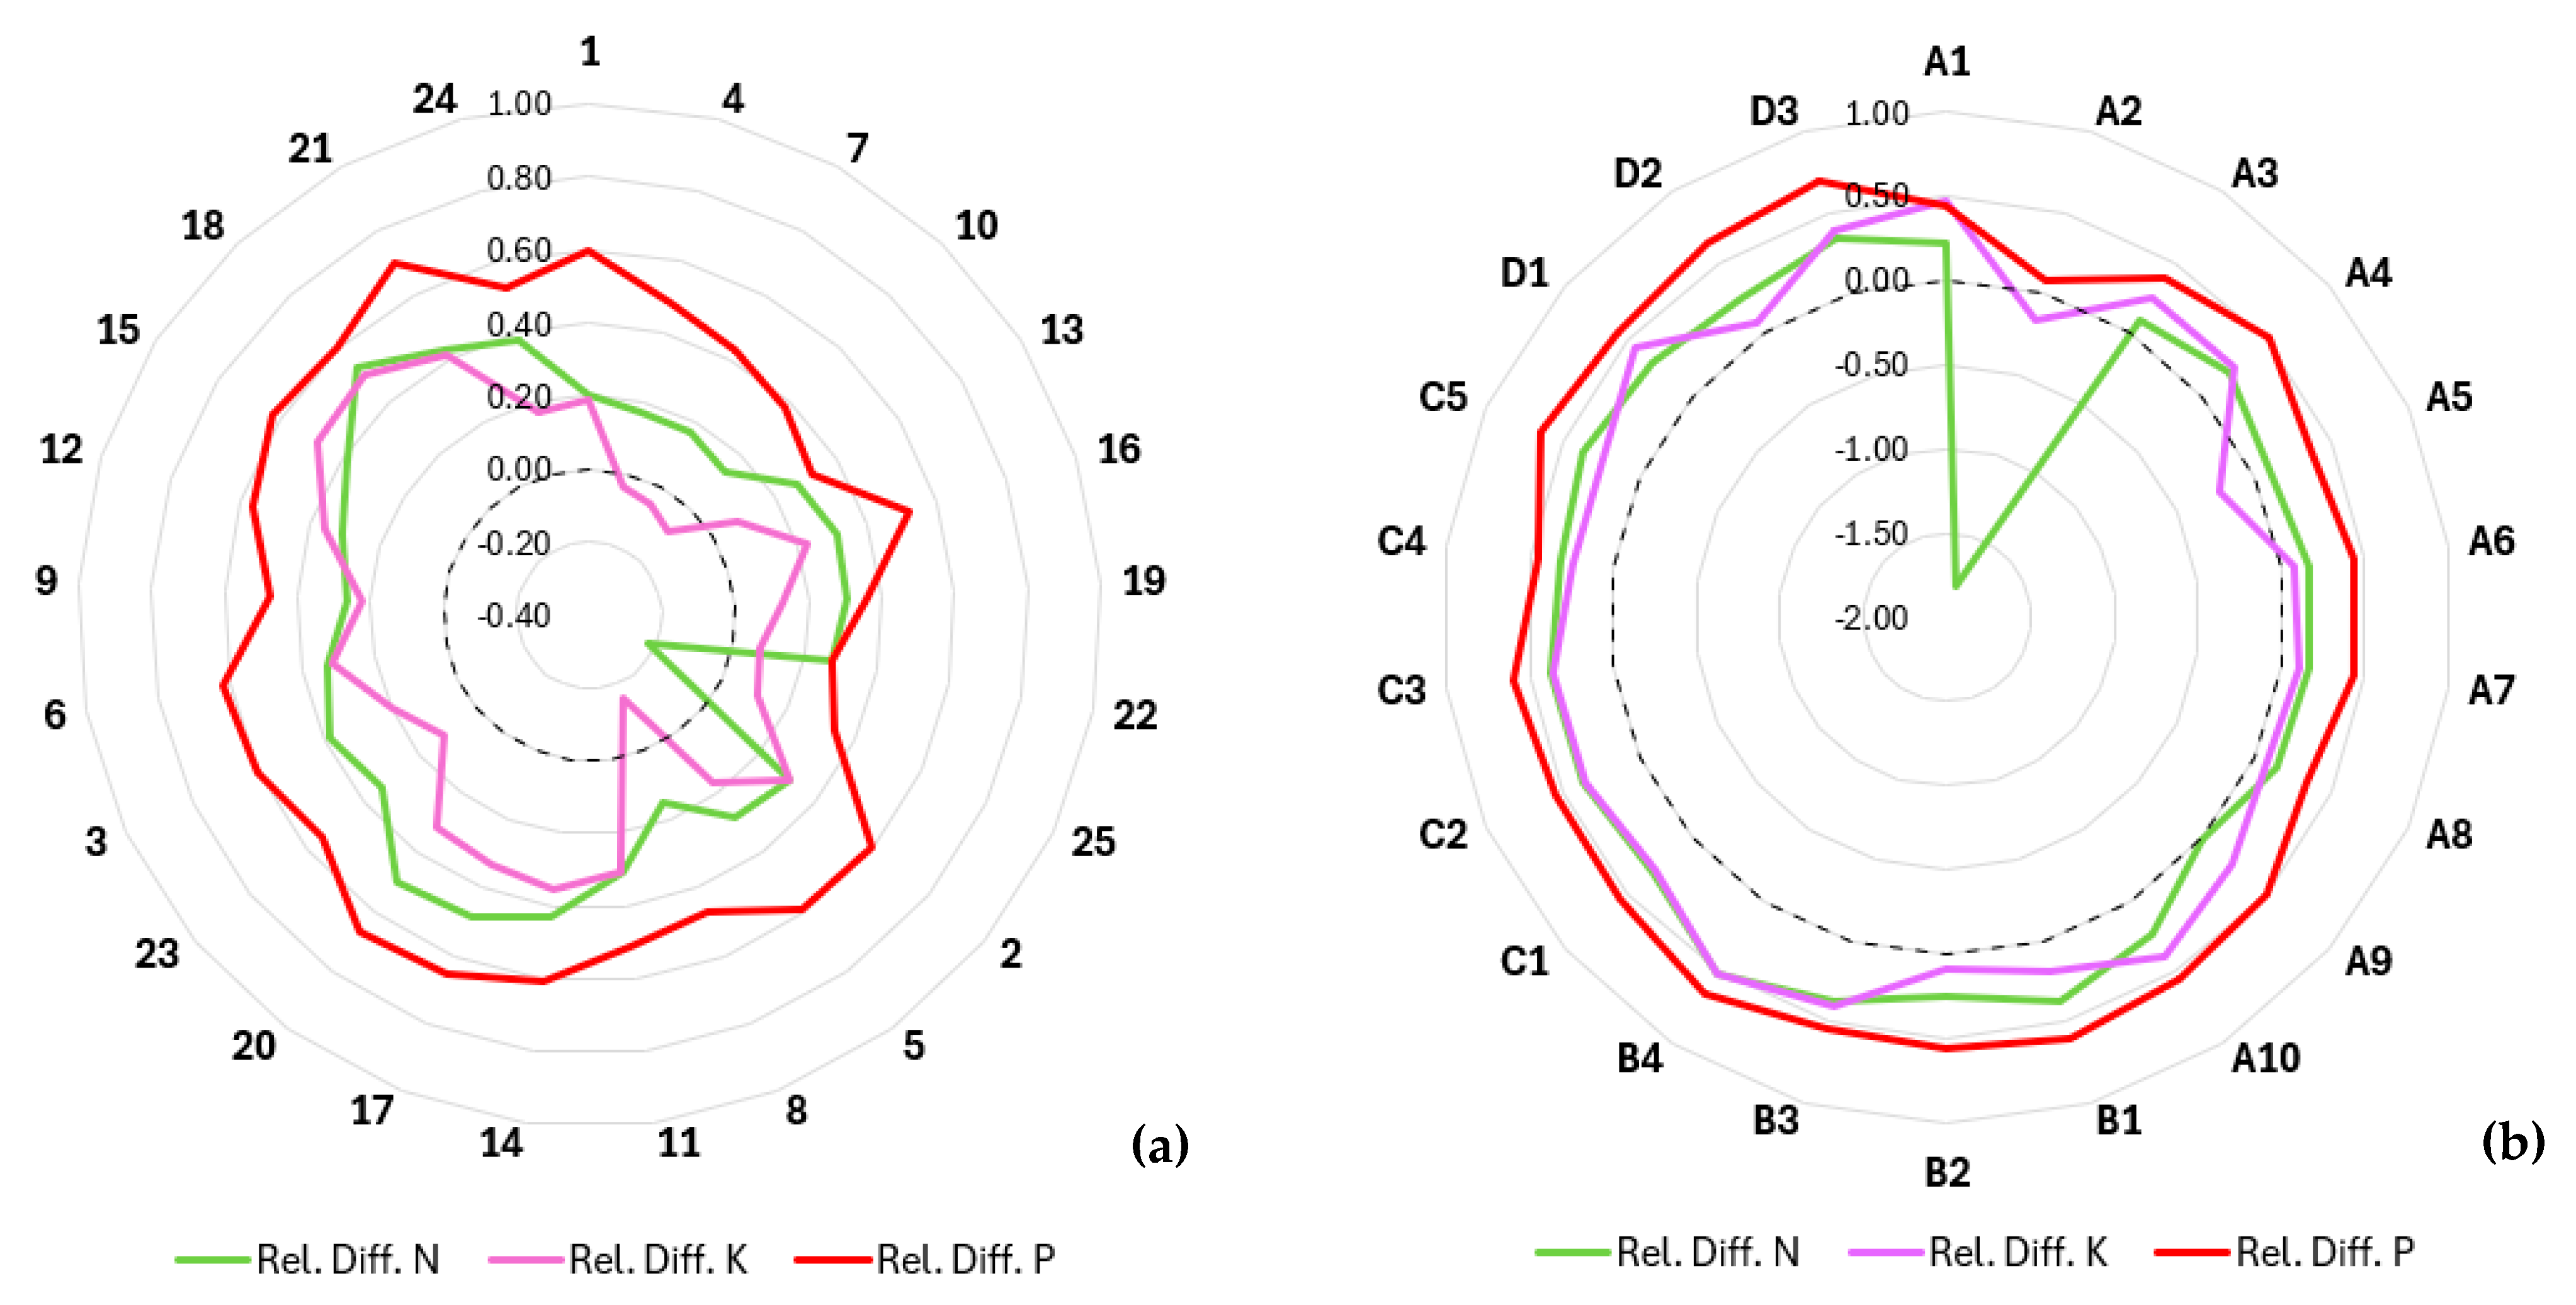
Eventually, the three macronutrient maps stemming from the LUCAS and the RER databases were compared in terms of mean concentrations in the agricultural districts and pedolandscapes of Emilia-Romagna. Figure 10 shows the radar charts of the relative difference between the LUCAS and RER DSM estimates of macronutrient concentrations, standardized over the LUCAS concentrations. In the agricultural districts of the plain, LUCAS estimates resulted systematically in higher values than the corresponding RER-based estimates, except for N concentration in the Ferrara plain (district 25), where they were 22% lower, missing the detection of large areas of reclaimed soils with peat layers characterized by the highest N concentrations of the region. On average the eastern districts of Romagna showed the largest relative differences, with values exceeding 30% in Ravenna (district 16) and Forlì (district 19). As for K concentrations in the agricultural districts of the plain, RER estimates were 4 to 8% higher than the LUCAS ones in three districts of Emilia, while in all the other sectors of the plain the opposite was observed, with larger differences in Piacenza (district 1) and Ravenna (district 16). As evident from Figure 10, in all districts, the overestimation of P topsoil concentrations based on the LUCAS database exceeded those observed for N and K, with larger relative differences in Piacenza (district 1, 60%) and Ravenna (district 16, 52%).
Figure 10.
Radar charts of the relative differences of DSM estimates of N, K, and P concentrations based on the LUCAS and RER datasets: (a) agricultural districts (see Figure 2 for legend description), (b) pedolandscapes (see Figure 1 for legend description). The dashed line marks a relative difference equal to zero.
In the agricultural districts of the lower and mid-upper Apennines, relative differences in DSM-estimated macronutrients’ concentrations followed a similar pattern, with values below or close to the average in the districts of Emilia, with a minimum in Reggio Emilia (districts 8 and 9) and a maximum in the districts of Romagna. In the lower Apennine districts, maximum relative differences were observed in Forlì (district 20), Bologna (district 14) and again in Forlì (district 20) for N (50%), K (36%), and P (67%) concentrations, respectively. In the agricultural districts of the mid-upper Apennine, maximum relative differences were observed in Ravenna (district 18) for N (53%) and K (50%), and again in Forlì (district 21) for P (70%).
In the pedolandscapes of the plain, the major difference between the LUCAS and the RER macronutrient maps was observed in the lower abandoned Po delta plain (unit A2, 512 km2, ca. 4.5% of the plain), where the widespread occurrence of reclaimed soils with organic horizons (e.g., Histic Humaquepts, Sulfic Endoaquepts, Taphto-Histic Endoaquolls, Terric Sulfisaprists, Typic Sulfihemists, and Typic Sulfisaprists, classified according to USDA Soil Taxonomy, 12th Ed.) was not acknowledged in the LUCAS macronutrient map, which severely underestimated N concentration compared to the RER map (−181%). In the same unit, K concentration was also underestimated in the LUCAS map (−16%), while P concentration was slightly overestimated (+8%). In all the other pedolandscape units of the plain, LUCAS-based maps provided higher macronutrient concentrations, notably for P contents, with relative differences ranging from 35 (unit A8) to 54% (unit A10). In the case of N and K, relative difference ranges were between 1 (unit A9) and 24% (unit A10), and 7 (unit A6) and 46% (Unit A1), respectively. However, a notable exception regarding K content is unit A5, which consists of soils in morphologically depressed areas of the lower Apennine alluvial plain (1641 km2, 14% of the plain) and is characterized by fine-textured soils with high to very high clay contents (e.g., Chromic Udic Haplusterts, Halic Endoaquerts, Sodic Endoaquerts, Udic Calciusterts, Ustic Endoaquerts, Vertic Calciustepts, and Vertic Endoaquepts, classified according to USDA Soil Taxonomy, 12th Ed.). In this pedolandscape, LUCAS-based K concentrations resulted on average 22% less than those observed in the corresponding unit of the RER-based map.
In the pedolandscapes of the Apennine, relative differences in DSM-estimated nutrient contents increased with elevation for P and K, while in the case of N a decreasing trend was observed. In the units of the lower Apennine the lowest relative differences occurred in the pedolandscape B2 and the maximum in B4 for all nutrients, with mean values ranging from 9 (K) to 55% (P) in B2 and from 51% (K) to 65% (P) in B4. In the pedolandscapes of the mid-Apennines, the smallest relative differences were detected in the unit C4 for all nutrients, with average values ranging from 25 to 46% for K and P concentration, respectively. Relative differences were largest in unit C3 for N (38%) and K (35%) contents, while unit C5 showed the largest differences in terms of P contents (65%). Eventually, in the upper-Apennine pedolandscapes the relative differences between the LUCAS- and RER-based maps were the largest for P contents, being above 60% in all units, with a maximum in D3 (69%) and a minimum in D1 (60%). The mean relative differences in estimated K contents varied greatly, ranging from 8% in unit D2 to 45% in unit D1. As already detected in most cases, relative differences in terms of N content were intermediate, ranging between 26% in unit D2 and 34% in unit D3.
Maps of the relative difference between the three concentration maps based on the LUCAS and RER datasets are shown in Figure S5 in the Supplementary Materials
4. Discussion
4.1. Model Performance and Covariate Interpretation
The results presented in the previous section confirm the predictive effectiveness of the DSM approach in estimating topsoil macronutrients’ concentrations in Emilia-Romagna. The analysis of covariates’ importance revealed that continuous soil (e.g., organic carbon, clay, sand, and pH) and categorical variables representing regional spatial trends were the most relevant predictors. This aligns with the recommendation to integrate pedological knowledge into DSM frameworks [], which not only potentially improved estimation precision but was crucial for the interpretation of the resulting spatial patterns. The limited direct relevance of Land Use Land Cover (LULC) as a categorical predictor, notable only in the Apennines, suggests that its effects were better captured by remote sensing indices and reflectance bands [,]. However, while the increasing availability and accessibility of high-resolution spectral indices derived from remote sensing offers great potential in DSM applications [], it can also result in a frequent lack of awareness of definitions and limitations, causing redundancies and inconsistencies []. Therefore, rather than employing an exhaustive set of predictors [,], we prioritized model interpretability and parsimony using a robust set of covariates tested in the region [], with feature selection guided by Recursive Feature Elimination [].
4.2. Root Causes of the LUCAS–RER Discrepancy and Its DSM Implications
The most significant finding of this study is the substantial and systematic discrepancy between the regional (RER) and continental (LUCAS) DSM products. We identify three primary root causes for this:
- Sampling density: the fundamental difference in observation density, LUCAS (~1.5 sample/200 km2) versus RER (~1.6 samples/km2), is the most critical factor. The RER dataset’s high density allows it to capture local variability and nutrient cold spots and hotspots that are statistically invisible at the LUCAS sampling density. It is noteworthy that recent research highlighted that for most soil properties, macronutrients included, the differences in survey design and sampling protocols between LUCAS and Italian methods did not lead to significant differences, showing consistency among the different sampling procedures [].
- Scale of covariates and model generalization: continental-scale models like LUCAS necessarily rely on covariates at a coarser resolution and must generalize across vastly different pedo-climatic regions. This process inherently smooths out extremes. Our regional model, using higher-resolution predictors tailored to the local context, preserves this critical fine-scale variation.
- Inability to capture specific pedolandscape units: a telling example is the failure of the LUCAS-based map to identify the high N concentrations in the organic soils of the lower Po delta plain (pedolandscape A2). This unit, covering over 500 km2, contains distinct soil types characterized by organic horizons (e.g., Histic Humaquepts and Typic Sulfisaprists) that greatly affect nutrient levels. Continental models lack the contextual knowledge and data density to represent such specific, yet extensive, features.
This discrepancy underscores a major challenge in digital soil mapping: the loss of critical information when upscaling models or applying coarse-scale products at a regional level []. Our results provide concrete evidence that accuracy and relevance are significantly enhanced when DSM is conducted at a scale commensurate with the management and policy questions being addressed.
4.3. Direct Implications for the EU Soil Monitoring Law and Regional Soil Management
The discrepancy between the datasets has profound and immediate policy implications. Using the proposed SML phosphorus threshold of 50 mg kg−1 P2O5 as a benchmark, the choice of baseline data leads to drastically different outcomes (Figure 11):
Figure 11.
Values above the SML threshold of 50 mg kg−1 P2O5 as resulting from the RER (a) and LUCAS (b) estimates.
- LUCAS baseline: would classify 92.8% of the plain and 25.0% of the Apennines as exceeding the admissible concentration.
- RER baseline: suggests only 16.05% of the plain and 0.11% of the Apennines are above this threshold.
This represents a potential misclassification of over 76% of the plain’s agricultural area, which would have severe consequences for farmers, land managers, and the perceived severity of phosphorus-related environmental risk in the region. While the “one-out, all-out” principle may have been removed from the final SML text, the definition of reference baselines remains a cornerstone of the legislation. Our study demonstrates that adopting a baseline based on continental-scale assessment could lead to inappropriate regulatory pressures and misdirected resources.
Therefore, the findings strongly advocate for a hybrid approach to DSM. The “top-down” paradigm of continental models, like LUCAS and SoilGrids [], should be systematically integrated with “bottom-up,” regionally coordinated efforts. Initiatives such as the FAO-Global Soil Partnership‘s soil organic carbon map [] and the EU-funded EJPSOIL project [] champion this very concept, promoting participatory, multi-scale data collection that leverages local knowledge and priorities. Our RER baseline illustrates the relevance of such integration. The future of robust soil governance under the SML lies not in choosing one scale over the other, but in creating a framework where continental models provide the broad context and regional baselines, like the one presented here, provide the essential, high-fidelity data for effective local implementation and validation at the level of the soil districts foreseen by the SML proposal [].
4.4. Communication of Uncertainty and Study Limitations
To enhance the practical utility of our maps, we coupled concentration estimates with spatial uncertainty based on QRF prediction intervals []. In line with best practices for communicating with end-users [,], we aggregated and presented this uncertainty at the municipality level (Figure S4). This supports risk-aware decision-making in land planning and can guide future targeted sampling campaigns to enhance survey efficiency [].
This study has two major limitations. First, due to the long time span of the data used in this study, it was not possible to assess temporal dynamics within the study area, because the data grouped by survey time (e.g., by decades) were also spatially clustered from successive surveys. This limitation is often encountered in DSM applications [,] as data are mostly collected and analyzed for several purposes apart from solely mapping soil properties. This limitation indeed prevented the analysis of the changes in soil nutrients’ status and the assessment of the impact of land use history.
Second, the focus is exclusively on the topsoil (0–30 cm), as most data were sourced from agricultural fertilization planning. Only about 12% of the available data provide information on subsoil macronutrient concentrations, and future work will focus on extending this framework to subsoil nutrients.
5. Conclusions
This study effectively generated high-resolution (100 m), uncertainty-quantified maps of topsoil macronutrients (N, P, and K) for the Emilia-Romagna region, providing a robust baseline for soil fertility assessment and monitoring. The key conclusions are as follows:
- The DSM approach using Quantile Random Forests proved highly effective, with models demonstrating excellent performance (R2 ≥ 0.9) and identifying soil organic carbon and texture as the dominant controls on macronutrient spatial patterns.
- A critical comparison with the continental-scale LUCAS-based maps revealed significant systematic overestimations by LUCAS, particularly for phosphorus (48% at regional level), and a failure to detect important local features, such as nutrient hotspots in organic soils.
- The root of this discrepancy lies in the extremely different sampling densities, the scale of environmental covariates, and the inability of continental models to capture specific soil–landscape relationships.
- The practical implications are substantial: the choice of baseline data dramatically alters the assessment of soil quality against regulatory thresholds, as demonstrated for the EU Soil Monitoring Law. Relying solely on continental-scale data for regional policy implementation carries a high risk of misinformed decisions.
In conclusion, while continental-scale models like LUCAS are valuable for broad-scale assessments, they are insufficient for regional-scale land management and policy. Our results highlight one of the potential difficulties in the actual implementation of the Soil Monitoring Law resulting from the absence of soil information of adequate detail at the level of the soil districts identified by member states as required by the proposal. This eventually would lead to possible differences among and within member states in its implementation. Our work underscores the indispensable need for the integration of high-resolution, region-specific soil data to ensure the accurate and effective implementation of environmental regulations like the EU Soil Monitoring Law.
Supplementary Materials
The following supporting information can be downloaded at: https://www.mdpi.com/article/10.3390/land14112142/s1, Table S1: Dominant soils occurring in the pedolandscape units of Emilia-Romagna. Soil are classified according to Soil Taxonomy (Soil Survey Staff, 2014, Keys to Soil Taxonomy. 12th Edition, USDA-NRCS, Washington DC). The soil classifications are listed in order of prevalence. Table S2: Mean and median macronutrients’ concentrations over five sampling periods. Figure S1: Distribution of the FAO-WRB Major Soil Groups in the pedolandscapes of Emilia-Romagna. Figure S2: Location of macronutrients sampling points over time. Figure S3: Location of the LUCAS points (n = 117) in the pedolandscapes of Emilia-Romagna. Figure S4: Classed uncertainty maps at municipality level for DSM macronutrients estimates: (a) Nitrogen, (b) Potassium, (c) Phosphorus. The five uncertainty classes are based on the ventiles of the distribution of the IQ range values. Figure S5. Relative differences in estimated macronutrient concentrations between the LUCAS and the RER datasets: (a) Nitrogen, (b) Potassium, (c) Phosphorus. Relative differences are calculated for each cell of the 250m estimation grid as [LUCAS -RER]/[LUCAS].
Author Contributions
Conceptualization, P.T. and F.U.; methodology, F.U. and P.T.; software, F.U. and P.T.; validation, P.T.; formal analysis, F.U., investigation, F.U., P.T. and A.A.; resources, P.T.; data curation, F.U. and P.T.; writing—original draft preparation, F.U.; writing—review and editing, P.T. and A.A.; visualization, F.U. and P.T.; supervision, F.U. and P.T.; project administration, P.T.; funding acquisition, P.T. All authors have read and agreed to the published version of the manuscript.
Funding
This research was funded by Emilia-Romagna Region (RER)—General Directorate for Environment and Land Care—Geological, Seismic and Soil Service, grant n. 558 26/04/2021, within the framework of the RER-CNR four years research agreement “Digital soil mapping applications for ecosystem services assessment and climate change strategy support and knowledge tools to support the EU Nitrates Directive”.
Data Availability Statement
The 1:50,000 soil map of Emilia Romagna (Ed. 2021) is available for download at the following link: https://mappegis.regione.emilia-romagna.it/moka/ckan/suolo/Carta_Suoli_50k.zip (accessed on 9 October 2025), while the maps of soil macronutrients are downloadable from the following web pages: N: https://mappegis.regione.emilia-romagna.it/moka/ckan/suolo/Azoto_N_totale_0_30_cm_rst.zip (accessed on 9 October 2025); K: https://mappegis.regione.emilia-romagna.it/moka/ckan/suolo/Potassio_K_scambiabile_0_30_cm_rst.zip (accessed on 9 October 2025); P: https://mappegis.regione.emilia-romagna.it/moka/ckan/suolo/Fosforo_P_assimilabile_0_30_cm_rst.zip (accessed on 9 October 2025). All the maps are also available via WMS service (URL: https://servizigis.regione.emilia-romagna.it/wms/suoli (accessed on 9 October 2025)).
Acknowledgments
The authors wish to thank the CNR-IBE and RER office staff for all the administrative work and the technical support allowing the accomplishment of the research activities. The authors would like also to thank Giampaolo Sarno and Chiara Ferronato of the Sustainable Agriculture Area of the Programming, Territorial Development and Production Sustainability Sector—Emilia-Romagna Region for contributing to the discussion of the results. The Authors wish to express their gratitude to the anonymous reviewers who provided insightful comments and constructive criticisms. Their feedback was precious in significantly improving the quality, clarity, and impact of the manuscript.
Conflicts of Interest
The authors declare no conflicts of interest.
Abbreviations
The following abbreviations are used in this manuscript:
| AE | Absolute Error |
| EC | European Commission |
| EPSG | European Petroleum Survey Group |
| EU | European Union |
| DEM | Digital Elevation Model |
| DSM | Digital Soil Mapping |
| IoA | Index of Agreement |
| IQ range | Interquartile range |
| ISO | International Organization for Standardization |
| LUCAS | Land Use/Cover Area frame statistical Survey |
| LULC | Land Use Land Cover class(es) |
| ME | Mean Error |
| ML | Machine Learning |
| MS | Member States |
| NDVI | Normalized Difference Vegetation Index |
| NDSI | Normalized Difference Soil Index |
| NDWI | Normalized Difference Water Index |
| NUTS | Nomenclature of Territorial Units for Statistics |
| QRF | Quantile Random Forest |
| RER | Regione Emilia-Romagna |
| RFE | Recursive Feature Elimination |
| RMSE | Rooted Mean Square Error |
| RUSLE | Revised Universal Soil Loss Equation |
| SML | Soil Monitoring Law |
| SOSI | Soil Salinity Index |
References
- Arias-Navarro, C.; Baritz, R.; Jones, A. (Eds.) The State of Soils in Europe—Fully Evidenced, Spatially Organized Assessment of the Pressures Driving Soil Degradation; Publications Office of the European Union: Luxembourg, 2024. [Google Scholar] [CrossRef]
- Soil Monitoring in Europe-Indicators and Thresholds for Soil Health Assessments; EEA Report 08/2022; European Environment Agency: Copenhagen, Denmark, 2023. [CrossRef]
- White, A.; Faulkner, J.W.; Conner, D.; Barbieri, L.; Adair, E.C.; Niles, M.T.; Mendez, V.E.; Twombly, C.R. Measuring the Supply of Ecosystem Services from Alternative Soil and Nutrient Management Practices: A Transdisciplinary, Field-Scale Approach. Sustainability 2021, 13, 10303. [Google Scholar] [CrossRef]
- Hou, D. Soil health and ecosystem services. Soil Use Manag. 2023, 39, 1259–1266. [Google Scholar] [CrossRef]
- Van Groenigen, J.W.; Van Kessel, C.; Hungate, B.A.; Oenema, O.; Powlson, D.S.; Van Groenigen, K.J. Sequestering Soil Organic Carbon: A Nitrogen Dilemma. Environ. Sci. Technol. 2017, 51, 4738–4739. [Google Scholar] [CrossRef]
- Oenema, O.; van Liere, L.; Schoumans, O. Effects of lowering nitrogen and phosphorus surpluses in agriculture on the quality of groundwater and surface water in the Netherlands. J. Hydrol. 2005, 304, 289–301. [Google Scholar] [CrossRef]
- Vigiak, O.; Udías, A.; Grizzetti, B.; Zanni, M.; Aloe, A.; Weiss, F.; Hristov, J.; Bisselink, B.; de Roo, A.; Pistocchi, A. Recent regional changes in nutrient fluxes of European surface waters. Sci. Total Environ. 2023, 858, 160063. [Google Scholar] [CrossRef]
- Pandao, M.R.; Akshay, A.T.; Rupeshkumar, J.C.; Nagesh, R.N.; Dhananjay, D.S.; Sindhu, R.R. Soil Health and Nutrient Management. Int. J. Plant Soil Sci. 2024, 36, 873–883. [Google Scholar] [CrossRef]
- Țopa, D.-C.; Căpșună, S.; Calistru, A.-E.; Ailincăi, C. Sustainable Practices for Enhancing Soil Health and Crop Quality in Modern Agriculture: A Review. Agriculture 2025, 15, 998. [Google Scholar] [CrossRef]
- Virto, I.; Imaz, M.J.; Fernández-Ugalde, O.; Gartzia-Bengoetxea, N.; Enrique, A.; Bescansa, P. Soil Degradation and Soil Quality in Western Europe: Current Situation and Future Perspectives. Sustainability 2015, 7, 313–365. [Google Scholar] [CrossRef]
- Zhang, S. Heterogeneity of Soil Nutrients: A Review of Methodology, Variability and Impact Factors. J. Environ. Earth Sci. 2019, 1, 6–28. [Google Scholar] [CrossRef]
- European Commission. Proposal for a Directive on Soil Monitoring and Resilience. 416 (Final). 2023. Available online: https://environment.ec.europa.eu/publications/proposal-directive-soil-monitoring-and-resilience_en (accessed on 5 July 2025).
- Panagos, P.; Jones, A.; Lugato, E.; Ballabio, C. A Soil Monitoring Law for Europe. Glob. Chall. 2025, 9, 2400336. [Google Scholar] [CrossRef]
- McBratney, A.B.; Mendonça Santos, M.L.; Minasny, B. On digital soil mapping. Geoderma 2003, 117, 3–52. [Google Scholar] [CrossRef]
- Wadoux, A.M.C.; Minasny, B.; McBratney, A.B. Machine learning for digital soil mapping: Applications, challenges and suggested solutions. Earth-Sci. Rev. 2020, 210, 103359. [Google Scholar] [CrossRef]
- Arrouays, D.; McBratney, A.; Bouma, J.; Libohova, Z.; Richer-de-Forges, A.C.; Morgan, C.L.S.; Roudier, P.; Poggio, L.; Mulder, V.L. Impressions of digital soil maps: The good, the not so good, and making them ever better. Geoderma Reg. 2020, 20, e00255. [Google Scholar] [CrossRef]
- Ballabio, C.; Lugato, E.; Fernández-Ugalde, O.; Orgiazzi, A.; Jones, A.; Borrelli, P.; Montanarella, L.; Panagos, P. Mapping LUCAS topsoil chemical properties at European scale using Gaussian process regression. Geoderma 2019, 355, 113912. [Google Scholar] [CrossRef]
- Implementation of Council Directive 91/676/EEC Concerning the Protection of Waters Against Pollution Caused by Nitrates from Agricultural Sources; Synthesis from year 2000 Member States Reports; EC, Office for Official Publications of the European Communities: Luxembourg, 2002; ISBN 92-894-4103-8.
- Common Implementation Strategy for the Water Framework Directive (2000/60/EC); Guidance Document No 7. Monitoring under the Water Framework Directive. Produced by Working Group 2.7-Monitoring; EC, Office for Official Publications of the European Communities: Luxembourg, 2003; ISBN 92-894-5127-0.
- Directive 2006/118/EC of the European Parliament and of the Council of 12 December 2006 on the Protection of Groundwater Against Pollution and Deterioration. EC, 2006. Official Journal of the European Union. 27 December 2006. L372. pp. 19–31. Available online: https://eur-lex.europa.eu/eli/dir/2006/118/oj/eng (accessed on 9 October 2025).
- Report from the Commission to the Council and the European Parliament on the Implementation of Council Directive 91/676/EEC Concerning the Protection of Waters Against Pollution Caused by Nitrates from Agricultural Sources Based on Member State Reports for the Period 2016–2019. EC, 2021, Brussels, 11.10.2021, COM(2021) 1000 Final. Available online: https://eur-lex.europa.eu/legal-content/EN/TXT/?uri=celex:52021DC1000 (accessed on 9 October 2025).
- de Vries, W.; Schulte-Uebbing, L.; Kros, H.; Voogd, J.C.; Louwagie, G. Spatially explicit boundaries for agricultural nitrogen inputs in the European Union to meet air and water quality targets. Sci. Total Environ. 2021, 786, 147283. [Google Scholar] [CrossRef] [PubMed]
- Regulation (EC) No 1059/2003 of the European Parliament and of the Council of 26 May 2003 on the Establishment of a Common Classification of Territorial Units for Statistics (NUTS). Available online: https://eur-lex.europa.eu/legal-content/EN/TXT/?qid=1405939838475&uri=CELEX:32003R1059 (accessed on 4 July 2025).
- Antolini, G.; Pavan, V.; Tomozeiu, R.; Marletto, V. Atlante Idroclimatico Dell’emilia-Romagna 1961–2015, 2017. ISBN 978-88-87854-44-2. Available online: https://www.arpae.it/it/temi-ambientali/clima/rapporti-e-documenti/atlante-climatico (accessed on 3 October 2025).
- Regione Emilia-Romagna. Carta dei Suoli Della Regione Emilia-Romagna in Scala 1: 50.000. Edizione 2021. Available online: https://geo.regione.emilia-romagna.it/gstatico/documenti/dati_pedol/carta_suoli_50k.pdf (accessed on 10 July 2025).
- Garberi, M.L.; Lenzi, D.; Mariani, M.C.; Masi, S.; Orlandi, F.; Vigilante, E. Database Uso del Suolo di Dettaglio 2017–Documentazione Regione Emilia-Romagna, Servizio Statistica e Sistemi Informativi Geografici, 2020. Available online: https://geoportale.regione.emilia-romagna.it/approfondimenti/contenuti-allegati/documentazione-uso-del-suolo/capitolato-tecnico-uso-suolo-dettaglio-2017-ed-2021.pdf (accessed on 10 July 2025).
- Schipani, T.; Censi, D.; Laruccia, N.; Rossi, R.; Solferini, A.; D’Aloia, M.; Michetti, M. Analisi del Sistema Agricolo, Agroindustriale e del Territorio Rurale Dell’emilia-Romagna. Regione Emilia-Romagna Servizio Programmazione e Sviluppo Locale Integrato e ART_ER S. cons. p.a. 2022. Available online: https://agricoltura.regione.emilia-romagna.it/pac-2023-2027/documenti/analisi-del-sistema/analisi-contesto.pdf/@@download/file/Analisi%20contesto.pdf (accessed on 10 July 2025).
- Minister for Agricultural Policies. Approval of the Official Methods for Soil Chemical Analysis. Ministerial Decree of September 13, 1999, GU n. 248 del 2110.1999-S.O. n.185. Available online: https://www.certifico.com/component/attachments/download/32182 (accessed on 11 July 2025).
- ISO 1871:2009; Food and Feed Products—General Guidelines for the Determination of Nitrogen by the Kjeldahl Method. International Organization for Standardization: Geneva, Switzerland, 2009.
- ISO 11263:1994; Soil Quality—Determination of Phosphorus—Spectrometric Determination of Phosphorus Soluble in Sodium Hydrogen Carbonate Solution. International Organization for Standardization: Geneva, Switzerland, 1994.
- ISO 22171:2023; Soil Quality—Determination of Potential Cation Exchange Capacity (CEC) and Exchangeable Cations Buffered at pH 7, Using a Molar Ammonium Acetate Solution. International Organization for Standardization: Geneva, Switzerland, 2023.
- Bishop, T.F.A.; McBratney, A.B.; Laslett, G.M. Modelling soil attribute depth functions with equal-area quadratic smoothing splines. Geoderma 1999, 91, 27–45. [Google Scholar] [CrossRef]
- Malone, B.P.; McBratney, A.B.; Minasny, B.; Laslett, G.M. Mapping continuous depth functions of soil carbon storage and available water capacity. Geoderma 2009, 154, 138–152. [Google Scholar] [CrossRef]
- R Core Team. R: A Language and Environment for Statistical Computing; R Foundation for Statistical Computing. Vienna, Austria, 2021. Available online: https://www.R-project.org/ (accessed on 9 October 2025).
- Wang, W.; Yan, J. Shape-Restricted Regression Splines with R Package splines2. J. Data Sci. 2021, 19, 498–517. [Google Scholar] [CrossRef]
- Rosner, B. Percentage Points for a Generalized ESD Many-Outlier Procedure. Technometrics 1983, 25, 165–172. [Google Scholar] [CrossRef]
- EPSG:7791; RDN2008/UTM Zone 32N. EPSG Geodetic Parameter Dataset. Geodesy Subcommittee of the IOGP Geomatics Committee: London, UK, 2016.
- Genova, G.; Poggio, L.; Kempen, B.; Colman, B. DSM Workflow Seedling v.0.3.6. 2024, ISRIC—World Soil Information. Available online: https://git.wur.nl/isric/dsm-general/dsm.workflows/seedling/-/tree/0.3.6 (accessed on 21 August 2025).
- Breiman, L. Random Forests. Mach. Learn. 2001, 45, 5–32. [Google Scholar] [CrossRef]
- Meinshausen, N. Quantile regression forests. J. Mach. Learn. Res. 2006, 7, 983–999. Available online: https://www.jmlr.org/papers/volume7/meinshausen06a/meinshausen06a.pdf (accessed on 21 August 2025).
- Wright, M.N.; Ziegler, A. Ranger: A fast implementation of random forests for high dimensional data in c++ and r. J. Stat. Softw. 2017, 77, 1–17. [Google Scholar] [CrossRef]
- Willmott, C.J. On the validation of models. Phys. Geogr. 1981, 2, 184–194. [Google Scholar] [CrossRef]
- Gorelick, N.; Hancher, M.; Dixon, M.; Ilyushchenko, S.; Thau, D.; Moore, R. Google Earth Engine: Planetary-scale geospatial analysis for everyone. Remote Sens. Environ. 2017, 202, 18–27. [Google Scholar] [CrossRef]
- Ungaro, F.; Tarocco, P.; Calzolari, C. Leveraging Soil Geography for Land Use Planning: Assessing and Mapping Soil Ecosystem Services Indicators in Emilia-Romagna, NE Italy. Geographies 2025, 5, 39. [Google Scholar] [CrossRef]
- Staffilani, F. Carta Dell’erosione Idrica Attuale Della Regione Emilia-Romagna. Note Illustrative, Edizione 2019. Available online: https://mappegis.regione.emilia-romagna.it/gstatico/documenti/dati_pedol/NOTE_ILLUSTRATIVE_EROSIONE.pdf (accessed on 25 August 2025).
- Kuhn, M. Building Predictive Models in R Using the caret Package. J. Stat. Softw. 2008, 28, 1–26. [Google Scholar] [CrossRef]
- Prisca, D.J.; Osumanu, H.A.; Latifah, O.; Aainaa, H. Phosphorus Transformation in Soils Following Co-Application of Charcoal and Wood Ash. Agronomy 2021, 11, 2010. [Google Scholar] [CrossRef]
- Alewell, C.; Ringeval, B.; Ballabio, C.A.; Robinson, D.A.; Panagos, P.; Borrelli, P. Global phosphorus shortage will be aggravated by soil erosion. Nat. Commun. 2020, 11, 4546. [Google Scholar] [CrossRef]
- Chen, S.; Arrouays, D.; Mulder, V.L.; Poggio, L.; Minasny, B.; Roudier, P.; Libohova, Z.; Lagacherie, P.; Shi, Z.; Hannam, J.; et al. Digital mapping of GlobalSoilMap soil properties at a broad scale: A review. Geoderma 2022, 409, 115567. [Google Scholar] [CrossRef]
- Mashala, M.J.; Dube, T.; Mudereri, B.T.; Ayisi, K.K.; Ramudzuli, M.R. A Systematic Review on Advancements in Remote Sensing for Assessing and Monitoring Land Use and Land Cover Changes Impacts on Surface Water Resources in Semi-Arid Tropical Environments. Remote Sens. 2023, 15, 3926. [Google Scholar] [CrossRef]
- Alawode, G.L.; Oluwajuwon, T.V.; Hammed, R.A.; Olasuyi, K.E.; Krasovskiy, A.; Ogundipe, O.C.; Kraxner, F. Spatiotemporal assessment of land use land cover dynamics in Mödling district, Austria, using remote sensing techniques. Heliyon 2025, 11, e43454. [Google Scholar] [CrossRef]
- Abdulraheem, M.I.; Zhang, W.; Li, S.; Moshayedi, A.J.; Farooque, A.A.; Hu, J. Advancement of Remote Sensing for Soil Measurements and Applications: A Comprehensive Review. Sustainability 2023, 15, 15444. [Google Scholar] [CrossRef]
- Chen, Q.; Vaudour, E.; Richer-de-Forges, A.C.; Arrouays, D. Spectral indices in remote sensing of soil: Definition, popularity, and issues. A critical overview. Remote Sens. Environ. 2025, 329, 114918. [Google Scholar] [CrossRef]
- Nussbaum, M.; Spiess, K.; Baltensweiler, A.; Grob, U.; Keller, A.; Greiner, L.; Schaepman, M.E.; Papritz, A. Evaluation of digital soil mapping approaches with large sets of environmental covariates. SOIL 2018, 4, 1–22. [Google Scholar] [CrossRef]
- Dash, P.K.; Ferhatoglu, C.; Miller, B.A.; Panigrahi, N.; Mishra, A. Influence of sample size and machine learning algorithms on digital soil nutrient mapping accuracy. Environ. Monit. Assess. 2025, 197, 996. [Google Scholar] [CrossRef]
- Kasraei, B.; Schmidt, M.G.; Zhang, J.; Bulmer, C.E.; Filatow, D.S.; Arbor, A.; Pennell, T.; Heung, B. A framework for optimizing environmental covariates to support model interpretability in digital soil mapping. Geoderma 2024, 445, 116873. [Google Scholar] [CrossRef]
- Del Duca, S.; Tondini, E.; Vitali, F.; Lumini, E.; Garlato, A.; Vinci, I.; Tagliaferri, E.; Brenna, S.; Motta, S.; Maillet, E.; et al. Comparison of LUCAS and Italian Sampling Procedures for Harmonising Physicochemical and Biological Soil Health Indicators. Eur. J. Soil Sci. 2025, 76, e70108. [Google Scholar] [CrossRef]
- Lagacherie, P. Operational Digital Soil Mapping: Achievements, Challenges and Future Strategies to Go Beyond. Eur. J. Soil Sci. 2025, 76, e70139. [Google Scholar] [CrossRef]
- Poggio, L.; de Sousa, L.M.; Batjes, N.H.; Heuvelink, G.B.M.; Kempen, B.; Ribeiro, E.; Rossiter, D. SoilGrids 2.0: Producing soil information for the globe with quantified spatial uncertainty. SOIL 2021, 7, 217–240. [Google Scholar] [CrossRef]
- FAO and ITPS. 2018. Global Soil Organic Carbon Map (GSOCmap) Technical Report; FAO and ITPS: Rome, Italy, 2018; p. 162. ISBN 978-92-5-130439-6. Available online: https://openknowledge.fao.org/handle/20.500.14283/i8891en (accessed on 2 October 2025).
- Froger, C.; Tondini, E.; Arrouays, D.; Oorts, K.; Poeplau, C.; Wetterlind, J.; Putku, E.; Saby, N.P.A.; Fantappiè, M.; Styc, Q.; et al. Comparing LUCAS Soil and national systems: Towards a harmonized European Soil monitoring network. Geoderma 2024, 449, 117027. [Google Scholar] [CrossRef]
- Wadoux, A.M.J.-C.; Courteille, L.; Arrouays, D.; De Carvalho Gomes, L.; Cortet, J.; Creamer, R.E.; Eberhardt, E.; Greve, M.H.; Grüneberg, E.; Harhoff, R.; et al. On soil districts. Geoderma 2024, 452, 117065. [Google Scholar] [CrossRef]
- Kasraei, B.; Heung, B.; Saurette, D.D.; Schmidt, M.G.; Bulmer, C.E.; Bethel, W. Quantile regression as a generic approach for estimating uncertainty of digital soil maps produced from machine-learning. Environ. Model. Softw. 2021, 144, 105139. [Google Scholar] [CrossRef]
- Vaysse, K.; Heuvelink, G.B.M.; Lagacherie, P.; Goss, M. Spatial aggregation of soil property predictions in support of local land management. Soil Use Manag. 2017, 33, 299–310. [Google Scholar] [CrossRef]
- Courteille, L.; Tardieu, L.; Boukhelifa, N.; Lutton, E.; Lagacherie, P. What is the best way to communicate the uncertainty of a digital soil mapping product? Some lessons from an end-users survey. Geoderma 2025, 459, 117302. [Google Scholar] [CrossRef]
- Stumpf, F.; Schmidt, K.; Goebes, P.; Behrens, T.; Schönbrodt-Stitt, S.; Wadoux, A.; Xiang, W.; Scholten, T. Uncertainty-guided sampling to improve digital soil maps. CATENA 2017, 153, 30–38. [Google Scholar] [CrossRef]
- Hengl, T.; Leenaars, J.G.; Shepherd, K.D.; Walsh, M.G.; Heuvelink, G.B.; Mamo, T.; Tilahun, H.; Berkhout, E.; Cooper, M.; Fegraus, E.; et al. Soil nutrient maps of Sub-Saharan Africa: Assessment of soil nutrient content at 250 m spatial resolution using machine learning. Nutr. Cycl. Agroecosyst. 2017, 109, 77–102. [Google Scholar] [CrossRef] [PubMed]
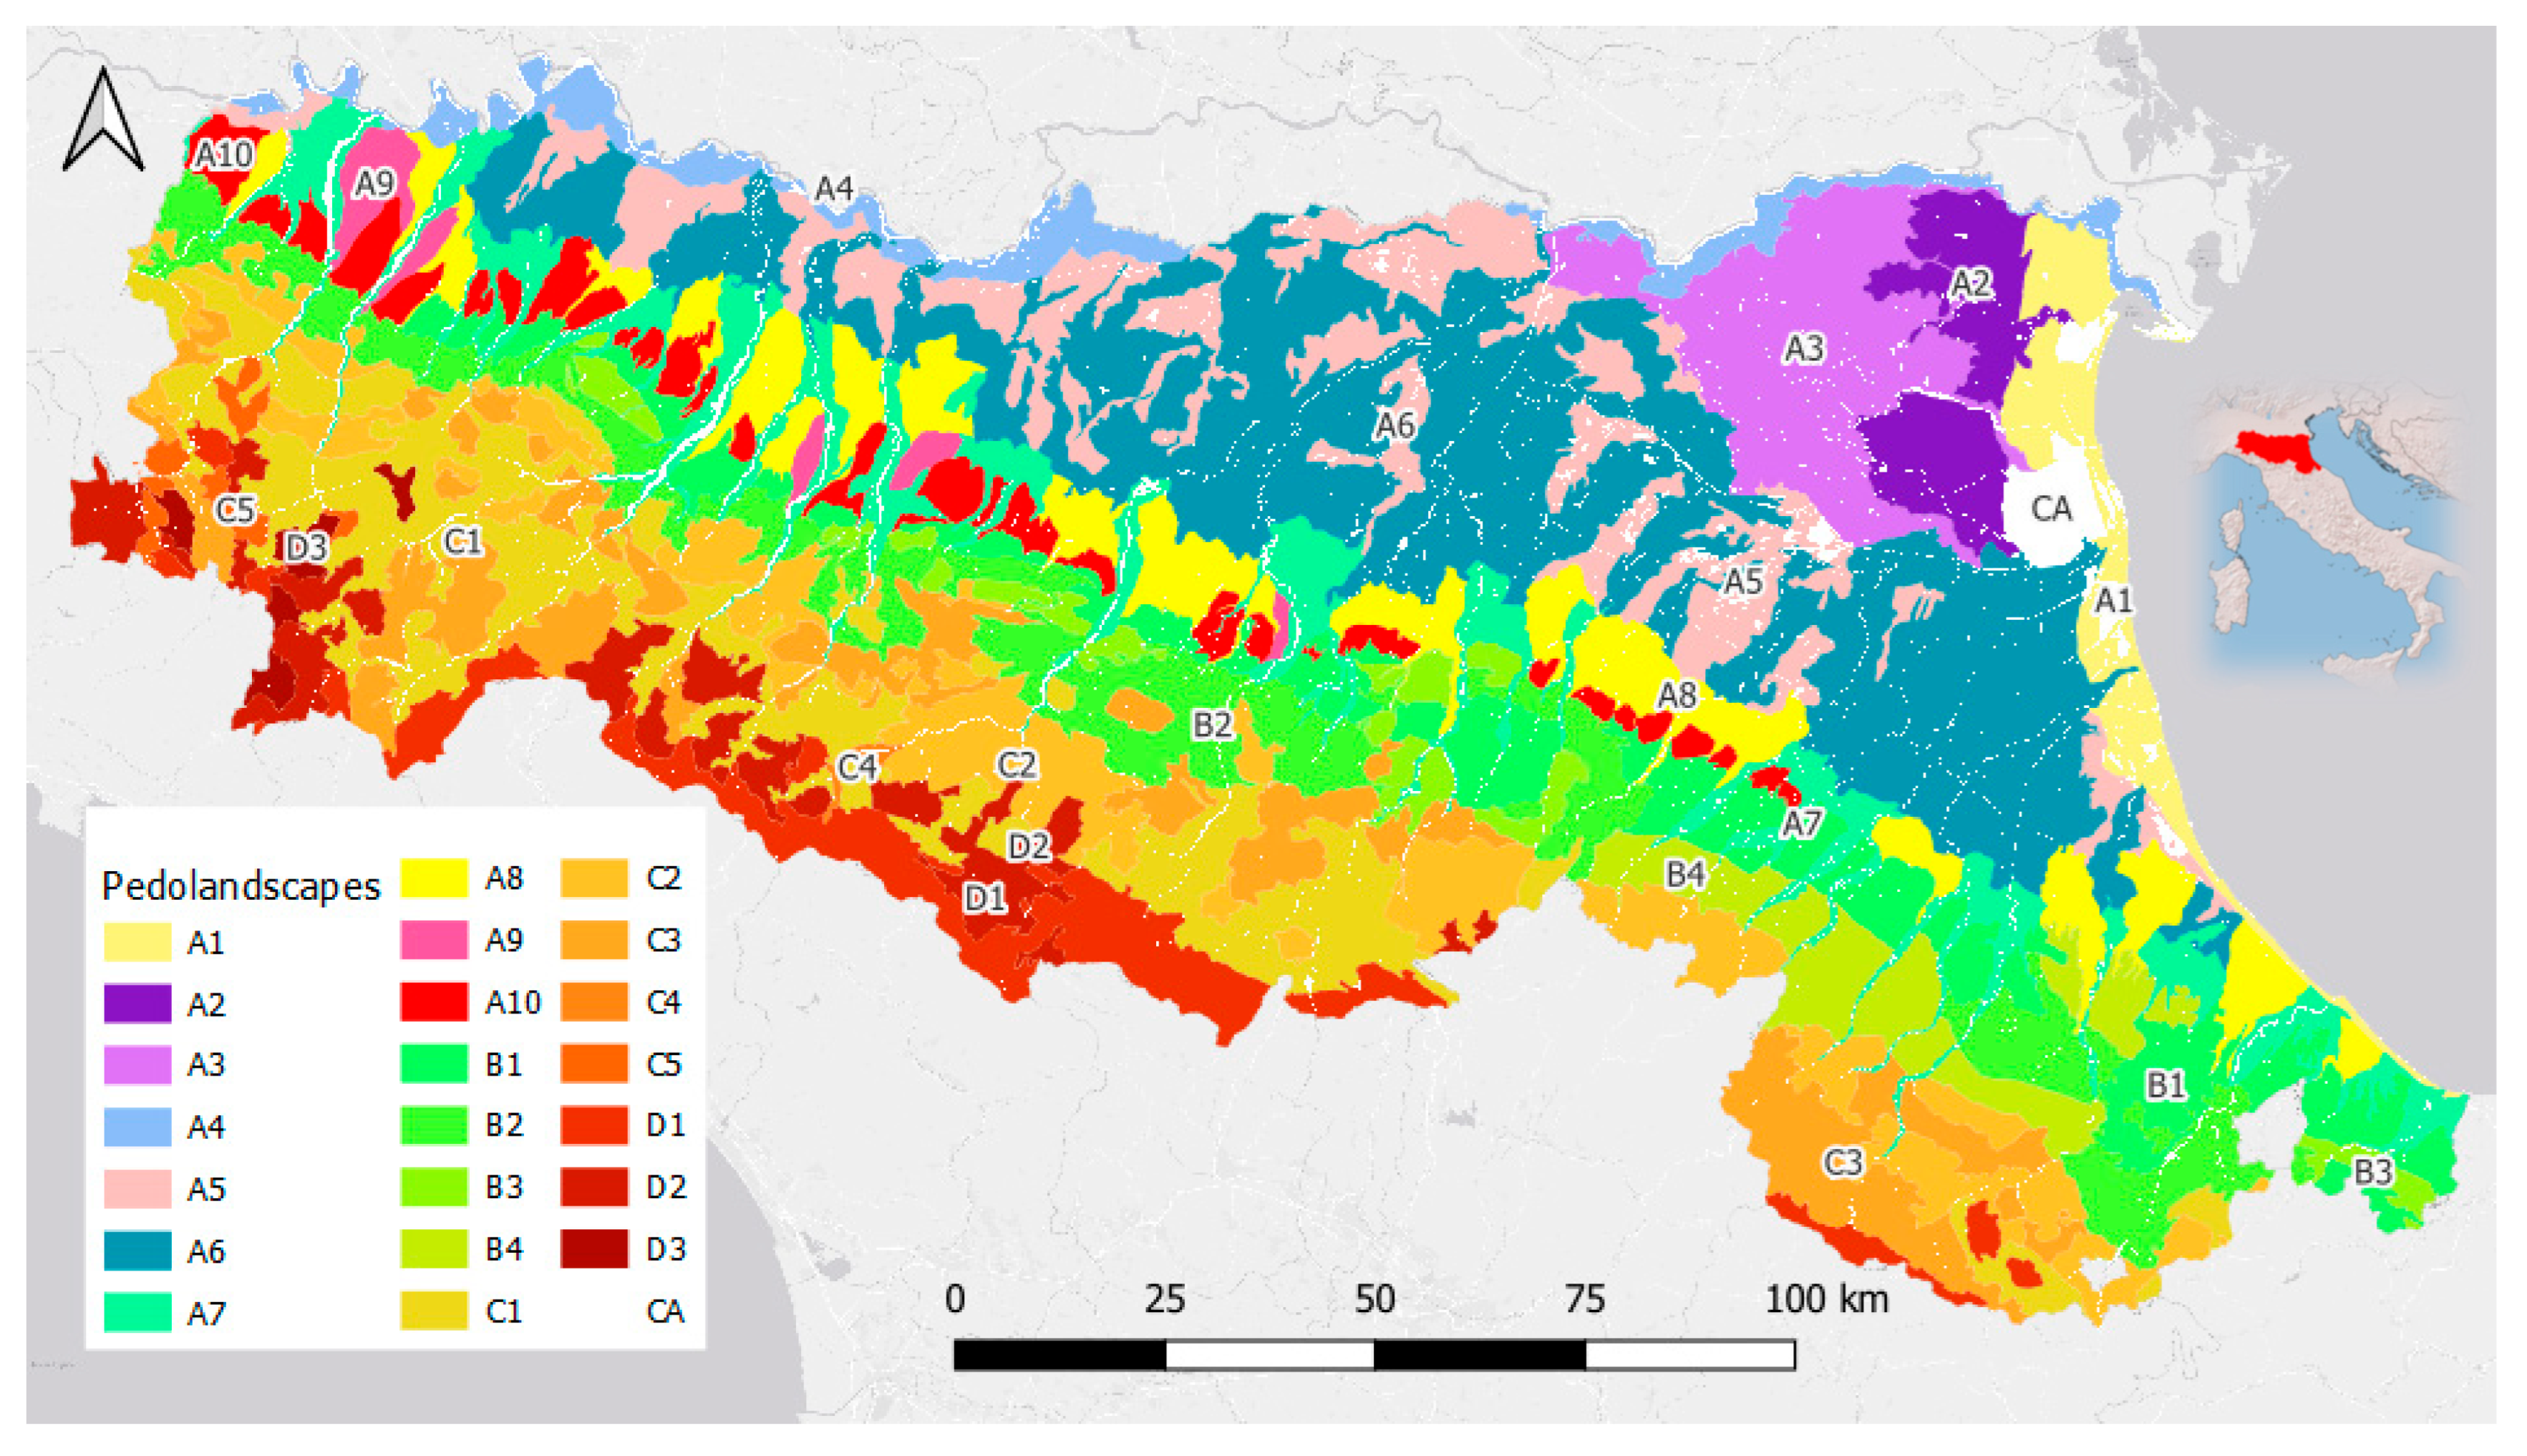
Disclaimer/Publisher’s Note: The statements, opinions and data contained in all publications are solely those of the individual author(s) and contributor(s) and not of MDPI and/or the editor(s). MDPI and/or the editor(s) disclaim responsibility for any injury to people or property resulting from any ideas, methods, instructions or products referred to in the content. |
© 2025 by the authors. Licensee MDPI, Basel, Switzerland. This article is an open access article distributed under the terms and conditions of the Creative Commons Attribution (CC BY) license (https://creativecommons.org/licenses/by/4.0/).