Abstract
This study presents a spatially explicit, multidecadal analysis of how land use and land cover (LULC) change and socio-demographic dynamics have influenced land surface temperature (LST) patterns in the Phoenix metropolitan area between 2001 and 2021. Using Landsat-derived summer LST, socio-demographic indicators, and land cover data, we quantify urban land transformation and socio-demographic changes over two decades. To account for spatial heterogeneity, we apply Multiscale Geographically Weighted Regression (MGWR), which improves upon conventional regression models by allowing for variable-specific spatial scales. Results show that the 2001–2011 period was characterized by rapid suburban expansion and widespread conversion of croplands and open space to higher-intensity development, while 2011–2021 experienced more limited infill development. Correlation analysis reveals that agricultural and open space conversions were linked to population and housing growth, whereas redevelopment of existing urban areas was often associated with socio-demographic decline. MGWR results highlight that agricultural land conversion drives localized warming, while shrub/scrub-to-developed transitions are linked to broader-scale cooling. By combining spatial sampling, area-weighted interpolation, and MGWR, this study offers a fi-ne-grained assessment of urban thermal dynamics in a fast-growing desert region. The findings provide actionable insights for planners and policymakers working toward sustainable and climate-resilient urban development in arid environments.
1. Introduction
Urbanization and population growth have profoundly transformed metropolitan landscapes across the American Southwest, with the Phoenix metropolitan area standing as a striking example of rapid urban expansion over the past two decades [1]. As the region’s population has surged, sprawling patterns of development have extended the urban footprint into previously undeveloped areas, triggering widespread land use and land cover (LULC) change [2]. These physical transformations are closely intertwined with shifts in socioeconomic conditions, including changes in racial composition, income distribution, housing affordability, and educational attainment [3]. Simultaneously, Phoenix has faced a significant rise in surface temperatures, exacerbated by the urban heat island (UHI) effect, which disproportionately affects vulnerable populations and intensifies the need for climate-resilient planning [4,5]. Understanding how patterns of LULC change interact with socioeconomic and demographic shifts to influence land surface temperature (LST) is essential for unraveling the mechanisms of urban warming and guiding informed responses [6].
A growing body of research has examined the complex interactions among urbanization, LULC change, and surface temperature dynamics in rapidly expanding metropolitan regions. Numerous studies have established that the conversion of vegetated or open lands into impervious surfaces substantially contributes to the intensification of the UHI effect [7,8,9,10]. In arid and semi-arid environments such as Phoenix, Arizona, these effects are particularly pronounced due to the region’s high baseline temperatures and low vegetation cover, which amplify radiative and thermal feedbacks. Recent studies have further examined the spatial heterogeneity of UHI effects, highlighting the importance of land cover composition and configuration on the urban thermal environment [11,12,13,14].
Understanding the relationship between land transformation and socio-demographic dynamics has also emerged as a key theme in urban climate research. Studies conducted in Phoenix [15,16] and other U.S. metropolitan regions [17,18] have documented the intersection of population growth, residential development, and demographic change with patterns of land development. These analyses underscore the uneven distribution of urban heat exposure along racial and economic lines. Nevertheless, empirical studies that explicitly link specific LULC transitions—such as the conversion of open space or agricultural land into developed areas—to changes in population, racial composition, income, housing value, and education levels at fine spatial resolutions remain limited. This study expands on this body of work by conducting a block-group-level analysis of socio-demographic changes for two periods: 2001–2011 and 2011–2021.
Thermal impacts of land transformation have been extensively studied using LST derived from remote sensing. While prior research has focused on average LST differences across urban-rural gradients [14,19], fewer studies have disaggregated LST dynamics by specific LULC conversion types. Recent work by Adeyeri et al. [20] and Naikoo et al. [21] has begun to explore thermal responses to different land development pathways, but more detailed analyses are needed. This study contributes to this area by computing LST statistics for different LULC transition zones in 2001, 2011, and 2021, enabling a more granular assessment of how specific land changes are associated with localized thermal shifts.
There is a growing emphasis on developing integrated modeling frameworks that relate LULC and socio-demographic variables to changes in LST. While conventional statistical models, such as Ordinary Least Squares (OLS), have provided insights into the role of biophysical and urban form variables [22,23], they rely on the assumption of spatial stationarity—treating the relationships between predictors and outcomes as uniform across space. This assumption is particularly problematic in heterogeneous urban regions like Phoenix, where land use transformation and demographic shifts vary markedly across neighborhoods. Although Geographically Weighted Regression (GWR) improves on OLS by allowing model coefficients to vary spatially, it assumes a single spatial scale for all predictors, potentially masking important multiscale dynamics. To overcome these limitations, this study employs Multiscale Geographically Weighted Regression (MGWR)—an extension of GWR that allows each predictor to operate at its own spatial scale [24]. MGWR is particularly well suited to this research context, as it accounts for spatial heterogeneity in the influence of LULC change and socio-demographic variables on LST change while distinguishing between processes that act locally and those that operate more regionally [25]. This study employs MGWR to examine how changes in land cover and socio-demographic characteristics jointly influence LST changes, offering a more robust analytical framework for identifying the spatial determinants of urban heat patterns in a fast-growing desert metropolis.
Despite substantial progress in understanding urban heat dynamics, existing studies often treat land cover change and socio-demographic variation as separate processes or rely on global models that overlook spatial heterogeneity [22,26]. Few have jointly quantified how specific LULC transition types—such as the conversion of crops, shrub/scrub, or open space to developed uses—interact with neighborhood-level demographic changes to shape land surface temperature in arid cities [15,27]. This study addresses this gap by integrating Landsat-derived LST, decadal LULC transitions, and harmonized block-group socio-demographic data within a multiscale analytical framework. The use of MGWR represents a methodological innovation that distinguishes between local and regional drivers of surface temperature change, offering improved explanatory power over conventional regression models. By explicitly linking fine-grained land transformation pathways, demographic evolution, and multiscale heat responses, this research advances the spatial understanding of urban thermal environments and provides actionable insights for sustainable, heat-resilient urban planning in desert metropolises like Phoenix.
This study pursues the following research objectives: (1) Quantify the spatiotemporal patterns of major LULC conversions across the Phoenix metropolitan area between 2001, 2011, and 2021; (2) Examine the associations between specific types of LULC conversions and changes in socio-demographic indicators at the census block group (CBG) level; (3) Assess how LST patterns differ among distinct LULC transition zones and evaluate their thermal responses across the two decades; and (4) Evaluate the joint influence of LULC and socio-demographic changes on LST variation using a multiscale spatial framework.
2. Materials and Methods
2.1. Study Area
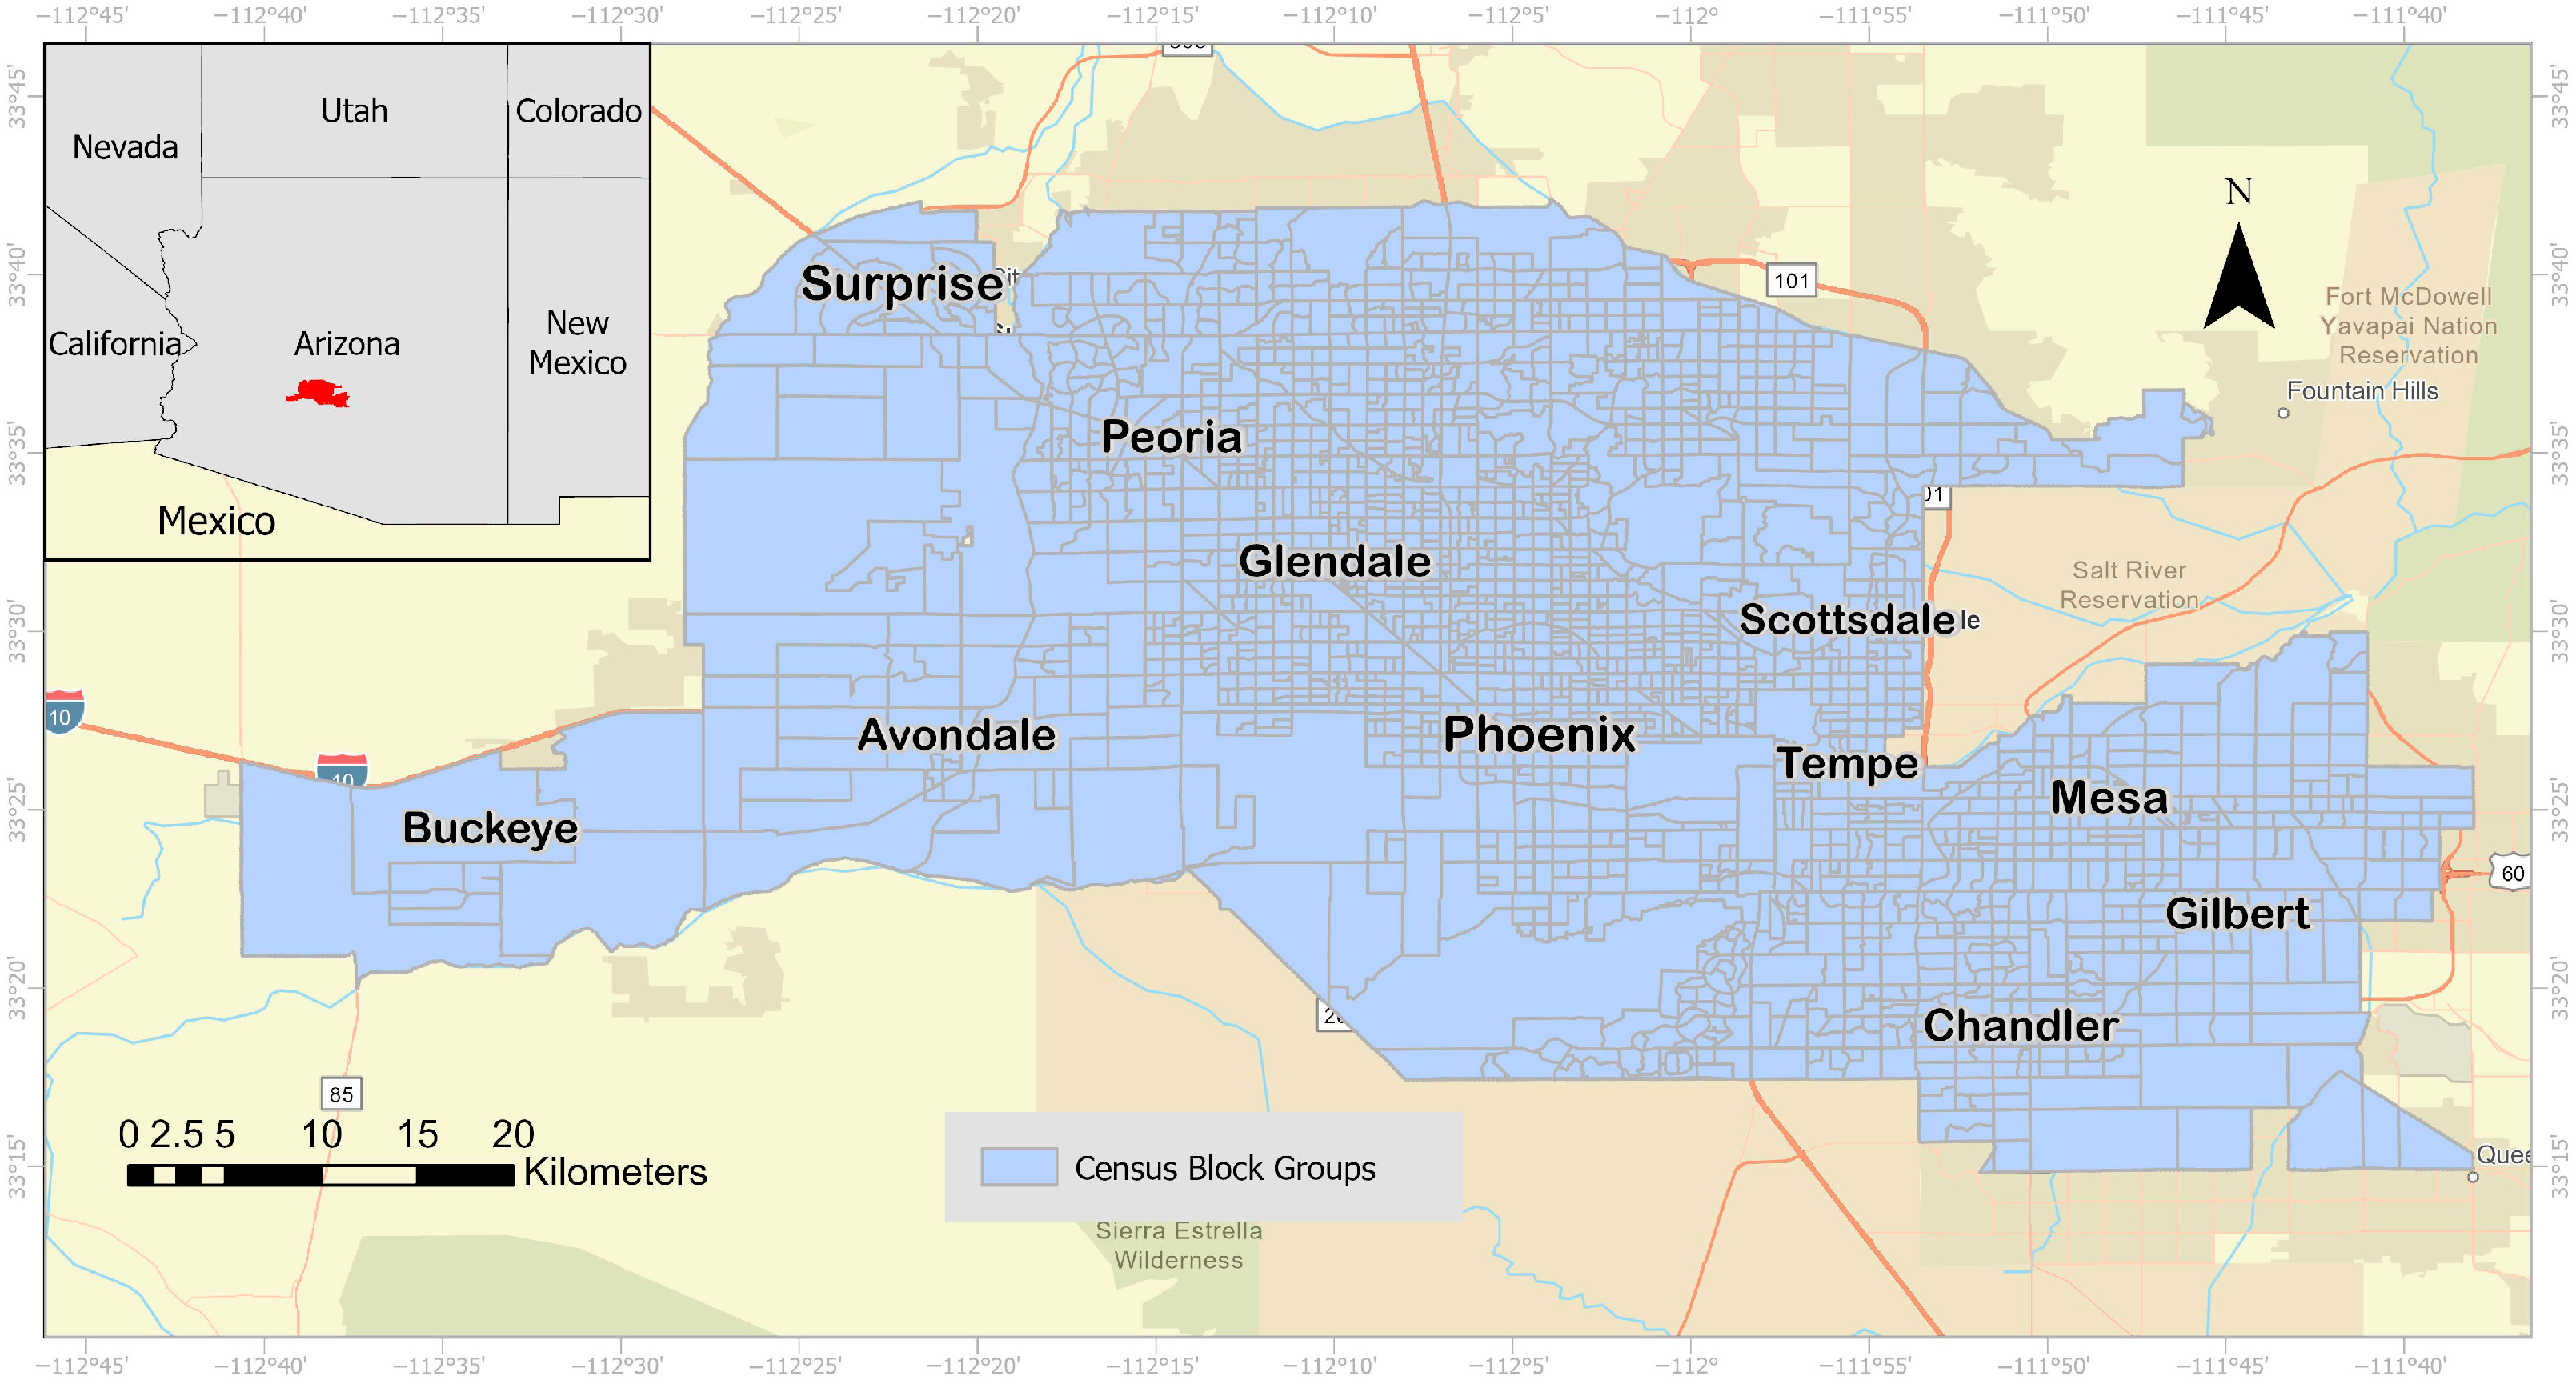
The study area is the Phoenix metropolitan area, located in central Arizona within the northern reaches of the Sonoran Desert (Figure 1). The study area is extended by four corner coordinates: Northwest (33°41′3.58″ N, 112°25′6.64″ W), Southwest (33°21′15.14″ N, 112°40′42.74″ W), Northeast (33°36′52.91″ N, 111°46′12.71″ W), and Southeast (33°14′54.23″ N, 111°40′06.73″ W). The region is characterized by a hot desert climate (Köppen BWh) [28], with extremely hot and dry summers, mild winters, and more than 300 days of sunshine annually [29]. Phoenix metropolitan areas are among the hottest U.S. cities. In summer, average daytime temperature reaches 39.4 °C with peak temperatures approaching 50 °C, and typical night temperature is around 27–29 °C [30]. By late 20th century, the mean daily air temperature had risen by 3.1 °C and the nighttime temperature by 5.0 °C [31]. The annual average rainfall is 183 mm with most rainfall occurring from late June to September [30].
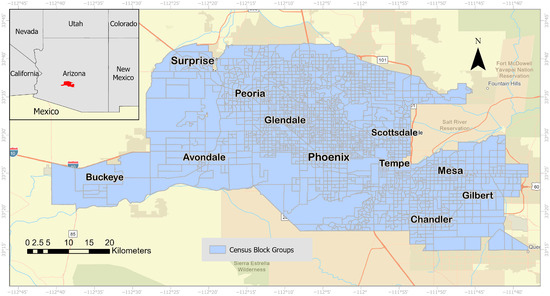
Figure 1.
Study area located in the Phoenix metropolitan area, Arizona. Basemap source: Esri, Garmin, FAO, NOAA, USGS, © OpenStreetMap contributors, and the GIS User Community.
The Phoenix metropolitan area lies on mostly flat terrain (~1000–2300 m elevation) in the Lower Sonoran Desert, where most development is concentrated with outlying pockets of Upland Sonoran Desert characterized by vegetation such as saguaro, paloverde, and ocotillo [32]. As one of the fastest-growing urban regions in the United States, Phoenix has experienced significant land use transformation and urban expansion over the past several decades [33]. These climatic conditions, combined with extensive urbanization, have contributed to a pronounced and steadily intensifying UHI effect [34,35]. The warming trends are closely tied to rapid land use change, including the conversion of natural desert and agricultural lands into urban developments [36]. As development patterns have unfolded, they have been accompanied by shifts in population, racial/ethnic composition, income levels, and housing characteristics [37].
2.2. Data
2.2.1. National Land Cover Database (NLCD)
To assess LULC changes across the Phoenix metropolitan area, data from the National Land Cover Database (NLCD) for the years 2001, 2011, and 2021 was used [38]. The NLCD is a standardized, high-resolution (30 m) land cover product developed by the Multi-Resolution Land Characteristics Consortium. It provides consistent land cover classifications across the conterminous United States based on Landsat satellite imagery and other ancillary data. The NLCD dataset is derived using a decision-tree classification algorithm and post-processing techniques to ensure temporal consistency and accuracy [39].
The study area features a diverse land cover composition, with seven major categories derived from the NLCD classification scheme: developed high intensity, developed medium intensity, developed low intensity, developed open space, cultivated crops, shrub/scrub, and other minor land cover types. Developed high intensity areas are characterized by a high percentage of impervious surfaces and include commercial, industrial, and transportation infrastructure, such as the urban core of downtown Phoenix and the vicinity of Sky Harbor International Airport. Developed medium intensity primarily encompasses medium-density single-family residential neighborhoods with a moderate degree of impervious cover. Developed low intensity includes low-density single-family residential areas, typically with larger lot sizes and greater vegetation cover. Developed open space refers to areas with a mix of constructed surfaces and substantial vegetated cover, such as parks, golf courses, recreational fields, and landscaped urban green spaces. In addition to these developed classes, cultivated crops are found in the agricultural fringes of the metropolitan area and represent areas actively used for crop production. Shrub/scrub areas, predominantly located in undeveloped desert or peri-urban zones, consist of low-growing woody vegetation and represent a key component of the Sonoran Desert landscape.
In this study, the NLCD datasets for 2001, 2011, and 2021 were used to identify LULC changes over two decadal periods: 2001–2011 and 2011–2021. Pixel-based change detection was applied to quantify land cover conversions and extract dominant LULC change categories across the study area. These change categories were then spatially analyzed to examine their association with socio-demographic changes and variations in LST over time (see Section 2.3 for details).
2.2.2. Socio-Demographic Data
This study incorporates a set of socio-demographic variables obtained from the U.S. Census Bureau’s American Community Survey (ACS) [40] to examine neighborhood-level changes in population, income, and housing characteristics across the Phoenix metropolitan area. Variables include total population, racial and ethnic composition (Hispanic or Latino, White, Black or African American, and Asian), median household income, residents with a bachelor’s degree or higher, median housing value, and total number of housing units (Table 1). These data were compiled for three time points—2001, 2011, and 2021—at the CBG level, which offers a fine spatial resolution suitable for capturing localized patterns of socio-demographic change. Due to limitations in data availability, the 2001 dataset excludes education and median housing value; however, all variables are included for 2011 and 2021.

Table 1.
Descriptive statistics of socio-demographic variables at the CBG level.
2.3. Land Cover Change Detection
To quantify LULC transitions across the Phoenix metropolitan area, we applied a pixel-based post-classification change detection approach using the NLCD products for 2001, 2011, and 2021. Each NLCD dataset was first clipped to the study boundary and reclassified into seven major land cover categories indicated in Section 2.2.1. This reclassification minimized spectral confusion and ensured comparability across years. The reclassified NLCD data for each time step were then overlaid to identify pairwise land cover transitions (2001–2011 and 2011–2021). A pixel-by-pixel cross-tabulation was performed to generate change matrices that recorded the conversion of each class to every other class. The results were used to calculate both the magnitude and percentage of area change for each transition type. To focus on dominant transformation processes, we extracted the six most frequent conversion categories (e.g., cropland to developed, shrub/scrub to developed, open space to higher intensity developed, etc.).
These transition layers were further aggregated by CBGs to link land cover dynamics with socio-demographic changes and LST variations. Spatial overlays and zonal statistics were used to compute the proportion of each LULC transition type within each CBG, enabling integrated analysis of land transformation, population change, and surface heat patterns across the two study periods.
2.4. LST Retrieval
Landsat 5, 7, and 8 images (Collection-2 Level-2) were acquired for the summer months (June, July, and August) of 2001, 2011, and 2021 to capture seasonal LST patterns across the study area. All image processing and LST retrieval were conducted within the Google Earth Engine (GEE) platform, allowing for efficient handling of large datasets at a 30 m spatial resolution [41]. For each year, all available Landsat scenes with less than 9% cloud cover were collected. To ensure data quality, scan line corrector (SLC)-off artifacts from Landsat 7 were removed, and pixels affected by dilated cloud, cirrus, clouds or cloud shadows were masked using the quality assessment bands (QA_PIXEL). Specially, pixels in QA_PIXEL bands flagged as dilated cloud (bit 1), cirrus (bit 2—Landsat 8 only for 2021 scenes), cloud (bit 3), and cloud shadow (bit 4) were excluded. Only pixels not flagged by these bits were retained for subsequent calculations. The details of all Landsat scenes can be found in Table S1.
LST was retrieved from Landsat imagery using the Statistical Mono-Window (SMW) algorithm developed by the Climate Monitoring Satellite Application Facility (CM-SAF) [42,43]. The SMW algorithm is widely used for LST estimation due to its simplicity, requiring only three parameters: emissivity, transmittance, and effective mean atmospheric temperature [43]. These inputs, together with top-of-atmosphere (TOA) thermal radiance, are incorporated into a radiative transfer equation to estimate LST through an empirical linear relationship between LST and TOA brightness temperature from a single thermal infrared band.
To accurately characterize atmospheric effects, we incorporated water vapor content from the National Centers for Environmental Prediction (NCEP) reanalysis data. Surface emissivity values were sourced from the ASTER Global Emissivity Database (GED), developed by NASA’s Jet Propulsion Laboratory (JPL), which provides high-resolution global emissivity information tailored for thermal retrievals. All datasets required for the LST computation—including Landsat imagery, NCEP water vapor, and ASTER GED emissivity—were accessed and processed through the GEE platform. The LST was estimated by a single-channel statistical parameterization [44,45]:
where denotes the TOA brightness temperatures from the Landsat thermal band (TM/ETM+: B6; OLI/TIRS: B10). and ε is the band-effective surface emissivity (see below for details). The coefficients A, B, and C were precomputed from radiative-transfer simulations that account for the sensor’s spectral response and were indexed by total column water vapor classes.
Surface emissivity values were obtained from the ASTER GEDv3 emissivity product, which provides emissivity at 100 m resolution for five thermal infrared (TIR) bands. These emissivities were spectrally adjusted to the Landsat thermal band using the published conversion coefficients [41,46]. Because ASTER GEDv3 represents an 8-year composite, a temporal adjustment was applied to better match the Landsat acquisition dates. For each Landsat scene, the Fractional Vegetation Cover (FVC) was derived from Landsat-based NDVI and the mean ASTER GEDv3 NDVI (Equation (2)). Vegetation emissivity (εveg) was fixed at 0.99, while bare-ground emissivity (εbare) was estimated by inverting the vegetation-cover mixture at the ASTER resolution (Equation (3)). The resulting εbare was then converted to the Landsat TIR band using the published spectral adjustments [47]. Finally, per-scene Landsat emissivity () was calculated by mixing εveg and εbare according to the scene-specific FVC at the time of Landsat acquisition (Equation (4)).
The mean LST from all valid observations within the summer period was then computed to represent the average summer daytime LST for each respective year.
2.5. Statistical Analysis
2.5.1. Area-Weighted Interpolation
Because CBG boundaries changed significantly between the decennial censuses, direct comparison of socio-demographic data across time was not feasible due to boundary mismatches. To address this, we applied an area-weighted interpolation approach to harmonize socio-demographic data to a consistent spatial framework. Using overlay analysis, earlier CBGs were intersected with those from the subsequent decade, and socio-demographic attributes were proportionally allocated based on the area of overlap. This proportional weighting conserves total attribute values while enabling comparison across consistent spatial units.
We acknowledge that this approach introduces some uncertainty, particularly in low-overlap target units that inherit small portions from multiple earlier CBGs. Such cases commonly occur in greenfield expansion zones—areas newly developed from agricultural or desert land—where prior demographic data are sparse or absent. The interpolation assumes an even spatial distribution of attributes within source polygons, which may lead to local errors where strong internal heterogeneity exists. Nonetheless, the relatively fine spatial resolution of CBGs and the use of proportional weighting help minimize boundary-related bias, and the overall metro-scale patterns examined in this study are unlikely to be affected by these localized uncertainties.
The resulting harmonized units were then used to calculate (1) changes in socio-demographic variables, (2) percent area of each LULC change type, and (3) mean changes in LST for the periods 2001–2011 and 2011–2021.
2.5.2. Spatial Sampling
To ensure balanced representation across different LULC change types, we implemented a stratified random sampling approach prior to statistical analysis. Each stratum corresponded to one of the major LULC change categories, and 200 sample points were randomly selected for each category. A minimum distance of 100 m was enforced between points within each stratum to reduce spatial clustering and ensure spatial independence. These sample points were then spatially joined to CBGs, and any CBG containing at least one sample point was included in the regression analysis. This process yielded a final sample of 902 and 833 block groups for 2001–2011 and 2011–2021, respectively.
2.5.3. Weighted Least Squares (WLS) Regression
A total of 13 explanatory variables were initially considered in evaluating the LST change in relation to LULC and socio-demographic variables. The 13 variables include six variables representing the percentage of LULC change within each CBG and seven variables capturing socio-demographic changes over each ten-year period. As a preliminary step, Pearson’s correlation coefficients were calculated between each variable and LST change. Variables with weak or non-significant correlations were excluded. In addition, we examined pairwise correlations among the remaining variables to identify and remove those exhibiting high multicollinearity.
To evaluate model assumptions, scatterplots of the retained predictors against LST change were examined. Visual inspection revealed evidence of heteroscedasticity in several variables. To address heteroscedasticity and improve model efficiency, we estimated residual variance from an initial OLS regression and constructed an inverse-variance weight variable. This weight was then applied in a weighted least squares (WLS) regression to generate more reliable and robust coefficient estimates. The WLS was developed as a global baseline model to address heteroscedasticity in the data and to provide a benchmark for evaluating the added explanatory power of the spatial models.
2.5.4. Multiscale Geographically Weighted Regression (MGWR)
To capture spatial variation in the relationships between LST change and its potential drivers, we employed MGWR [24]. Unlike global models such as OLS, which assume that predictor–response relationships are constant across space, MGWR allows these relationships to vary locally while also accounting for the possibility that different predictors operate at different spatial scales.
The general form of MGWR is expressed as:
where is the dependent variable at location . represents the th independent variable at location , and is the error term. is the intercept. The term denotes the local regression coefficients for the th variable at location , and is estimated using a bandwidth specific to that variable.
This framework improves upon traditional GWR, which assumes a single spatial scale for all predictors. MGWR instead enables each explanatory variable to vary over space at its own optimal scale, reflecting the fact that some drivers of LST change may have highly localized effects, while others may exert influence over broader spatial extents. The MGWR models were implemented in the MGWR v2.2 software package [48].
3. Results
3.1. Spatiotemporal Dynamics of LULC Change
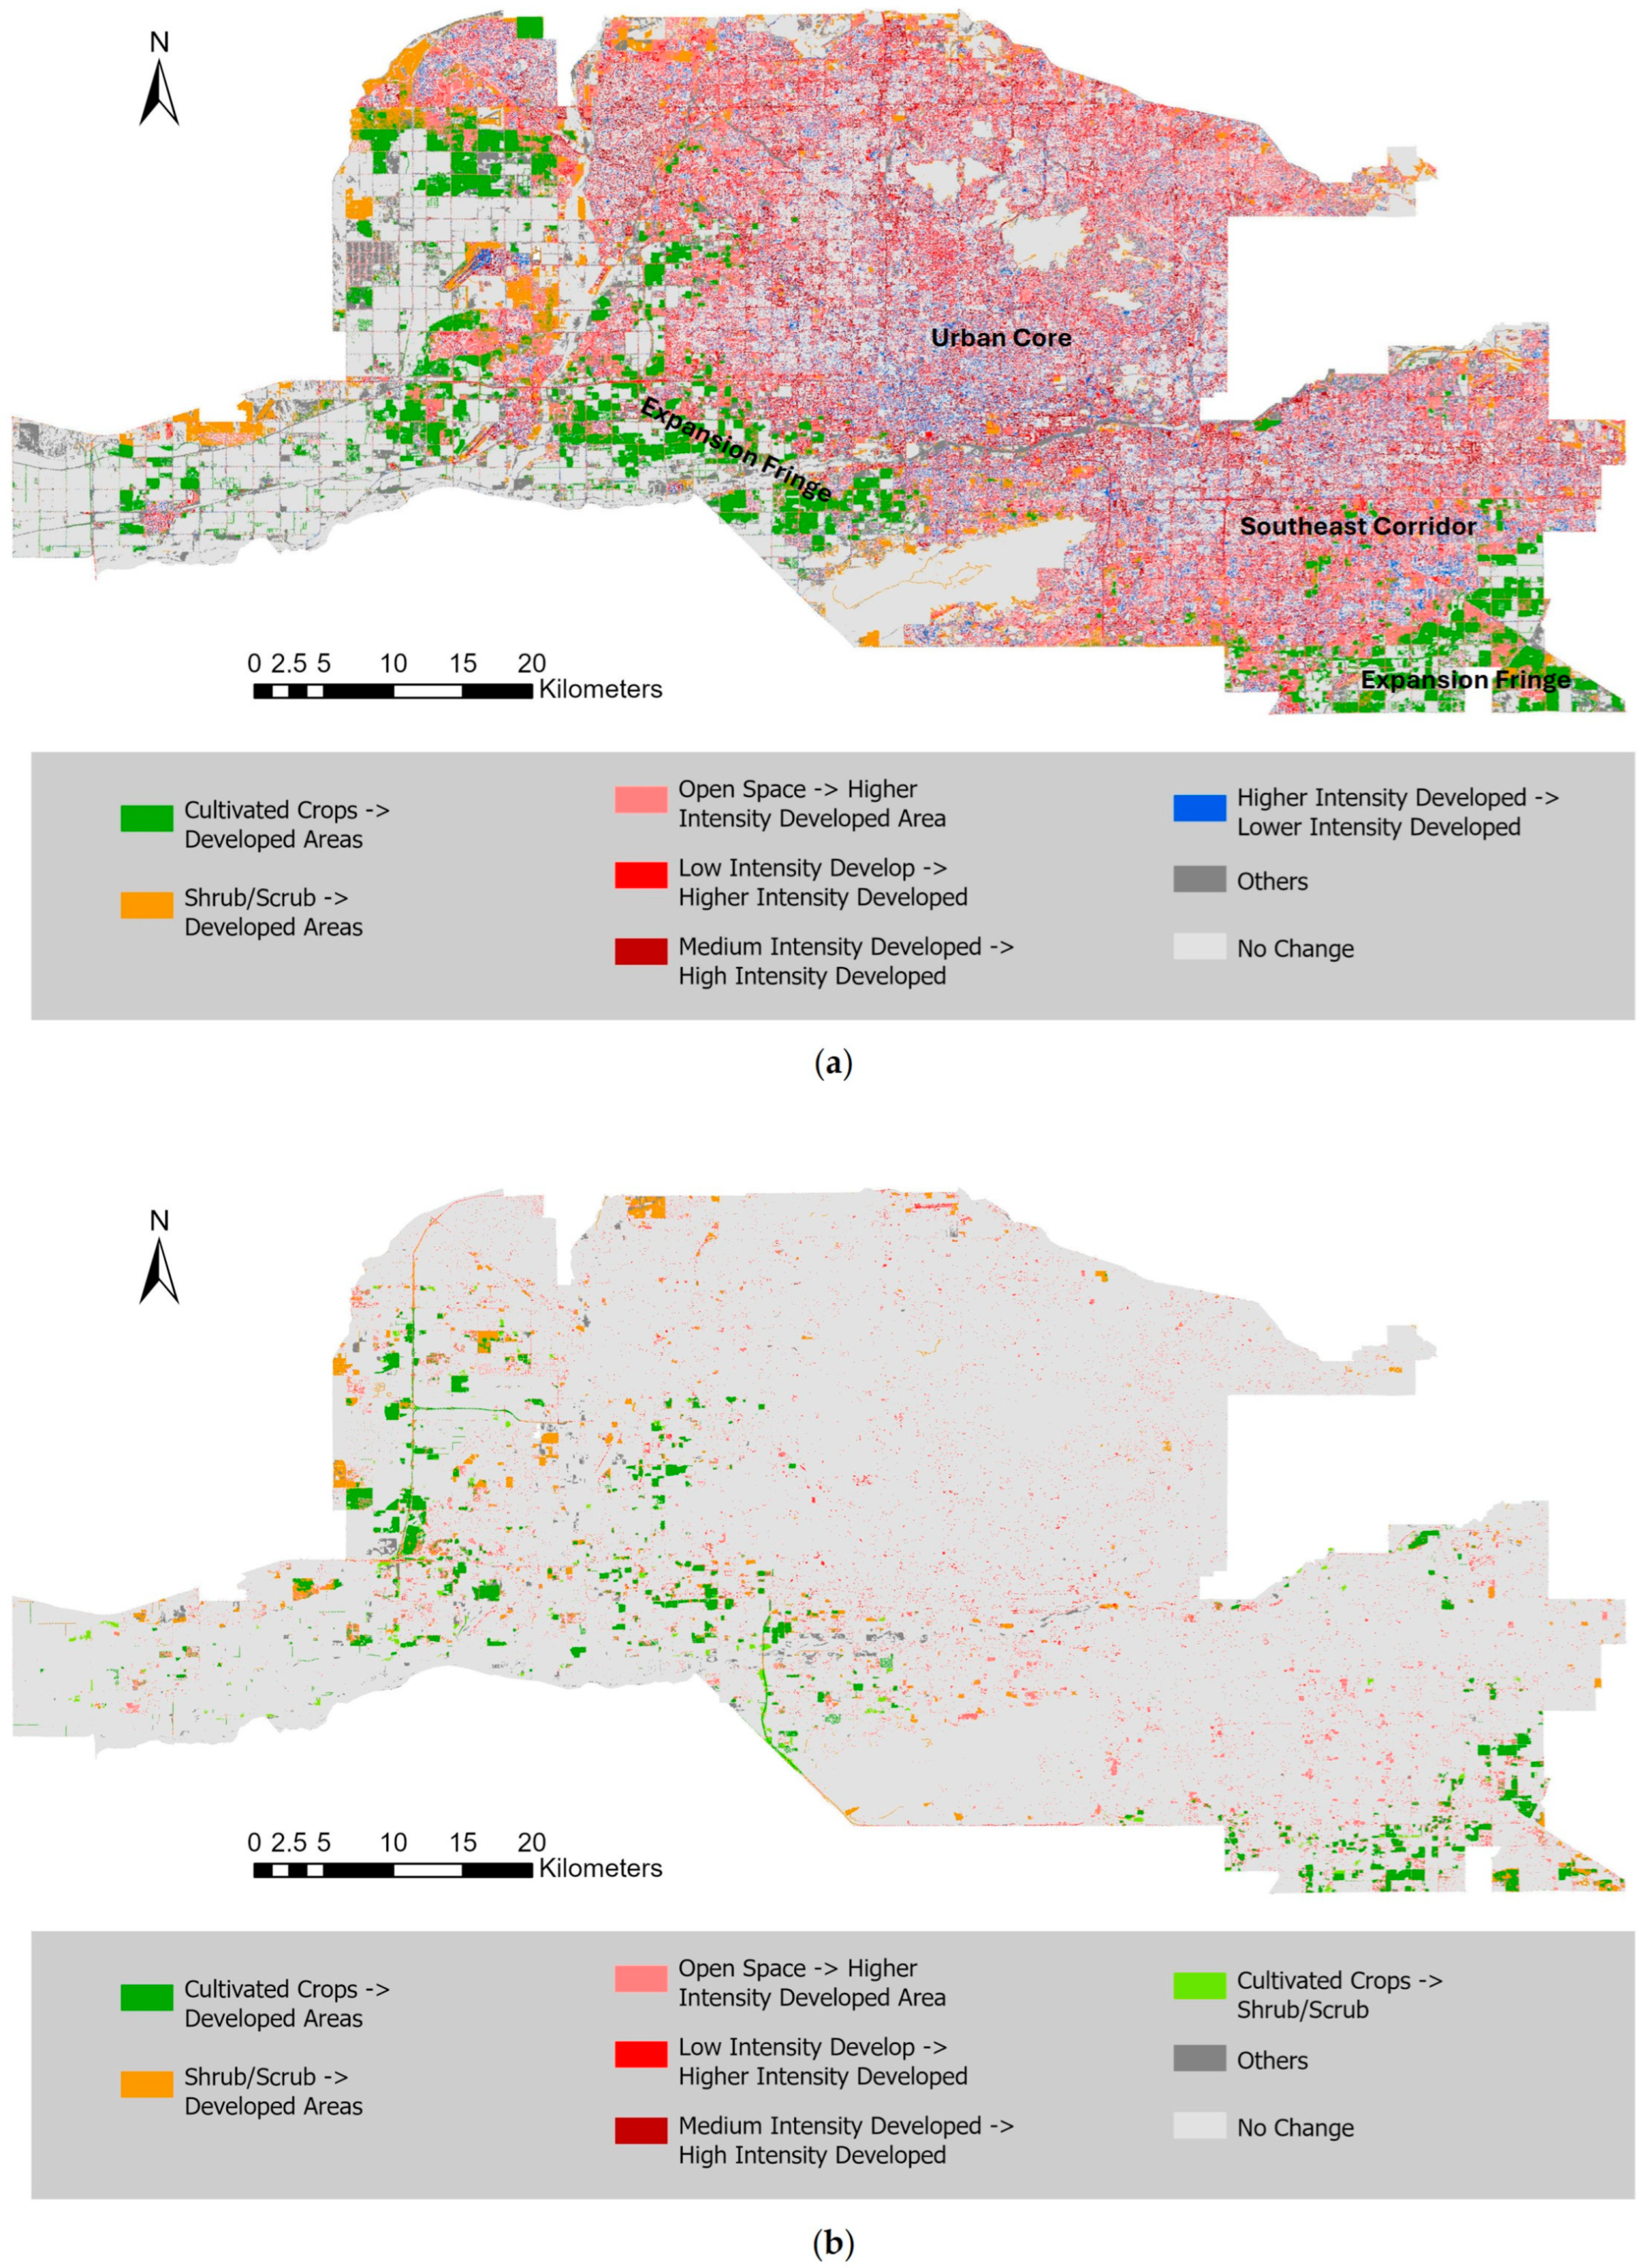
Figure 2 illustrates the major LULC conversions across the Phoenix metropolitan area for 2001–2011 and 2011–2021, respectively. The first decade was marked by rapid suburban expansion as open space, cropland, and shrub/scrub areas were widely converted to residential and commercial development, especially along the central and southeastern corridors. These conversions indicate an outward-spreading urban footprint that paralleled sharp increases in population and housing documented during the same period.
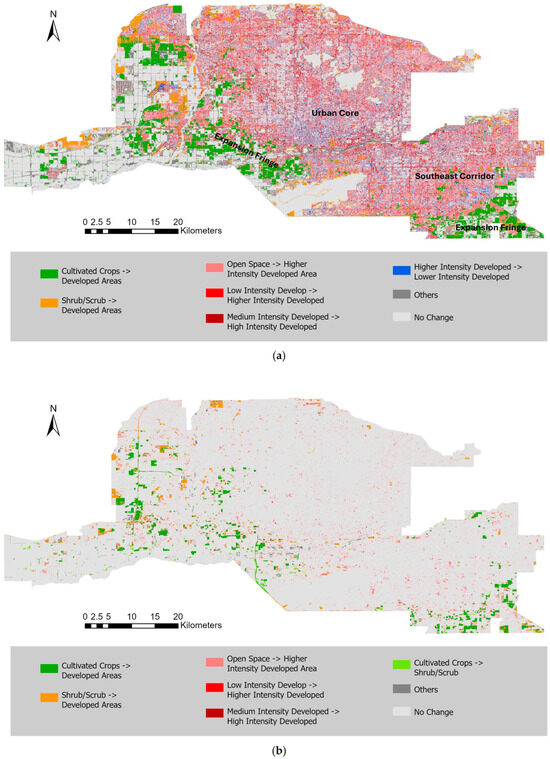
Figure 2.
LULC conversion maps over the Phoenix metropolitan area for (a) 2001–2011 and (b) 2011–2021.
By contrast, 2011–2021 shows a more spatially fragmented pattern of change, concentrated in infill and redevelopment zones near the existing urban core. While new conversions from agricultural and desert land continued along the outer fringe, their overall extent declined sharply, reflecting slower growth and land-availability constraints. The observed shift from large-scale outward expansion to selective intensification underscores a broader transition in metropolitan development dynamics—from rapid greenfield growth to consolidation and densification.
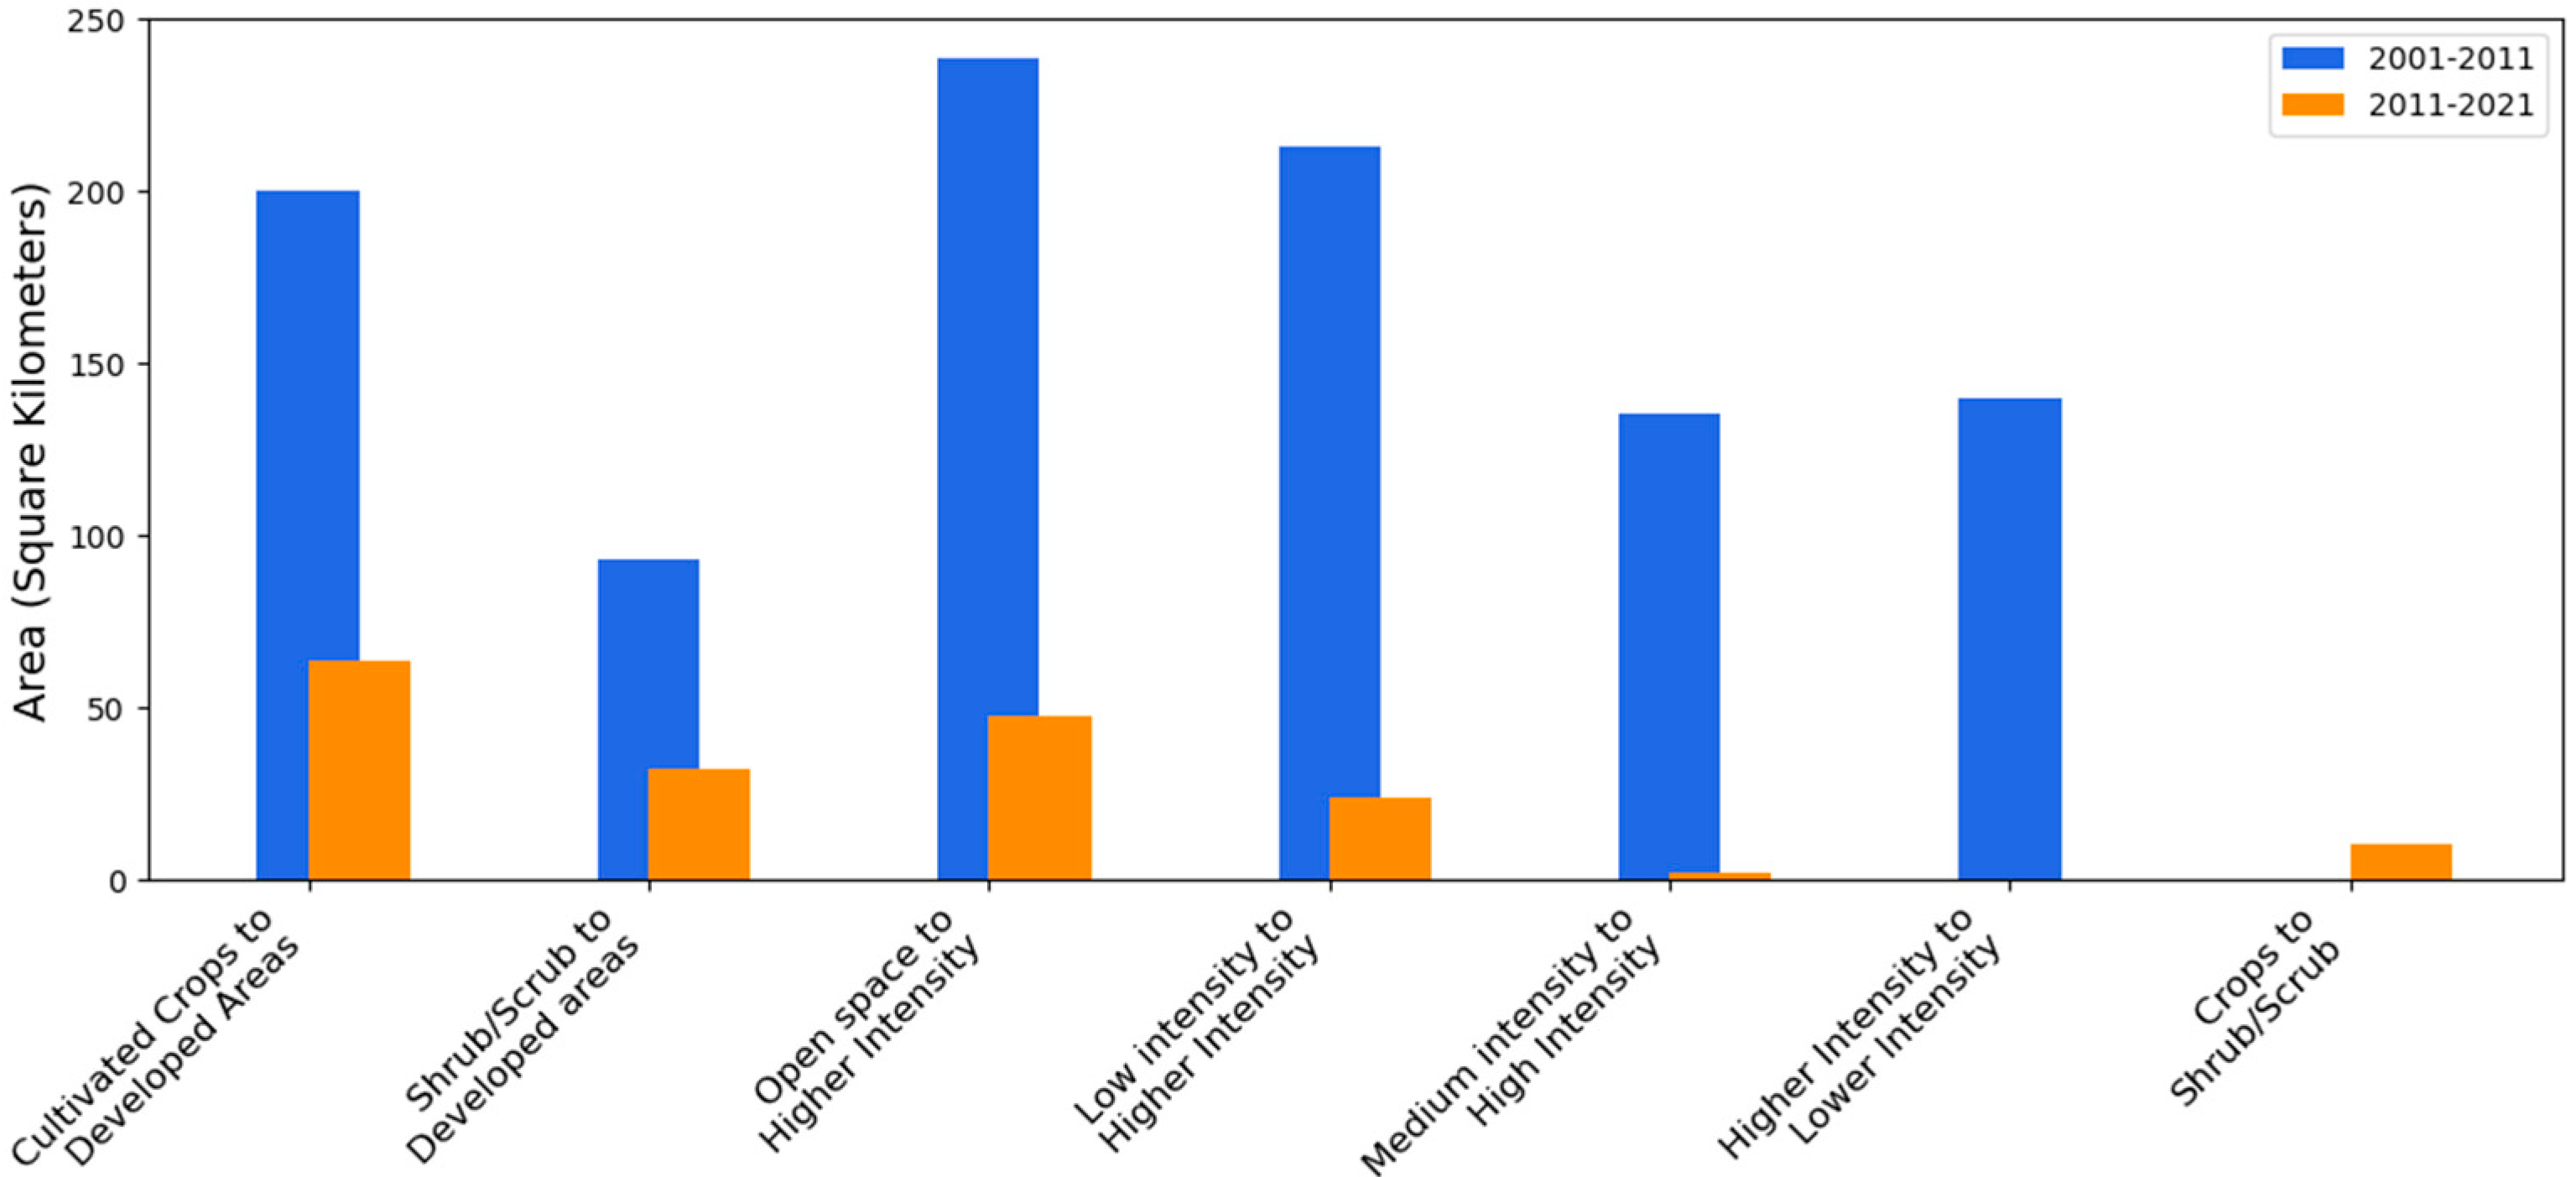
Figure 3 quantifies this slowdown in urban transformation: the total area of major LULC conversions declined by more than half between the two decades. The earlier period was dominated by open-space and cropland conversions that supported suburban population gains, whereas later period was characterized by slower infill and redevelopment. Together, Figure 2 and Figure 3 highlight how the spatial footprint of urban development has contracted over time, marking a transition from rapid outward growth to more selective and spatially constrained land use change in the recent decade. These contrasts establish the evolving spatial context for interpreting socio-demographic and thermal patterns in subsequent analyses.
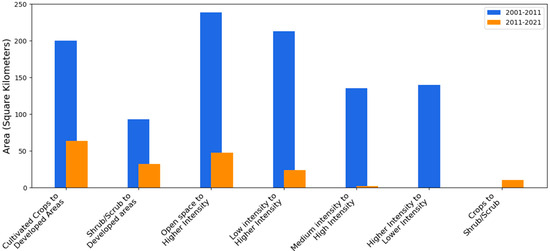
Figure 3.
Major LULC change categories by area for 2001−2011 and 2011−2021.
3.2. Associations Between LULC Change and Socio-Demographic Dynamics
Table 2 and Table 3 show Pearson’s r between major LULC transitions and socio-demographic changes for the two decades. Only significant correlations and those higher than 0.1 were reported. All reported correlations are significant at the 0.1% level (p < 0.001).

Table 2.
Correlations between major types of LULC conversions and changes in socio-demographic variables from 2001 to 2011.

Table 3.
Correlations between major types of LULC conversions and changes in socio-demographic variables from 2011 to 2021.
From 2001 to 2011, the conversion of cropland to developed land shows the strongest positive association with population and housing growth across all racial and ethnic groups, confirming that agricultural lands served as the primary frontier of suburbanization. More moderate correlations for shrub/scrub and open-space conversions indicate peripheral but less intense demographic change associated with lower-density residential development.
In contrast, internal redevelopment—particularly transitions from low- or medium- to higher-intensity development—exhibits negative relationships with population, income, and housing change, implying that densification often corresponded to non-residential or commercial redevelopment rather than residential growth. Such processes likely reflect structural transformation or demographic turnover in mature neighborhoods rather than expansion.
During 2011–2021, positive associations persist but weaken, consistent with the overall slowdown of urban growth (Table 3). Open-space intensification correlates with moderate gains in population, housing, and educational attainment, suggesting socioeconomic uplift in targeted redevelopment areas. Crop- and shrubland-to-development conversions remain linked to modest residential expansion on the fringe, while internal redevelopment continues to show weak or neutral demographic effects. Together, these results reveal that the first decade’s broad agricultural and open-land conversions drove widespread population influx, whereas the later decade’s selective redevelopment and infill were characterized by more stable or shifting socio-demographic profiles.
3.3. LST Patterns in Relation to LULC Change
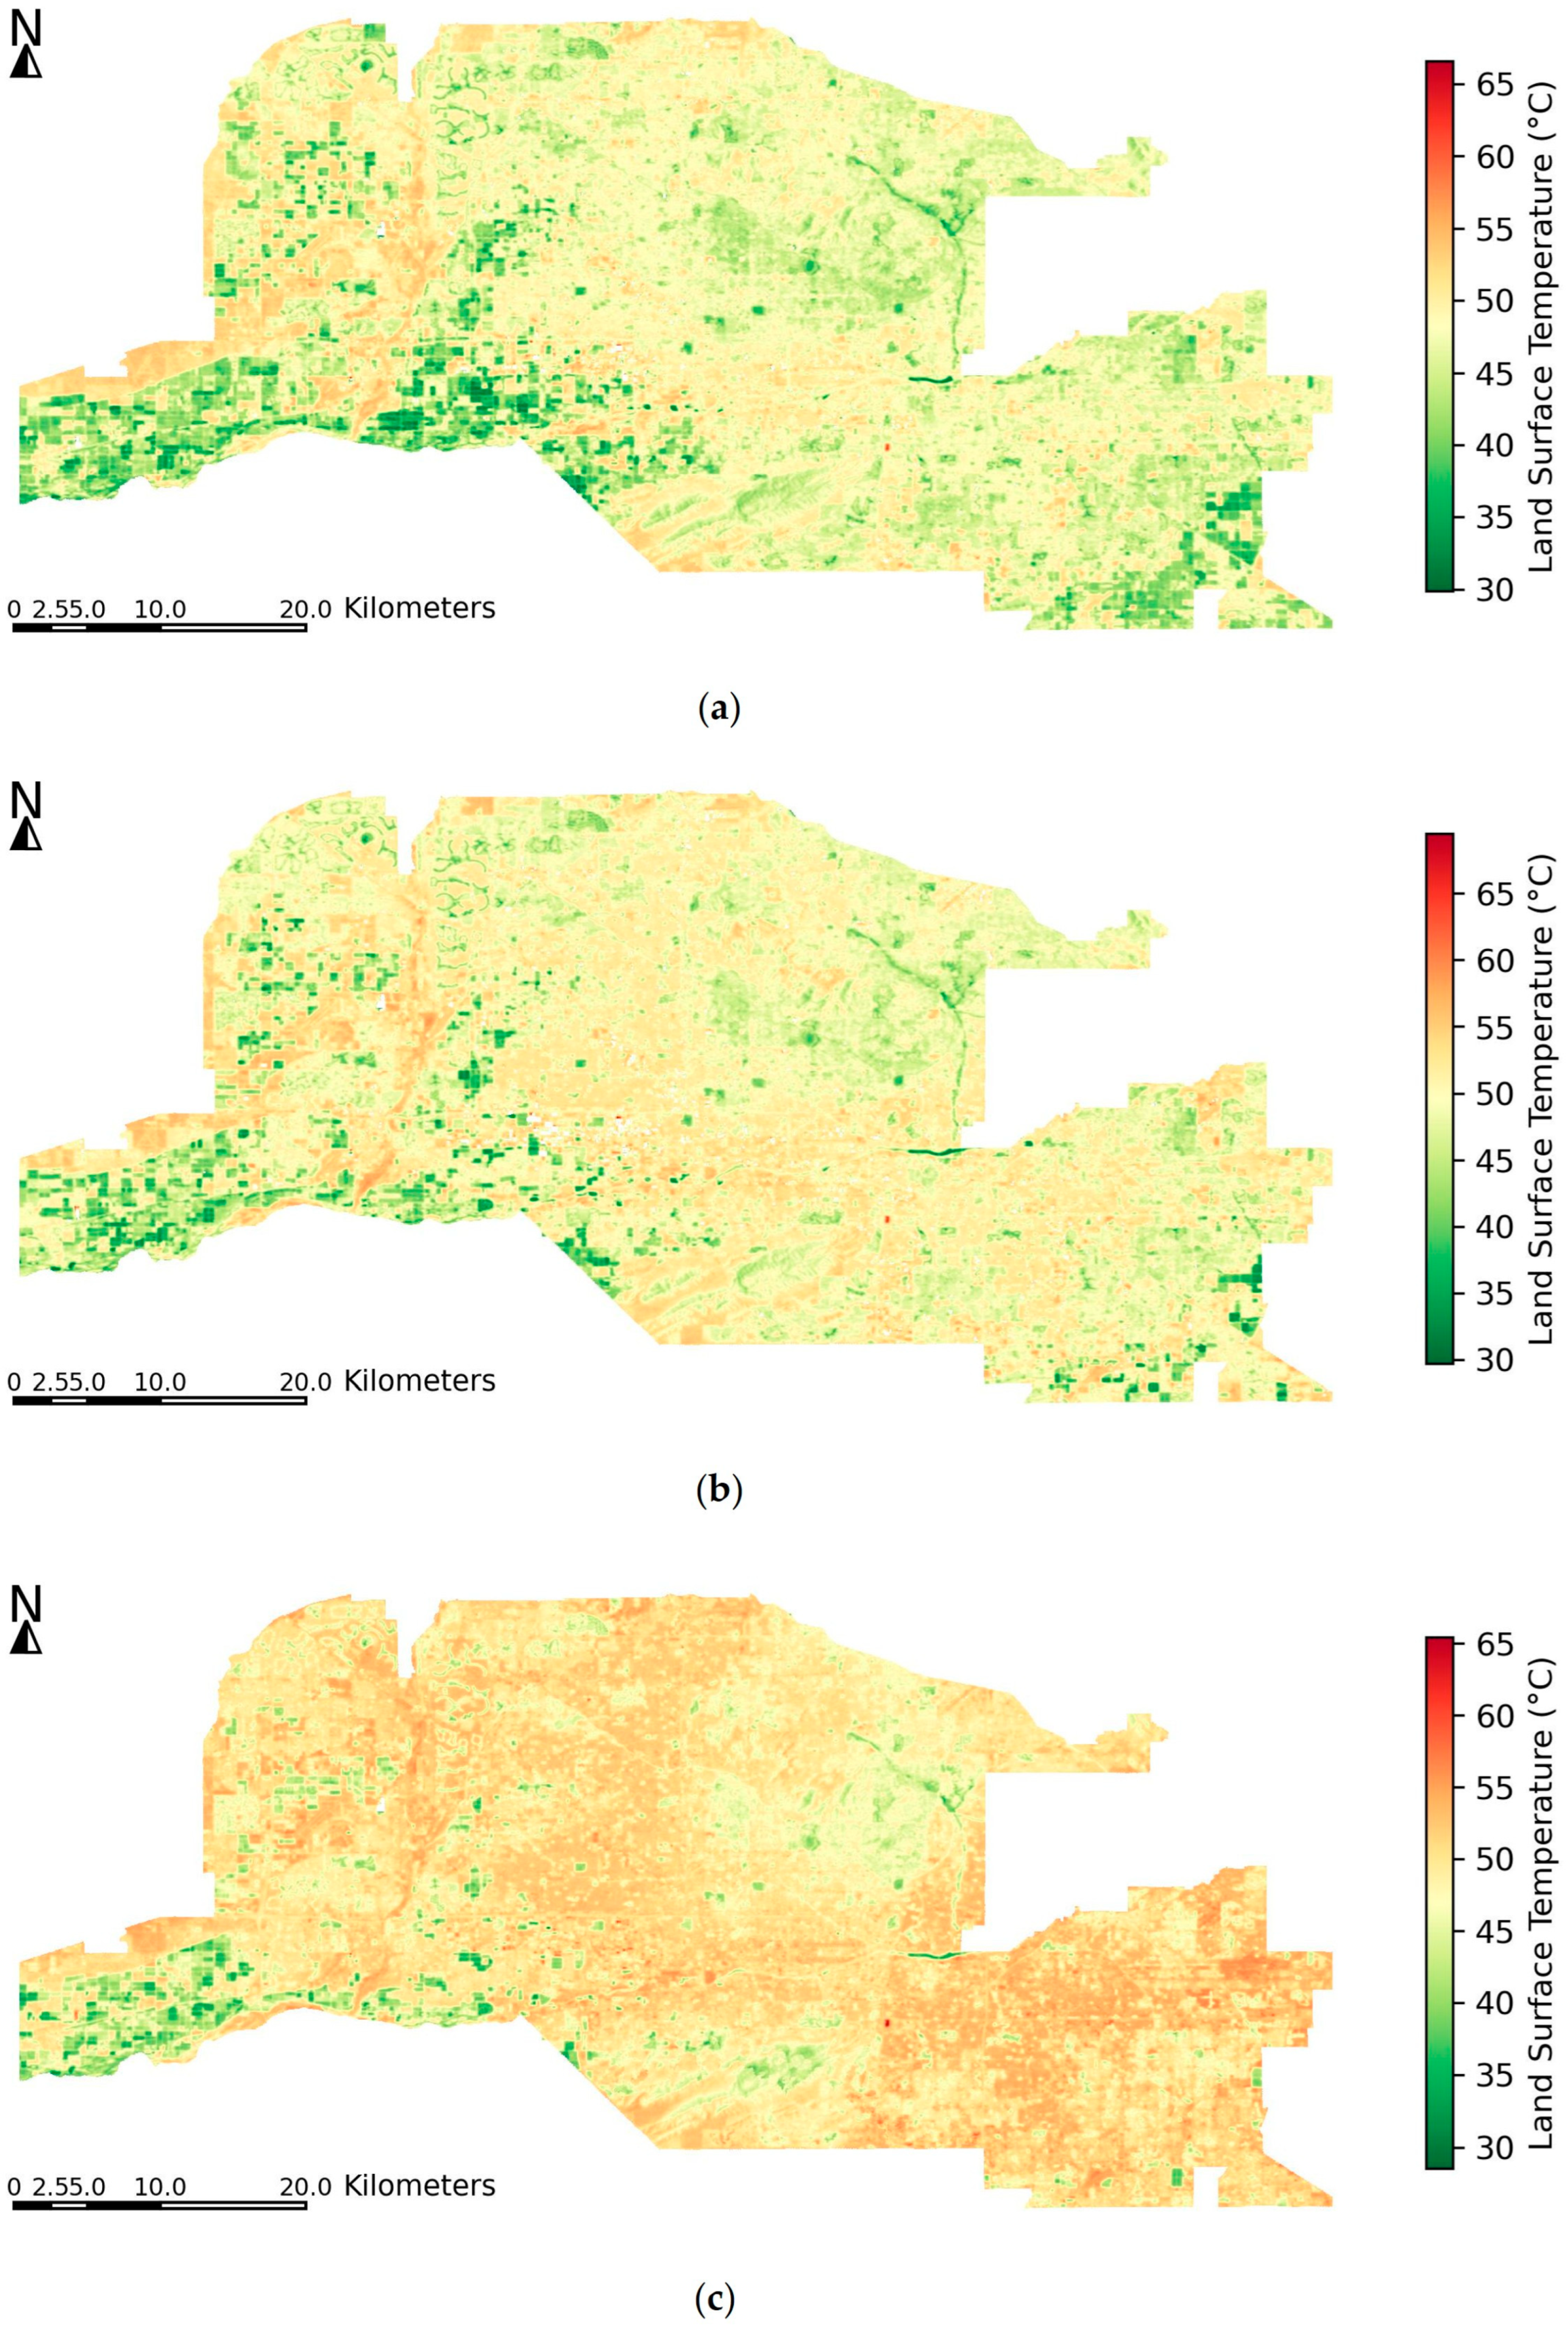
Figure 4 shows summer LST across the Phoenix metropolitan area for the years 2001, 2011, and 2021. In 2001, cooler temperatures (30–40 °C) are widespread, especially in agricultural and vegetated areas along the outskirts. Urban cores appear warmer, but the heat distribution is relatively moderate. By 2011, warmer areas expanded notably, with many urban and suburban regions reaching 50–55 °C, especially in the central and southern zones. In 2021, the spatial extent of high temperatures intensified, with much of the urbanized area exceeding 55 °C, and some hotspots approaching or surpassing 60 °C, particularly in the southeastern and central portions of the metro. Meanwhile, remaining vegetated or irrigated lands continued to register cooler LSTs, though they became more spatially fragmented. Over the 20-year period, Phoenix experienced significant warming, particularly in areas undergoing urban expansion and densification, underscoring the influence of LULC change on urban thermal environments. Across 2011 and 2021, we also compare the spatial patterns derived from Landsat daytime LST with MODIS Aqua (~13:30 local) daily maxima composites under clear-sky conditions (Figure S1). The results identified consistent patterns between the Landsat product and MODIS peak-afternoon conditions, supporting the use of 30 m Landsat LST as a planning-relevant indicator of fine-scale thermal structure.
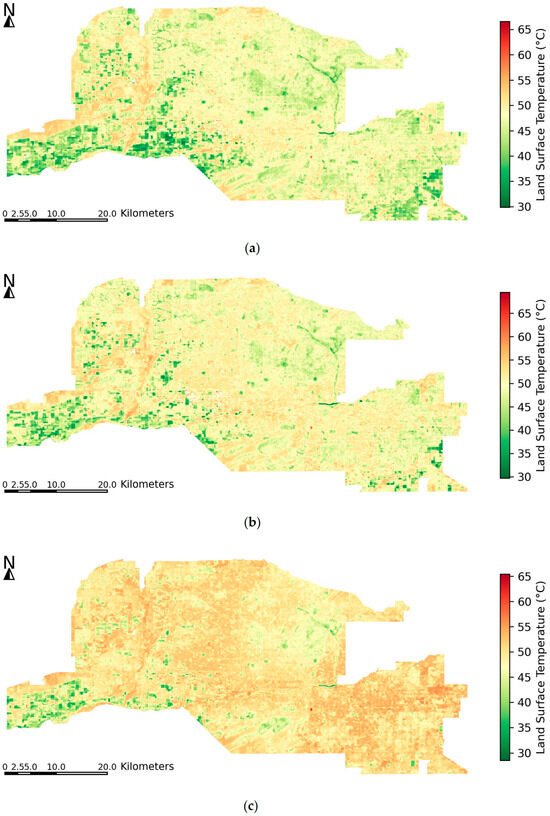
Figure 4.
Summer LST maps over the Phoenix metropolitan area in (a) 2001, (b) 2011, and (c) 2021.
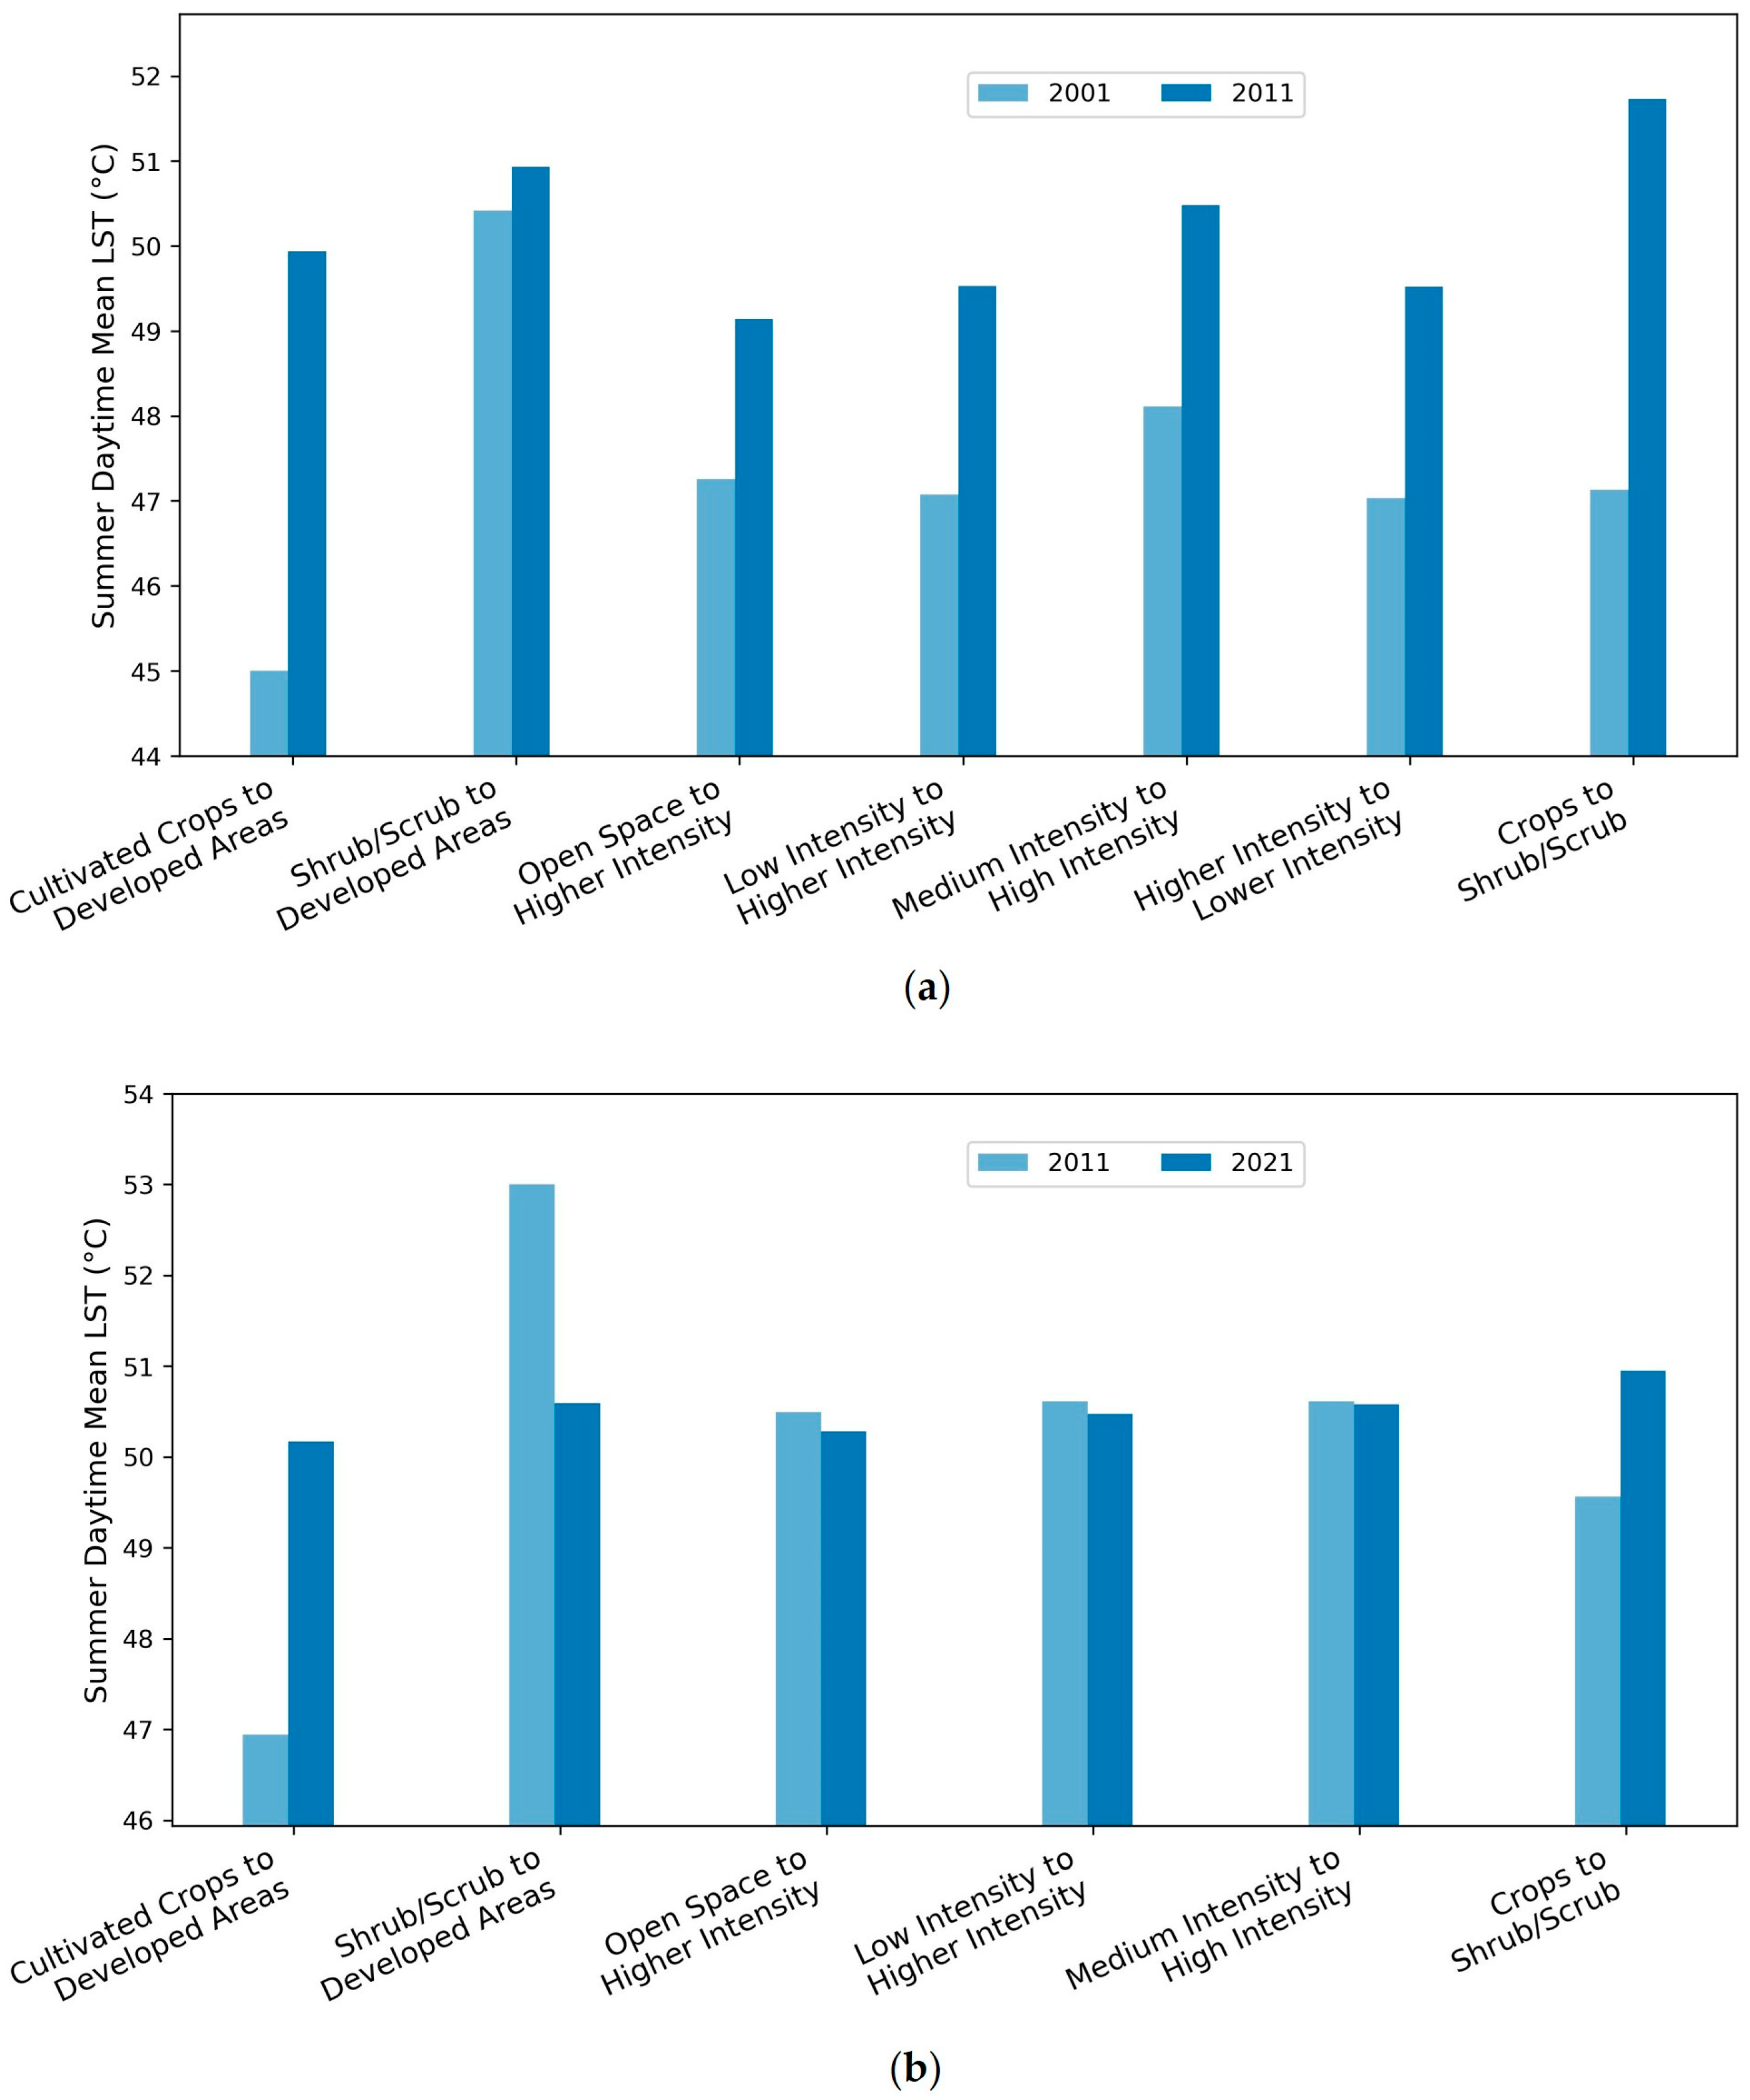
The bar charts display mean LST for major LULC change zones across 2001–2011 and 2011–2021, respectively (Figure 5). During 2001–2011, all LULC transition types experienced notable increases in LST. The largest increase occurred in areas where cultivated crops were converted to developed uses, with mean LST rising from 45 °C to 49.94 °C. Similarly, zones transitioning from open space, low-intensity, and medium-intensity development to higher-intensity development experienced 2–2.5 °C increases, reaching mean LSTs of approximately 49–50 °C by 2011. Redevelopment areas such as higher- to lower-intensity zone also exhibited a high average LST in 2011, suggesting heat persistence even in areas undergoing density reduction.
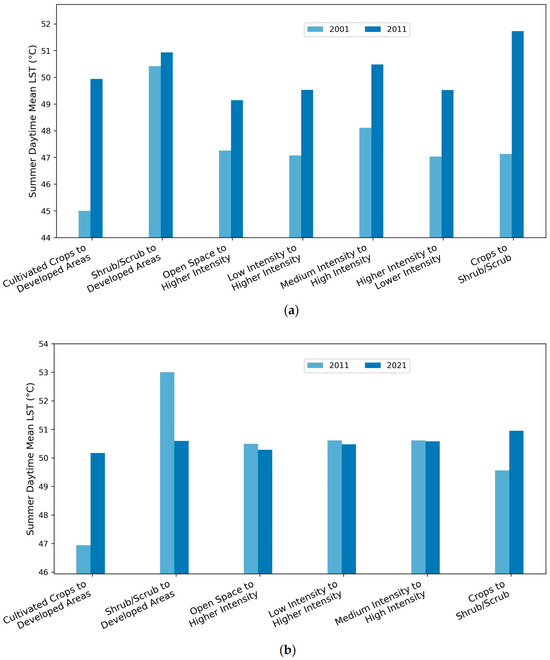
Figure 5.
Mean LST by major LULC change zones for (a) 2001–2011 and (b) 2011–2021.
In contrast, from 2011–2021, changes in mean LST were more moderate and relatively stable across most LULC change zones. The largest increase occurred again in crop-to-developed areas from 46.94 °C in 2011 to 50.17 °C in 2021. Open space, low-intensity, and medium-intensity development to higher-intensity development saw stable average LSTs and maintained around 50.5 °C. One notable pattern was found in the shrub/scrub to developed zones category, which showed a slight decrease from 53 °C in 2011 to 50.59 °C in 2021. Overall, the results indicate that the most intense warming occurred during the first decade, while the second decade saw more uniform and possibly stabilized thermal conditions across most transformation zones.
Two paired t-tests were conducted to evaluate the LST changes statistically. The t-tests reveal distinct patterns in LST change across major LULC transitions for the two decades (Table 4). For 2001–2011, all LULC conversion categories experienced statistically significant increases in LST. The largest increase occurred in areas converted from cultivated crops to developed land (+5.146 °C), followed by transitions from low-intensity to higher-intensity development (+2.568 °C), crops to shrub/scrub (+2.514 °C), and medium- to high-intensity development (+2.346 °C). These increases align with bar chart patterns (Figure 5), showing a consistent rise in mean LST across nearly all conversion types during this period.

Table 4.
Results of paired t-tests on LST change for 2001–2011 and 2011–2021.
In contrast, the 2011–2021 results suggest reduced and more variable LST changes. Although areas converting from cultivated crops to developed land still showed a significant increase (+3.151 °C), intensification conversions such as low- to higher-intensity and medium- to high-intensity development exhibited statistically non-significant changes. Notably, areas transitioning from shrub/scrub to developed land showed a significant cooling effect, which also appears in the bar chart as a decline in mean LST (Figure 5). Note that the observed “cooling effect” does not imply that urbanization inherently reduces surface heat. Rather, this pattern reflects the high baseline LST of natural shrub/scrub surfaces, which averaged approximately 53 °C during the study period (Figure 5). The paired t-test confirms that the mean LST after conversion remains lower by approximately 2.4 °C. The reduction likely results from the introduction of irrigated landscaping, vegetation cover, and reflective roofing materials. These features increase albedo and evapotranspiration relative to the original desert condition, producing an apparent local cooling effect. Together, the findings suggest a shift in the thermal impacts of urbanization patterns between the two decades, with less consistent warming effects in the latter period.
3.4. Joint Influence of LULC Change and Socio-Demographic Variables on LST Change
The following analyses extend the correlation results by using WLS and MGWR models to simultaneously examine how multiple LULC and socio-demographic variables influence LST change, while accounting for spatial non-stationarity.
Table 5 and Table 6 show the regression results of the weighted least squares regression for 2001–2011 and 2011–2021, respectively. For both time periods, the percent area converted from cultivated crops to developed areas was the strongest and most significant positive predictor of LST change (standardized β = 0.42 and 0.476), highlighting the substantial warming effect of converting vegetated land to built environment. Both decades saw a significant negative relationship between percent area converted from shrub/scrub to developed areas and LST change. This could be due to the fact that arid shrub/scrub lands typically have high LSTs, and their conversions to developed areas are often accompanied by cooling features such as trees and grass, resulting in cooler or less heat-retentive environments. Notably, the percent area converted from open space and low-intensity development to higher-intensity development had a negative relationship with LST change. These types of LULC change were typically infill or redevelopment in already urbanized areas, where lower-density developments are replaced with more compact, efficient structures. These areas often retain existing vegetation or cooling infrastructure such as green spaces and reflective materials, leading to minimal or even reduced net LST increases. There was a negative relationship between total population change and LST change, particularly in the earlier decade. This indicates that areas experiencing greater population growth were newly developed areas with cooling features such as tree cover and irrigated landscaping, while areas with population decline may have included older neighborhoods with aging infrastructure with less vegetation cover and more exposure to impervious surfaces and vacant land. Overall, while some key drivers remained stable, the regression suggests a marked change in the relative importance and thermal effects of land transformation types and demographic trends.

Table 5.
Results of weighted least squares regression for 2001–2011.

Table 6.
Results of weighted least squares regression for 2011–2021.
Table 7 presents the model performance of WLS, GWR, and MGWR for the two study periods using R2 and the Corrected Akaike Information Criterion (AICc) as evaluation metrics, with a higher R2 and a lower AICc indicating a better model fit. While the WLS models showed relatively low explanatory power, the GWR models moderately improved model fit, and the MGWR model achieved the best goodness of fit. Across both timeframes, MGWR consistently outperformed WLS and GWR, achieving the highest R2 values and the lowest AICc scores. These results highlight the advantage of MGWR in modeling spatially varying relationships in complex urban environments.

Table 7.
Performance comparison among WLS, GWR, and MGWR.
Table 8 presents the MGWR results, including mean coefficient estimates for significant cases and associated bandwidths for key predictors of LST change. Compared to the global WLS models (Table 5 and Table 6), MGWR yielded stronger and more differentiated estimates, while also capturing the varying spatial scales of influence. For instance, the percentage of cultivated crops converted to developed areas showed the strongest positive association with LST change in both periods, with its bandwidth decreasing from 49 CBGs to 43 CBGs. In contrast, the percentage of shrub/scrub to developed areas showed moderate negative relationship across both decades, with consistently large bandwidths suggesting spatially widespread influence. The percent of open space to higher-intensity development also showed a negative association with LST change in 2001–2011, with a broad spatial scale. Meanwhile, percent low-intensity to higher-intensity development (2011–2021) and population change (both periods) showed weaker negative effects and operated at smaller spatial scales. Notably, changes in Black and Asian populations were found to be statistically insignificant in the MGWR model for 2001–2011, despite appearing in the WLS model. These results demonstrate MGWR’s capacity to distinguish spatially varying processes and reveal the multiscale nature of socio-environmental influences on urban heat dynamics, underscoring its advantage over global models in capturing urban complexity.

Table 8.
Mean significant coefficient estimates and bandwidths from MGWR.
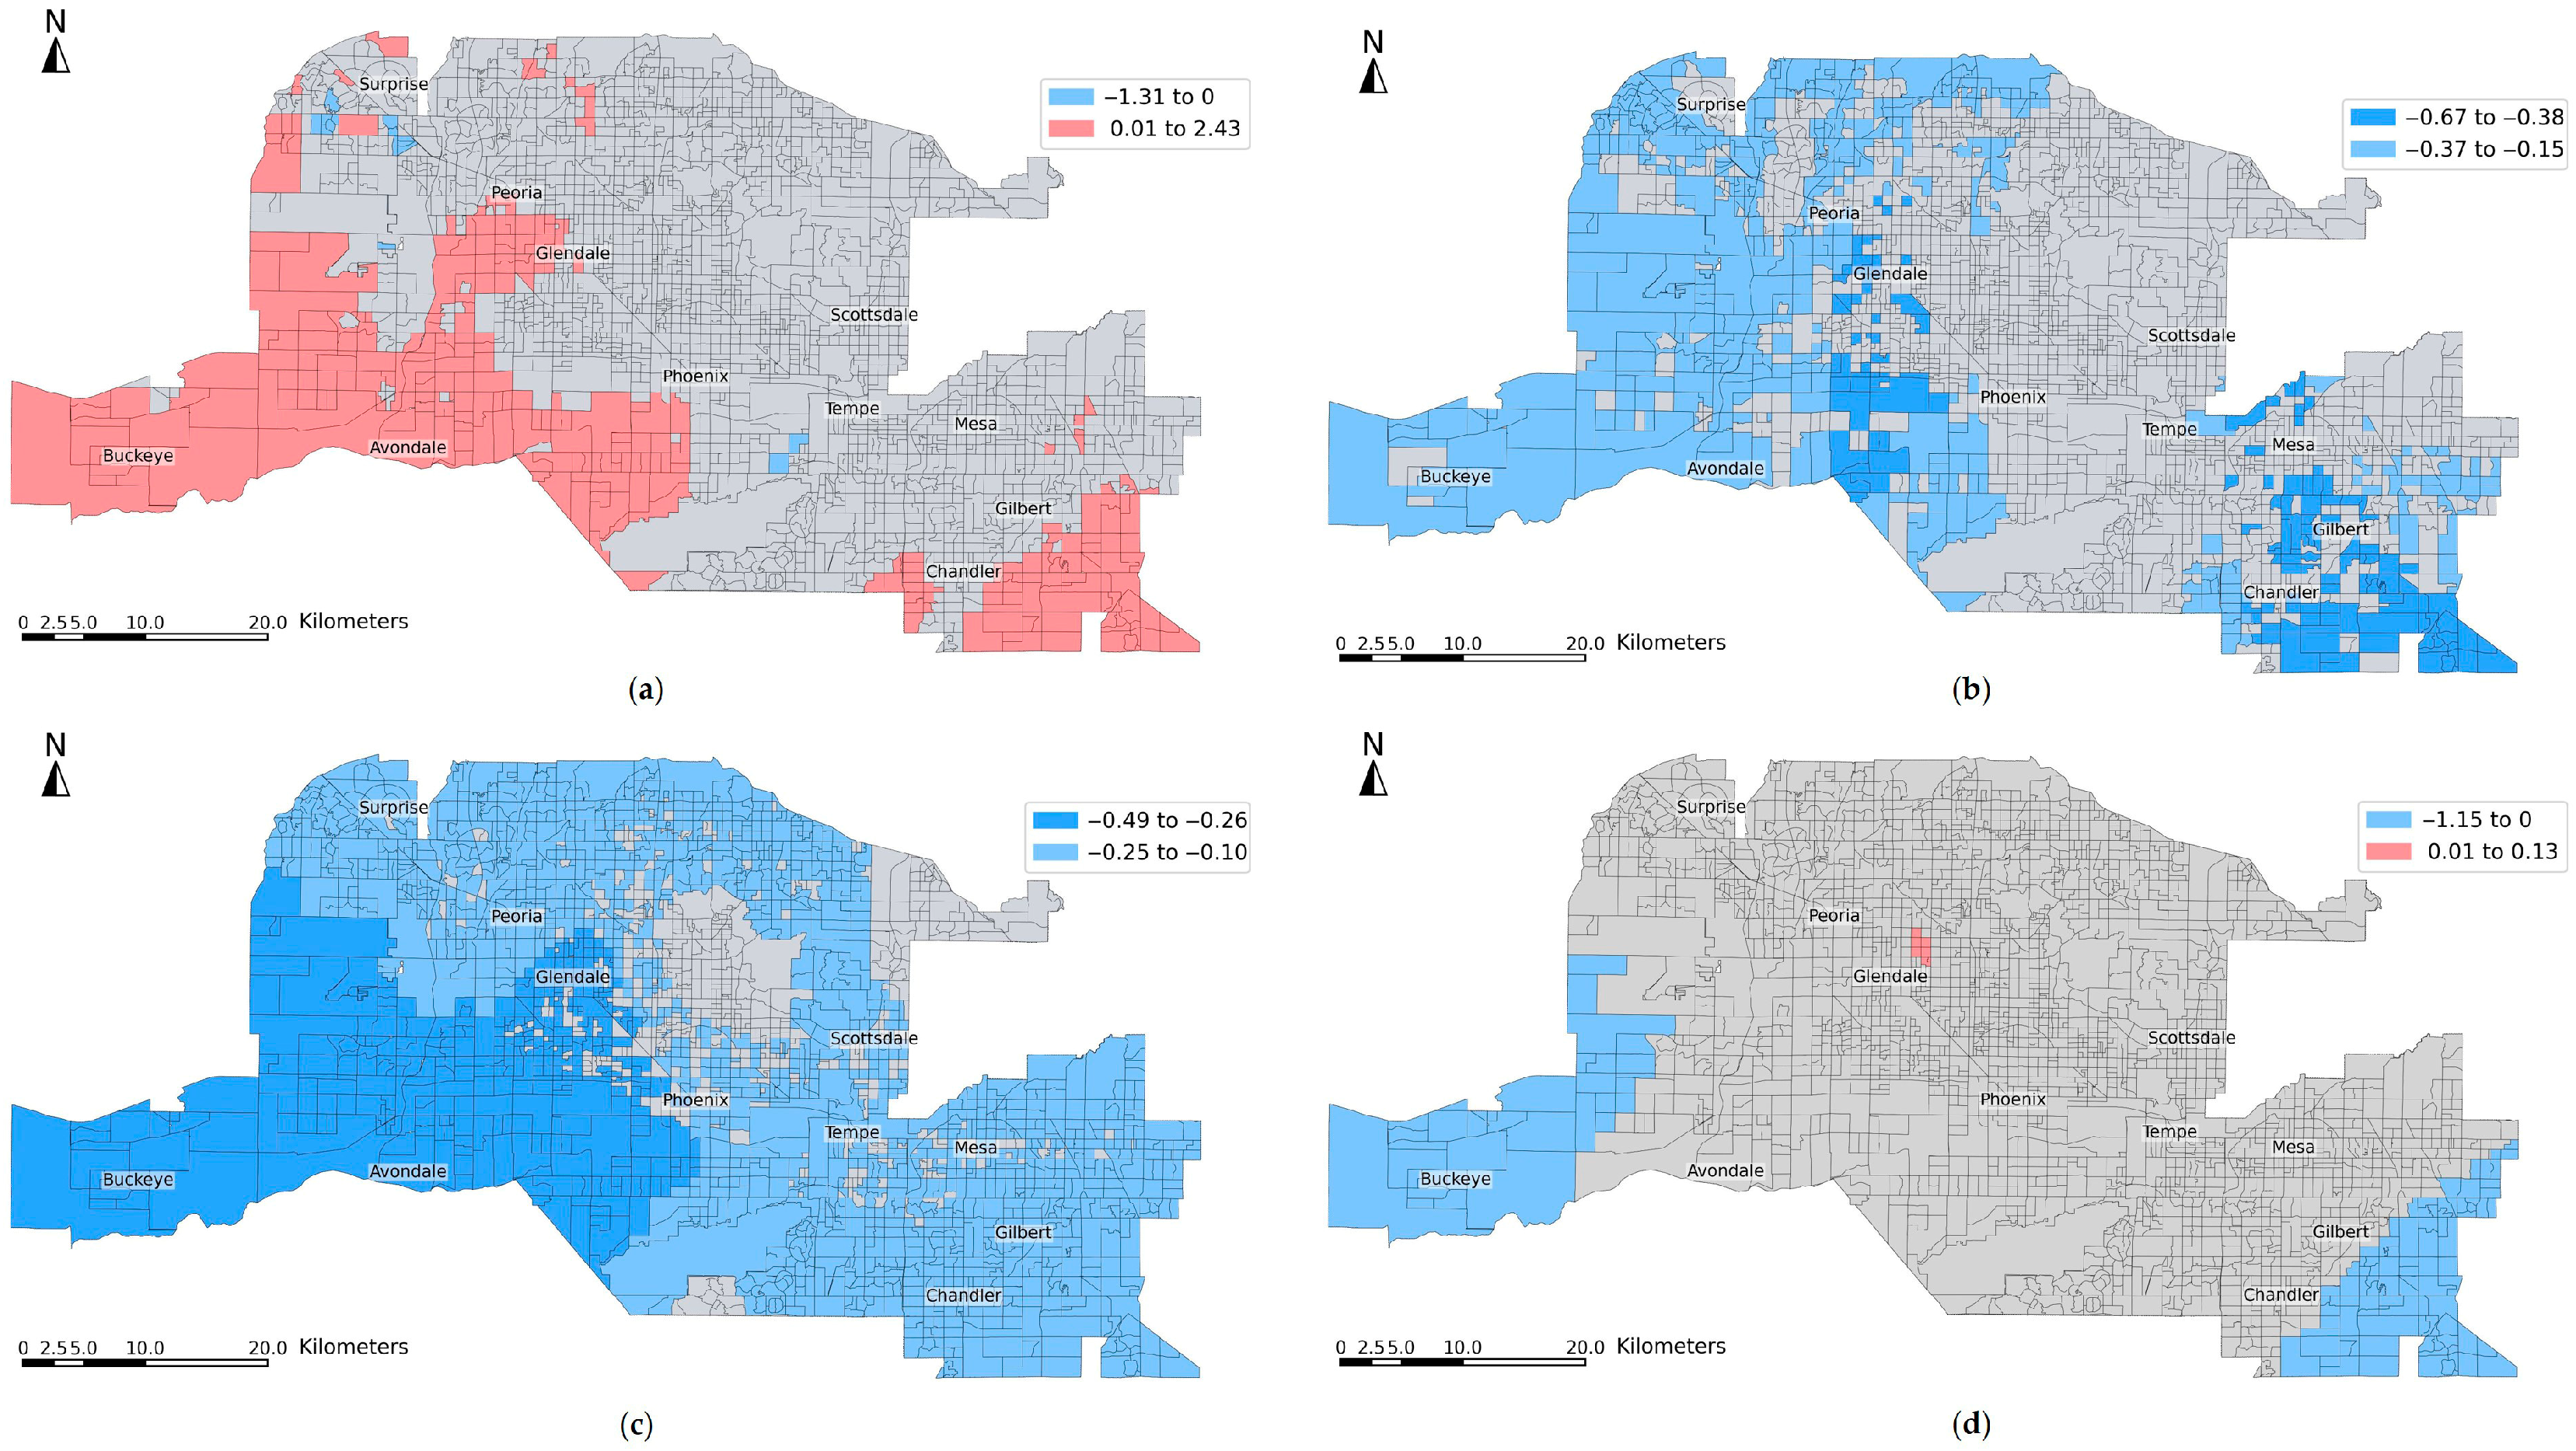
Figure 6 illustrates the spatial distribution of significant MGWR coefficient estimates for key predictors of LST change from 2001 to 2011. There is a positive relationship between the percentage of cultivated crops to developed areas and LST change, with strong effects concentrated in fringe suburbs such as Buckeye, Avondale, and Chandler (Figure 6a). This pattern, combined with the small bandwidth of 49, indicates a localized influence, where the replacement of vegetated agricultural lands with impervious urban surfaces likely led to increased surface temperatures. In contrast, Figure 6b displays a broad, regionally consistent negative association between percent shrub/scrub to developed areas and LST change, with large contiguous areas of negative coefficients in the northern, western, and southeastern regions. The high bandwidth suggests that this relationship operates at a larger spatial scale, potentially reflecting widespread development practices that reduced surface temperatures. Figure 6c shows a similarly expansive negative association for the conversion of open space to higher-intensity development, particularly across western communities such as Buckeye and Avondale. Lastly, Figure 6d indicates a negative association between population change and LST change in localized pockets—especially in Buckeye and Chandler—with a small bandwidth of 49, suggesting this relationship varies across neighborhoods and is shaped by local development practices.
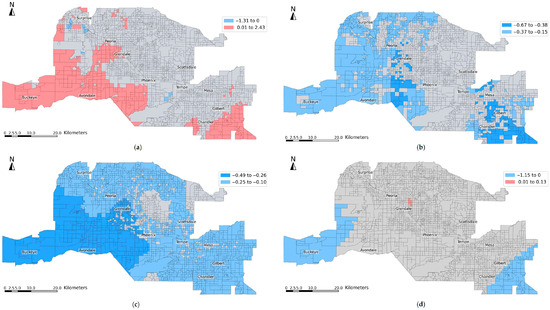
Figure 6.
Spatial distribution of significant MGWR estimates for 2001–2011: (a) percent of cultivated crops to developed areas, (b) percent of shrub/scrub to developed areas, (c) percent of open space to higher-intensity developed areas, and (d) population change.
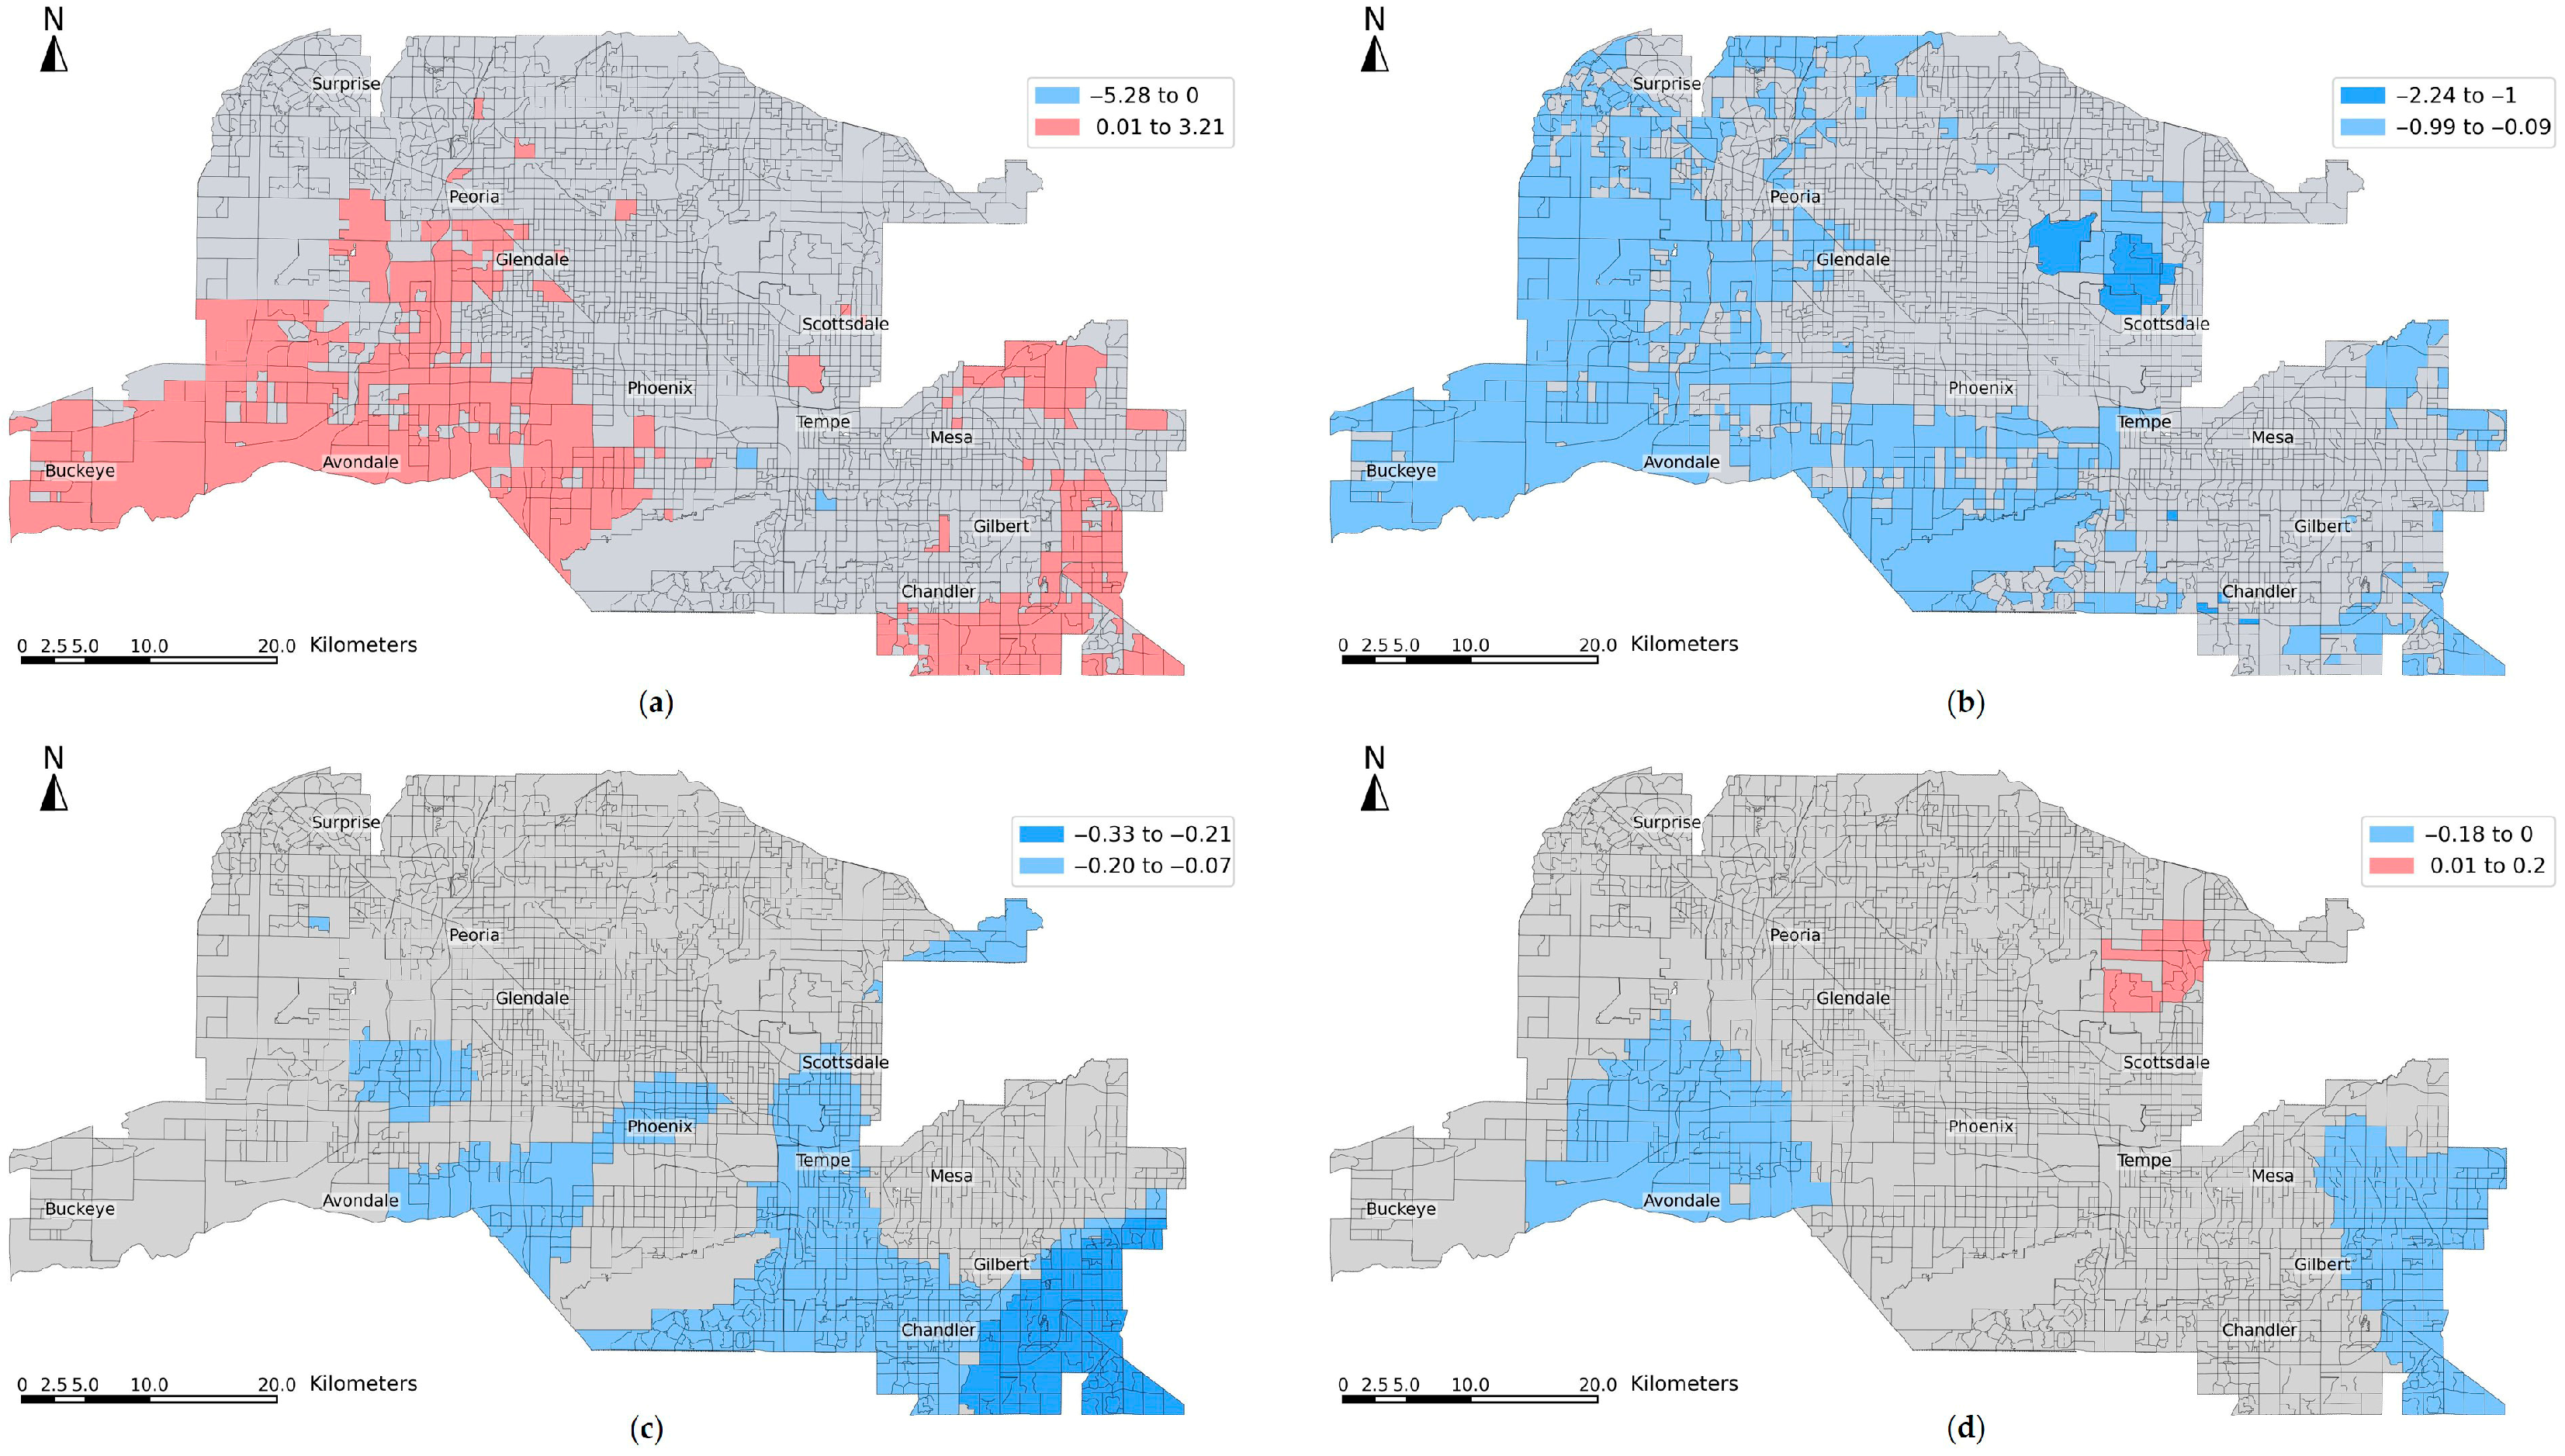
Figure 7 illustrates the spatial distribution of significant MGWR coefficient estimates for 2011–2021, capturing key drivers of LST change. The percentage of cultivated crops converted to developed areas shows a strong and consistent positive relationship with LST change, with significant clusters located in fast-developing outer suburbs such as Buckeye, Avondale, and Chandler (Figure 7a). The small bandwidth of 43 suggests that this relationship operates at a highly localized scale, where recent agricultural conversions have intensified surface heating. The percentage of shrub/scrub to developed areas is negatively associated with LST change (Figure 7b), with significant patterns found in northern Phoenix, Scottsdale, and western and southeastern suburbs. This moderate cooling effect operates at a regional scale, suggesting uniform landscape characteristics across these zones. The percentage of low- to higher-intensity development and population change both show weak but significant negative associations with LST, with highly localized effects, especially in Chandler, Gilbert, and Avondale (Figure 7c,d).
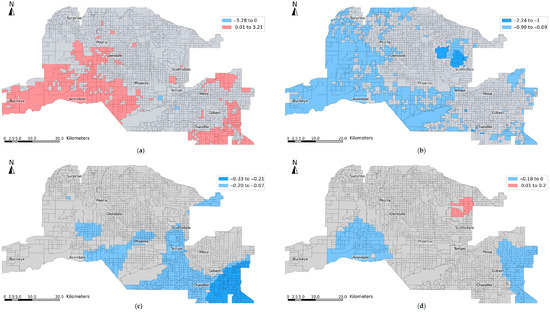
Figure 7.
Spatial distribution of significant MGWR estimates for 2011–2021: (a) percent of cultivated crops to developed areas, (b) percent of shrub/scrub to developed areas, (c) percent of low-intensity to higher-intensity developed areas, and (d) population change.
Compared to 2001–2011, several patterns are consistent while others diverge. Percent of crops to developed areas remained a strong positive predictor in both decades, with a highly localized spatial footprint concentrated in suburban regions. The cooling effect of percent of shrub/scrub to developed areas was also observed previously, though it operated at a slightly smaller spatial extent. Notably, percent of open space to developed areas showed a broad regional cooling effect in 2001–2011 but became insignificant in the recent decade, indicating changing redevelopment trends. Meanwhile, percent of lower-intensity to higher-intensity developed areas and population change was weakly significant in 2011–2021, reflecting evolving infill practices and demographic shifts that may support more heat-resilient urbanization.
4. Discussion
The urbanization trajectory of the Phoenix metropolitan area over the past two decades reveals a distinct shift in both the pace and pattern of land transformation. From 2001 to 2011, Phoenix exhibited characteristics of leapfrog urbanization, with large-scale conversions of agricultural lands, shrub/scrub, and open space to developed uses occurring not only along the urban periphery but also in disconnected patches beyond the existing urban footprint [47,49]. This pattern, while common in rapidly growing desert cities with abundant undeveloped land, contributed to urban sprawl and created fragmented landscapes that intensified environmental challenges, including the UHI effect. In contrast, the 2011–2021 period marked a shift toward more infill development and spatial consolidation, where land conversion became increasingly concentrated in previously developed areas or at the immediate edge of existing urban zones. These changes reflect a broader evolution from an early-stage, opportunistic development phase to a more regulated and spatially selective urbanization process, influenced by land constraints, policy interventions, or planning interventions favoring compact growth [50].
Our findings reveal that distinct patterns of land transformation across the Phoenix metro area are tightly intertwined with socio-demographic dynamics, especially during the first decade of analysis. From 2001 to 2011, strong positive correlations were observed between the conversion of cultivated crops to developed areas and increases in population, housing units, and all racial/ethnic groups—indicating that agricultural lands served as primary frontiers for suburban growth. This is consistent with findings from Cairo’s peri-urban agricultural loss [51] and Beijing’s suburban densification [52]. In contrast, conversions of shrub/scrub and open space to development exhibited weaker but still positive associations, suggesting more moderate demographic growth tied to peripheral land development. On the other hand, internal redevelopment processes, such as transitions from low- or medium-intensity to higher-intensity development, were negatively correlated with population and housing growth. These align with findings from Los Angeles that densification often led to displacement or changes in land use away from residential purposes [53]. These cases highlight a broader pattern where urban intensification may not equate to demographic growth but can instead reflect shifts in neighborhood character, zoning priorities, or redevelopment for non-residential land uses.
The MGWR results further demonstrate that the spatial scale of drivers matters. The warming impact of cropland-to-development conversion reflects localized heat amplification linked to vegetation loss and increased surface albedo—patterns also documented in Las Vegas and Riyadh, where irrigation decline and rapid construction intensified surface temperatures [54,55]. In contrast, the conversion of shrub/scrub to developed areas consistently exhibited a moderate negative association with LST change, with large bandwidths. This apparent cooling, however, represents a relative reduction from an extremely hot natural baseline rather than an absolute cooling of the urban fabric itself. Phoenix’s broader-scale cooling effects echo findings from Beijing, where interactions between blue–green space and urban form produce non-linear influences on both daytime and nighttime LST [56].
Other types of urban intensification—such as open space and low-intensity to higher-intensity development—exhibited negative associations with LST change, but their significance and scale varied across time. Open space redevelopment showed a broad cooling effect in 2001–2011 but became insignificant by 2011–2021. Meanwhile, low-intensity to higher-intensity conversion emerged as a weak but significant factor in the later period, with a small bandwidth, suggesting localized redevelopment that potentially includes heat-mitigating features such as compact design or reflective materials. These findings echo emerging evidence that urban densification can be heat-neutral or even cooling when paired with climate-sensitive design [57,58].
Socio-demographic variables also contributed to LST patterns, though at smaller spatial scales. Population change showed weak negative associations in both decades, with localized significance in cities such as Chandler and Avondale. This may indicate that new residential developments, which often occur in growing suburbs, include more heat-mitigating infrastructure, whereas older, stagnant neighborhoods with declining populations may retain legacy heat-retaining features [15]. Notably, while changes in Black and Asian populations were included in the WLS model for 2001–2011, they were insignificant in the MGWR model, reinforcing the value of MGWR in filtering out spurious global associations that lack localized spatial support.
Together, these results emphasize that different predictors influence LST change at different spatial scales. MGWR enables researchers and policymakers to move beyond a “one-size-fits-all” approach by distinguishing variables that act locally—such as agricultural loss or population change—from those that operate more uniformly across the metro region, like shrub/scrub conversion. This spatially explicit understanding is especially valuable in fast-growing, environmentally vulnerable cities like Phoenix, where urban form, development pace, and socio-demographic composition vary dramatically across space and time.
One innovative mitigation strategy that connects directly with this study is the Cool Pavement Program launched by the City of Phoenix in collaboration with Arizona State University [59,60]. The program applies reflective coatings (“CoolSeal”) to asphalt surfaces to reduce surface and ambient temperatures. Recent evaluations have shown that treated streets are on average 12 °F cooler than traditional asphalt during the daytime [61,62]. These effects are especially relevant in neighborhoods experiencing high levels of development or redevelopment. Programs like this illustrate how data-informed interventions can directly mitigate heat risks in redeveloping neighborhoods. Similar principles are now being adopted in Doha, Dubai and Riyadh, where reflective materials, shading systems, and high-albedo pavements are being integrated into new districts to counteract rising heat stress [63,64].
Beyond Phoenix, this study contributes to a global understanding of urban heat management in arid and semi-arid cities. Like Cairo, Riyadh, Dubai, and Beijing, Phoenix faces the dual challenge of accommodating rapid growth while mitigating extreme heat under limited water resources [51,52,63,64]. The integration of remote sensing, multiscale regression, and socio-demographic analysis presented here offers a transferable framework for diagnosing where and why urban heat emerges and how it intersects with development trajectories. By situating Phoenix within a broader international context, the study demonstrates that lessons from one desert metropolis can inform global strategies for sustainable and climate-resilient urbanization.
5. Conclusions
This study examined the interrelationships among LULC change, socio-demographic dynamics, and LST patterns in the Phoenix metropolitan area over two decades. By integrating spatially refined LULC change data, decadal census-based socio-demographic indicators, and satellite-derived LST, the study provides new insights into how distinct urban transformation pathways and demographic trends jointly shape urban heat dynamics in an arid environment. Despite the contributions, several limitations should be acknowledged. First, the harmonization of socio-demographic data through area-weighted interpolation may introduce localized uncertainty, especially in low-overlap census block groups associated with greenfield expansion—areas where previous demographic boundaries were sparse or absent. Future research could further quantify this uncertainty using dasymetric weighting or Monte Carlo perturbation of boundary geometries. Second, there is an inherent mismatch in spatial scales between the 30 m LST observations and the aggregated socio-demographic data at the block-group level, which may obscure micro-scale variations in population exposure. Third, the study focuses exclusively on daytime surface temperature derived from satellite imagery and does not incorporate diurnal LST amplitude, air temperature, humidity, or heatwave duration, all of which are critical to understanding thermal comfort and heat stress. Fourth, while the findings imply clear environmental equity and public health dimensions, these links were not explicitly modeled. Future research could integrate neighborhood-level health outcomes or heat-vulnerability indicators to bridge this gap.
Although the analysis concludes in 2021, this timeframe does not diminish the novelty of the study. The two-decade period analyzed (2001–2021) represents the critical phase of Phoenix’s rapid expansion and subsequent stabilization, providing valuable insights into long-term land transformation and heat evolution. Newer data has not yet been fully harmonized across sources, and incorporating them would introduce inconsistency without substantially changing the study’s conclusions. Thus, the present temporal boundary ensures analytical coherence while still offering timely evidence to inform ongoing urban-heat mitigation and planning initiatives.
The current models capture 55–65% of the variance in LST, an explanatory power relatively high for analyses that integrate both physical and socio-demographic variables. Remaining variation likely reflects micro-scale urban design factors such as tree canopy, surface albedo, building height, and pavement materials. Incorporating these factors would likely improve model performance. Future work will extend this framework by integrating decade-consistent micro-scale and biophysical data to test whether the observed shrub/scrub “cooling” effect persists when such localized characteristics are controlled for. This direction will help bridge the gap between regional-scale thermal analysis and micro-scale urban design strategies, advancing understanding of heat resilience in arid cities.
The findings suggest several actionable strategies for planners and policymakers in arid urban regions. (1) Prioritize compact and infill development over outward expansion into agricultural or vegetated lands to minimize heat amplification. (2) Incorporate reflective materials and shade infrastructure—such as cool pavements and tree canopy cover—particularly in redevelopment areas and low-income neighborhoods where thermal exposure is high. (3) Preserve and enhance irrigated green spaces along the urban fringe to buffer surrounding communities from localized warming. (4) Integrate socio-demographic and environmental data into municipal heat mitigation plans to identify populations most vulnerable to surface heat exposure. Together, these measures can help advance climate-resilient urban planning and equitable adaptation strategies in desert metropolitan areas such as Phoenix.
Supplementary Materials
The following supporting information can be downloaded at: https://www.mdpi.com/article/10.3390/land14112141/s1, Figure S1: Comparison of summer LST across sensors and years for Phoenix: (a,c) Landsat daytime LST in 2011 and 2021; (b,d) MODIS Aqua peak-afternoon LST in 2011 and 2021; Table S1: Landsat scenes used to compute summer mean LST in 2001, 2011, and 2021, including sensor, path/row, acquisition date, and scene cloud cover (%).
Author Contributions
Conceptualization, C.F.; methodology, C.F.; formal analysis, C.F. and M.J.I.J.P.; data curation, M.J.I.J.P. and Y.Z.; writing—original draft preparation, C.F., M.J.I.J.P., and D.S.; writing—review and editing, C.F., M.J.I.J.P., Y.Z. and D.S.; visualization, M.J.I.J.P.; supervision, C.F. and D.S.; funding acquisition, D.S. All authors have read and agreed to the published version of the manuscript.
Funding
This research was funded by National Science Foundation under Grant No. 2418359.
Data Availability Statement
All GEE scripts for Landsat LST retrieval and the MODIS Aqua peak-afternoon comparison are openly available at: https://code.earthengine.google.com/?accept_repo=users/drought_PDSI_1990_2015/LST_PHX.
Conflicts of Interest
The authors declare no conflicts of interest.
References
- Shrestha, M.K.; York, A.M.; Boone, C.G.; Zhang, S. Land Fragmentation Due to Rapid Urbanization in the Phoenix Metropolitan Area: Analyzing the Spatiotemporal Patterns and Drivers. Appl. Geogr. 2012, 32, 522–531. [Google Scholar] [CrossRef]
- Dadi, D.; Azadi, H.; Senbeta, F.; Abebe, K.; Taheri, F.; Stellmacher, T. Urban Sprawl and Its Impacts on Land Use Change in Central Ethiopia. Urban For. Urban Green. 2016, 16, 132–141. [Google Scholar] [CrossRef]
- Mockrin, M.H.; Locke, D.H.; Stewart, S.I.; Hammer, R.B.; Radeloff, V.C. Forests, Houses, or Both? Relationships between Land Cover, Housing Characteristics, and Resident Socioeconomic Status across Ecoregions. J. Environ. Manag. 2019, 234, 464–475. [Google Scholar] [CrossRef]
- Chow, W.T.L.; Chuang, W.-C.; Gober, P. Vulnerability to Extreme Heat in Metropolitan Phoenix: Spatial, Temporal, and Demographic Dimensions. Prof. Geogr. 2012, 64, 286–302. [Google Scholar] [CrossRef]
- Wang, C.; Myint, S.; Wang, Z.; Song, J. Spatio-Temporal Modeling of the Urban Heat Island in the Phoenix Metropolitan Area: Land Use Change Implications. Remote Sens. 2016, 8, 185. [Google Scholar] [CrossRef]
- Dissanayake, D.; Morimoto, T.; Murayama, Y.; Ranagalage, M.; Handayani, H.H. Impact of Urban Surface Characteristics and Socio-Economic Variables on the Spatial Variation of Land Surface Temperature in Lagos City, Nigeria. Sustainability 2018, 11, 25. [Google Scholar] [CrossRef]
- Sadiq Khan, M.; Ullah, S.; Sun, T.; Rehman, A.U.; Chen, L. Land-use/land-cover changes and its contribution to urban heat Island: A case study of Islamabad, Pakistan. Sustainability 2020, 12, 3861. [Google Scholar] [CrossRef]
- Fan, C.; Myint, S.; Kaplan, S.; Middel, A.; Zheng, B.; Rahman, A.; Huang, H.-P.; Brazel, A.; Blumberg, D. Understanding the Impact of Urbanization on Surface Urban Heat Islands—A Longitudinal Analysis of the Oasis Effect in Subtropical Desert Cities. Remote Sens. 2017, 9, 672. [Google Scholar] [CrossRef]
- Wu, W.; Li, C.; Liu, M.; Hu, Y.; Xiu, C. Change of Impervious Surface Area and Its Impacts on Urban Landscape: An Example of Shenyang between 2010 and 2017. Ecosyst. Health Sustain. 2020, 6, 1767511. [Google Scholar] [CrossRef]
- Morabito, M.; Crisci, A.; Guerri, G.; Messeri, A.; Congedo, L.; Munafò, M. Surface Urban Heat Islands in Italian Metropolitan Cities: Tree Cover and Impervious Surface Influences. Sci. Total Environ. 2021, 751, 142334. [Google Scholar] [CrossRef] [PubMed]
- Nasar-u-Minallah, M.; Haase, D.; Qureshi, S. Evaluating the Impact of Landscape Configuration, Patterns and Composition on Land Surface Temperature: An Urban Heat Island Study in the Megacity Lahore, Pakistan. Environ. Monit. Assess. 2024, 196, 627. [Google Scholar] [CrossRef]
- Soltanifard, H.; Aliabadi, K. Impact of Urban Spatial Configuration on Land Surface Temperature and Urban Heat Islands: A Case Study of Mashhad, Iran. Theor. Appl. Clim. 2019, 137, 2889–2903. [Google Scholar] [CrossRef]
- Fan, C.; Myint, S.W.; Zheng, B. Measuring the Spatial Arrangement of Urban Vegetation and Its Impacts on Seasonal Surface Temperatures. Prog. Phys. Geogr. Earth Environ. 2015, 39, 199–219. [Google Scholar] [CrossRef]
- Fan, C.; Wang, Z. Spatiotemporal Characterization of Land Cover Impacts on Urban Warming: A Spatial Autocorrelation Approach. Remote Sens. 2020, 12, 1631. [Google Scholar] [CrossRef]
- Harlan, S.L.; Brazel, A.J.; Prashad, L.; Stefanov, W.L.; Larsen, L. Neighborhood Microclimates and Vulnerability to Heat Stress. Soc. Sci. Med. 2006, 63, 2847–2863. [Google Scholar] [CrossRef] [PubMed]
- Ruddell, D.; Harlan, S.L.; Grossman-Clarke, S.; Chowell, G. Scales of Perception: Public Awareness of Regional and Neighborhood Climates. Clim. Change 2012, 111, 581–607. [Google Scholar] [CrossRef]
- Ma, W.; Jiang, G.; Li, W.; Zhou, T. How Do Population Decline, Urban Sprawl and Industrial Transformation Impact Land Use Change in Rural Residential Areas? A Comparative Regional Analysis at the Peri-Urban Interface. J. Clean. Prod. 2018, 205, 76–85. [Google Scholar] [CrossRef]
- Chi, G.; Ho, H.C. Population Stress: A Spatiotemporal Analysis of Population Change and Land Development at the County Level in the Contiguous United States, 2001–2011. Land Use Policy 2018, 70, 128–137. [Google Scholar] [CrossRef] [PubMed]
- Jia, W.; Zhao, S.; Zhang, X.; Liu, S.; Henebry, G.M.; Liu, L. Urbanization Imprint on Land Surface Phenology: The Urban–Rural Gradient Analysis for Chinese Cities. Glob. Change Biol. 2021, 27, 2895–2904. [Google Scholar] [CrossRef] [PubMed]
- Adeyeri, O.E.; Zhou, W.; Laux, P.; Wang, X.; Dieng, D.; Widana, L.A.E.; Usman, M. Land Use and Land Cover Dynamics: Implications for Thermal Stress and Energy Demands. Renew. Sustain. Energy Rev. 2023, 179, 113274. [Google Scholar] [CrossRef]
- Shahfahad; Naikoo, M.W.; Towfiqul Islam, A.R.M.d.; Mallick, J.; Rahman, A. Land Use/Land Cover Change and Its Impact on Surface Urban Heat Island and Urban Thermal Comfort in a Metropolitan City. Urban Clim. 2022, 41, 101052. [Google Scholar] [CrossRef]
- Zhou, B.; Rybski, D.; Kropp, J.P. The Role of City Size and Urban Form in the Surface Urban Heat Island. Sci. Rep. 2017, 7, 4791. [Google Scholar] [CrossRef]
- Wang, L.; Hou, H.; Weng, J. Ordinary Least Squares Modelling of Urban Heat Island Intensity Based on Landscape Composition and Configuration: A Comparative Study among Three Megacities along the Yangtze River. Sustain. Cities Soc. 2020, 62, 102381. [Google Scholar] [CrossRef]
- Fotheringham, A.S.; Yang, W.; Kang, W. Multiscale Geographically Weighted Regression (MGWR). Ann. Am. Assoc. Geogr. 2017, 107, 1247–1265. [Google Scholar] [CrossRef]
- Wang, Z.; Fan, C.; Que, X.; Liao, F.H.; Ma, X.; Wang, H. Multi-Scale Analysis of Urban Forests and Socioeconomic Patterns in a Desert City, Phoenix, Arizona. Sci. Rep. 2024, 14, 23864. [Google Scholar] [CrossRef] [PubMed]
- Zhou, D.; Zhao, S.; Liu, S.; Zhang, L.; Zhu, C. Surface urban heat island in China’s 32 major cities: Spatial patterns and drivers. Remote Sens. Environ. 2014, 152, 51–61. [Google Scholar] [CrossRef]
- Li, X.; Zhou, Y.; Asrar, G.R.; Imhoff, M.; Li, X. The surface urban heat island response to urban expansion: A panel analysis for the conterminous United States. Sci. Total Environ. 2017, 605, 426–435. [Google Scholar] [CrossRef] [PubMed]
- Kottek, M.; Grieser, J.; Beck, C.; Rudolf, B.; Rubel, F. World Map of the Köppen-Geiger Climate Classification Updated. Meteorol. Z. 2006, 15, 259–263. [Google Scholar] [CrossRef]
- Fan, C.; Myint, S.W.; Rey, S.J.; Li, W. Time series evaluation of landscape dynamics using annual Landsat imagery and spatial statistical modeling: Evidence from the Phoenix metropolitan region. Int. J. Appl. Earth Obs. Geoinf. 2017, 58, 12–25. [Google Scholar] [CrossRef]
- Cilek, A.; Unal, M.; Middel, A. The Effects of 2-D and 3-D Urban Landscape Metrics on Mean Radiant Temperature in Hot-Arid Phoenix and Tempe, Arizona, USA. Sustain. Cities Soc. 2024, 101, 105116. [Google Scholar] [CrossRef]
- Brazel, A.; Selover, N.; Vose, R.; Heisler, G. The Tale of Two Climates-Baltimore and Phoenix Urban LTER Sites. Clim. Res. 2000, 15, 123–135. [Google Scholar] [CrossRef]
- Comus, P.W.; Phillips, S.J.; Dimmitt, M.A.; Brewer, L.M. (Eds.) A Natural History of the Sonoran Desert; University of California Press: Oakland, CA, USA, 2015. [Google Scholar]
- Berling-Wolff, S.; Wu, J. Modeling urban landscape dynamics: A case study in Phoenix, USA. Urban Ecosyst. 2004, 7, 215–240. [Google Scholar] [CrossRef]
- Olgun, R.; Karakuş, N.; Selim, S.; Yilmaz, T.; Erdoğan, R.; Aklıbaşında, M.; Dönmez, B.; Çakır, M.; Ardahanlıoğlu, Z.R. Impacts of Landscape Composition on Land Surface Temperature in Expanding Desert Cities: A Case Study in Arizona, USA. Land 2025, 14, 1274. [Google Scholar] [CrossRef]
- Golden, J.S. The Built Environment Induced Urban Heat Island Effect in Rapidly Urbanizing Arid Regions—A Sustainable Urban Engineering Complexity. Environ. Sci. 2004, 1, 321–349. [Google Scholar] [CrossRef]
- Zang, S.; Wu, C.; Liu, H.; Na, X. Impact of Urbanization on Natural Ecosystem Service Values: A Comparative Study. Environ. Monit. Assess. 2011, 179, 575–588. [Google Scholar] [CrossRef]
- Huang, G.; Cadenasso, M.L. People, Landscape, and Urban Heat Island: Dynamics among Neighborhood Social Conditions, Land Cover and Surface Temperatures. Landsc. Ecol. 2016, 31, 2507–2515. [Google Scholar] [CrossRef]
- Homer, C.G.; Fry, J.A.; Barnes, C.A. The National Land Cover Database; U.S. Geological Survey: Reston, VA, USA, 2012. [Google Scholar]
- Yang, L.; Jin, S.; Danielson, P.; Homer, C.; Gass, L.; Bender, S.M.; Case, A.; Costello, C.; Dewitz, J.; Fry, J.; et al. A New Generation of the United States National Land Cover Database: Requirements, Research Priorities, Design, and Implementation Strategies. ISPRS J. Photogramm. Remote Sens. 2018, 146, 108–123. [Google Scholar] [CrossRef]
- U.S. Census Bureau. Census.Gov|U.S. Census Bureau Homepage. Available online: https://www.census.gov (accessed on 8 August 2025).
- Ermida, S.L.; Soares, P.; Mantas, V.; Göttsche, F.-M.; Trigo, I.F. Google Earth Engine Open-Source Code for Land Surface Temperature Estimation from the Landsat Series. Remote Sens. 2020, 12, 1471. [Google Scholar] [CrossRef]
- Duguay-Tetzlaff, A.; Bento, V.; Göttsche, F.; Stöckli, R.; Martins, J.; Trigo, I.; Olesen, F.; Bojanowski, J.; Da Camara, C.; Kunz, H. Meteosat Land Surface Temperature Climate Data Record: Achievable Accuracy and Potential Uncertainties. Remote Sens. 2015, 7, 13139–13156. [Google Scholar] [CrossRef]
- Qin, Z.; Karnieli, A.; Berliner, P. A Mono-Window Algorithm for Retrieving Land Surface Temperature from Landsat TM Data and Its Application to the Israel-Egypt Border Region. Int. J. Remote Sens. 2001, 22, 3719–3746. [Google Scholar] [CrossRef]
- Jesdale, B.M.; Morello-Frosch, R.; Cushing, L. The racial/ethnic distribution of heat risk–related land cover in relation to residential segregation. Environ. Health Perspect. 2013, 121, 811–817. [Google Scholar] [CrossRef] [PubMed]
- Morello-Frosch, R.; Lopez, R. The riskscape and the color line: Examining the role of segregation in environmental health disparities. Environ. Res. 2006, 102, 181–196. [Google Scholar] [CrossRef]
- Malakar, N.K.; Hulley, G.C.; Hook, S.J.; Laraby, K.; Cook, M.; Schott, J.R. An operational land surface temperature product for Landsat thermal data: Methodology and validation. IEEE Trans. Geosci. Remote Sens. 2018, 56, 5717–5735. [Google Scholar] [CrossRef]
- Wu, J.; David, J.L. A Spatially Explicit Hierarchical Approach to Modeling Complex Ecological Systems: Theory and Applications. Ecol. Model. 2002, 153, 7–26. [Google Scholar] [CrossRef]
- Oshan, T.M.; Li, Z.; Kang, W.; Wolf, L.J.; Fotheringham, A.S. MGWR: A Python implementation of multiscale geographically weighted regression for investigating process spatial heterogeneity and scale. ISPRS Int. J. Geo-Inf. 2019, 8, 269. [Google Scholar] [CrossRef]
- Buyantuyev, A.; Wu, J. Urban Heat Islands and Landscape Heterogeneity: Linking Spatiotemporal Variations in Surface Temperatures to Land-Cover and Socioeconomic Patterns. Landsc. Ecol. 2010, 25, 17–33. [Google Scholar] [CrossRef]
- Wu, J.; Jenerette, G.D.; Buyantuyev, A.; Redman, C.L. Quantifying Spatiotemporal Patterns of Urbanization: The Case of the Two Fastest Growing Metropolitan Regions in the United States. Ecol. Complex. 2011, 8, 1–8. [Google Scholar] [CrossRef]
- Elmarakby, E.; Khalifa, M.; Elshater, A.; Afifi, S. Tailored methods for mapping urban heat islands in Greater Cairo Region. Ain Shams Eng. J. 2022, 13, 101545. [Google Scholar] [CrossRef]
- He, R.; Wang, J.; Liu, D. Assessing the Impact of Urban Spatial Form on Land Surface Temperature Using Random Forest—Taking Beijing as a Case Study. Land 2025, 14, 1639. [Google Scholar] [CrossRef]
- Williams, S.A.; Hipp, J.R. The Shape of Neighborhoods to Come: Examining Patterns of Gentrification and Holistic Neighborhood Change in Los Angeles County, 1980–2010. Environ. Plan. A Econ. Space 2022, 54, 265–294. [Google Scholar] [CrossRef]
- Wang, Z.; Fan, C.; Zhao, Q.; Myint, S.W. A Geographically Weighted Regression Approach to Understanding Urbanization Impacts on Urban Warming and Cooling: A Case Study of Las Vegas. Remote Sens. 2020, 12, 222. [Google Scholar] [CrossRef]
- Alshehri, F.; Abuamarah, B.A.; Abd El-Hamid, H.T. Impact of Land Use Dynamics on Land Surface Temperature Using Optical Remote Sensing Data Integrated with Statistical Analysis in Riyadh, Saudi Arabia. Adv. Space Res. 2023, 72, 1739–1750. [Google Scholar] [CrossRef]
- Zhang, X.; Zhang, J. Exploring the Impact of Urban Characteristics on Diurnal Land Surface Temperature Based on LCZ and Machine Learning. Land 2025, 14, 1813. [Google Scholar] [CrossRef]
- Gunawardena, K.R.; Wells, M.J.; Kershaw, T. Utilising Green and Bluespace to Mitigate Urban Heat Island Intensity. Sci. Total Environ. 2017, 584–585, 1040–1055. [Google Scholar] [CrossRef] [PubMed]
- Pahl-Weber, E.; Ohlenburg, H.; Seelig, S.; Kuhla von Bergmann, N.; Schäfer, R. Urban Challenges and Urban Design Approaches for Resource-Efficient and Climate-Sensitive Urban Design in the MENA Region; Universitätsverlag der TU Berlin: Berlin, Germany, 2013; Volume 5, ISBN 3-7983-2534-0. [Google Scholar]
- Cool Pavement Program. Available online: https://www.phoenix.gov/administration/departments/streets/initiatives/pavement-maintenance/cool-pavement-program.html (accessed on 8 August 2025).
- Middel, A.; Vanos, J.; Kaloush, K.; Medina, J.; Sailor, D.; Campbell, B.; Karam, J.; Napogbong, L.; Lartey, P.; Alhozaimy, M.; et al. Cool Pavement Pilot Program: Joint Study Between the City of Phoenix and Arizona State University; City of Phoenix/Arizona State University: Phoenix, AZ, USA, 2021. [Google Scholar]
- Second Study Says Phoenix’s ‘Cool Pavement’ Has Positive Effect So Far. Available online: https://www.azfamily.com/2024/10/18/second-study-says-phoenixs-cool-pavement-has-positive-effect-so-far/ (accessed on 8 August 2025).
- Middel, A.; Vanos, J.; Kaloush, K.; Medina, J.; Sailor, D.; Campbell, B.; Karam, J.; Napogbong, L.; Lartey, P.; Alhozaimy, M.; et al. City of Phoenix Cool Pavement Pilot Program Phase II—2022; City of Phoenix/Arizona State University: Phoenix, AZ, USA, 2024. [Google Scholar]
- Mohammed, A.; Khan, A.; Santamouris, M. On the mitigation potential and climatic impact of modified urban albedo on a subtropical desert city. Build. Environ. 2021, 206, 108276. [Google Scholar] [CrossRef]
- Abulibdeh, A. Analysis of urban heat island characteristics and mitigation strategies for eight arid and semi-arid gulf region cities. Environ. Earth Sci. 2021, 80, 259. [Google Scholar] [CrossRef]
Disclaimer/Publisher’s Note: The statements, opinions and data contained in all publications are solely those of the individual author(s) and contributor(s) and not of MDPI and/or the editor(s). MDPI and/or the editor(s) disclaim responsibility for any injury to people or property resulting from any ideas, methods, instructions or products referred to in the content. |
© 2025 by the authors. Licensee MDPI, Basel, Switzerland. This article is an open access article distributed under the terms and conditions of the Creative Commons Attribution (CC BY) license (https://creativecommons.org/licenses/by/4.0/).

