Abstract
Accelerated urbanization has induced marked biodiversity loss in metropolitan regions, with urban parks emerging as critical habitat patches for avian species within intensively developed built environments. As a global pioneer in park city conceptualization, Chengdu (China) has achieved notable advancements in urban green space extent and quality through systematic planning efforts. This investigation examines the avian–habitat relationships in Chengdu’s central urban area (2010–2020) using multispectral remote sensing data, employing the ENVI5.6 (Environment for Visualizing Images) software for spatial analysis, and applying the InVEST3.2.0 (Integrated Valuation of Ecosystem Services and Tradeoffs) model to identify high-quality habitats, evaluate landscape connectivity, and analyze community composition dynamics. Through a correlation analysis of seven environmental characteristic factors with avian biodiversity in 24 urban parks, the impact mechanism of avian habitat functions was explored. On this basis, measures such as optimizing the plant community structure of riverside greenways and road green spaces, expanding small-scale green spaces near parks, and so on are proposed to promote the enhancement of urban park habitat functions and the protection of avian biodiversity.
1. Introduction
The loss of biodiversity caused by urbanization has received widespread global attention [1,2]. As natural land is increasingly being replaced by high-rise buildings and hardened roads [3], urbanization not only brings about significant changes to the land, but it is also accompanied by environmental pollution, the heat island effect, and the continuous reduction and fragmentation of natural habitats, which have considerable impacts on the species diversity, community composition, and physiological habits of wild animals [4,5]. At present, urban park green spaces have become “islands” of habitat for wildlife. Therefore, the protection and management of park habitat functions is an effective way to maintain the biodiversity of urban ecosystems [6].
Birds are an important indicator of the health of urban ecosystems [7,8], and the diversity of birds and their community structure are deeply affected by the urbanization process [9,10]. At present, research on the diversity, habitat, and food resources of urban bird communities has become a hot topic in urban ecology [11]. The research mainly focuses on the basic studies of the ecological habits, distribution characteristics, and community composition of urban birds, as well as habitat protection planning and bird attraction techniques [12,13]. However, overall, the research results have limited practical guidance, and there is insufficient attention paid to bird diversity in urban green space construction [14,15]. Compared with natural habitats, urban habitats have characteristics such as multiple boundaries, high heterogeneity, fragmentation, and frequent human disturbances. The rapid urbanization process may have a significant impact on the diversity and community structure of birds within cities [6,16,17]. Sandstrom et al. also pointed out that the conservation planning for birds in urban areas can be formulated through a deep understanding of the relationship between birds and their habitats [18]. Therefore, in-depth research on the characteristics of urban parks, as well as the effects of habitat changes and human activity disturbances brought about by urbanization on bird communities, is crucial for building an urban ecological environment that is conducive to the survival and reproduction of wild birds.
As the world’s largest developing country, China’s urbanization process has been rapid. By the end of 2023, it had reached 66.16% with continuous growth. As the economic, political, and cultural center of Western China, Chengdu is one of the cities with a higher level of urbanization, with an urbanization rate approaching 80%—much higher than the national average. The rapid urbanization process in Chengdu has had a significant negative impact on its ecosystem, especially on the bird communities. However, in recent years, Chengdu has implemented a series of measures to increase green spaces in order to build a park city. It has also integrated urban green spaces and constructed a green space network system with ecological corridors as the framework, significantly enhancing the area of urban green spaces and the green coverage rate. Past research on the bird communities in Chengdu has mainly utilized basic surveys and statistical analyses, including analyzing the number of bird species and their community composition within the city limits, but has not yet addressed the structure, influencing factors, and functional diversity of urban bird communities. Therefore, in-depth research on the impact of urbanization on bird diversity can enrich and expand the research materials regarding the bird ecology of Chengdu, and new methods and strategies can then be proposed for restoring the bird population and maintaining the health of the urban ecological environment in Chengdu. This is of great significance for protecting and enhancing the bird species diversity of this city, and is expected to significantly promote the sustainable development of the bird communities in China.
This study selected 24 urban parks with better ecological backgrounds in the central urban area of Chengdu as the research sites, aiming to explore the following issues: (1) comparing the land-use and habitat quality changes in the central urban area of Chengdu in 2010, 2015, and 2020 to construct the habitat patches and connectivity networks based on the activity range of birds and analyze the impact of land-use changes on bird diversity; (2) evaluating environmental characteristic parameters, such as park area, isolation degree, environmental noise, building index, and water area, to calculate the bird diversity index of each park and explore the impact of park environmental characteristic parameters on bird diversity; and (3) analyzing the influence mechanism of bird diversity to provide theoretical references for the planning and management of urban parks and the construction of park cities.
2. Literature Review
2.1. Bird Habitat and Diversity
A habitat is a natural environment in which organisms survive, encompassing the environmental conditions that organisms rely on throughout all stages of their lives [19,20,21]. The composition of a bird habitat includes both biotic and abiotic factors, mainly encompassing the plant structure, species, human disturbances, species interactions, area and shape of the region, and water body characteristics [22]. In addition to providing diverse food resources and breeding grounds for organisms, habitats also control the population size of species by regulating resources and species competition, thus maintaining ecological balance [23,24].
Bird diversity is an important component of biodiversity. It refers to the richness, composition structure, and ecological function diversity of bird species in a certain area or ecosystem, including the species diversity, ecological diversity, and genetic diversity of birds. It is of great significance for measuring the stability, function, and ecological services of ecosystems. Bird diversity depends on the diversity of habitats and the abundance of resources [25,26]. High bird diversity usually indicates a relatively healthy ecosystem that can provide more ecological services [27,28]. The main bird diversity indices include the Shannon diversity index, Margalef index, and Pielou’s evenness index [29].
2.2. Urban Bird Habitat Selection
The habitat selection of birds is significantly influenced by the availability of food [30]. Due to their differences in diet and foraging habits, the preferences of birds for different vegetation layers also vary significantly [31]. Environments with rich and diverse community structures such as natural forests can provide support for the survival and foraging activities of various bird species [32,33,34,35]. Studies have shown that the undergrowth and ground cover in the lower layers of natural forests also provide habitats for numerous insects, larvae, and soil organisms [36], thereby enriching the food resources for birds.
In urban parks, the density and diversity of secondary forest shrubs and herbaceous plants are relatively low, which poses a problem of limited food resources for some bird species. However, the increase in food plants and food waste in urban parks has also promoted the growth of some bird populations [37,38], especially omnivorous birds like magpies and sparrows that have a wide range of diets and strong environmental adaptability. However, for carnivorous and insectivorous birds, the lower vegetation density and diversity in parks pose greater foraging challenges.
2.3. Research and Measures for Bird Conservation
Bird diversity conservation has become a subject of international concern, and its theoretical basis and practical application design cover multiple disciplines and research fields. Internationally, the migration of migratory birds and global bird monitoring are important research directions. Scientists use small GPS trackers, leveraging cellular networks, weather surveillance radars, and other network infrastructures, to help monitor the movement trajectories of migratory animals. Additionally, in the International Cooperation for Animal Research Using Space (ICARUS) project, tracking devices weighing less than 1 g have been put into use, enabling researchers to map the individual movements of small songbirds for the first time, so as to provide more abundant global bird tracking data in the future [39].
In China, bird monitoring programs are also being actively carried out. Research institutions and volunteers have collected sufficient bird data for research, especially in the field of waterbird habitat protection. Moreover, China has multiple migratory bird routes and important habitats. Chinese scholars have paid close attention to the behavioral patterns of migratory birds and formulated relevant protection strategies to reduce threats to birds.
3. Study Area and Data Source
3.1. Study Area Profile
Chengdu is located in the western part of the Sichuan Basin in southwestern China (102°54′ E~104°53′, 30°05′~31°26′ N), with a total area of 14,335 km2, of which more than 60% is plain land. It has a subtropical monsoon humid climate. The natural vegetation type in Chengdu is subtropical evergreen broad-leaved forest, with a rich variety of vegetation types. The bird diversity and taxonomic composition in Chengdu are rich, with 511 species confirmed, accounting for 67.5% of the total bird species in Sichuan Province and 34.5% of the national total.
The central urban area covers an area of 3962.6 km2 and refers to the built-up area of Chengdu, which is characterized by dense building distribution and high urbanization. This study selected the central urban area of Chengdu as the research area (Figure 1) to explore the impact of high urbanization on bird communities. Additionally, 24 parks with better ecological backgrounds and more abundant bird observation data were selected to investigate the influence of park environmental characteristic factors on bird species richness (Figure 2). Ecologically, these 24 parks boast relatively complete ecosystems (with green space accounting for 60%), featuring multi-level plant communities, which can provide birds with the sites necessary for foraging, roosting, and breeding. However, these parks also differ from one another in aspects like area size, water area size, and surrounding building distribution. Moreover, they are supported by nearly 15 years of bird observation data, offering a reliable data foundation for subsequent analytical research.
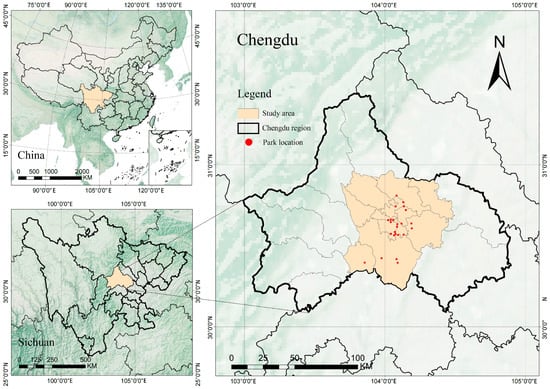
Figure 1.
Location map of the central urban area of Chengdu.
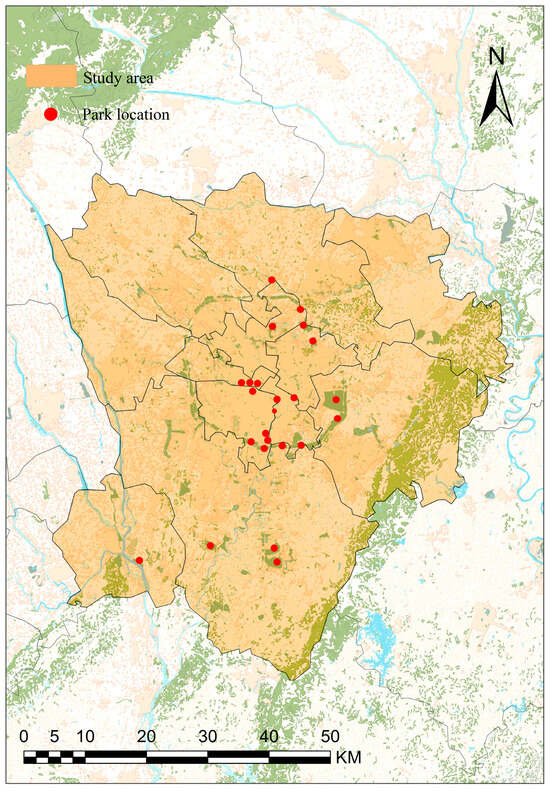
Figure 2.
Location map of selected parks and investigated.
3.2. Data Acquisition
The land-use data at a resolution of 30 m for the period from 2010 to 2020 was interpreted from Landsat 8 imagery, and the land categories were classified according to the “Land use status classification” standard (GB/T 21010-2017) [40], which divides land into categories of cropland, forestland, water bodies, unused land, and built-up land. The DEM (Digital Elevation Model) data was obtained from the Geospatial Data Cloud (http://www.gscloud.cn, accessed on 16 August 2025), with a resolution of 30 m. The nighttime light data was obtained from the Geographical Information Monitoring Cloud Platform (http://www.dsac.cn/, accessed on 16 August 2025). The productivity data of cropland was obtained from the Resource and Environmental Science and Data Platform (https://www.resdc.cn/, accessed on 16 August 2025). The road network data was obtained from OpenStreetMap (https://www.openstreetmap.org/, accessed on 16 August 2025), and the data for railways and highways as well as major urban roads for 2010, 2015, and 2020 was extracted from road opening announcements and land-use data in Chengdu.
The bird observation data was mainly obtained from the China Birdwatching Records Center (http://www.birdreport.cn, accessed on 16 August 2025) for the central city district of Chengdu from 2015 to 2020 using the “regional record statistics” method. Some supplementary data was also obtained from eBird (https://ebird.org/prefs, accessed on 16 August 2025). The China Birdwatching Records Center is currently China’s largest public science data platform for bird monitoring. For scholars researching Chinese birds, its data is more targeted and applicable. To date, numerous scholars have used its data for analysis and have published a series of academic articles related to bird conservation. The analysis of the total number of bird species in the central city district of Chengdu was based on the observation records from 2015 to 2020. The bird observation data for the 24 parks was obtained from observation records from 1 February 2022 to 31 January 2023, which is consistent with the park environment survey period; a complete annual observation period can avoid the issue of missing migratory birds and transient birds while preventing duplicate record data for overlapping months. The number of birds in the central city district of Chengdu increased from 237 species in 2015 to 314 species in 2020. When excluding Longquan Moutain, the number of birds in the central city district of Chengdu increased from 191 species (accounting for 37.4% of the city’s total) to 278 species (accounting for 54.4% of the city’s total).
4. Research Method
4.1. Research Route of This Study
The research route started from the following two directions: 1. What is the impact of land-use change in Chengdu on the habitat of birds? 2. What is the influence of park environmental characteristic factors on bird species diversity?
Firstly, this study took the main urban area of Chengdu as the research area to evaluate habitat connectivity. Secondly, this study investigated and obtained the bird species richness of 24 urban parks with good local ecology in the main urban area of Chengdu, and it measured the environmental characteristic parameters of these parks. Redundancy analysis was conducted with environmental characteristic factors as the explanatory variables and bird characteristic factors as the response variables(Figure 3).
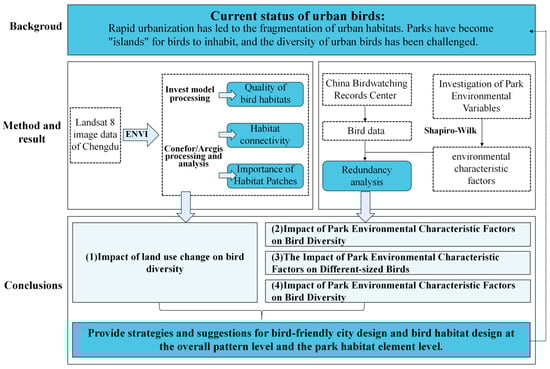
Figure 3.
Research path for factors influencing bird diversity.
4.2. Habitat Connectivity Calculation
Land-use change is one of the two major driving forces of global change [41,42]. The transformation of land-use usually triggers a process of local species readjusting their adaptability to their habitats [43]. In addition, land-use change is likely to weaken the connectivity between different habitats, thereby restricting gene flow and ecological exchange among different populations and potentially increasing the risk of species extinction [44,45]. This study took the main urban area of Chengdu as the research area, used ENVI5.6 software to interpret the image data of Chengdu from 2010 to 2020 to obtain land-use data, and used the InVEST model to screen out areas with higher habitat quality. ArcGIS10.7 software and the Conefor plugin were utilized to calculate the connectivity probability index and assess the connectivity of habitats during this period. The period from 2010 to 2020 was a critical phase for the rapid advancement of urbanization in Chengdu: in the early stage, the rapid expansion of urban space led to the occupation of a large amount of natural land and impacted the ecological base; in the later stage, with the continuous advancement of Chengdu’s park green space system construction and the Longquan Mountain ecological greening restoration project, significant results were achieved in regional ecological restoration. Analyzing the changes in habitat quality during this period allows for the macroscopic measurement of the impact value of dynamic changes in park green spaces on bird diversity, providing an important reference for land-use planning and biodiversity conservation in rapidly urbanizing areas.
- (1)
- Land-use change calculation
ENVI is a powerful remote sensing image processing platform that offers a comprehensive range of remote sensing image processing functions, such as information extraction and image classification. It has been widely applied in numerous fields, including scientific research, environmental protection, and regional planning. In this study, ENVI 5.6 was used to interpret the Landsat 8 images, with a resolution of 30 m, for Chengdu in 2010, 2015, and 2020 to obtain land-use data, and the land categories were classified according to the “Land use status classification” (GB/T 21010-2017) into cropland, forestland, water bodies, unused land, and built-up land. The land-use data of Chengdu was processed using ArcGIS10.7 to determine the changes to the central urban area in these three years.
- (2)
- InVEST habitat quality assessment
InVEST is a set of models used to assess the service function volume and economic value of ecosystems and to support ecosystem management and decision making. The habitat quality module calculates the habitat quality as a continuous variable by combining the sensitivity of landscape types and the intensity of external threats, taking into account the influence of the distance, spatial weight, and legal protection status of threat factors, as well as the land cover and land-cover pattern changes. The operation of the habitat quality model requires the input of 5 categories of data, including land-use/land-cover data, threat factors, threat factor layers, half-saturation parameters, and the sensitivity degree of threat factors [46].
Based on the ecological characteristics of birds, forest land, green space, and water areas are regarded as habitats, and the threat sources are six influencing factors such as construction land and cultivated land. The attributes of these threat factors are determined according to the literature (Table 1) [47,48,49].

Table 1.
Habitat threat factors.
The sensitivity of habitats to threat factors is determined by the general principles of biodiversity conservation. A natural environment is more sensitive and an artificial environment is less sensitive [48], with values ranging from 0 to 1 (Table 2) [49].
Table 2.
Habitat suitability and sensitivity to threat factors.
The calculation formula is as follows:
where is the total threat level of grid x in habitat type ; R is the number of threat sources; is the weight of threat source ; is the number of grids of threat source ; is the stress value of grid ; is the accessibility of a threat source to the grid (with a value ranging from 0 to 1, determined based on its degree of legal protection); is the sensitivity of habitat type to threat source ; and is the stress value of grid on grid , which is divided into two types: “linear decay” and “exponential decay”.
The linear decay formula is as follows:
The exponential decay formula is as follows:
where is the straight-line distance between grid and grid ; is the maximum stress distance of threat element .
The habitat quality calculation formula is as follows:
where is the habitat quality index of grid x in habitat type ; is the habitat suitability of habitat type ; is the semi-saturation constant, taken as half of the maximum habitat degradation degree, and set as 0.5; and is the normalization constant, taken as 2.5.
- (3)
- Habitat connectivity calculation
Whether biological populations can migrate smoothly between different habitat units largely depends on the degree of interconnection among habitat patches. The connectivity probability index PC is an important indicator for measuring connectivity [50]. High connectivity indicates that bird species encounter less resistance in the landscape, making migration, foraging, and survival easier. In this study, the Conefor plugin in Arcgis10.7 was used to calculate the connectivity probability index. Habitat patches were selected based on the habitat requirements and quality of birds. Forest land, water areas, and ecological land with appropriate area and slope, as well as high habitat quality, were taken as the selection conditions of habitat patches. An overlay analysis was performed based on habitat quality and habitat needs to obtain suitable habitat patches for birds. Based on the general activity range of birds, the diameters of 2 km and 6 km were selected as the activity range of small and medium-sized birds, respectively. The 2 km and 6 km connectivity networks were obtained by integrating habitat patches and bird activity range thresholds to evaluate the changes in bird habitat patches and connectivity between 2010 and 2020.
The calculation formula for PC is as follows:
is the total number of habitat patches, and are the area of patch and , is the maximum dispersal probability between patch and , and is the total area of the landscape.
4.3. Acquisition of Environmental Characteristic Factors
To investigate the current status of bird habitat function in Chengdu, seven environmental characteristic factors were selected for each park: park area (A), water area (WA), habitat diversity (HD), environmental noise (EN), isolation degree 1 (ID1), isolation degree 2 (ID2), and building index (BI) (Table 3). Park area and water area were measured using Google Earth 7.3.6, habitat diversity was measured taking into account the needs of birds, and the habitat types were divided into 12 categories: broadleaf forests, coniferous forests, mixed forests of conifers and broadleaves, dense shrublands, sparse shrubs, low shrub communities, medium–high shrub communities, tall shrub communities, water bodies, open spaces, mountains, and built-up areas. The number of each habitat type in each park was recorded through on-site surveys; isolation degree 1 represents the distance of a park from the Longquan Mountain National Forest Park, which has not been fragmented, and isolation degree 2 represents the distance of the park from nearby large parks, both of which were measured using Google Earth 7.3.6; environmental noise was measured using an SW6004 noise meter manufactured by SUWEI from August to October 2023, and the number of measurement points was selected based on the park area, ranging from 5 to 10 points per park, and the average value was taken; and building index was calculated as follows: the park’s floor area + 0.5 × (the floor area within 500 m) + 0.25 × (the floor area within 1000 m) + 0.125 × (the floor area within 2000 m) [20,51].
Table 3.
Summary of environmental characteristic factors in 24 urban parks.
4.4. Avian Biodiversity
This study compiled the bird data for the research area and calculated the number of bird species (observed count), Shannon diversity index [52], Margalef index [53], Pielou’s evenness index [54], Simpson index [55], diversity index of birds of different body sizes, and diversity index of birds of different residence types (Table 4). Through an analysis of different diversity indices, the community structure and ecological health status of birds can be revealed more comprehensively.
Table 4.
Diversity indices of bird communities in various parks.
The methods for calculating the diversity indices are as follows:
Bird species number ():
Shannon–Weiner index (H):
where represents the total number of species, and P represents the proportion of the species to the total.
Margalef index ():
where represents the number of species in the community, and represents the total number of individuals observed.
Pielou’s evenness index ():
where is the Shannon diversity index, and represents the total number of species.
Simpson index ():
where represents the number of individuals of the dominant species, and represents the number of individuals of all species in the community.
The diversity index (T) of bird species of different body sizes and the diversity index (JL) of bird species of different residence types were calculated using the Shannon diversity index in this study.
4.5. Statistical Analyses
The Shapiro–Wilk test was performed, confirming that the data did not conform to a normal distribution. A redundancy analysis (RDA) was conducted with the environmental characteristic factors as the explanatory variables and bird characteristic factors as the response variables. Canoco5 was used to perform the statistical analyses and graph drawing.
5. Results
The results indicate that, during the period from 2010 to 2020, the number of bird habitat patches showed a downward trend, while the area of high-quality habitats first decreased and then increased. The number of corridors decreased, and they were sparsely distributed in the city center but densely distributed in the south and east. The PC value remained relatively stable from 2010 to 2015 but increased significantly from 2015 to 2020.
Regarding the environmental characteristic variables, area and habitat diversity were positively correlated with most diversity indices, but Pielou’s evenness index showed a significant negative correlation with habitat diversity. Noise and building indices were significantly negatively correlated with multiple bird diversity indices, especially for medium- and large-sized birds, but the correlation was not obvious for small birds. Moreover, they were significantly positively correlated with the bird dominance index.
5.1. Overall Analysis of Bird Species in Chengdu
A total of 29,666 birds belonging to 351 species were recorded in 24 parks within the study area, accounting for 62.01% of the total bird species in Chengdu. Among them, Motacilla alba, Garrulax sannio, Pycnonotus sinensis, Aegithalos concinnus, Copsychus saularis, Turdus mandarinus, and Spilopelia chinensis were the most widely distributed species, being recorded in all 24 parks, which fully demonstrated the wide adaptability of these bird species. Regarding bird species of different residence types, the richness of resident birds was the highest, with a total of 166 species; this was followed by winter migratory birds, with 96 species, and then migratory birds, with 57 species; the richness of summer migratory birds was the lowest, with 32 species. Regarding bird species of different body sizes, there were 14 large-sized bird species with a body length greater than 70 cm; 95 medium-sized bird species with a body length of 30 to 70 cm; and 242 small-sized bird species with a body length less than 30 cm.
5.2. Impact of Land-Use Change on Bird Diversity
By conducting an overlay analysis based on habitat requirements and habitat quality, habitat patches suitable for birds were selected, with forests, water areas, and areas with slopes suitable for ecological use and high habitat quality serving as the selection conditions [56]. Based on the common activity range of birds, 2 km was ultimately selected as the activity range for small birds and 6 km as that for medium- and large-sized birds. Then, 2 km and 6 km connectivity networks were obtained based on the habitat patches and activity range thresholds (Figure 4).
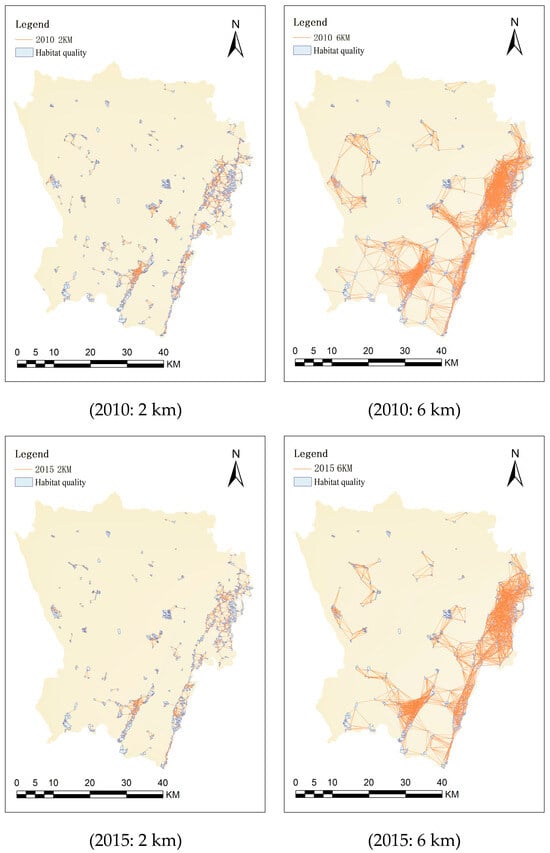
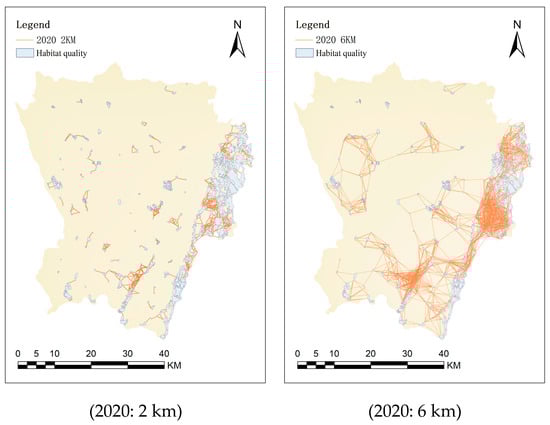
Figure 4.
The 2 km and 6 km patch connectivity networks based on the range of bird species (2010–2020).
The analysis results (Table 5) revealed a significant decline in avian habitat patch numbers in 2010, 2015, and 2020, reaching 329, 297, and 273, respectively. This reduction was primarily attributed to two factors: (1) the Longquan Mountain reforestation project, which promoted small-patch aggregation into large contiguous areas and (2) urbanization-induced replacement of medium-sized patches. Notably, the area of high-quality avian habitats exhibited an initial decline followed by recovery, suggesting that urban construction encroached on small-medium patches before 2015, while subsequent ecological improvements (Chengdu Ring Ecological Area and Longquan Mountain greening projects) substantially increased large-patch areas. The change in the number of corridors was consistent with the change in habitat patches, both showing a downward trend from 2010 to 2020. The reasons for this decline are similar to those for the reduction in habitat patches. In general, corridors are sparsely distributed in urban centers, and their connectivity networks exhibit a fragmented trend. Conversely, the southern and eastern regions are densely populated with corridors, featuring intact network structures.
Table 5.
Changes in bird habitat patches and 2 km and 6 km connectivity from 2010 to 2020.
The statistical analysis of connectivity probability (PC) values (Table 6) demonstrated two distinct phases: (1) the period of 2010–2015 exhibited relative stability in urban core PC values, whereas (2) the period of 2015–2020 showed marked increases, particularly for 2 km threshold PC values. These results imply that urban ecological construction enhanced short-distance habitat connectivity more effectively than long-range connection for avian species.
Table 6.
Changes in bird habitat connectivity in central Chengdu from 2010 to 2020.
5.3. Impact of Park Environmental Characteristic Factors on Bird Diversity
Figure 5 and Figure 6 reveal significant bivariate relationships between avian community metrics and environmental characteristic factors. Specifically, the following results are revealed:
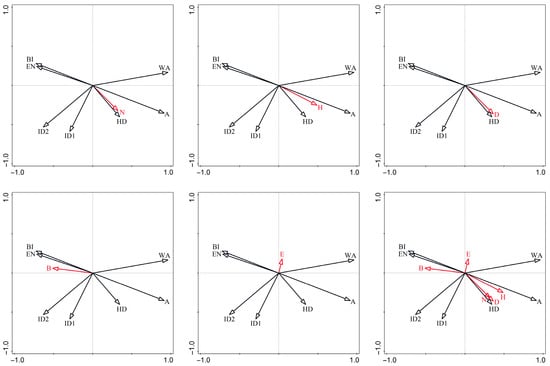
Figure 5.
Redundancy analysis of park environmental characteristic factors and bird diversity. N: number of species; H: Shannon diversity index; D: Margalef index; E: Pielou’s evenness index; B: advantage index; A: park area; WA: water area; ID1: isolation degree 1; ID2: isolation degree 2; HD: habitat diversity; EN: environmental noise; and BI: building index. The black arrows represent the environmental characteristic factors, the red arrows represent the bird diversity indices, and the length of the arrow represents the explanatory power of a particular environmental characteristic factor on a bird diversity index. The cosine of the angle between the arrows represents correlation, with a positive cosine value indicating positive correlation and a negative cosine value indicating negative correlation.
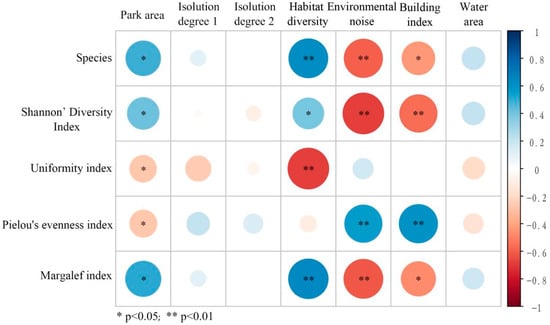
Figure 6.
Pearson correlation analysis between park environmental characteristic factors and bird diversity. The red area represents a negative correlation between two factors, while the blue area represents a positive correlation between two factors. The larger the area, the higher the correlation between the two factors.
- The number of species (N), Shannon diversity index (H), and Margalef index (D) exhibited consistent positive associations with park area (A) and habitat diversity (HD) while demonstrating strong negative correlations with environmental noise (EN) and building index (BI).
- Pielou’s evenness index (E) showed a negative relationship with habitat diversity (HD), which may be due to the fact that resources occupied by different species are not concentrated in complex habitats.
- The dominance index (D) presented positive relationships with both environmental noise (EN) and building index (BI).
- Isolation degree 1 (ID1) and isolation degree 2 (ID2) exhibited no significant associations with any avian diversity indices.
5.4. Impact of Park Environmental Characteristic Factors on Different-Sized Birds
Figure 7 and Figure 8 reveal distinct scaling relationships among avian body size categories and environmental characteristics factors. Specifically, the following results are revealed:
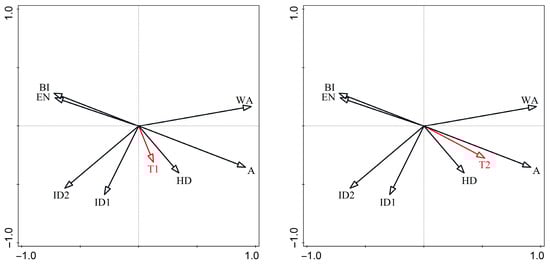
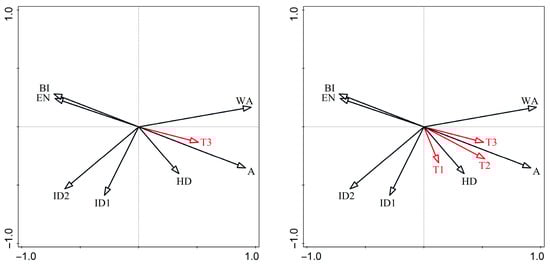
Figure 7.
Redundancy analysis of park environmental characteristic factors and birds of different body size types. T1: species diversity of small-sized bird species; T2: species diversity of medium-sized birds; T3: species diversity of large-sized birds; A: park area; WA: water area; ID1: isolation degree 1; ID2: isolation degree 2; HD: habitat diversity; EN: environmental noise; and BI: building index.
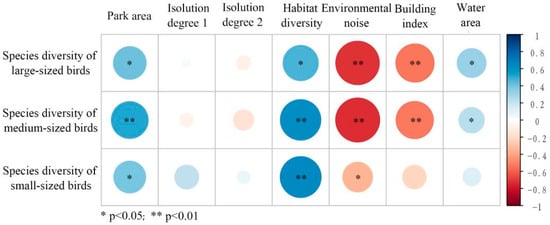
Figure 8.
Pearson correlation analysis between park environmental characteristic factors and birds of different body size types.
- All three body size classes (small, medium, and large) exhibited strong positive correlations with park area (A) and habitat diversity (HD).
- Environmental noise (EN) and building index (BI) showed significant negative associations, primarily for medium- and large-sized birds.
These results imply that medium- and large-sized birds are more susceptible to the built environment around the park, while small-sized birds are less sensitive.
5.5. Impact of Park Environmental Characteristic Factors on Birds of Different Residence Types
Chengdu is a critical stopover node on the migratory path of birds. Therefore, it is important to pay attention to the influence of park environmental characteristic factors on different residence-type birds (especially migratory birds). Figure 9 and Figure 10 reveal three key patterns:
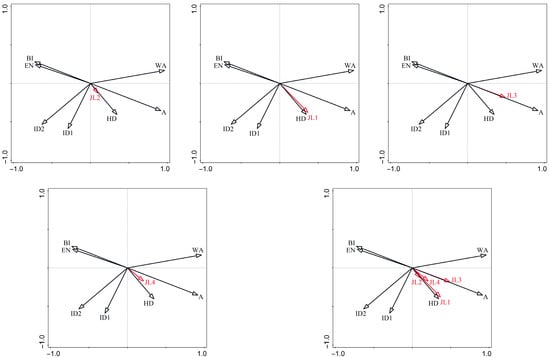
Figure 9.
Redundancy analysis of park environmental characteristic factors and bird species of different residence types. JL1: species diversity of resident birds; JL2: species diversity of summer migratory birds; JL3: species diversity of winter migratory birds; JL4: species diversity of migratory birds; A: park area; WA: water area; ID1: isolation degree 1; ID2: isolation degree 2; HD: habitat diversity; EN: environmental noise; and BI: building index.
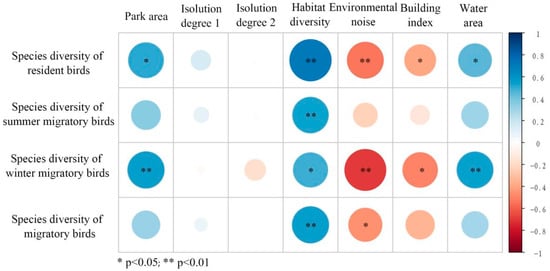
Figure 10.
Pearson correlation analysis between park environmental characteristic factors and bird species of different residence types.
- Park area and habitat diversity exhibited consistent positive associations with overall avian diversity across all residence types.
- Environmental noise and building index demonstrated negative correlations with avian diversity, with stronger effects observed for resident and wintering birds.
These results suggest that the improvement of the environmental quality of urban parks can simultaneously meet the survival needs of various birds, with resident birds and winter migratory birds benefiting more.
6. Discussion
6.1. Habitat Quality Is a Major Factor Affecting Bird Diversity
Overall, the diversity of bird species in the central urban area of Chengdu shows a positive correlation with an increase in the area of high-quality habitat patches. It is worth noting that this ecological process exhibits significant spatial differentiation characteristics. As an important ecological barrier in the eastern part of the city, the area of high-quality habitat patches in the Longquan Mountain region has expanded significantly by 104.49%, and the newly added ecological space mainly originates from the Longquan Mountain greening project. By contrast, in other regions, the construction of park cities has only achieved a slight increase of 8.57% through greenway construction, ecological green space network building, and other greening projects. The number of bird species has grown from 191 to 278. Therefore, the improvement of the quality of habitat patches as represented by urban parks has also played an important role in significantly enhancing the biodiversity of birds.
The quality improvement of urban bird habitat patches mainly lies in the enhancement of connectivity and the improvement of internal and external environments. From 2015 to 2020, the connectivity of habitat patches in the central urban area of Chengdu significantly increased (with a 183.33% increase in PC 2 km and a 68.29% increase in PC 6 km), and the number of bird species increased correspondingly by 32.50%, indicating that the connectivity of habitat patches is one of the core factors influencing urban bird species diversity. In such a high-density space, it is difficult to further increase the area of high-quality habitat patches like urban parks in the future. The improvement of habitat patch connectivity can only be achieved by optimizing the community structure of linear vegetation such as riverside greenways and street green spaces, and fully exerting their ecological corridor functions [57]. On the other hand, during the process of urban renewal, developing small and micro green spaces such as community gardens and pocket parks, as well as transforming brownfields, can also help improve the connectivity of urban habitat patches [58].
6.2. Impact of Environmental Noise and Building Index on Birds
For all types of birds, the building index and environmental noise around parks are both key factors that inhibit their diversity. A higher building index indicates a higher degree of urbanization around the park, which means less food and nesting conditions are available. Moreover, human activities and lighting can disrupt the behavioral patterns of birds [59,60]. For instance, glass facades and artificial light sources can interfere with their nocturnal migration [61]. Stray animals or invasive species in built-up areas can also be potential predators of wild birds. Environmental noise mainly comes from traffic and industrial and commercial areas near the park. Noise pollution can cause communication disorders in birds and interfere with their nest selection and reproductive behavior [62,63]. Studies have shown that noise can affect the courtship calls of male birds and may also mask the warning signals of predators, thereby affecting birds’ reproductive capacity and survival rate [63,64].
Birds of different body sizes respond differently to such stress. The building index and environmental noise exhibited stronger negative correlations with the diversity of birds of medium-to-large body size classes, while smaller birds demonstrated relatively lower susceptibility. Larger-sized avian species require greater habitat resource availability and spatial mobility, rendering them more vulnerable to anthropogenic disturbances in peri-park zones. Their extended breeding cycles and lower reproductive rates exacerbate population recovery challenges when subjected to environmental stressors. In contrast, smaller birds exhibit constrained home ranges and may sustain their populations through intra-patch resource utilization, thereby demonstrating stronger environmental adaptability while minimizing exposure to external environmental pressures.
Furthermore, the building index and environmental noise showed a significant positive correlation with the dominance index of bird communities, indicating that the directional selection pressure stemming from urbanization degree and environmental noise around the park will force the bird community structure inside the park to become simpler. As a result, the dominant species formed are mostly generalized species that are highly adapted to the urban environment, such as Turdus mandarinus, Pycnonotus sinensis, Garrulax sannio, and Spilopelia chinensis [65,66]. However, other populations, especially those of large- and medium-sized birds, have significantly declined, leading to a reduction in biodiversity.
Generally speaking, it is difficult to reverse the urbanization degree of the built-up area in cities, but, by enriching the green spaces along the roads near parks, increasing pocket parks and community gardens, and connecting them to form finger-shaped green spaces extending towards the built-up area, the boundaries of habitat patches can be effectively softened. This penetrating greening strategy can also form an acoustic barrier, achieving the effect of reducing the building index and environmental noise, and creating a relatively complete ecological space for birds.
6.3. Impact of Park Area, Water Area, and Habitat Diversity
Park area, water area, and habitat diversity exhibited significant positive correlations with the avian species diversity of birds of different body size types and residence types, though the magnitude of these associations differed. According to the species–area relationship, the larger the park area, the greater the bird species richness [67]. Large parks can provide a broader ecological space and more diverse habitats and food sources for birds, which is conducive to the construction of a rich and stable bird population [68,69]. In large parks such as Qinglong Lake, rare birds (e.g., Platalea leucorodia, Buteo hemilasius, Pernis ptilorhynchus, Accipiter gentilis, and Buteo japonicus) can even be observed. Similarly, a larger water area can provide a wider range of foraging and nesting conditions for birds, especially for waterfowl [70]. This study found that a large water area in parks has a more positive impact on wintering birds, possibly because the majority of migratory birds overwintering in Chengdu are waterfowl.
Rich habitat types can meet the different survival space requirements of birds. When the habitat diversity is high, the habitat can accommodate a variety of different microhabitats and bird populations with different ecological needs [71], making the species composition more complex and reducing the resource occupancy rate of each species, resulting in a lower Pielou’s evenness index for the bird communities. After a park is completed, the park area and water area are relatively stable. The scientific creation and management of the park’s aquatic environment and plant communities is one of the main ways to improve the quality of the internal habitat [72]. For example, by constructing complex water–land boundaries, enriching the composition of the tree communities, and increasing the types of plant communities, even small urban parks may have high bird biodiversity [73].
7. Conclusions
Against the backdrop of accelerated urbanization in China, research on avian biodiversity and its influencing factors holds significant importance for conservation. However, studies on the functional aspects of high-density urban bird habitats are still in their infancy. Within an extremely limited space, the distribution pattern and quality characteristics of habitat patches play a crucial role. This study took the central urban area of Chengdu as an example to analyze the impacts of urbanization on bird communities and explore the influencing mechanism of bird habitats.
From a macro-perspective, habitat patch connectivity is the dominant factor for avian biodiversity in the central urban area of Chengdu, while the quality of habitat patches, represented by urban parks, also plays a significant role. At the mesoscopic scale, park area and habitat diversity exhibited significant positive correlations with avian species diversity in Chengdu’s urban parks, while environmental noise and building index exerted pronounced negative impacts on avian biodiversity. It is worth noting that these effects are species-specific, and large- and medium-sized birds are significantly more sensitive to environmental stress than small-sized birds.
In the high-density urban core of Chengdu, it is difficult to achieve an increase in the area of high-quality habitat patches. Affected by China’s policy of converting forested land back to farmland, the traditional large-scale expansion of green spaces is no longer realistic, and the area of park green space may even decline to a certain extent. A more feasible approach is to focus on improving the quality of the existing space. First, the plant community structure of the riverside green islands and the green spaces along the roads should be improved, and their connection function as ecological corridors should be enhanced. Second, a network of micro and small green spaces should be developed. Expanding pocket parks, community gardens, and other small and micro-green spaces can enhance the connectivity of urban habitat patches, expand the urban park green spaces into building areas, reduce the building index and environmental noise, and promote the improvement of bird habitat functions in park green spaces. Additionally, this study also found that the vegetation types and plant community structures of urban parks may have a significant impact on birds’ nesting, hiding, and foraging activities. It is expected that, in subsequent research, a deeper analysis of community types, spatial structures, plant compositions, and densities will be conducted to further enhance the support of urban park plant communities and other wildlife habitats for birds.
Author Contributions
Conceptualization, C.L.; Methodology, Y.J.; Software, C.L. and M.Y.; Validation, K.F.; Investigation, Y.J. and M.Y.; Data curation, Y.J.; Writing—original draft, C.L.; Writing—review & editing, J.Z.; Supervision, K.F.; Project administration, J.Z. All authors have read and agreed to the published version of the manuscript.
Funding
This research was funded by [Natural Science Foundation of Gansu Province] grant number [25JRRA661] and The APC was funded by the research project of Sichuan University (No. 24H1448).
Data Availability Statement
The original contributions presented in the study are included in the article, further inquiries can be directed to the corresponding author.
Conflicts of Interest
The authors declare no conflict of interest.
References
- Grimm, N.B.; Faeth, S.H.; Golubiewski, N.E.; Redman, C.L.; Wu, J.G.; Bai, X.M.; Briggs, J.M. Global change and the ecology of cities. Science 2008, 319, 756–760. [Google Scholar] [CrossRef] [PubMed]
- Ma, Y.; Li, F.; Yang, R. The impact of urbanization on biodiversity and its regulation countermeasures. Chin. Landsc. Archit. 2021, 37, 6–13. [Google Scholar]
- Ferenc, M.; Sedláček, O.; Fuchs, R.; Dinetti, M.; Fraissinet, M.; Storch, D. Are cities different? Patterns of species richness and beta diversity of urban bird communities and regional species assemblages in Europe. Glob. Ecol. Biogeogr. 2014, 23, 479–489. [Google Scholar] [CrossRef]
- Si, X.; Cadotte, M.W.; Zeng, D.I.; Baselga, A.; Zhao, Y.; Li, J.; Ding, P. Functional and phylogenetic structure of island bird communities. J. Anim. Ecol. 2017, 86, 532–542. [Google Scholar] [CrossRef]
- Laura, C.; María, P.; Prieto, M.; Hurtado, P.; Escudero, A.; Martínez, I. Functional diversity regulates the effects of habitat degradation on biocrust phylogenetic and taxonomic diversities. Ecol. Appl. A Publ. Ecol. Soc. Am. 2022, 32, e2599. [Google Scholar]
- Fernández-Juricic, E.; Jokimäki, J. A habitat island approach to conserving birds in urban landscapes: Case studies from southern and northern Europe. Biodivers. Conserv. 2001, 10, 2023–2043. [Google Scholar] [CrossRef]
- Roberge, J.M.; Angelstam, P. Indicator species among resident forest birds-A cross-regional evaluation in northern Europe. Biol. Conserv. 2006, 130, 134–147. [Google Scholar]
- Fraixedas, S.; Lindén, A.; Pihad, M.; Cabeza, M.; Gregory, R.; Lehikoinen, A. A state-of-the-art review on birds as indicators of biodiversity: Advances, challenges, and future directions. Ecol. Indic. 2020, 118, 106728. [Google Scholar] [CrossRef]
- Swaroop, P.; Ravi, J.; Piha, M.; Cabeza, M.; Gregory, R.; Lehikoinen, A. Which traits influence bird survival in the city? A review. Land 2021, 10, 92. [Google Scholar] [CrossRef]
- McKinney, L.M. Urbanization as a major cause of biotic homogenization. Biol. Conserv. 2005, 127, 247–260. [Google Scholar] [CrossRef]
- Zhang, Z.K.; Huang, G.L. Urban ornithological research in China: A review. Acta Ecol. Sin. 2018, 38, 3357–3367. [Google Scholar] [CrossRef]
- Gu, L.Z.; Yan, S.J.; Lv, W.; Chen, M.; Hu, W.J. Winter birds diversity in urban green spaces of Fuzhou. Forest Grassl. Resour. Res. 2024, 125–133. [Google Scholar] [CrossRef]
- Chen, Y.J.; Guo, Y.R.; Yang, P.L.; Liu, J.L. Diversity characteristics of birds in pond sponge habitats and influencing factors. Chin. Landsc. Archit. 2023, 39, 111–117. [Google Scholar] [CrossRef]
- Deng, Y.R.; Xiao, R.B.; Huang, L.J.; Hu, H.J.; Li, Z.S.; Ding, X.L. Approaches and Case Study of Urban Biodiversity Restoration. Landsc. Archit. 2015, 25–32. [Google Scholar] [CrossRef]
- Da, L.J. Urban near-to-nature biocoenose landmark construction for the restoration of native biodiversity: Concepts and practices in Shanghai. Chin. Landsc. Archit. 2021, 37, 20–24. [Google Scholar]
- Schütz, C.; Schulze, C.H. Functional diversity of urban bird communities: Effects of landscape composition, green space area and vegetation cover. Ecol. Evol. 2015, 5, 5230–5239. [Google Scholar] [CrossRef]
- Oropeza-Sánchez, M.T.; Solano-Zavaleta, I.; Cuandón-Hernández, W.L.; Martínez-Villegas, J.A.; Palomera-Hernández, V.; Zúñiga-Vega, J.J. Urban green spaces with high connectivity and complex vegetation promote occupancy and richness of birds in a tropical megacity. Urban Ecosyst. 2025, 28, 50. [Google Scholar] [CrossRef]
- Sandström, U.G.; Angelstam, P.; Khakee, A. Urban comprehensive planning–identifying barriers for the maintenance of functional habitat networks. Landsc. Urban Plan. 2006, 75, 43–57. [Google Scholar] [CrossRef]
- Chu, G.Z.; Zheng, G.M. Sampling survey methods for bird habitat research. Chin. J. Zool. 1993, 47–52. [Google Scholar] [CrossRef]
- Chen, S.H.; Ding, P.; Zheng, G.M.; Zhuge, Y. Research on the impact of urbanization on wetland waterbird tribes in Hangzhou City. Zool. Res. 2000, 279–285. Available online: https://kns.cnki.net/kcms2/article/abstract?v=L1vQOn58HG2on1woZUwg4AJ6K28Uy_cJgYla-7PLdQjLl5FZC-NXLmZTckmFR4Mi_s3B1rGmypGJWfmBS-px7KlDdxphxmNV6wfK5IynxUgifJ3ppFu_-O9WTdyHNU3ItTLUwBi-rSUgjdw-DHRo9fd5GXs-QnMTGWmuOJa66wcOLc1_dBQr1A==&uniplatform=NZKPT&language=CHS (accessed on 16 August 2025).
- Yang, W.K.; Zhong, W.Q.; Gao, X.Y. A review of studies on avian habitat selection. Arid Zone Res. 2000, 71–78. [Google Scholar] [CrossRef]
- Wang, L.J. Research on the Relationship Between Birds Diversity and Its Habitat Characteristics in City Parks in Beijing. Master’s Thesis, Beijing Forestry University, Beijing, China, 2012. [Google Scholar]
- Yang, Y.; Wen, J.B.; Hu, D.F. A review on avian habitat research. Sci. Silvae Sin. 2011, 47, 172–180. Available online: https://kns.cnki.net/kcms2/article/abstract?v=L1vQOn58HG3CQZ0gT9K22c7IsZvRKowy7QA5sDbIQod_PxPMZOXGdKDPzwLwS_dQ_zoTXSri-_0X-T5siaxZRb0S6o_J5GgEN7BivTEFiyJAEBl4Ka8hZidn8X42A2tctVR4rHILwjv_FNBk63PMsiRaNV2OQCna4nANOtwbghqK_b3gyH__jQ==&uniplatform=NZKPT&language=CHS (accessed on 16 August 2025).
- Jiang, A.W.; Zhou, F.; Qin, Y.; Liu, N.F. 10-years of bird habitat selection studies in mainland China: A review. Acta Ecol. Sin. 2012, 32, 5918–5923. [Google Scholar] [CrossRef][Green Version]
- Huang, Q.; Swatantran, A.; Dubayah, R.; Goetz, S.J. The influence of vegetation height heterogeneity on forest and woodland bird species richness across the United States. PLoS ONE 2014, 9, e103236. [Google Scholar] [CrossRef]
- Wang, Q.; Liu, Z.C.; Liu, T.Y.; Wan, D.M.; Jiang, Y.T. Multi-dimensional exploration in the study of urban bird diversity: A review. Chin. J. Ecol. 2022, 41, 2058–2063. [Google Scholar]
- Gregory, R.D.; Gibbons, D.W.; Donald, P.F. Bird census and survey techniques. In Bird Ecology and Conservation; OUP Oxford: Oxford, UK, 2004; pp. 17–56. [Google Scholar]
- Gregory, R.D.; Van Strien, A. Wild bird indicators: Using composite population trends of birds as measures of environmental health. Ornithol. Sci. 2010, 9, 3–22. [Google Scholar] [CrossRef]
- Zhang, M.H.; Xiao, Q.Z.; Gao, Z.X. Approach on the Application of Diversity Index Formulae to Bird Community. Chin. J. Ecol. 1990, 52–57. Available online: https://kns.cnki.net/kcms2/article/abstract?v=L1vQOn58HG1DodmgERmoFuyt3kFX6V4mlkIb7o2afVCVLV126tUfiRc26ieGRNZlAAVxiL2JG30wRKWMz4N28ofeOMfuSyLPCsK2s_SVcnjKCysOLMS6P7hTSlqtmjsOs58LxICteOPiSpVbI9oxLDjQl6B0YJU1I7LVb_rA_DlxI7r62Llavg==&uniplatform=NZKPT&language=CHS (accessed on 16 August 2025).
- Deng, J.; Yan, Y.Y.; Zhang, Z.Q.; Li, C.; Yang, D.D. Influence of urbanization on bird species diversity in urban parks in Changsha, Hunan Province during the breeding period. Chin. J. Ecol. 2014, 33, 1853–1859. [Google Scholar]
- Yang, G.; Xu, J.; Wang, Y.; Ding, Y.Z.; Yuan, X.; Pei, E.L.; Ma, B.; Wang, X.M.; Wang, Z.H. The influence of vegetation structure on bird guilds in an urban park. Acta Ecol. Sin. 2015, 35, 4824–4835. [Google Scholar] [CrossRef][Green Version]
- Sui, J.L.; Zhang, Z.X.; Hu, D.F.; Wang, M.Z.; Fu, R.H. Studies on bird-feed trees at green belts of Beijing urban area. Sci. Silvae Sin. 2006, 83–89. Available online: https://kns.cnki.net/kcms2/article/abstract?v=L1vQOn58HG1hjMKNCNbTQmP0nVnH9PnfwZtdqEBTrv8ZMt8ZuvF80NtEXmspHi9zjjbyr-2VeR_rfY93aGdT_Y9ldM7adPkKW4p-2eJIedln3Earr9BYcqgOcxvGAHWRQXgnv3imedE77uBGQ3Y5lbfla1ssRjOghsAg_2ycNN4pd-qYLWz2IA==&uniplatform=NZKPT&language=CHS (accessed on 16 August 2025).[Green Version]
- Yao, Y.H.; Yan, Y.J. Application of winter fruit tree and investigation on bird diversity in Liuzhou. South. Hortic. 2014, 25, 19–21+35. [Google Scholar][Green Version]
- Paker, Y.; Yom-Tov, Y.; Alon-Mozes, T.; Barnea, A. The effect of plant richness and urban garden structure on bird species richness, diversity and community structure. Landsc. Urban Plan. 2014, 122, 186–195. [Google Scholar] [CrossRef]
- DeGRAAF, R.M.; Wentworth, J.M. Avian guild structure and habitat associations in suburban bird communities. Urban Ecol. 1986, 9, 399–412. [Google Scholar] [CrossRef]
- Liu, J.L.; Cao, J.; Li, S.J.; Pan, C.L.; Pan, C.C. Characteristics of soil macrofaunal community structure in secondary forest and forest plantations in western Qinling Mountains of Northwest China. Chin. J. Appl. Ecol. 2012, 23, 2459–2466. [Google Scholar]
- Zhang, Q.; Lan, S.S.; Huang, Q.; Chen, S.H. Urbanization effects on birds: From community to individual. Chin. J. Zool. 2013, 48, 808–816. [Google Scholar]
- Xie, S.L.; Cao, L.; Lu, F.; Ouyang, Z.Y. Adaptation of birds to urbanization. Acta Ecol. Sin. 2016, 36, 6696–6707. [Google Scholar] [CrossRef]
- Wikelski, M.; Kays, R.W.; Kasdin, N.J.; Thorup, K.; Smith, J.A.; Swenson Jr, G.W. Going wild: What a global small-animal tracking system could do for experimental biologists. J. Exp. Biol. 2007, 210, 181–186. [Google Scholar] [CrossRef] [PubMed]
- GB/T 21010-2017; Current Land Use Classification. National Standards of the People’s Republic of China: Beijing, China, 2017.
- Luo, Z.; Jiang, Z.; Tang, S. Impacts of climate change on distributions and diversity of ungulates on the Tibetan Plateau. Ecol. Appl. 2015, 25, 24–38. [Google Scholar] [CrossRef] [PubMed]
- Alagador, D.; Cerdeira, J.O.; Araújo, M.B. Climate change, species range shifts and dispersal corridors: An evaluation of spatial conservation models. Methods Ecol. Evol. 2016, 7, 853–866. [Google Scholar] [CrossRef]
- Sala, O.E.; Chapin, F.S., 3rd; Armesto, J.J.; Berlow, E.; Bloomfield, J.; Dirzo, R.; Huber-Sanwald, E.; Huenneke, L.F.; Jackson, R.B.; Kinzig, A.; et al. Global biodiversity scenarios for the year 2100. Science 2000, 287, 1770–1774. [Google Scholar] [CrossRef] [PubMed]
- Opdam, P.; Wascher, D. Climate change meets habitat fragmentation: Linking landscape and biogeographical scale levels in research and conservation. Biol. Conserv. 2003, 117, 285–297. [Google Scholar] [CrossRef]
- Brodie, J.F.; Paxxton, M.; Nagulendran, K.; Balamurugan, G.; Clements, G.R.; Reynolds, G.; Jain, A.; Hon, J. Connecting science, policy, and implementation for landscape- scale habitat connectivity. Conserv. Biol. 2015, 30, 950–961. [Google Scholar] [CrossRef]
- Sharp, R.; Tallis, H.T.; Ricketts, T.; Guerry, A.D.; Wood, S.A.; Chapin-Kramer, R.; Nelson, E.; Ennaanay, D.; Wolny, S.; Olwero, N.; et al. InVEST 3.2.0 User’s Guide; The Natural Capital Project, Stanford University, University of Minnesota, The Nature Conservancy, and World Wildlife Fund: Stanford, CA, USA, 2015. [Google Scholar] [CrossRef]
- Wang, C.X.; He, J.H.; Liu, D.; Yu, X.; Shi, Q. Impact of land use change on bird habitat connectivity: A case study in Ezhou City. Acta Ecol. Sin. 2022, 42, 4197–4208. [Google Scholar]
- Rong, Y.J.; Zhang, H.; Wang, Y.S. Assessment on land use and biodiversity in Nanjing city based on Logistic-CA-Markov and InVEST model. Res. Soil Water Conserv. 2016, 23, 82–89. [Google Scholar]
- Zhong, L.N.; Wang, J. Evaluation on effect of land consolidation on habitat quality based on InVEST model. Trans. Chin. Soc. Agric. Eng. 2017, 33, 250–255. [Google Scholar]
- Pascual-Hortal, L.; Saura, S. Comparison and development of new graph-based landscape connectivity indices: Towards the priorization of habitat patches and corridors for conservation. Landsc. Ecol. 2006, 21, 959–967. [Google Scholar] [CrossRef]
- Wang, Y.P.; Chen, S.H.; Ding, P. Flush distance: Bird tolerance to human intrusion in Hangzhou. Zool. Res. 2004, 214–220. Available online: https://kns.cnki.net/kcms2/article/abstract?v=L1vQOn58HG0PjhCgjTTh30UOYTLGnM3Wtj_fKikiChq0zZniTNZueJji1wZgNjDbsmfRbw6pzESVndVdc73layAwZegZ60_gMwXM6W28PVLmLwsa_fEK2CQpE0KZfhKcAq5Ou34Ae_GAKEqxU_fynS2zoUqMBm3novcWtIU_Akaqxk0ufy3IoA==&uniplatform=NZKPT&language=CHS (accessed on 16 August 2025).
- Shannon, C.E. A mathematical theory of communication. Bell Syst. Tech. J. 1948, 27, 379–423. [Google Scholar] [CrossRef]
- Margalef, R. Information theory in ecology. Gen. Syst. 1958, 3, 36–71. [Google Scholar]
- Pielou, E.C. The measurement of diversity in different types of biological collections. J. Theor. Biol. 1966, 13, 131–144. [Google Scholar] [CrossRef]
- Simpson, E.H. Measurement of diversity. Nature 1949, 163, 688. [Google Scholar] [CrossRef]
- He, J.H.; Wang, C.X.; Liu, D.F.; Cheng, H.; Shi, Q.Q. Evaluating the impact of land use change on habitat quality in metropolitan fringe areas from a perspective of ecological network. Resour. Environ. Yangtze Basin 2019, 28, 903–916. [Google Scholar]
- Garizábal-Carmona, J.A.; Mancera-Rodríguez, N.J. Bird species richness across a Northern Andean city: Effects of size, shape, land cover, and vegetation of urban green spaces. Urban Urban Green 2021, 64, 127243. [Google Scholar] [CrossRef]
- Guo, S.Y.; Zhaiteng, X.; Xiayuan, Y.; Cao, Y. The mechanism of urban built environment impact on avian diversity—A systematic review. Chin. Landsc. Archit. 2022, 38, 71–76. [Google Scholar]
- Raap, T.; Sun, J.C.; Pinxten, R.; Eens, M. Disruptive effects of light pollution on sleep in free-living birds: Season and/or light intensity-dependent? Behav. Process. 2017, 144, 13–19. [Google Scholar] [CrossRef]
- Mishra, I.; Knerr, R.M.; Stewart, A.A.; Stewart, A.A.; Payette, W.I.; Richter, M.M.; Ashley, N.T. Light at night disrupts diel patterns of cytokine gene expression and endocrine profiles in zebra finch (Taeniopygia guttata). Sci. Rep. 2019, 9, 15833. [Google Scholar] [CrossRef] [PubMed]
- Cabrera-Cruz, S.A.; Smolinsky, J.A.; McCarthy, K.P.; Buler, J.J. Urban areas affect flight altitudes of nocturnally migrating birds. J. Anim. Ecol. 2019, 88, 1873–1887. [Google Scholar] [CrossRef]
- Shannon, G.; McKenna, M.F.; Angeloni, L.M.; Crooks, K.R.; Fristrup, K.M.; Brown, E.; Warner, K.A.; Nelson, M.D.; White, C.; Wittemyer, G.; et al. A synthesis of two decades of research documenting the effects of noise on wildlife. Biol. Rev. 2016, 91, 982–1005. [Google Scholar] [CrossRef] [PubMed]
- Senzaki, M.; Barber, J.R.; Phillips, J.N.; Carter, N.H.; Cooper, C.B.; Ditmer, M.A.; Firstrup, K.M.; McClure, C.J.W.; Mennitt, D.J.; Ditmer, M.A.; et al. Sensory pollutants alter bird phenology and fitness across a continent. Nature 2020, 587, 605–609. [Google Scholar] [CrossRef]
- Templeton, C.N.; Zollinger, S.A.; Brumm, H. Traffic noise drowns out great tit alarm calls. Curr. Biol. 2016, 26, R1173–R1174. [Google Scholar] [CrossRef]
- Wilson, E.O.; MacArthur, R.H. The Theory of Island Biogeography; Princeton University Press: Princeton, NJ, USA, 2016. [Google Scholar]
- Sun, B.; Lu, Y.L.; Yang, Y.; Yu, M.; Yuan, J.; Yu, R.; Bullock, J.M.; Stenseth, N.C.; Li, X.; Li, J.L.; et al. Urbanization affects spatial variation and species similarity of bird diversity distribution. Sci. Adv. 2022, 49, e3061. [Google Scholar]
- Campbell, C.E.; Jones, D.N.; Awasthy, M.; Chauvenet, A.L. How do we study birds in urban settings? A systematic review. Biodivers. Conserv. 2022, 31, 1–20. [Google Scholar] [CrossRef]
- Evans, K.L.; Chamberlain, D.E.; Hatchwell, B.J.; Gregory, R.D.; Gaston, K.J. What makes an urban bird? Glob. Change Biol. 2011, 17, 32–44. [Google Scholar] [CrossRef]
- Leveau, L.M.; Bocelli, M.L.; Quesada-Acuña, S.G.; González-Lagos, C.; Tapia, P.G.; Dri, G.F.; Delgado-V, C.A.; Garitano-Zavala, A.; Campos, J.; Morelli, F.; et al. Bird diversity-environment relationships in urban parks and cemeteries of the Neotropics during breeding and non-breeding seasons. PeerJ 2022, 10, e14496. [Google Scholar] [CrossRef]
- Chamberlain, D.E.; Cannon, A.R.; Toms, M.P.; Leech, D.I.; Hatchwell, B.J.; Gaston, K.J. Avian productivity in urban landscapes: A review and meta-analysis. IBIS 2009, 151, 1–18. [Google Scholar]
- Zhang, W.Q.; Dong, L. Study of Bird Preference to Plant Habitat and Species in Beijing Urban Park. Chin. Landsc. Archit. 2015, 31, 15–19. [Google Scholar]
- Gutierrez, B.T.; Zeigler, S.L.; Lentz, E.; Sturdivant, E.J.; Plant, N.G. Integrating bayesian networks to forecast sea-level rise impacts on barrier island characteristics and habitat availability. Earth Space Sci. 2022, 9, e2022EA002286. [Google Scholar]
- Kim, J.; Chae, J.; Koo, T.H. Variation in bird diversity in relation to habitat size in the urban landscape of Seoul, South Korea. Acta Ornithol. 2007, 42, 39–44. [Google Scholar] [CrossRef][Green Version]
Disclaimer/Publisher’s Note: The statements, opinions and data contained in all publications are solely those of the individual author(s) and contributor(s) and not of MDPI and/or the editor(s). MDPI and/or the editor(s) disclaim responsibility for any injury to people or property resulting from any ideas, methods, instructions or products referred to in the content. |
© 2025 by the authors. Licensee MDPI, Basel, Switzerland. This article is an open access article distributed under the terms and conditions of the Creative Commons Attribution (CC BY) license (https://creativecommons.org/licenses/by/4.0/).