Abstract
In the Republic of Korea, the problems of low birth rate and population aging are accelerating population decline at the regional level, leading to the phenomena of local extinction and urban shrinkage. These phenomena, coupled with the projected nationwide population decline, pose a fundamental threat to the sustainability of essential infrastructure such as urban parks. The conventional growth-oriented paradigm of urban planning has shown clear limitations in quantitatively forecasting future demand, constraining proactive management strategies for the era of population decline. To address this gap, this study develops a policy-decision-support framework that integrates long-term population projections, grid-based population data, the DEGURBA urban classification system—a global standard for delineating urban and rural areas— and network-based accessibility analysis. For the entire Republic of Korea, we (1) constructed a 1 km resolution time-series population dataset for 2022–2072; (2) applied DEGURBA to quantify transitions among urban, semi-urban, and rural types; and (3) assessed changes in potential user populations within the defined service catchments. The results indicate that while population concentration in the Seoul Capital Area persists, under the low-variant scenario, a projected average decline of 40% in potential user populations by 2072 will lead to significant functional changes, with 53.6% of municipalities nationwide transitioning to “semi-urban” or “rural” areas. This spatial shift is projected to decrease the proportion of urban parks located in “urban” areas from 83.3% to 75.0%, while the total potential user population is expected to plummet from approximately 44.4 million to 25.8 million, a 42.0% reduction. This study underscores the need for urban park policy to move beyond quantitative expansion and toward quality-oriented management based on selection and concentration. By uniquely integrating long-term demographic scenarios, the Degree of Urbanization (DEGURBA), and spatial accessibility analysis, this study provides a foundational scientific basis for forecasting future demand and supports the formulation of sustainable, data-driven strategies for urban park restructuring under conditions of demographic change.
1. Introduction
The global pace of population growth has markedly slowed. The growth rate, which peaked at an annual average of 2.3% in the late 1960s, declined to 1.1% in 2015–2020 [1]. In particular, many countries—including Japan, Germany, and Russia—are experiencing population decline that exceeds earlier projections [2], which is expected to cause population aging and labor force contraction and, in turn, lead to serious economic and social problems [3]. This population decline is not confined to a few countries but has manifested as a worldwide phenomenon of urban shrinkage [4,5]. For instance, Leipzig, Germany, experienced extensive housing vacancies and an oversupply of urban infrastructure following a sharp population decrease in the 1990s. Similarly, Detroit, United States, experienced a steep population drop concurrent with the decline in its automobile industry [4,6,7]. In response, countries are addressing urban shrinkage through diverse urban planning strategies such as urban regeneration, urban compaction, and the expansion of green spaces [5].
The Republic of Korea is at a turning point of population decline due to an unprecedented low fertility phenomenon and entry into a super-aged society [8]. Since 2012, Korea has consistently recorded the lowest fertility rate among OECD countries, reaching an all-time low of 0.72 in 2023 [9,10]. By the end of 2024, the share of the population aged 65 and over surpassed 20%, marking Korea’s official entry into a super-aged society [1]. These demographic shifts are expected to accelerate the inversion of the population pyramid, generating structural challenges across the nation and the urban system as a whole [8]. In particular, they may greatly affect the provision of public services and the sustainability of urban infrastructure [11,12]. Declining population increases the burden of urban operation and maintenance costs and intensifies fiscal pressures such as reduced tax revenues, often resulting in urban shrinkage [12,13].
These demographic changes are also expected to have significant impacts on urban parks, which are directly linked to residents’ quality of life. Urban parks now face new management challenges, including facility aging and deterioration, insufficient maintenance due to budget shortfalls, weakened functions from declining demand, and the underuse and neglect of certain spaces [14,15,16]. Such neglect not only diminishes the functional quality of urban park but can also undermine residents’ sense of safety and comfort, which in turn contributes to a cycle of declining visitation [17]. This necessitates a strategic management approach for underutilized land, including derelict urban parks and vacant lots, a challenge particularly prominent in countries experiencing severe depopulation [18]. This is exemplified in cities like Muroran, Japan, where residents in an aging, depopulating city prioritize qualitative improvements and community engagement over the quantitative expansion of urban parks [15]. South Korea’s urban park policy is based on the Act on Urban Parks and Green Areas [19], and since the 1960s, when urbanization advanced, it has focused on quantitative expansion of urban park areas [20]. Recently, to overcome institutional limitations such as the long-term unexecuted urban park issue and to respond to changing citizen demands, qualitative shifts—such as green infrastructure strategies and strengthening urban resilience—have been attempted [21]. However, existing urban planning frameworks, which were designed for an era of growth, are ill-equipped to address these new challenges. There is a critical need for a long-term, quantitative, and spatially explicit approach to forecast future urban park demand and guide proactive restructuring [22].
Although extensive research has examined the accessibility and equity of urban parks, most studies have focused on current demand measurement based on present population and visitors, revealing an important limitation [23,24,25,26,27]. Many studies, often framed within concepts like the ‘15-min city’, have analyzed disparities in urban park provision based on socioeconomic factors, using indicators such as urban park area and accessibility indices [28,29,30]. These standards are exemplified by South Korea’s ‘Living SOC (Social Overhead Capital)’ policy. Here, SOC denotes essential infrastructure directly related to daily life, and the policy specifies a 10-min walk for village facilities and a 20-min drive for regional hubs such as theme parks [31]. Similarly, municipalities like the Seoul Metropolitan Government have sought to increase small-scale parks to enhance local access [32,33]. While these studies provide valuable insights, their temporal scope is limited. Recently, the concept of “future accessibility” has been raised, but most analyses remain short-term (5–10 years) and therefore fail to adequately capture the long-term impacts of profound demographic shifts on urban park sustainability [34,35]. In particular, systematic long-range forecasting frameworks that integrate population projections remain underdeveloped, constraining decision-making for proactive restructuring to address overprovision or service gaps [34,35,36,37].
To address this gap, this study develops and applies a novel, integrated analytical framework that combines long-term population projections, a standardized urban classification system, and network-based accessibility analysis. The aim is to scientifically identify urban parks at high risk of future underuse and provide an evidence-based foundation for sustainable restructuring strategies in an era of demographic change.
The distinct contributions of this study are threefold. First, population projections at the administrative-district level were spatialized to a 1 km grid to enable precise estimation of future demand changes [38,39,40]. Second, by applying the DEGURBA classification system across a time-series, the locational typology of individual parks was tracked, identifying whether they were situated in urban, semi-urban, or rural contexts over time [41]. Third, spatiotemporal changes in the potential user population within urban park service catchments were examined through network-based accessibility analysis. Through these steps, long-term changes in demand at the level of individual urban parks are predicted, and evidence is provided for proactive management strategies that efficiently allocate limited resources according to the principle of “selection and concentration.” Furthermore, this study makes both academic and practical contributions by laying the groundwork for extending long-term urban park research frameworks and providing an evidence-based foundation for sustainable urban park management in the era of population decline.
2. Materials and Methods
2.1. Study Area
The study area (Figure 1) is defined as the entire territory of the Republic of Korea, a region currently facing pronounced spatial imbalance in national development and the onset of population decline. The national population peaked in 2020 and has since been declining. Located in the southern part of the Korean Peninsula in Northeast Asia, the Republic of Korea covers approximately 100,445 km2 and recorded a population of 51.67 million in 2022, corresponding to a population density of 514.4 persons/km2—among the highest in the OECD countries [10,42].
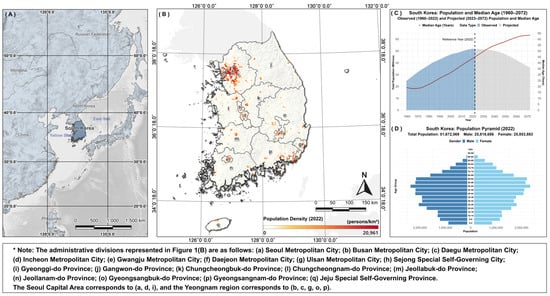
Figure 1.
(A) Geographical location of the Republic of Korea (within East Asia), (B) population density map of the Republic of Korea (study area), (C) total population trend and change in median age (1960–2072), (D) population pyramid of the Republic of Korea (as of 2022).
The spatial distribution of population within the national territory is highly uneven, with extreme concentration in the Seoul Capital Area (Seoul, Incheon, Gyeonggi). This region, accounting for only 11.8% of the national territory, is home to more than half of the total population (50.6% as of 2022) [9,43], making it one of the most extreme cases of capital-area concentration globally [44]. The persistence of this concentration over decades has deepened disparities with non-capital regions, and these imbalances are further exacerbated by localized population decline and aging. In 2021, 89 out of 226 municipalities nationwide were officially designated as “population-declining areas” [45], facing structural risks such as declining urban vitality and increased burdens in operating and maintaining public services due to population outflow and aging.
The Republic of Korea is experiencing complex demographic and spatial changes, such as unprecedentedly low fertility, rapid aging, and severe capital-area concentration. These nationwide demographic trends are expected to affect both the demand for and the maintenance of Living SOC, including urban parks. Therefore, to comprehensively analyze these impacts, this study sets its spatial scope as the entire national territory rather than focusing on a specific region.
2.2. Data Sources
This study utilized various datasets provided by public institutions and public data platforms for grid-based analysis in response to population decline and changes in urban structure. All spatial data were standardized to the EPSG:5179 (Korea 2000/Central Belt) coordinate reference system, which covers the entire Republic of Korea, to ensure analytical consistency and accuracy.
Detailed information on the main datasets deployed in the study is presented in Table 1. The most recent available sources were selected; although there are temporal mismatches among reference years, their impact on the analysis is considered minimal.

Table 1.
Main datasets used in the study and their sources.
2.3. Methods
This study comprises a three-stage analytical process to identify urban parks with a high likelihood of future underuse or disuse in response to population decline and to determine sites requiring restructuring. In this context, underuse is defined as a state where an urban park’s usage falls significantly below its original planning standards due to a shrinking local population. Disuse refers to a more severe condition—the risk that a urban park will have virtually no users, often linked to extreme demographic shifts like local extinction, leaving it functionally abandoned.
The three stages of the analysis are (1) estimating future population at the 1 km grid scale using projection data; (2) analyzing time-series transitions in urban type; and (3) linking the results to urban park service catchments through accessibility analysis to estimate potential user populations. The overall workflow and interlinkages among these stages are illustrated in Figure 2.
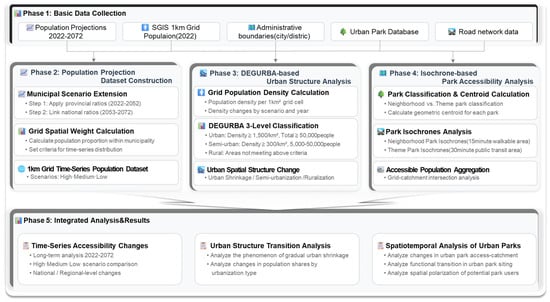
Figure 2.
Flowchart of the research methods.
2.3.1. Construction of a Grid-Based, Scenario-Specific Population Dataset
To capture detailed spatiotemporal patterns of future demographic change, this study constructed a grid-based, time-series population dataset at a 1 km resolution for the period 2022–2072 using Statistics Korea’s official population projections. The process involved two steps: (i) extending and adjusting population projection data at the municipal level through 2072, and (ii) spatially allocating these extended projections to 1 km2 grids.
Statistics Korea’s population projections are based on the Cohort Component Method, which repeatedly computes annual populations by applying demographic factors such as births, deaths, and international migration to the demographic balancing equation [33].
where Pt is the population in year t, Bt−1 is the number of births in year t−1, Dt−1 is the number of deaths in year t−1, and NMt−1 is the net international migration in year t−1.
Three scenarios were provided—high, medium, and low—based on alternative assumptions for fertility, life expectancy, and international migration (Appendix A Table A1). The medium variant serves as the baseline, assuming medium levels for all three factors. The high variant assumes higher fertility, longer life expectancy, and higher net migration, reflecting the possibility of population growth. Conversely, the low variant assumes lower levels for all three factors, emphasizing population-decreasing drivers.
The coverage of these projections differs depending on the administrative level (Table 2). At the municipal level, only medium-variant data are provided through 2042, which imposes a constraint for constructing full high- and low-variant projections at this scale.
Table 2.
Data structure of future population projections by administrative unit.
To address these limitations, two adjustments were implemented: period extension and scenario extension. For period extension, the average annual rate of population growth or decline during the last five years of available municipal-level data (2038–2042) was calculated for each municipality. Under the assumption that this trend persists, year-by-year populations were extrapolated through 2072. For scenario extension, high- and low-variant estimates were derived by calculating the yearly ratios of high-to-medium and low-to-medium populations at higher administrative levels (national and provincial) and applying these ratios to the extended municipal-level medium-variant populations. Finally, to ensure consistency between the municipal-level extensions and the official national totals, correction factors were computed from the discrepancies between the aggregated municipal sums and the national projections and proportionally applied to the municipal data.
For spatial allocation, we employed grid-based weights (Wi,j), derived from the 2022 1 km2 population statistics provided by the Statistical Geographic Information Service (SGIS):
where Pgrid (i,2022) is the population of grid(i) in 2022, and Psigungu(j,2022) is the 2022 total population of the municipality (j) that contains grid(i).
By combining these spatial weights (Wi,j) with the extended municipal projections (Psigungu(j,t,s)), the final grid-level population (Pgrid(i,t,s)) for year (t) under scenario (s) was estimated as:
This proportional allocation approach, though based on the assumption that intra-municipal spatial distributions remain constant over time, is commonly used in prior studies [38,46,47]. While it does not perfectly capture detailed intra-urban migration patterns, it ensures methodological consistency by linking macro-level projections provided at the administrative district scale to micro-level spatial units of 1 km grids. This provides the foundation for subsequent analyses of population density, DEGURBA-based urban structure change, and urban park accessibility.
2.3.2. Quantitative Analysis of Changes in Urban Spatial Structure Using DEGURBA
To quantify the spatiotemporal impacts of population decline on urban spatial structure, this study employed the DEGURBA classification system, officially endorsed by the United Nations Statistical Commission in 2020. Developed through collaboration among six international organizations including Eurostat, DEGRUBA provides a standardized three-level framework for cross-country comparison of spatial structures (Eurostat, 2021; UN-Habitat, 2020). Unlike conventional urban–rural delineations based on national administrative boundaries, DEGURBA objectively classifies urbanization levels at the 1 km grid scale using population density and spatial contiguity [41].
The analytical procedure of this study consisted of two stages. First, grids were classified into three categories: urban center, urban cluster, and rural. Second, the results were aggregated to administrative units to determine the final type of each unit.
At the grid level, the classification proceeded as follows. Urban centers were defined for grids with a population density ≥ 1500 persons/km2. Clusters were formed based on four-direction (rook) contiguity, and a gap-filling algorithm was applied to close internal voids within clusters. If the total population of a cluster was ≥50,000, the constituent grids were classified as an urban center. Urban clusters were identified for grids with a population density ≥ 300 persons/km2, grouped using eight-direction (queen) contiguity. Clusters with a total population between 5000 and 50,000 not already designated as urban centers were classified as urban clusters. All other grids were classified as rural (non-urban) areas.
At the administrative level, the grid-based classifications were aggregated to municipalities. Based on the population shares of each type, the final DEGURBA classification was assigned as summarized in Figure 3. If at least 50% of the municipal population resided in a specific type (urban, semi-urban, or rural), the unit was classified accordingly. This classification process adheres to the official guidelines, and further details can be found in Applying the Degree of Urbanization—A Methodological Manual to Define Cities, Towns and Rural Areas for International Comparisons [41]. The time-series DEGURBA data generated were overlaid with administrative boundaries to calculate annual changes in both land area and population shares by urbanization type. By comparing the base year (2022) with projections under different scenarios, we quantitatively assessed the dynamics of urban shrinkage, semi-urbanization, and ruralization associated with long-term population decline.
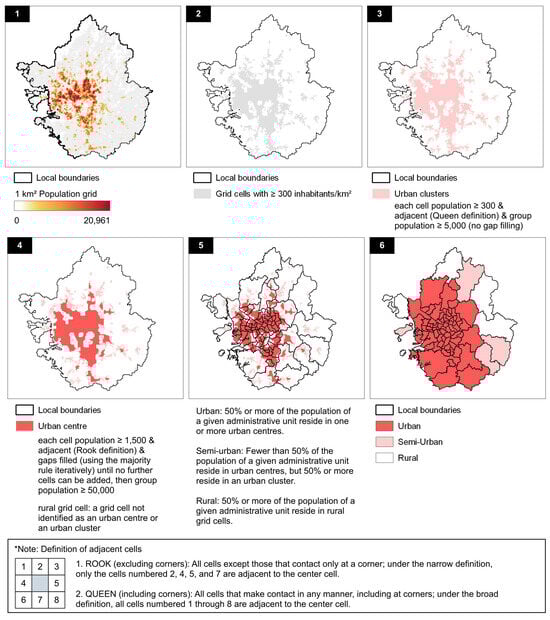
Figure 3.
DEGURBA classification flowchart.
2.3.3. Analysis of Changes in Urban Park Siting and Accessible Population in Response to Time-Series Population Change
To quantitatively evaluate the impacts of population decline on urban park services, we integrated the time-series population dataset with urban park data to analyze changes in accessible populations. The analysis proceeded in three stages: (1) defining access catchments by urban park type, (2) assessing changes by urban spatial structure type, and (3) estimating scenario-specific potential user populations.
The urban parks were classified into living-zone parks (23,093) and theme parks (3510) according to the subdivision criteria under Article 15 of the 「Act on Urban Parks and Green Areas」 [19]. Adopting this legal criterion clarified the functional distinction between everyday neighborhood facilities, which constitute the foundation of the urban living environments, and specialized facilities serving broader purposes. To reflect this heterogeneity, accessibility indicators were set in accordance with urban park type.
For living-zone parks—designated to meet daily needs such as walking, rest, and light exercise—walkable access from residences was emphasized. Consistent with the “15-min city” principle, a 15-min walking distance (1200 m) was designated as the access catchment [32,33]. In contrast, theme parks—such as historical, cultural, waterside, cemetery, sports, urban agricultural, and disaster prevention parks—serve as destination-oriented amenities attracting visitors from wider areas. In line with the Living SOC indicator, their catchments were defined as a 20-min drive (approximately 10 km, assuming an average speed of 30 km/h) [31].
Service area analysis was conducted for all 26,603 urban parks. To ensure national-scale consistency and overcome the non-standard nature of urban park entrance data, the geometric centroid of each urban park was used as the origin of analysis. While centroid-based modeling may not fully capture entrance-specific accessibility, it provides a methodologically consistent and scalable basis for nationwide comparison. Moreover, because the focus of this study lies on long-term, macro-level spatial trends associated with demographic decline rather than micro-level behavioral patterns of individual urban park users, the centroid approach is well aligned with the research objectives. The analysis was performed in a QGIS 3.28.15 environment using the QNEAT3 plugin, with the 2022 road network data from KDPA as the underlying network.
The resulting urban-park-specific access catchments polygons were then overlaid with the scenario-specific, time-series population grids. For each year and scenario, the total population within the access catchments was aggregated and defined as the potential urban park user population.
Finally, to assess how urban type transitions driven by population decline affect urban park service populations, we linked the DEGURBA classification. Each grid within the urban-park-accessible population was assigned an urban type (urban, semi-urban, rural), enabling identification of which spatial categories are most affected by declines in service populations during urban shrinkage.
This methodological framework offers a systematic approach to linking the macro-level phenomenon of population decline with micro-level urban infrastructure. By sequentially integrating grid-based population projections, the DEGURBA urban classification, and accessibility analysis, it translates demographic and spatial transitions—such as urban shrinkage, semi-urbanization, and ruralization—into quantifiable and spatially explicit effects on urban park accessibility and potential user populations. In achieving this, it provides robust scientific evidence to guide proactive, spatially differentiated urban, environmental, and landscape policy formulation for an era of demographic contraction.
3. Results
3.1. Time-Series Population Change and the Deepening of Spatial Imbalance
3.1.1. National-Level Changes
An analysis of future population trends from 2022 to 2072 under three scenarios confirms that long-term population decline is projected in all cases (Table 3). Under the high-variant scenario, the national population declines from 51.67 million in 2022 to 42.82 million in 2072, a reduction of approximately 17.1%. The medium-variant projects a decline of 29.9%, while the low-variant indicates the steepest decline at 41.6%.
Table 3.
Future population projections by scenario and change rates relative to 2022.
In the first 20 years (2022–2042), the high scenario shows a marginal increase (+1.2%), but the medium (−4.0%) and low (−9.0%) scenarios already show decline, signifying the onset of demographic contraction. After 2042, population decline accelerates under all scenarios. In particular, the low scenario projects the sharpest shift, with a reduction of approximately 10 million between 2042 and 2062 and a further loss of 16 million by 2072.
Collectively, the projections indicate a consistent and long-term national population decline, with the rate of contraction projected to accelerate markedly in the latter half of the 50-year period across all scenarios.
3.1.2. Regional-Level Changes
Amid the nationwide trend of population decline projected through 2072, regional disparities are expected to deepen substantially (Figure 4 and Figure 5; Appendix A Table A2). For geographical reference, Figure 1B provides a map of the major administrative divisions. Under the low-variant scenario, the national average population decline reaches −41.6%, but the pace of decline markedly varies across regions.
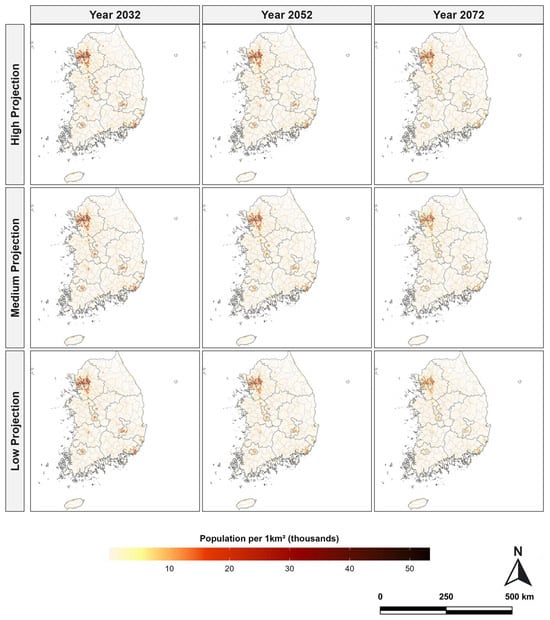
Figure 4.
Time-series population change (2022–2072; high, medium, and low scenarios).
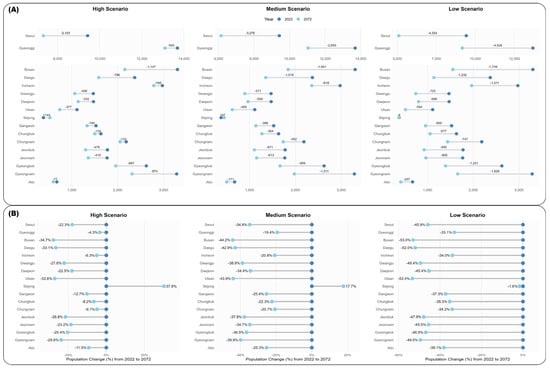
Figure 5.
(A) Comparison of provincial population change by scenario (2072 relative to 2022), (B) scenario-based relative rates of change (%) in provincial population in 2072.
The Yeongnam region in southeastern Korea, encompassing metropolitan cities of Busan, Ulsan, and Daegu together with the surrounding provinces of Gyeongsangnam-do and Gyeongsangbuk-do, is projected to undergo the steepest population decreases. In the low-variant scenario, Ulsan records the most severe decline nationwide (−53.4%), followed by Busan (−53.0%) and Daegu (−52.0%), each falling to less than half their 2022 populations. The broader Yeongnam region, including Gyeongsangnam-do (−49.5%) and Gyeongsangbuk-do (−46.9%), is likewise projected to experience significant decreases.
By contrast, Sejong Special Self-Governing City demonstrates a distinctive demographic trajectory. Established in 2012 as a planned city to alleviate overconcentration in the Seoul Capital Area and promote national balanced development through the relocation of many central administrative agencies, Sejong’s functional urban characteristics directly affect its population dynamics. Sejong exhibits population growth in both the medium (+17.7%) and high (+37.8%) scenarios, while remaining nearly stable (−1.6%) even in the low scenario.
Within the Seoul Capital Area, Gyeonggi-do (−33.1%) and Incheon Metropolitan City (−34.0%) record declines lower than the national average, partially buffering regional loss. By contrast, Seoul Metropolitan City records a steeper decline (−45.9%), consistent with the national trend. Nevertheless, despite this relative decline, Seoul’s projected 2072 population remains about 5.10 million, and its share of the national population decreases only slightly from 18.2% in 2022 to 16.9% in 2072.
Overall, the Seoul Capital Area’s share of the national population is projected to increase across all scenarios—from 50.5% in 2022 to 53.8% (low), 53.9% (medium), and 54.2% (high) by 2072. As a result, the projections show three distinct regional patterns: a severe and widespread decline in the Yeongnam region, unique policy-driven stability or growth in Sejong, and an intensifying concentration of the national population within the Seoul Capital Area.
3.2. The Phenomenon of Gradual Urban Shrinkage and Changes in Urban Spatial Structure
3.2.1. Changes in Urbanization Type
Based on future population projections from 2022 to 2072, an analysis of changes in urban type across 252 municipalities reveals two major patterns. First, there is a net decrease in the number of “urban” areas, primarily through a shift to the “semi-urban” category. Under the low scenario, the number of municipalities classified as “urban” decreases from 152 in 2022 to 135 in 2072. Of the 17 areas that change type, 16 are projected to transition to “semi-urban,” while only 1 is projected to become “non-urban/rural” (Table 4).
Table 4.
Urban type transitions by scenario in 2072 relative to the base year (2022).
Second, these changes are not spatially uniform. For instance, Seoul Metropolitan City retains the “urban” type across all 25 municipalities under every scenario, whereas in Gyeongsangbuk-do, the number of “urban” areas decreases from eight in 2022 to four under the low scenario. Similarly, in Busan Metropolitan City, three of the sixteen “urban” areas are projected to shift to “semi-urban” (Figure 6, Appendix A Table A3). A unique case is observed in Jeollanam-do, where one “urban” area is projected to transition directly to “non-urban/rural,” bypassing the semi-urban stage.
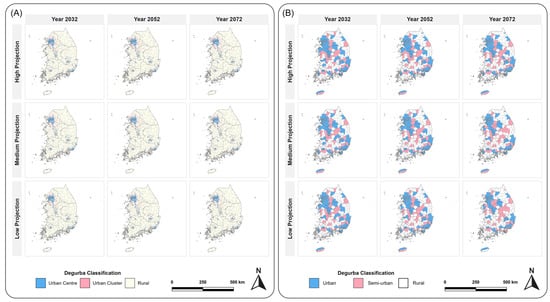
Figure 6.
(A) Grid-level DEGURBA classification, (B) administrative-unit DEGURBA classification.
3.2.2. Changes in Population Shares by Urbanization Type
Changes in urban type are also manifested in the distribution of population shares. By 2072, the population share of urban areas declines, while those of semi-urban and non-urban/rural areas increase (Figure 7; Appendix A Table A4; see also Figure 1B for reference to administrative divisions). Under the low scenario, the national population share declines from 79.7% in 2022 to 73.5% in 2072 (−6.2%). Over the same period, the share of “semi-urban” areas rises from 11.5% to 15.7% (+4.2%), while rural areas increase from 8.8% to 10.8% (+2.0%).
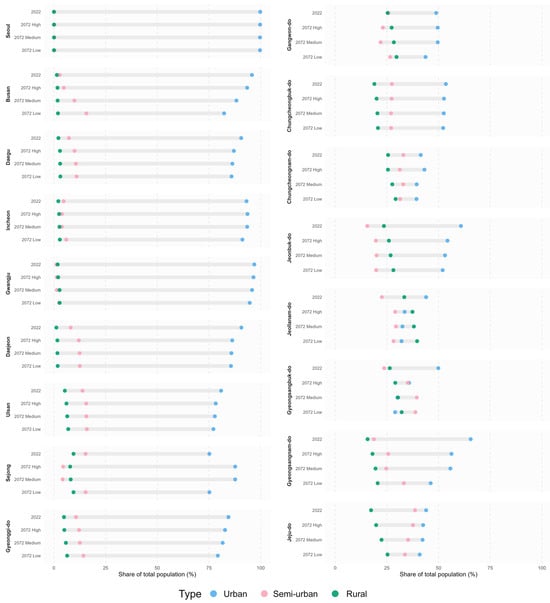
Figure 7.
Changes in population shares by urbanization type (2022 baseline vs. 2072 scenarios).
These shifts are more pronounced in non-capital regions. The largest declines in the urban population share occur in Gyeongsangbuk-do (−20.9%), Gyeongsangnam-do (−19.4%), Busan (−13.5%), Jeollanam-do (−11.9%), and Jeollabuk-do (−8.8%). At the same time, these regions show the largest increases in the “semi-urban” population share: Gyeongsangbuk-do (+15.2%), Gyeongsangnam-do (+14.5%), and Busan (+12.9%).
By contrast, population shares in metropolitan centers remain relatively stable. Even under the low scenario, Seoul’s urban population share changes only marginally, from 99.8% to 99.7%. Sejong, which has exhibited a distinctive demographic dynamic since its establishments, shows an increase in the urban population share under the high and medium scenarios (+12.5%).
3.3. Analysis of Spatiotemporal Changes in Urban Parks Due to Urban Shrinkage and Population Decline
3.3.1. Urban Park Access Catchment Analysis
For a total of 26,603 urban parks nationwide, service area analysis was conducted to delineate the spatial extent of urban park service catchments (Figure 8). Applying a 15-min walking distance for living-zone parks (23,093 sites) and a 20-min driving distance for theme parks (3510 sites), the analysis shows that, in the base year 2022, 56.6% of the national territory falls within at least one urban park service catchment.
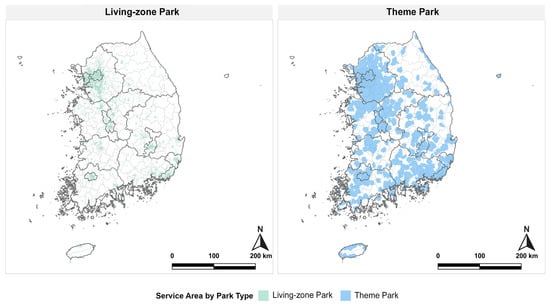
Figure 8.
Urban park service catchments for living-zone parks and theme parks.
Overlaying these catchments with population data revealed that 86.4% of the national population (44.42 million persons) resides within the service area of living-zone parks and 95.9% (49.28 million persons) within the service area of theme parks. By contrast, about 6.99 million persons (13.6% of the population) reside outside the service areas of both living-zone and theme parks, indicating a substantial population without proximate access to urban parks.
3.3.2. Functional Transition in Urban Park Siting
At the national scale, the proportion of urban parks located in “urban” areas is projected to decrease from 83.3% in 2022 to 75.0% by 2072 under the low scenario, while the share in “semi-urban” areas increases from 9.9% to 16.4% and in “rural” areas from 6.8% to 8.5% (Table 5, Figure 9, Appendix A Table A5).
Table 5.
Matrix of locational transitions of urban parks (2022–2072).
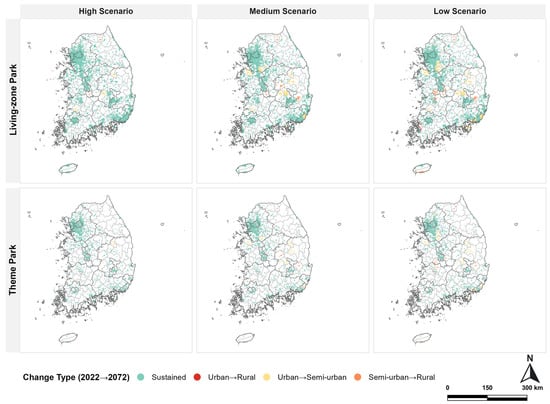
Figure 9.
Locational changes in urban parks due to changes in urban type (2022–2072).
These changes in the locational context of urban parks are particularly pronounced outside the Seoul Capital Area. For instance, Busan (−40.1%), Gyeongsangbuk-do (−34.0%), Gyeongsangnam-do (−16.1%), and Chungcheongnam-do (−11.9%) record the largest declines in the share of urban parks situated in “urban” areas. By contrast, Seoul, Gwangju, Daejeon, and Sejong maintain a 100% share of their parks within “urban” areas, even under the low scenario.
3.3.3. Changes in Demand and Spatial Polarization of the Potential Urban Park User Population
Analysis of potential user populations within urban park service catchments over the 50-year period (2022–2072) reveals a pronounced nationwide decline driven by low fertility and rapid aging. At the national scale, the potential user population of living-zone parks decreases from approximately 44.4 million in 2022 to 25.8 million in 2072 under the low scenario, representing a −42.0% reduction (medium −30.4%, high −17.7%). Theme parks follow a nearly identical trajectory, declining from 49.3 million to 28.8 million under the low scenario (−41.6%) (Table 6, Figure 10, Appendix A Table A6 and Table A7).
Table 6.
Scenario-based changes in the potential user population of urban parks and change rates relative to 2022.
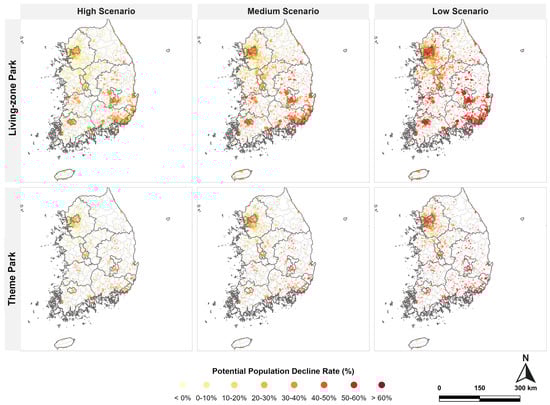
Figure 10.
Projected population decline by park (2022–2072).
This demand contraction, however, is not spatially uniform. Old core and non-capital regions in the south—including Busan, Daegu, Gyeongsangbuk-do, and Jeollanam-do—exhibit the steepest declines, with reductions exceeding 50% in some cases. For example, in Yeongdo-gu, Busan, the potential user population of living-zone parks is projected to decline by −60.3%, suggesting that certain urban parks may face conditions in which sustaining basic services becomes infeasible. By contrast, the Seoul Capital Area and selected new towns display relative stability or even growth under the high and medium scenarios. Sejong stands out as a unique case, showing only a −1.6% change under the low scenario and population gains under the other scenarios.
4. Discussion
4.1. Identifying Gradual Urban Shrinkage and Spatial Differentiation
Long-term population projections indicate that South Korea is entering a phase of structural population decline, which is expected to persist and intensify in the coming decades. This process is characterized less by abrupt collapse and more by gradual shrinkage. The phenomenon of gradual urban shrinkage has been recognized as a defining pattern in prior research on ‘shrinking cities.’ In Europe, for example, the trajectory of urban decline has varied by national context and city size, with a notable trend of prolonged, gradual population loss in former socialist countries and in small-to-medium-sized cities dependent on a single industry [4].
While population loss in Leipzig, Germany, or the industrial downturn in Detroit, USA, triggered urban shrinkage [7], the South Korean case differs in that the driving forces are primarily demographic—marked by ultra-low fertility and rapid aging—rather than industrial or economic collapse. Another important distinction is temporal: international cases largely document that reactive responses after shrinkage had already advanced considerably, whereas South Korea is only beginning to enter the early stage of structural urban shrinkage driven by population decline.
Accordingly, this study extends beyond retrospective analyses. By preemptively projecting the scale and spatial patterns of future urban shrinkage at the national level, it provides timely and policy-relevant insights. This forward-looking approach offers a scientific basis for developing rational, evidence-based strategies before the full extent of the demographic crisis materializes.
4.2. Comparison with the International Discourse on ‘Shrinking Cities’
The phenomenon of urban shrinkage in South Korea, as identified in this study, shares similarities with international cases such as Leipzig in Germany, Detroit in the United States, and Muroran in Japan, but it also displays important differences [4,6,7,15]. Whereas these international examples primarily highlight regional or city-specific decline, South Korea’s situation, similar to Japan’s super-aged society, is fundamentally driven by nationwide demographic shifts stemming from ultra-low birth rates and a rapidly aging population. This signals a more profound structural crisis, as the decline is projected to affect the entire national system rather than isolated regions [9,43].
At the same time, the concentration of population in metropolitan areas, even amid the overall decline, is consistent with global urbanization trends. Worldwide, urban concentration has accelerated, with more than half of the world’s population (53–55%) residing in urban areas [44]. In South Korea, however, this imbalance between metropolitan and provincial areas is particularly severe. Paradoxically, this very imbalance suggests that nationwide urban decline will manifest gradually rather than through abrupt collapse. The dense population cores of major metropolitan areas are likely to buffer the overall system from sudden demographic shocks, even as non-capital regions experience sharp contraction.
Taken together, these findings indicate that nationwide urban shrinkage in South Korea is projected to unfold as a stepwise weakening of urban functions across most municipalities rather than as a rapid breakdown. This gradual pattern underscores the need for differentiated strategies that account for the contrasting trajectories of metropolitan resilience and non-capital vulnerability.
4.3. The Equity Dimension and Social Implications of Urban Park Accessibility
The urban-park-deprived areas identified in this study represent not merely physical absences but are directly connected to issues of social equity. This aligns with prior studies observing that urban park accessibility is unevenly distributed according to socioeconomic factors such as income and age [29]. In other words, the shortage of urban parks may impose a greater burden on specific social groups. Inequalities in urban park accessibility are evident not only in terms of physical distance but also in differences in actual usage behavior. Previous research has reported marked variations in use frequency, purpose, and length of stay depending on demographic factors such as gender, age, and educational attainment [30]. These disparities may escalate into a more serious social problem in the future as population decline becomes more pronounced. In areas experiencing population decline, there is a high likelihood of poor urban park maintenance [15], directly leading to a deterioration in quality of life for vulnerable groups with a high dependence on urban parks, such as older adults or households with infants and young children, thereby intensifying the service imbalance. Grounded in this awareness, this study emphasizes the urgency of shifting toward qualitative management based on ‘selection and concentration.’ The past approach of quantitative expansion that supplied uniform services to all areas is no longer effective in an era of population decline and resource constraints. In conclusion, this study contributes originality by anticipating future population changes to proactively identify potential urban-park-deprived areas. This is significant in that it guides a qualitative transition of urban park services under limited resources and lays the groundwork for future-oriented policies that proactively respond to urban change.
5. Conclusions
This study established a quantitative and predictive framework to formulate sustainable restructuring strategies for urban parks in an era of population decline and super-aging. By integrating national future population projections, the DEGURBA classification, and network-based accessibility analysis, long-term changes in the “potential urban park user population” were projected at the granular level of individual urban parks. The primary contribution of this research lies in its translation of a macro-level demographic phenomenon into spatially explicit, micro-level implications for infrastructure management. The findings can directly inform statutory planning instruments in the South Korean context—such as the 20-year Urban Master Plan and the 10-year Park and Green Space Master Plan—while also holding significant international relevance. Nations across Europe and Japan, which are also confronting advanced stages of population decline and super-aging, face similar challenges in recalibrating urban infrastructure under constrained resources. The methodological framework proposed here is therefore not confined to a single national case but offers a generalizable and transferable approach for sustainability planning in regions undergoing comparable demographic transitions.
However, this study has several limitations that suggest avenues for future research. First, the projections were based on official scenarios from Statistics Korea; actual population dynamics may diverge due to future socioeconomic and environmental changes. Second, this study focused on the potential demand of the total population without incorporating qualitative aspects of demand, such as urban park quality, or the specific needs of user groups like the elderly. Furthermore, supply-side constraints, including urban planning regulations and institutional factors, were not fully accounted for.
Future research should therefore focus on establishing a more comprehensive framework to evaluate both the potential demand and the intrinsic value of individual urban parks. This would enable rational decision-making for maintaining core urban parks with high usage while converting low-usage parks to alternative functions such as community facilities, green infrastructure, or carbon sinks. Such an approach would facilitate the efficient reallocation of limited resources, contributing to urban park reorganization strategies that enhance urban resilience and sustainability.
In conclusion, the results underscore that in an era of anticipated population decline, sustainable urban policy must pursue the restructuring of infrastructure not through uniform retrenchment but through strategies that are differentiated and spatially attuned to the diverse trajectories of urban transformation and demographic change across regions.
Author Contributions
Conceptualization, D.K.; data curation, D.K. and S.J.; formal analysis, D.K. and Y.K.; investigation, D.K. and H.C.S.; methodology, D.K.; supervision, Y.K., H.C.S. and S.J.; validation, D.K. and Y.K.; visualization, D.K.; writing—original draft, D.K.; writing—review and editing, Y.K., H.C.S. and S.J. All authors have read and agreed to the published version of the manuscript.
Funding
This research received no external funding.
Data Availability Statement
The population data underlying this study are publicly available via KOSIS (Korean Statistical Information Service) operated by Statistics Korea through a keyword search for “future population projections” (https://kosis.kr/ (accessed on 28 August 2025)); the population grid data can be downloaded from Statistics Korea’s spatial information service SGIS (Statistical Geographic Information Service) (https://sgis.kostat.go.kr/ (accessed on 28 August 2025)); the urban park data were obtained from v-World (Digital-Twin National Land) operated by the Ministry of Land, Infrastructure, and Transport of the Republic of Korea by applying for the “spatial facilities (status)” dataset to secure urban park boundaries (https://www.vworld.kr/ (accessed on 28 August 2025)); and attribute information was obtained by applying for the “National Urban Park Information Standard Data” via the Public Data Portal of the Republic of Korea (https://www.data.go.kr/ (accessed on 28 August 2025)). The road network data were obtained from the KDTB (National Transport DB) of the Republic of Korea by applying for the nationwide road network (https://www.ktdb.go.kr/ (accessed on 28 August 2025)).
Acknowledgments
This research was supported by Basic Science Research Program through the National Research Foundation of Korea (NRF) funded by the Ministry of Education (RS-2021-NR060142).
Conflicts of Interest
The authors declare no conflicts of interest. The funders had no role in the design of the study; in the collection, analyses, or interpretation of data; in the writing of the manuscript; or in the decision to publish the results.
Appendix A
Table A1.
Scenario assumptions for future population projections.
Table A1.
Scenario assumptions for future population projections.
| Scenario Name | Assumption Levels | ||
|---|---|---|---|
| Total Fertility Rate Outlook (Persons) | Life Expectancy Outlook (Years) | Net International Migration Outlook (Thousand Persons) | |
| High-variant (maximum-population projection) | High | High | High |
| 2024: 0.70 2031: 1.03 2051: 1.34 | Male: 90.3 Female: 91.1 | 2030: 124 2072: 133 | |
| Medium-variant (baseline projection) | Medium | Medium | Medium |
| 2024: 0.65 2036: 1.02 2049: 1.08 | Male: 89.5 Female: 92.7 | 2022: 155 2030: 65 2072: 61 | |
| Low-variant (minimum-population projection) | Low | Low | Low |
| 2026: 0.59 2072: 0.82 | Male: 88.3 Female: 91.1 | 2030: 7 2072: 13 | |
Table A2.
Provincial-level future population projections (2022–2072) and change rates relative to the 2022 population.
Table A2.
Provincial-level future population projections (2022–2072) and change rates relative to the 2022 population.
| Region | Scenario | 2022 Population (Thousand Persons) | 2032 (Change vs. 2022%) | 2042 (Change vs. 2022%) | 2052 (Change vs. 2022%) | 2062 (Change vs. 2022%) | 2072 (Change vs. 2022%) |
|---|---|---|---|---|---|---|---|
| Seoul | High | 9421 | 9235 (−2.0%) | 9114 (−3.3%) | 8742 (−7.2%) | 8027 (−14.8%) | 7318 (−22.3%) |
| Medium | 9012 (−4.3%) | 8606 (−8.7%) | 7968 (−15.4%) | 7052 (−25.1%) | 6145 (−34.8%) | ||
| Low | 8807 (−6.5%) | 8127 (−13.7%) | 7245 (−23.1%) | 6158 (−34.6%) | 5097 (−45.9%) | ||
| Busan | High | 3303 | 3115 (−5.7%) | 2916 (−11.7%) | 2713 (−17.9%) | 2427 (−26.5%) | 2156 (−34.7%) |
| Medium | 3063 (−7.3%) | 2790 (−15.5%) | 2516 (−23.8%) | 2170 (−34.3%) | 1842 (−44.2%) | ||
| Low | 3014 (−8.7%) | 2668 (−19.2%) | 2327 (−29.6%) | 1926 (−41.7%) | 1554 (−53.0%) | ||
| Daegu | High | 2371 | 2247 (−5.3%) | 2116 (−10.8%) | 1978 (−16.6%) | 1777 (−25.0%) | 1586 (−33.1%) |
| Medium | 2208 (−6.9%) | 2023 (−14.7%) | 1833 (−22.7%) | 1588 (−33.1%) | 1354 (−42.9%) | ||
| Low | 2173 (−8.4%) | 1931 (−18.6%) | 1691 (−28.7%) | 1407 (−40.7%) | 1139 (−52.0%) | ||
| Incheon | High | 2975 | 3178 (6.8%) | 3277 (10.2%) | 3198 (7.5%) | 2996 (0.7%) | 2787 (−6.3%) |
| Medium | 3109 (4.5%) | 3108 (4.5%) | 2936 (−1.3%) | 2651 (−10.9%) | 2357 (−20.8%) | ||
| Low | 3044 (2.3%) | 2943 (−1.1%) | 2681 (−9.9%) | 2325 (−21.8%) | 1964 (−34.0%) | ||
| Gwang-ju | High | 1469 | 1416 (−3.6%) | 1369 (−6.8%) | 1297 (−11.7%) | 1179 (−19.8%) | 1064 (−27.6%) |
| Medium | 1386 (−5.7%) | 1298 (−11.7%) | 1189 (−19.1%) | 1042 (−29.1%) | 898 (−38.9%) | ||
| Low | 1356 (−7.7%) | 1226 (−16.6%) | 1080 (−26.5%) | 908 (−38.2%) | 744 (−49.4%) | ||
| Daejeon | High | 1472 | 1444 (−1.9%) | 1424 (−3.3%) | 1362 (−7.5%) | 1251 (−15.0%) | 1140 (−22.5%) |
| Medium | 1415 (−3.9%) | 1353 (−8.1%) | 1253 (−14.9%) | 1109 (−24.7%) | 966 (−34.4%) | ||
| Low | 1387 (−5.8%) | 1283 (−12.9%) | 1144 (−22.3%) | 972 (−34.0%) | 805 (−45.4%) | ||
| Ulsan | High | 1113 | 1055 (−5.2%) | 989 (−11.2%) | 924 (−17.0%) | 828 (−25.6%) | 737 (−33.8%) |
| Medium | 1035 (−7.0%) | 941 (−15.5%) | 850 (−23.6%) | 734 (−34.1%) | 624 (−43.9%) | ||
| Low | 1014 (−8.9%) | 892 (−19.9%) | 775 (−30.4%) | 643 (−42.3%) | 519 (−53.4%) | ||
| Sejong | High | 380 | 458 (20.5%) | 527 (38.6%) | 539 (41.9%) | 533 (40.3%) | 524 (37.8%) |
| Medium | 449 (18.1%) | 502 (32.0%) | 500 (31.6%) | 477 (25.5%) | 447 (17.7%) | ||
| Low | 441 (16.0%) | 476 (25.2%) | 458 (20.6%) | 419 (10.4%) | 374 (−1.6%) | ||
| Gyeonggi-do | High | 13689 | 4719 (7.5%) | 5284 (11.7%) | 4954 (9.2%) | 4042 (2.6%) | 3096 (−4.3%) |
| Medium | 4375 (5.0%) | 4455 (5.6%) | 3684 (−0.0%) | 2385 (−9.5%) | 1039 (−19.4%) | ||
| Low | 4050 (2.6%) | 3646 (−0.3%) | 2449 (−9.1%) | 10,820 (−21.0%) | 9161 (−33.1%) | ||
| Gangwon-do | High | 1527 | 1547 (1.3%) | 1579 (3.4%) | 1534 (0.5%) | 1435 (−6.0%) | 1333 (−12.7%) |
| Medium | 1519 (−0.6%) | 1509 (−1.2%) | 1423 (−6.8%) | 1283 (−16.0%) | 1139 (−25.4%) | ||
| Low | 1491 (−2.4%) | 1439 (−5.8%) | 1312 (−14.1%) | 1136 (−25.6%) | 958 (−37.3%) | ||
| Chungcheongbuk-do | High | 1634 | 1697 (3.9%) | 1754 (7.4%) | 1713 (4.9%) | 1608 (−1.5%) | 1499 (−8.2%) |
| Medium | 1660 (1.6%) | 1664 (1.8%) | 1575 (−3.6%) | 1425 (−12.8%) | 1270 (−22.3%) | ||
| Low | 1622 (−0.7%) | 1574 (−3.7%) | 1436 (−12.1%) | 1248 (−23.6%) | 1056 (−35.3%) | ||
| Chungcheongnam-do | High | 2186 | 2319 (6.1%) | 2399 (9.7%) | 2344 (7.2%) | 2201 (0.7%) | 2053 (−6.1%) |
| Medium | 2262 (3.5%) | 2269 (3.8%) | 2149 (−1.7%) | 1945 (−11.0%) | 1734 (−20.7%) | ||
| Low | 2207 (1.0%) | 2140 (−2.1%) | 1955 (−10.6%) | 1700 (−22.2%) | 1439 (−34.2%) | ||
| Jeollabuk-do | High | 1777 | 1708 (−3.9%) | 1657 (−6.8%) | 1573 (−11.5%) | 1436 (−19.2%) | 1301 (−26.8%) |
| Medium | 1675 (−5.7%) | 1578 (−11.2%) | 1452 (−18.3%) | 1277 (−28.1%) | 1106 (−37.8%) | ||
| Low | 1642 (−7.6%) | 1500 (−15.6%) | 1333 (−25.0%) | 1126 (−36.6%) | 927 (−47.9%) | ||
| Jeollanam-do | High | 1769 | 1720 (−2.8%) | 1691 (−4.4%) | 1616 (−8.6%) | 1487 (−15.9%) | 1358 (−23.2%) |
| Medium | 1684 (−4.8%) | 1609 (−9.0%) | 1492 (−15.6%) | 1323 (−25.2%) | 1155 (−34.7%) | ||
| Low | 1647 (−6.9%) | 1525 (−13.8%) | 1364 (−22.9%) | 1162 (−34.3%) | 964 (−45.5%) | ||
| Gyeongsangbuk-do | High | 2625 | 2552 (−2.8%) | 2486 (−5.3%) | 2362 (−10.0%) | 2158 (−17.8%) | 1958 (−25.4%) |
| Medium | 2501 (−4.7%) | 2368 (−9.8%) | 2182 (−16.9%) | 1921 (−26.8%) | 1666 (−36.5%) | ||
| Low | 2450 (−6.7%) | 2250 (−14.3%) | 2001 (−23.8%) | 1693 (−35.5%) | 1395 (−46.9%) | ||
| Gyeongsangnam-do | High | 3287 | 3161 (−3.8%) | 3019 (−8.2%) | 2840 (−13.6%) | 2572 (−21.8%) | 2313 (−29.6%) |
| Medium | 3102 (−5.6%) | 2883 (−12.3%) | 2633 (−19.9%) | 2298 (−30.1%) | 1975 (−39.9%) | ||
| Low | 3045 (−7.3%) | 2747 (−16.4%) | 2426 (−26.2%) | 2034 (−38.1%) | 1661 (−49.5%) | ||
| Jeju-do | High | 674 | 696 (3.1%) | 710 (5.2%) | 690 (2.3%) | 644 (−4.5%) | 597 (−11.5%) |
| Medium | 680 (0.8%) | 672 (−0.4%) | 632 (−6.3%) | 569 (−15.7%) | 504 (−25.3%) | ||
| Low | 664 (−1.6%) | 634 (−6.1%) | 574 (−14.9%) | 496 (−26.4%) | 417 (−38.1%) |
Table A3.
Provincial-level urban type transitions by scenario in 2072 relative to the base year (2022).
Table A3.
Provincial-level urban type transitions by scenario in 2072 relative to the base year (2022).
| Region | Urbanization Type | 2022 | 2072 (High Scenario) | 2072 (Medium Scenario) | 2072 (Low Scenario) | ||||||
|---|---|---|---|---|---|---|---|---|---|---|---|
| Units | Cities | Town | Rural | Cities | Town | Rural | Cities | Town | Rural | ||
| Seoul | Urban | 25 | 25 | 0 | 0 | 25 | 0 | 0 | 25 | 0 | 0 |
| Busan | Urban | 16 | 16 | 0 | 0 | 14 | 2 | 0 | 13 | 3 | 0 |
| Daegu | Urban | 8 | 8 | 0 | 0 | 8 | 0 | 0 | 8 | 0 | 0 |
| Rural | 1 | 0 | 0 | 1 | 0 | 0 | 1 | 0 | 0 | 1 | |
| Incheon | Urban | 7 | 7 | 0 | 0 | 7 | 0 | 0 | 7 | 0 | 0 |
| Semi-Urban | 1 | 1 | 0 | 0 | 1 | 0 | 0 | 0 | 1 | 0 | |
| Rural | 2 | 0 | 0 | 2 | 0 | 0 | 2 | 0 | 0 | 2 | |
| Gwangju | Urban | 5 | 5 | 0 | 0 | 5 | 0 | 0 | 5 | 0 | 0 |
| Daejeon | Urban | 5 | 5 | 0 | 0 | 5 | 0 | 0 | 5 | 0 | 0 |
| Ulsan | Urban | 4 | 4 | 0 | 0 | 4 | 0 | 0 | 4 | 0 | 0 |
| Semi-Urban | 1 | 0 | 1 | 0 | 0 | 1 | 0 | 0 | 1 | 0 | |
| Sejong | Urban | 1 | 1 | 0 | 0 | 1 | 0 | 0 | 1 | 0 | 0 |
| Gyeonggi-do | Urban | 38 | 38 | 0 | 0 | 37 | 1 | 0 | 35 | 3 | 0 |
| Semi-Urban | 3 | 0 | 3 | 0 | 0 | 3 | 0 | 0 | 3 | 0 | |
| Rural | 3 | 0 | 1 | 2 | 0 | 0 | 3 | 0 | 0 | 3 | |
| Gangwon-do | Urban | 4 | 4 | 0 | 0 | 4 | 0 | 0 | 3 | 1 | 0 |
| Semi-Urban | 4 | 0 | 3 | 1 | 0 | 3 | 1 | 0 | 3 | 1 | |
| Rural | 10 | 0 | 0 | 10 | 0 | 0 | 10 | 0 | 0 | 10 | |
| Chungcheongbuk-do | Urban | 6 | 6 | 0 | 0 | 6 | 0 | 0 | 6 | 0 | 0 |
| Semi-Urban | 4 | 0 | 4 | 0 | 0 | 4 | 0 | 0 | 3 | 1 | |
| Rural | 4 | 0 | 0 | 4 | 0 | 0 | 4 | 0 | 0 | 4 | |
| Chungcheongnam-do | Urban | 5 | 5 | 0 | 0 | 4 | 1 | 0 | 4 | 1 | 0 |
| Semi-Urban | 6 | 0 | 5 | 1 | 0 | 5 | 1 | 0 | 4 | 2 | |
| Rural | 5 | 0 | 0 | 5 | 0 | 0 | 5 | 0 | 0 | 5 | |
| Jeollabuk-do | Urban | 5 | 4 | 1 | 0 | 4 | 1 | 0 | 4 | 1 | 0 |
| Semi-Urban | 2 | 0 | 2 | 0 | 0 | 2 | 0 | 0 | 1 | 1 | |
| Rural | 8 | 0 | 0 | 8 | 0 | 0 | 8 | 0 | 0 | 8 | |
| Jeollanam-do | Urban | 4 | 4 | 0 | 0 | 4 | 0 | 0 | 3 | 0 | 1 |
| Semi-Urban | 3 | 0 | 3 | 0 | 0 | 3 | 0 | 0 | 3 | 0 | |
| Rural | 15 | 0 | 0 | 15 | 0 | 0 | 15 | 0 | 0 | 15 | |
| Gyeongsangbuk-do | Urban | 8 | 6 | 2 | 0 | 4 | 4 | 0 | 4 | 4 | 0 |
| Semi-Urban | 5 | 0 | 5 | 0 | 0 | 3 | 2 | 0 | 4 | 1 | |
| Rural | 10 | 0 | 0 | 10 | 0 | 0 | 10 | 0 | 0 | 10 | |
| Gyeongsangnam-do | Urban | 10 | 9 | 1 | 0 | 9 | 1 | 0 | 7 | 3 | 0 |
| Semi-Urban | 3 | 0 | 3 | 0 | 0 | 3 | 0 | 0 | 3 | 0 | |
| Rural | 9 | 0 | 1 | 8 | 0 | 0 | 9 | 0 | 0 | 9 | |
| Jeju-do | Urban | 1 | 1 | 0 | 0 | 1 | 0 | 0 | 1 | 0 | 0 |
| Semi-Urban | 1 | 0 | 1 | 0 | 0 | 1 | 0 | 0 | 0 | 1 | |
Table A4.
Summary of changes in population composition by urbanization type (2022 baseline vs. 2072).
Table A4.
Summary of changes in population composition by urbanization type (2022 baseline vs. 2072).
| Region | Urbanization Type | 2022 Population Share (%) | 2072 (High Scenario) | 2072 (Medium Scenario) | 2072 (Low Scenario) | |||
|---|---|---|---|---|---|---|---|---|
| Population Share (%) | Change | Population Share (%) | Change | Population Share (%) | Change | |||
| National | Urban | 79.68 | 77.04 | −2.64 | 75.75 | −3.93 | 73.49 | −6.19 |
| Semi-Urban | 11.53 | 13.47 | 1.94 | 14.08 | 2.55 | 15.69 | 4.16 | |
| Rural | 8.79 | 9.48 | 0.7 | 10.16 | 1.37 | 10.82 | 2.03 | |
| Seoul | Urban | 99.8 | 99.75 | −0.05 | 99.72 | −0.08 | 99.69 | −0.11 |
| Semi-Urban | 0.18 | 0.23 | 0.05 | 0.25 | 0.07 | 0.27 | 0.09 | |
| Rural | 0.02 | 0.03 | 0.01 | 0.03 | 0.01 | 0.04 | 0.02 | |
| Busan | Urban | 95.78 | 93.49 | −2.29 | 88.3 | −7.49 | 82.33 | −13.45 |
| Semi-Urban | 2.79 | 4.8 | 2 | 9.92 | 7.13 | 15.71 | 12.92 | |
| Rural | 1.42 | 1.72 | 0.29 | 1.78 | 0.36 | 1.95 | 0.53 | |
| Daegu | Urban | 90.6 | 87.07 | −3.53 | 86.35 | −4.25 | 85.93 | −4.66 |
| Semi-Urban | 7.23 | 10.01 | 2.78 | 10.63 | 3.4 | 10.94 | 3.71 | |
| Rural | 2.17 | 2.92 | 0.75 | 3.02 | 0.85 | 3.13 | 0.95 | |
| Incheon | Urban | 93.17 | 93.63 | 0.46 | 93.51 | 0.34 | 91.19 | −1.98 |
| Semi-Urban | 4.7 | 3.86 | −0.84 | 3.81 | −0.9 | 5.95 | 1.25 | |
| Rural | 2.13 | 2.51 | 0.38 | 2.69 | 0.56 | 2.86 | 0.73 | |
| Gwangju | Urban | 96.94 | 96.54 | −0.4 | 95.84 | −1.1 | 94.72 | −2.22 |
| Semi-Urban | 1.24 | 1.41 | 0.17 | 1.42 | 0.18 | 2.5 | 1.26 | |
| Rural | 1.82 | 2.05 | 0.23 | 2.74 | 0.92 | 2.78 | 0.95 | |
| Daejeon | Urban | 90.69 | 86.27 | −4.42 | 85.86 | −4.83 | 85.65 | −5.03 |
| Semi-Urban | 8.13 | 12.07 | 3.94 | 12.45 | 4.32 | 12.52 | 4.39 | |
| Rural | 1.18 | 1.66 | 0.48 | 1.69 | 0.51 | 1.83 | 0.65 | |
| Ulsan | Urban | 80.89 | 78.28 | −2.61 | 77.84 | −3.05 | 77.17 | −3.71 |
| Semi-Urban | 13.84 | 15.65 | 1.82 | 15.72 | 1.88 | 15.9 | 2.06 | |
| Rural | 5.28 | 6.07 | 0.79 | 6.44 | 1.17 | 6.93 | 1.65 | |
| Sejong | Urban | 75.2 | 87.69 | 12.49 | 87.69 | 12.49 | 75.22 | 0.01 |
| Semi-Urban | 15.31 | 4.44 | −10.87 | 4.19 | −11.12 | 15.31 | 0 | |
| Rural | 9.49 | 7.87 | −1.62 | 8.12 | −1.37 | 9.47 | −0.02 | |
| Gyeonggi-do | Urban | 84.44 | 82.79 | −1.65 | 81.65 | −2.79 | 79.31 | −5.13 |
| Semi-Urban | 10.69 | 12.18 | 1.48 | 12.56 | 1.87 | 14.29 | 3.59 | |
| Rural | 4.86 | 5.03 | 0.17 | 5.79 | 0.93 | 6.4 | 1.54 | |
| Gangwon-do | Urban | 48.88 | 49.61 | 0.73 | 49.62 | 0.74 | 43.73 | −5.15 |
| Semi-Urban | 25.75 | 23.05 | −2.69 | 21.98 | −3.76 | 26.58 | 0.83 | |
| Rural | 25.37 | 27.34 | 1.97 | 28.39 | 3.02 | 29.69 | 4.32 | |
| Chungcheongbuk-do | Urban | 53.56 | 52.65 | −0.91 | 52.55 | −1.02 | 52.24 | −1.32 |
| Semi-Urban | 27.47 | 27.31 | −0.16 | 27.01 | −0.46 | 27.06 | −0.41 | |
| Rural | 18.97 | 20.04 | 1.07 | 20.44 | 1.47 | 20.7 | 1.73 | |
| Chungcheongnam-do | Urban | 41.4 | 43.19 | 1.79 | 39.44 | −1.97 | 39.34 | −2.07 |
| Semi-Urban | 33.01 | 31.27 | −1.74 | 32.94 | −0.07 | 31.42 | −1.59 | |
| Rural | 25.59 | 25.54 | −0.05 | 27.63 | 2.03 | 29.25 | 3.66 | |
| Jeollabuk-do | Urban | 60.85 | 54.35 | −6.5 | 53.16 | −7.69 | 52 | −8.84 |
| Semi-Urban | 15.56 | 19.67 | 4.11 | 20.02 | 4.45 | 19.82 | 4.26 | |
| Rural | 23.59 | 25.98 | 2.4 | 26.82 | 3.24 | 28.17 | 4.58 | |
| Jeollanam-do | Urban | 44.01 | 33.59 | −10.42 | 32.54 | −11.47 | 32.12 | −11.89 |
| Semi-Urban | 22.55 | 29.01 | 6.46 | 29.36 | 6.81 | 28.24 | 5.69 | |
| Rural | 33.44 | 37.4 | 3.96 | 38.1 | 4.66 | 39.64 | 6.2 | |
| Gyeongsangbuk-do | Urban | 49.91 | 35.77 | −14.15 | 30.1 | −19.81 | 28.99 | −20.92 |
| Semi-Urban | 23.67 | 35.15 | 11.49 | 39.51 | 15.84 | 38.82 | 15.16 | |
| Rural | 26.42 | 29.08 | 2.66 | 30.39 | 3.97 | 32.19 | 5.76 | |
| Gyeongsangnam-do | Urban | 65.55 | 56.28 | −9.27 | 55.75 | −9.81 | 46.2 | −19.35 |
| Semi-Urban | 18.78 | 25.66 | 6.89 | 24.73 | 5.96 | 33.24 | 14.46 | |
| Rural | 15.67 | 18.06 | 2.39 | 19.52 | 3.85 | 20.56 | 4.89 | |
| Jeju-do | Urban | 44.01 | 42.55 | −1.46 | 42.28 | −1.74 | 40.9 | −3.11 |
| Semi-Urban | 38.62 | 37.63 | −0.99 | 35.3 | −3.32 | 33.76 | −4.86 | |
| Rural | 17.36 | 19.82 | 2.45 | 22.42 | 5.06 | 25.34 | 7.97 | |
Table A5.
Changes in shares by locational-context type of urban parks by province (2022–2072).
Table A5.
Changes in shares by locational-context type of urban parks by province (2022–2072).
| Region | Urbanization Type | 2022 Park Share (%) | 2072 (High Scenario) | 2072 (Medium Scenario) | 2072 (Low Scenario) | |||
|---|---|---|---|---|---|---|---|---|
| Park Share (%) | Change | Park Share (%) | Change | Park Share (%) | Change | |||
| National | Urban | 83.3 | 83.1 | −0.2 | 79.1 | −4.2 | 75 | −8.3 |
| Semi-Urban | 9.9 | 10.4 | 0.5 | 13.4 | 3.5 | 16.4 | 6.5 | |
| Rural | 6.8 | 6.5 | −0.3 | 7.5 | 0.7 | 8.5 | 1.7 | |
| Seoul | Urban | 100 | 100 | 0 | 100 | 0 | 100 | 0 |
| Busan | Urban | 100 | 100 | 0 | 79.7 | −20.3 | 59.9 | −40.1 |
| Semi-Urban | 0 | 0 | 0 | 20.3 | 20.3 | 40.1 | 40.1 | |
| Daegu | Urban | 98.9 | 98.9 | 0 | 98.9 | 0 | 98.9 | 0 |
| Rural | 1.1 | 1.1 | 0 | 1.1 | 0 | 1.1 | 0 | |
| Incheon | Urban | 83.7 | 99.1 | 15.4 | 99.1 | 15.4 | 83.7 | 0 |
| Semi-Urban | 15.4 | 0 | −15.4 | 0 | −15.4 | 15.4 | 0 | |
| Rural | 0.9 | 0.9 | 0 | 0.9 | 0 | 0.9 | 0 | |
| Gwangju | Urban | 100 | 100 | 0 | 100 | 0 | 100 | 0 |
| Daejeon | Urban | 100 | 100 | 0 | 100 | 0 | 100 | 0 |
| Ulsan | Urban | 69.9 | 69.9 | 0 | 69.9 | 0 | 69.9 | 0 |
| Semi-Urban | 30.1 | 30.1 | 0 | 30.1 | 0 | 30.1 | 0 | |
| Sejong | Urban | 100 | 100 | 0 | 100 | 0 | 100 | 0 |
| Gyeonggi-do | Urban | 95.1 | 95.1 | 0 | 93.5 | −1.6 | 90.1 | −5 |
| Semi-Urban | 3.3 | 3.9 | 0.6 | 5 | 1.7 | 8.3 | 5 | |
| Rural | 1.6 | 1 | −0.6 | 1.6 | 0 | 1.6 | 0 | |
| Gangwon-do | Urban | 55.5 | 55.5 | 0 | 55.5 | 0 | 52 | −3.5 |
| Semi-Urban | 14.3 | 12.5 | −1.8 | 12.5 | −1.8 | 15.9 | 1.6 | |
| Rural | 30.3 | 32 | 1.7 | 32 | 1.7 | 32 | 1.7 | |
| Chungcheongbuk-do | Urban | 68.1 | 68.1 | 0 | 68.1 | 0 | 68.1 | 0 |
| Semi-Urban | 24.5 | 24.5 | 0 | 24.5 | 0 | 21.9 | −2.6 | |
| Rural | 7.4 | 7.4 | 0 | 7.4 | 0 | 10 | 2.6 | |
| Chungcheongnam-do | Urban | 64.4 | 64.4 | 0 | 52.5 | −11.9 | 52.5 | −11.9 |
| Semi-Urban | 23 | 22.1 | −0.9 | 34.1 | 11.1 | 28.7 | 5.7 | |
| Rural | 12.6 | 13.5 | 0.9 | 13.5 | 0.9 | 18.8 | 6.2 | |
| Jeollabuk-do | Urban | 71.1 | 66 | −5.1 | 66 | −5.1 | 66 | −5.1 |
| Semi-Urban | 13.1 | 18.2 | 5.1 | 18.2 | 5.1 | 8.7 | −4.4 | |
| Rural | 15.8 | 15.8 | 0 | 15.8 | 0 | 25.3 | 9.5 | |
| Jeollanam-do | Urban | 45.3 | 45.3 | 0 | 45.3 | 0 | 40.8 | −4.5 |
| Semi-Urban | 24.1 | 24.1 | 0 | 24.1 | 0 | 24.1 | 0 | |
| Rural | 30.6 | 30.6 | 0 | 30.6 | 0 | 35.1 | 4.5 | |
| Gyeongsangbuk-do | Urban | 70.6 | 62.3 | −8.3 | 36.6 | −34 | 36.6 | −34 |
| Semi-Urban | 18.1 | 26.4 | 8.3 | 44.4 | 26.3 | 48.1 | 30 | |
| Rural | 11.3 | 11.3 | 0 | 19 | 7.7 | 15.3 | 4 | |
| Gyeongsangnam-do | Urban | 73.7 | 70.7 | −3 | 70.7 | −3 | 57.6 | −16.1 |
| Semi-Urban | 12.4 | 18.5 | 6.1 | 15.4 | 3 | 28.5 | 16.1 | |
| Rural | 13.9 | 10.7 | −3.2 | 13.9 | 0 | 13.9 | 0 | |
| Jeju-do | Urban | 71.9 | 71.9 | 0 | 71.9 | 0 | 71.9 | 0 |
| Semi-Urban | 28.1 | 28.1 | 0 | 28.1 | 0 | 28.1 | 0 | |
Table A6.
Scenario-based changes in the potential user population of living-zone parks (2022–2072).
Table A6.
Scenario-based changes in the potential user population of living-zone parks (2022–2072).
| Provincial | Scenario | 2022 Population (Thousand Persons) | 2032 (Change vs. 2022%) | 2042 (Change vs. 2022%) | 2052 (Change vs. 2022%) | 2062 (Change vs. 2022%) | 2072 (Change vs. 2022%) |
|---|---|---|---|---|---|---|---|
| Seoul | High | 9211 | 8812 (−4.3%) | 8416 (−8.6%) | 7792 (−15.4%) | 6897 (−25.1%) | 6010 (−34.8%) |
| Medium | 8611 (−6.5%) | 7947 (−13.7%) | 7085 (−23.1%) | 6022 (−34.6%) | 4985 (−45.9%) | ||
| Low | 9030 (−2.0%) | 8913 (−3.2%) | 8549 (−7.2%) | 7850 (−14.8%) | 7157 (−22.3%) | ||
| Busan | High | 2970 | 2805 (−5.5%) | 2626 (−11.6%) | 2443 (−17.7%) | 2186 (−26.4%) | 1942 (−34.6%) |
| Medium | 2758 (−7.1%) | 2513 (−15.4%) | 2267 (−23.7%) | 1955 (−34.2%) | 1660 (−44.1%) | ||
| Low | 2714 (−8.6%) | 2403 (−19.1%) | 2096 (−29.4%) | 1735 (−41.6%) | 1400 (−52.9%) | ||
| Daegu | High | 2266 | 2146 (−5.3%) | 2020 (−10.9%) | 1888 (−16.7%) | 1696 (−25.2%) | 1513 (−33.2%) |
| Medium | 2109 (−7.0%) | 1931 (−14.8%) | 1749 (−22.8%) | 1515 (−33.2%) | 1291 (−43.0%) | ||
| Low | 2075 (−8.4%) | 1843 (−18.7%) | 1614 (−28.8%) | 1342 (−40.8%) | 1087 (−52.0%) | ||
| Incheon | High | 2753 | 2929 (+6.4%) | 3010 (+9.3%) | 2932 (+6.5%) | 2743 (−0.4%) | 2547 (−7.5%) |
| Medium | 2865 (+4.1%) | 2854 (+3.7%) | 2692 (−2.2%) | 2427 (−11.8%) | 2154 (−21.7%) | ||
| Low | 2805 (+1.9%) | 2703 (−1.8%) | 2459 (−10.7%) | 2129 (−22.7%) | 1795 (−34.8%) | ||
| Gwangju | High | 1419 | 1369 (−3.6%) | 1323 (−6.8%) | 1254 (−11.6%) | 1140 (−19.7%) | 1029 (−27.5%) |
| Medium | 1340 (−5.6%) | 1255 (−11.6%) | 1150 (−19.0%) | 1007 (−29.0%) | 869 (−38.8%) | ||
| Low | 1311 (−7.6%) | 1185 (−16.5%) | 1044 (−26.5%) | 878 (−38.1%) | 719 (−49.3%) | ||
| Daejeon | High | 1406 | 1377 (−2.1%) | 1358 (−3.4%) | 1299 (−7.6%) | 1193 (−15.2%) | 1087 (−22.7%) |
| Medium | 1350 (−4.0%) | 1290 (−8.2%) | 1195 (−15.0%) | 1057 (−24.8%) | 921 (−34.5%) | ||
| Low | 1323 (−5.9%) | 1224 (−13.0%) | 1091 (−22.4%) | 927 (−34.1%) | 767 (−45.4%) | ||
| Ulsan | High | 990 | 936 (−5.5%) | 875 (−11.6%) | 817 (−17.5%) | 731 (−26.2%) | 650 (−34.4%) |
| Medium | 918 (−7.2%) | 833 (−15.9%) | 752 (−24.1%) | 648 (−34.5%) | 550 (−44.4%) | ||
| Low | 900 (−9.1%) | 790 (−20.3%) | 685 (−30.8%) | 568 (−42.7%) | 458 (−53.8%) | ||
| Sejong | High | 335 | 404 (+20.5%) | 465 (+38.6%) | 476 (+41.9%) | 470 (+40.3%) | 462 (+37.8%) |
| Medium | 396 (+18.1%) | 443 (+32.0%) | 441 (+31.6%) | 421 (+25.4%) | 395 (+17.7%) | ||
| Low | 389 (+16.0%) | 420 (+25.2%) | 404 (+20.6%) | 370 (+10.4%) | 330 (−1.6%) | ||
| Gyeonggi-do | High | 12119 | 12977 (+7.1%) | 13,441 (+10.9%) | 13,136 (+8.4%) | 12321 (+1.7%) | 11477 (−5.3%) |
| Medium | 12674 (+4.6%) | 12712 (+4.9%) | 12020 (−0.8%) | 10,867 (−10.3%) | 9675 (−20.2%) | ||
| Low | 12387 (+2.2%) | 12000 (−1.0%) | 10,935 (−9.8%) | 9493 (−21.7%) | 8029 (−33.7%) | ||
| Gangwon-do | High | 1089 | 1106 (+1.5%) | 1128 (+3.6%) | 1096 (+0.6%) | 1024 (−6.0%) | 951 (−12.7%) |
| Medium | 1086 (−0.3%) | 1078 (−1.0%) | 1016 (−6.7%) | 916 (−15.9%) | 813 (−25.4%) | ||
| Low | 1065 (−2.2%) | 1028 (−5.6%) | 937 (−14.0%) | 811 (−25.6%) | 683 (−37.3%) | ||
| Chungcheongbuk-do | High | 1270 | 1320 (+3.9%) | 1361 (+7.2%) | 1328 (+4.6%) | 1246 (−1.9%) | 1160 (−8.7%) |
| Medium | 1291 (+1.6%) | 1291 (+1.7%) | 1221 (−3.8%) | 1104 (−13.1%) | 982 (−22.7%) | ||
| Low | 1261 (−0.7%) | 1221 (−3.8%) | 1114 (−12.3%) | 967 (−23.9%) | 817 (−35.7%) | ||
| Chungcheongnam-do | High | 1483 | 1585 (+6.9%) | 1640 (+10.6%) | 1603 (+8.1%) | 1506 (+1.5%) | 1404 (−5.3%) |
| Medium | 1546 (+4.2%) | 1552 (+4.6%) | 1470 (−0.9%) | 1331 (−10.3%) | 1186 (−20.0%) | ||
| Low | 1508 (+1.7%) | 1463 (−1.3%) | 1337 (−9.8%) | 1163 (−21.6%) | 984 (−33.6%) | ||
| Jeollabuk-do | High | 1297 | 1239 (−4.5%) | 1195 (−7.9%) | 1131 (−12.8%) | 1029 (−20.6%) | 930 (−28.3%) |
| Medium | 1215 (−6.3%) | 1138 (−12.2%) | 1044 (−19.5%) | 916 (−29.4%) | 791 (−39.0%) | ||
| Low | 1191 (−8.2%) | 1082 (−16.6%) | 959 (−26.0%) | 808 (−37.7%) | 662 (−48.9%) | ||
| Jeollanam-do | High | 1064 | 1030 (−3.2%) | 1004 (−5.6%) | 956 (−10.2%) | 875 (−17.7%) | 796 (−25.2%) |
| Medium | 1009 (−5.2%) | 956 (−10.1%) | 882 (−17.0%) | 779 (−26.8%) | 677 (−36.4%) | ||
| Low | 986 (−7.2%) | 906 (−14.8%) | 807 (−24.1%) | 684 (−35.7%) | 565 (−46.9%) | ||
| Gyeongsangbuk-do | High | 1810 | 1755 (−3.0%) | 1699 (−6.1%) | 1610 (−11.0%) | 1467 (−18.9%) | 1327 (−26.6%) |
| Medium | 1720 (−4.9%) | 1619 (−10.5%) | 1487 (−17.8%) | 1306 (−27.8%) | 1129 (−37.6%) | ||
| Low | 1685 (−6.9%) | 1538 (−15.0%) | 1364 (−24.6%) | 1151 (−36.4%) | 945 (−47.8%) | ||
| Gyeongsangnam-do | High | 2508 | 2421 (−3.5%) | 2305 (−8.1%) | 2165 (−13.7%) | 1957 (−22.0%) | 1757 (−30.0%) |
| Medium | 2375 (−5.3%) | 2201 (−12.2%) | 2007 (−20.0%) | 1749 (−30.3%) | 1500 (−40.2%) | ||
| Low | 2332 (−7.0%) | 2097 (−16.4%) | 1849 (−26.3%) | 1548 (−38.3%) | 1261 (−49.7%) | ||
| Jeju-do | High | 427 | 440 (+3.0%) | 449 (+5.0%) | 436 (+2.1%) | 407 (−4.8%) | 377 (−11.8%) |
| Medium | 430 (+0.6%) | 425 (−0.6%) | 400 (−6.5%) | 359 (−15.9%) | 318 (−25.6%) | ||
| Low | 420 (−1.7%) | 401 (−6.3%) | 363 (−15.1%) | 313 (−26.7%) | 264 (−38.3%) |
Table A7.
Scenario-based changes in the potential user population of theme parks (2022–2072).
Table A7.
Scenario-based changes in the potential user population of theme parks (2022–2072).
| Provincial | Scenario | 2022 Population (Thousand Persons) | 2032 (Change vs. 2022%) | 2042 (Change vs. 2022%) | 2052 (Change vs. 2022%) | 2062 (Change vs. 2022%) | 2072 (Change vs. 2022%) |
|---|---|---|---|---|---|---|---|
| Seoul | High | 9392 | 9208 (−2.0%) | 9089 (−3.2%) | 8718 (−7.2%) | 8005 (−14.8%) | 7299 (−22.3%) |
| Medium | 8986 (−4.3%) | 8582 (−8.6%) | 7947 (−15.4%) | 7033 (−25.1%) | 6129 (−34.7%) | ||
| Low | 8782 (−6.5%) | 8105 (−13.7%) | 7226 (−23.1%) | 6141 (−34.6%) | 5084 (−45.9%) | ||
| Busan | High | 3226 | 3045 (−5.6%) | 2850 (−11.7%) | 2652 (−17.8%) | 2372 (−26.5%) | 2107 (−34.7%) |
| Medium | 2994 (−7.2%) | 2727 (−15.5%) | 2460 (−23.7%) | 2121 (−34.2%) | 1801 (−44.2%) | ||
| Low | 2946 (−8.7%) | 2608 (−19.2%) | 2274 (−29.5%) | 1883 (−41.6%) | 1519 (−52.9%) | ||
| Daegu | High | 2376 | 2252 (−5.2%) | 2122 (−10.7%) | 1985 (−16.5%) | 1784 (−24.9%) | 1593 (−33.0%) |
| Medium | 2213 (−6.9%) | 2029 (−14.6%) | 1839 (−22.6%) | 1594 (−32.9%) | 1359 (−42.8%) | ||
| Low | 2178 (−8.3%) | 1937 (−18.5%) | 1697 (−28.6%) | 1412 (−40.6%) | 1144 (−51.8%) | ||
| Incheon | High | 2917 | 3113 (+6.7%) | 3205 (+9.9%) | 3125 (+7.1%) | 2925 (+0.3%) | 2719 (−6.8%) |
| Medium | 3046 (+4.4%) | 3040 (+4.2%) | 2869 (−1.6%) | 2589 (−11.3%) | 2300 (−21.2%) | ||
| Low | 2982 (+2.2%) | 2879 (−1.3%) | 2621 (−10.2%) | 2270 (−22.2%) | 1916 (−34.3%) | ||
| Gwangju | High | 1467 | 1414 (−3.6%) | 1367 (−6.8%) | 1296 (−11.7%) | 1177 (−19.8%) | 1062 (−27.6%) |
| Medium | 1384 (−5.6%) | 1296 (−11.7%) | 1188 (−19.0%) | 1041 (−29.1%) | 897 (−38.8%) | ||
| Low | 1355 (−7.7%) | 1224 (−16.6%) | 1078 (−26.5%) | 907 (−38.2%) | 743 (−49.4%) | ||
| Daejeon | High | 1471 | 1443 (−1.9%) | 1423 (−3.3%) | 1361 (−7.5%) | 1250 (−15.0%) | 1140 (−22.5%) |
| Medium | 1414 (−3.9%) | 1352 (−8.1%) | 1252 (−14.9%) | 1108 (−24.7%) | 966 (−34.4%) | ||
| Low | 1386 (−5.8%) | 1282 (−12.9%) | 1143 (−22.3%) | 971 (−34.0%) | 804 (−45.4%) | ||
| Ulsan | High | 1098 | 1041 (−5.2%) | 975 (−11.2%) | 911 (−17.1%) | 816 (−25.7%) | 726 (−33.9%) |
| Medium | 1021 (−7.0%) | 928 (−15.5%) | 838 (−23.7%) | 723 (−34.1%) | 615 (−44.0%) | ||
| Low | 1000 (−8.9%) | 880 (−19.9%) | 764 (−30.4%) | 633 (−42.3%) | 511 (−53.4%) | ||
| Sejong | High | 378 | 456 (+20.5%) | 524 (+38.6%) | 537 (+41.9%) | 531 (+40.3%) | 521 (+37.8%) |
| Medium | 447 (+18.1%) | 500 (+32.0%) | 498 (+31.6%) | 475 (+25.4%) | 445 (+17.7%) | ||
| Low | 439 (+16.0%) | 474 (+25.2%) | 456 (+20.6%) | 418 (+10.4%) | 372 (−1.6%) | ||
| Gyeonggi-do | High | 13,659 | 14,681 (+7.5%) | 15,241 (+11.6%) | 14,911 (+9.2%) | 14,000 (+2.5%) | 13,055 (−4.4%) |
| Medium | 14,338 (+5.0%) | 14,414 (+5.5%) | 13,644 (−0.1%) | 12348 (−9.6%) | 11004 (−19.4%) | ||
| Low | 14,014 (+2.6%) | 13,608 (−0.4%) | 12412 (−9.1%) | 10,787 (−21.0%) | 9133 (−33.1%) | ||
| Gangwon-do | High | 1258 | 1272 (+1.1%) | 1295 (+3.0%) | 1257 (−0.1%) | 1174 (−6.7%) | 1089 (−13.4%) |
| Medium | 1249 (−0.7%) | 1238 (−1.6%) | 1166 (−7.3%) | 1050 (−16.5%) | 931 (−26.0%) | ||
| Low | 1226 (−2.6%) | 1180 (−6.2%) | 1074 (−14.6%) | 929 (−26.1%) | 782 (−37.8%) | ||
| Chungcheongbuk-do | High | 1497 | 1557 (+4.0%) | 1608 (+7.4%) | 1570 (+4.9%) | 1474 (−1.6%) | 1373 (−8.3%) |
| Medium | 1522 (+1.7%) | 1525 (+1.9%) | 1444 (−3.6%) | 1306 (−12.8%) | 1163 (−22.3%) | ||
| Low | 1488 (−0.6%) | 1443 (−3.6%) | 1316 (−12.1%) | 1143 (−23.6%) | 967 (−35.4%) | ||
| Chungcheongnam-do | High | 1909 | 2041 (+6.9%) | 2112 (+10.6%) | 2063 (+8.1%) | 1937 (+1.5%) | 1806 (−5.4%) |
| Medium | 1991 (+4.3%) | 1997 (+4.6%) | 1891 (−0.9%) | 1712 (−10.3%) | 1525 (−20.1%) | ||
| Low | 1943 (+1.7%) | 1884 (−1.3%) | 1721 (−9.9%) | 1496 (−21.7%) | 1266 (−33.7%) | ||
| Jeollabuk-do | High | 1330 | 1278 (−3.9%) | 1239 (−6.8%) | 1177 (−11.5%) | 1074 (−19.3%) | 973 (−26.9%) |
| Medium | 1253 (−5.7%) | 1180 (−11.2%) | 1086 (−18.3%) | 955 (−28.2%) | 827 (−37.8%) | ||
| Low | 1229 (−7.6%) | 1122 (−15.6%) | 997 (−25.0%) | 842 (−36.7%) | 693 (−47.9%) | ||
| Jeollanam-do | High | 1435 | 1396 (−2.7%) | 1369 (−4.6%) | 1307 (−8.9%) | 1200 (−16.4%) | 1095 (−23.7%) |
| Medium | 1367 (−4.7%) | 1303 (−9.2%) | 1207 (−15.9%) | 1068 (−25.6%) | 931 (−35.1%) | ||
| Low | 1337 (−6.8%) | 1235 (−13.9%) | 1103 (−23.1%) | 938 (−34.6%) | 777 (−45.9%) | ||
| Gyeongsangbuk-do | High | 2181 | 2118 (−2.9%) | 2055 (−5.8%) | 1949 (−10.6%) | 1778 (−18.5%) | 1610 (−26.2%) |
| Medium | 2076 (−4.9%) | 1958 (−10.3%) | 1800 (−17.5%) | 1583 (−27.4%) | 1370 (−37.2%) | ||
| Low | 2033 (−6.8%) | 1860 (−14.7%) | 1652 (−24.3%) | 1394 (−36.1%) | 1147 (−47.4%) | ||
| Gyeongsangnam-do | High | 3090 | 2975 (−3.7%) | 2839 (−8.1%) | 2669 (−13.6%) | 2416 (−21.8%) | 2172 (−29.7%) |
| Medium | 2920 (−5.5%) | 2711 (−12.3%) | 2474 (−19.9%) | 2159 (−30.1%) | 1855 (−40.0%) | ||
| Low | 2866 (−7.2%) | 2583 (−16.4%) | 2280 (−26.2%) | 1910 (−38.2%) | 1559 (−49.5%) | ||
| Jeju-do | High | 599 | 617 (+3.1%) | 630 (+5.1%) | 612 (+2.2%) | 571 (−4.6%) | 529 (−11.6%) |
| Medium | 603 (+0.7%) | 596 (−0.5%) | 561 (−6.4%) | 504 (−15.8%) | 447 (−25.4%) | ||
| Low | 589 (−1.7%) | 562 (−6.1%) | 509 (−15.0%) | 440 (−26.5%) | 370 (−38.2%) |
References
- Ministry of the Interior and Safety Percentage of the Population Aged 65 and over Reaches 20%|Ministry of the Interior and Safety> News—News > Press Releases > Press Releases. Available online: https://www.mois.go.kr/frt/bbs/type010/commonSelectBoardArticle.do?bbsId=BBSMSTR_000000000008&nttId=114622 (accessed on 15 August 2025).
- Ezeh, A.C.; Bongaarts, J.; Mberu, B. Global Population Trends and Policy Options. Lancet 2012, 380, 142–148. [Google Scholar] [CrossRef] [PubMed]
- Bhattacharjee, N.V.; Schumacher, A.E.; Aali, A.; Abate, Y.H.; Abbasgholizadeh, R.; Abbasian, M.; Abbasi-Kangevari, M.; Abbastabar, H.; Abd ElHafeez, S.; Abd-Elsalam, S.; et al. Global Fertility in 204 Countries and Territories, 1950–2021, with Forecasts to 2100: A Comprehensive Demographic Analysis for the Global Burden of Disease Study 2021. Lancet 2024, 403, 2057–2099. [Google Scholar] [CrossRef] [PubMed]
- Wolff, M.; Wiechmann, T. Urban Growth and Decline: Europe’s Shrinking Cities in a Comparative Perspective 1990–2010. Eur. Urban Reg. Stud. 2018, 25, 122–139. [Google Scholar] [CrossRef]
- Martinez-Fernandez, C.; Weyman, T.; Fol, S.; Audirac, I.; Cunningham-Sabot, E.; Wiechmann, T.; Yahagi, H. Shrinking Cities in Australia, Japan, Europe and the USA: From a Global Process to Local Policy Responses. Prog. Plan. 2016, 105, 1–48. [Google Scholar] [CrossRef]
- Hartt, M. The Diversity of North American Shrinking Cities. Urban Stud. 2018, 55, 2946–2959. [Google Scholar] [CrossRef]
- Wiechmann, T.; Pallagst, K.M. Urban Shrinkage in Germany and the USA: A Comparison of Transformation Patterns and Local Strategies. Int. J. Urban Reg. Res. 2012, 36, 261–280. [Google Scholar] [CrossRef]
- Statistics Korea. Population Projections for Korea: 2022–2072 (Based on the 2022 Population Census), Statistics Korea: Daejeon, Republic of Korea, 2024.
- National Registration Demographics Ministry of Internal Affairs and Security. Available online: https://jumin.mois.go.kr (accessed on 15 August 2025).
- View by Indicator|KOSIS Korea in the World. Available online: https://kosis.kr/visual/koreaInWorld/korInWorldJipyoIndex.do?lang=ko (accessed on 15 August 2025).
- Lauf, S.; Haase, D.; Kleinschmit, B. The Effects of Growth, Shrinkage, Population Aging and Preference Shifts on Urban Development—A Spatial Scenario Analysis of Berlin, Germany. Land Use Policy 2016, 52, 240–254. [Google Scholar] [CrossRef]
- Jarzebski, M.P.; Elmqvist, T.; Gasparatos, A.; Fukushi, K.; Eckersten, S.; Haase, D.; Goodness, J.; Khoshkar, S.; Saito, O.; Takeuchi, K.; et al. Ageing and Population Shrinking: Implications for Sustainability in the Urban Century. NPJ Urban Sustain. 2021, 1, 17. [Google Scholar] [CrossRef]
- Carbonaro, G.; Leanza, E.; McCann, P.; Medda, F. Demographic Decline, Population Aging, and Modern Financial Approaches to Urban Policy. Int. Reg. Sci. Rev. 2018, 41, 210–232. [Google Scholar] [CrossRef]
- xizi, X.; Fumihiko, S.; Noriko, A.; Kai, Z. The Implications of Population Decline and Fiscal Austerity on Public Nature: Insights From the Evolution of Urban Park Management System in Japan. Landsc. Archit. Front. 2024, 12, 8. [Google Scholar] [CrossRef]
- Ando, Y.; Takada, H.; Suzuki, K.; Ichimura, K. A Study on Local Residents’ Consciousness of Maintenance, Management and Reorganization of Urban Park in Muroran, a Local City. J. Jpn. Inst. Landsc. Archit. 2023, 86, 505–510. [Google Scholar] [CrossRef]
- Kailash, G.; Chitra, M.B. Transforming Urban Neglected Spaces: The Role of Adaptive Reuse and Nature-Based Solutions. Int. Res. J. Multidiscip. Scope 2025, 06, 1027–1050. [Google Scholar] [CrossRef]
- Lima, M.F.; Ward Thompson, C.; Aspinall, P. Friendly Communities and Outdoor Spaces in Contexts of Urban Population Decline. Land 2020, 9, 439. [Google Scholar] [CrossRef]
- Rupprecht, C.D.D. Informal Urban Green Space: Residents’ Perception, Use, and Management Preferences across Four Major Japanese Shrinking Cities. Land 2017, 6, 59. [Google Scholar] [CrossRef]
- Korean Law Information Center|Law Search. Available online: https://www.law.go.kr/LSW/eng/engLsSc.do?menuId=2§ion=lawNm&query=park&x=0&y=0#liBgcolor0 (accessed on 25 September 2025).
- Choi, J.; Kim, G. History of Seoul’s Parks and Green Space Policies: Focusing on Policy Changes in Urban Development. Land 2022, 11, 474. [Google Scholar] [CrossRef]
- Oh, C.S. Institutional Changes to Long-Term Unexecuted Urban Parks in South Korea-from 1967 to the Present Day. Urban For. Urban Green. 2019, 46, 126447. [Google Scholar] [CrossRef]
- Boulton, C.; Dedekorkut-Howes, A.; Byrne, J. Factors Shaping Urban Greenspace Provision: A Systematic Review of the Literature. Landsc. Urban Plan. 2018, 178, 82–101. [Google Scholar] [CrossRef]
- Guo, S.; Yang, G.; Pei, T.; Ma, T.; Song, C.; Shu, H.; Du, Y.; Zhou, C. Analysis of Factors Affecting Urban Park Service Area in Beijing: Perspectives from Multi-Source Geographic Data. Landsc. Urban Plan. 2019, 181, 103–117. [Google Scholar] [CrossRef]
- Zhang, R.; Peng, S.; Sun, F.; Deng, L.; Che, Y. Assessing the Social Equity of Urban Parks: An Improved Index Integrating Multiple Quality Dimensions and Service Accessibility. Cities 2022, 129, 103839. [Google Scholar] [CrossRef]
- Zhang, D.; Ma, S.; Fan, J.; Xie, D.; Jiang, H.; Wang, G. Assessing Spatial Equity in Urban Park Accessibility: An Improve Two-Step Catchment Area Method from the Perspective of 15-Mintue City Concept. Sustain. Cities Soc. 2023, 98, 104824. [Google Scholar] [CrossRef]
- Lee, H.-S. Developing and Testing the Senior Park Environment Assessment in Korea (SPEAK) Audit Tool. Landsc. Urban Plan. 2022, 227, 104545. [Google Scholar] [CrossRef]
- Yu, S.; Zeng, P.; Xie, X.; Chen, D. Equitable Evaluation of Supply-Demand and Layout Optimization of Urban Park Green Space in High-Density Linear Large City. PLoS ONE 2024, 19, e0310015. [Google Scholar] [CrossRef]
- Moreno, C.; Allam, Z.; Chabaud, D.; Gall, C.; Pratlong, F. Introducing the “15-Minute City”: Sustainability, Resilience and Place Identity in Future Post-Pandemic Cities. Smart Cities 2021, 4, 93–111. [Google Scholar] [CrossRef]
- Heo, S.; Nori-Sarma, A.; Kim, S.; Lee, J.-T.; Bell, M.L. Do Persons with Low Socioeconomic Status Have Less Access to Greenspace? Application of Accessibility Index to Urban Parks in Seoul, South Korea. Environ. Res. Lett. 2021, 16, 084027. [Google Scholar] [CrossRef]
- Ma, Y.; Brindley, P.; Lange, E. The Influence of Socio-Demographic Factors on Preference and Park Usage in Guangzhou, China. Land 2022, 11, 1219. [Google Scholar] [CrossRef]
- Lee, Y.; Lee, B.; Oh, C.; Lee, H.; Kim, S. Developing Interactive Land Monitoring Reports for Communications Using Geospatial Dashboard; Korea Land Institute: Sejong, Republic of Korea, 2019. [Google Scholar]
- Jeon, Y.; Jung, S. Spatial Equity of Urban Park Distribution: Examining the Floating Population within Urban Park Catchment Areas in the Context of the 15-Minute City. Land 2024, 13, 24. [Google Scholar] [CrossRef]
- Song, L.; Kong, X.; Cheng, P. Supply-Demand Matching Assessment of the Public Service Facilities in 15-Minute Community Life Circle Based on Residents’ Behaviors. Cities 2024, 144, 104637. [Google Scholar] [CrossRef]
- Cen, L.; Xiao, Y. Assessing Urban Park Accessibility via Population Projections: Planning for Green Equity in Shanghai. Land 2025, 14, 1580. [Google Scholar] [CrossRef]
- Kong, X.; Sun, Y.; Xu, C. Effects of Urbanization on the Dynamics and Equity of Access to Urban Parks from 2000 to 2015 in Beijing, China. Forests 2021, 12, 1796. [Google Scholar] [CrossRef]
- Chen, J.; Li, H.; Luo, S.; Xie, J.; Su, D.; Kinoshita, T. Rethinking Urban Park Accessibility in the Context of Demographic Change: A Population Structure Perspective. Urban For. Urban Green. 2024, 96, 128334. [Google Scholar] [CrossRef]
- Lu, J.; Li, L.; Wang, W. Assessing Accessibility and Environmental Equity in the Context of Sustained Aging: Pathways for Age-Friendly Urban Park Planning. Urban For. Urban Green. 2025, 108, 128768. [Google Scholar] [CrossRef]
- Wang, X.; Meng, X.; Long, Y. Projecting 1 Km-Grid Population Distributions from 2020 to 2100 Globally under Shared Socioeconomic Pathways. Sci. Data 2022, 9, 563. [Google Scholar] [CrossRef]
- Lee, B.; Jang, Y.; Jeong, Y.; Hong, S.; Kim, D. A Study on Small Area Population Forecast Model with Artificial Intelligence; Korea Research Institute for Human Settlements: Sejong, Republic of Korea, 2022; Available online: https://www.krihs.re.kr/galleryPdfView.es?bid=0029&list_no=32150&seq=1 (accessed on 25 April 2025).
- Statistics Korea, Social Statistics Bureau, Population Trends Division. Methodology and Assumptions for Population Projections (For Users); Statistics Korea: Daejeon, Republic of Korea, 2023; Available online: https://www.k-stat.go.kr/comb100/file-download?fileDnKey=JYq53VQcu4sIq8wasxJxsIqygLVH6%2BFeHveR9898Y8w%3D (accessed on 22 April 2025).
- Eurostat (European Commission). Applying the Degree of Urbanisation: A Methodological Manual to Define Cities, Towns and Rural Areas for International Comparisons, 2021th ed.; Publications Office of the European Union: Luxembourg, 2021; ISBN 978-92-76-20306-3. [Google Scholar]
- Demographics and Density. Available online: https://kosis.kr/statHtml/statHtml.do?sso=ok&returnurl=https%3A%2F%2Fkosis.kr%3A443%2FstatHtml%2FstatHtml.do%3Fconn_path%3DI4%26list_id%3DZTIT_B%26tblId%3DDT_2KAA205%26vw_cd%3DMT_RTITLE%26lang_mode%3Dko%26orgId%3D101%26 (accessed on 25 August 2025).
- Area by Region. Available online: https://kosis.kr/statHtml/statHtml.do?sso=ok&returnurl=https%3A%2F%2Fkosis.kr%3A443%2FstatHtml%2FstatHtml.do%3FtblId%3DDT_1ZGA17%26orgId%3D101%26 (accessed on 25 August 2025).
- Moreno-Monroy, A.I.; Schiavina, M.; Veneri, P. Metropolitan Areas in the World. Delineation and Population Trends. J. Urban Econ. 2021, 125, 103242. [Google Scholar] [CrossRef]
- Enforcement Decree of the Special Act on Local Autonomy and Decentralization, and Balanced Regional Development. Presidential Decree No. 34657, 2024 (Republic of Korea).
- Kim, S.; Lee, Y.; Oh, H. Estimation of Gridded Population with Spatial Downscaling in South Korea. Sustainability 2025, 17, 1511. [Google Scholar] [CrossRef]
- KIM, Y.-H.; KIM, D. A Study on the Population Estimation of Small Areas using Explainable Machine Learning: Focused on the Busan Metropolitan City. J. Korean Assoc. Geogr. Inf. Stud. 2023, 26, 97–115. [Google Scholar] [CrossRef]
Disclaimer/Publisher’s Note: The statements, opinions and data contained in all publications are solely those of the individual author(s) and contributor(s) and not of MDPI and/or the editor(s). MDPI and/or the editor(s) disclaim responsibility for any injury to people or property resulting from any ideas, methods, instructions or products referred to in the content. |
© 2025 by the authors. Licensee MDPI, Basel, Switzerland. This article is an open access article distributed under the terms and conditions of the Creative Commons Attribution (CC BY) license (https://creativecommons.org/licenses/by/4.0/).