Abstract
Ensuring food security amidst increasing non-grain utilization of cultivated land is a critical challenge in major grain-producing regions. This study analyzes the spatio-temporal evolution and driving mechanisms of non-grain cultivated land in Henan Province, China, from 2012 to 2023, using spatial autocorrelation, multiple linear regression, geographically and temporally weighted regression model, and cluster analysis. Results show that the non-grain ratio exhibited a fluctuating yet overall increasing trend, from 27.47% in 2012 to 25.91% in 2017 and reaching 30.28% in 2023, with higher values in the northern and southwestern counties of the province. Spatial clustering patterns remained relatively stable, characterized by a “high–high clustering in the southwest and low–low clustering in the north,” which was further substantiated by significant Global Moran’s I values (0.362 in 2012 and 0.307 in 2023). Key drivers included per capita level of agricultural mechanization, labor force per unit of cultivated land area, output value per unit of cultivated land area, and per capita disposable income of rural residents. PCA and K-means clustering identified three zonal types: agricultural production support (45.10% of counties), agricultural production weakening (35.29% of counties), and economically location-guided (19.61% of counties). The findings underscore the need for differentiated policies—such as precision subsidies, land consolidation, and ecological farming practices. This study provides a scientific basis for zonal governance of non-grain cultivated land in grain-producing areas.
1. Introduction
Grain is a cornerstone of national economic stability and security. As the primary resource for grain production, the protection of cultivated land is therefore paramount [1]. Nevertheless, rapid urbanization and complex global dynamics have accelerated the non-grain utilization of cultivated land, posing significant threats to food security [2]. This challenge is twofold. First, the total area of cultivated land is continuously shrinking. According to the Major Data Bulletin of the Third National Land Survey, the country’s cultivated land area is currently 1.28 × 10⁶ hm2, representing a decrease of 7.52 × 10⁶ hm2 compared to the previous survey. Second, driven by economic incentives, agricultural restructuring has prompted a shift from staple grain crops to high-profit cash crops, thereby accelerating the expansion of non-grain production [3]. In response, the General Office of the State Council issued the “Opinions on Preventing Non-Grain Utilization of Cultivated Land and Stabilizing Grain Production” in 2020, emphasizing the imperative to curb non-grain practices, stabilize grain production, and safeguard national food security. The 2025 “No. 1 Central Document” further specified that systematic remediation of non-grain utilization should be carried out in a categorized and phased manner, with appropriate transition periods granted based on local industrial development realities and crop growth cycles. Against this backdrop, effective governance and regulation of non-grain production on cultivated land are crucial for ensuring national food security.
Globally, the non-grain utilization of cultivated land is a common phenomenon during industrialization in developing countries [4]. It is widely recognized that industrialization and urbanization often lead to the marginalization of cultivated land and the loss of essential production factors, which in turn causes a decline in grain productivity—a pattern observed internationally [5]. For instance, corn monoculture driven by biofuel expansion in the U.S. Midwest Corn Belt and widespread cultivated land abandonment during Japan’s urbanization offer pertinent warnings for China [6,7,8,9]. Within China, non-grain utilization exhibits significant regional disparities: the Northeast and North China benefit from economies of scale in farming, resulting in lower conversion ratios, whereas driven by the profitability of cash crops, some areas in South, East, and Southwest China exhibit ratios as high as 30–40% [10,11]. As a pivotal grain-producing area, Henan Province demonstrates both universal and unique characteristics in its cultivated land non-grain issue. While the drive for agricultural restructuring and higher farmer incomes has expanded economic crop cultivation, inadequate regulation of grain production functional zones and deviations in policy implementation have contributed to the loss of control over cultivated land use [12,13]. Thus, analyzing its spatiotemporal evolution patterns and constructing a zoning-based management system are crucial for ensuring national food security and coordinating the multifunctional development of agriculture.
As the core region of China’s grain production, Henan Province contributes approximately 10% of the nation’s annual grain output, making any shift in its cultivated land use pattern a matter of national strategic importance. However, the accelerating processes of industrialization, urbanization, and agricultural restructuring have intensified the non-grain utilization of cultivated land. According to data, non-grain conversion in the province reached 3007.10 km2 between 2000 and 2020, accounting for 2.90% of its total cultivated land, with Xinyang City alone contributing to 25.08% of this conversion area. The utilization rate notably accelerated between 2015 and 2020 [14]. Furthermore, the non-grain ratio in cultivated land transfers exceeded 60% in some areas, where industrial and commercial capital redirected large-scale leased land toward cash crops or non-agricultural construction, thereby exacerbating functional alienation of cultivated land. Although Henan Province has enacted policies to strictly regulate cultivated land use—mandating the preservation of approximately 10.67 million hectares for grain planting and maintaining a stable output of over 65 billion kilograms—the urgent practical challenges remain: to scientifically delineate the spatiotemporal patterns of non-grain conversion and to formulate differentiated control strategies.
Scholars generally recognize two primary connotations of non-grain cultivated land. Broadly speaking, it refers to the gradual shift of cropland from traditional grain cultivation toward cash crops, fallowing, or abandonment. More narrowly, it specifically denotes the phenomenon of crops other than cereals, legumes, and tubers on cultivated land [15,16,17]. In terms of research scale, studies have predominantly focused on macro-regional levels, such as the national [18], provincial [19], or municipal scales [20]. Regarding research themes, existing studies mainly explore the driving factors, spatial differentiation, and prevention measures, analyzing influencing factors from perspectives such as socio-economic development, land transfer, and policy drivers [21,22,23]. Methodologically, studies predominantly employ econometric and geospatial analytical approaches, including spatial lag models, spatial error models, multiple linear regression analysis, and spatial autocorrelation analysis [24,25,26,27]. In summary, while substantial progress has been made in this field, several research gaps remain: First, most studies have focused on production-marketing balance zones or economically developed regions, while systematic analysis of the internal mechanisms driving non-grain production in major grain-producing areas—the core bastions of national food security—are still lacking. In particular, the representative case of Henan Province as the “Central Plains Granary” has not been sufficiently examined. Second, the identification of driving factors still relies heavily on traditional statistical methods, with limited consideration of the spatiotemporal heterogeneity and interaction effects among these factors. Third, and most critically, existing control strategies often remain at the level of macro policy recommendations, falling short of developing differentiated zoning management schemes that effectively bridge mechanistic analysis with governance practice. This gap limits the applicability of research findings to the complex regional characteristics of major grain-producing areas and constrains their practical utility. To address these gaps, this study focuses on constructing a zonal control mechanism for major production areas, applying a comprehensive “pattern–mechanism–zoning- strategy” analytical framework to Henan Province as a typical case. Unlike previous studies that focus solely on the single consequence of non-grain production, this paper establishes a synergistic objective system comprising food security, farmer income, and ecological protection. Furthermore, the logic of multi-objective trade-offs is embedded during the indicator selection phase, with each driving factor assigned dual attributes of a “primary objective–synergistic objective,” thereby providing a consistent analytical framework for subsequent mechanism analysis and zonal governance.
The objectives of this study are (1) to analyze the spatio-temporal evolution patterns and spatial heterogeneity of non-grain cultivated land in Henan Province; (2) to employ the GTWR model to identify the driving factors and their spatiotemporal variations, thereby elucidating the underlying mechanisms; and (3) to propose differentiated zoning governance recommendations based on quantitative zoning results. Ultimately, this study aims to establish a zonal control mechanism for non-grain cultivated land in major grain-producing areas, offering a potential pathway for transitioning from macro-policy to spatially precise governance.
2. Materials and Methods
2.1. Study Area
Henan Province is located in the middle and lower reaches of the Yellow River (110°21′~116°39′ E, 31°23′~36°22′ N) (Figure 1). The region features a terrain that slopes from higher elevations in the west to lower plains in the east, complemented by basins, mountains, and hills. It is drained by four major river systems: the Haihe River, Yellow River, Huaihe River, and the Yangtze River. Characterized by a warm temperate continental monsoon climate, the province has an average annual temperature of 12–16 °C and receives about 500–900 mm of precipitation per year. In 2022, the total population was about 98.78 million, and the total land area spans 167,000 km2, administered through 18 prefecture-level cities, 22 county-level cities, 83 counties, and 53 municipal districts. The cultivated land area amounts to 7.5141 million hm2, supporting a total crop planting area of 14,771.51 thousand hm2. In the same year, total grain output reached 135.787 billion kilograms, ranking second nationally. Major crops include wheat, rice, corn, tubers, beans, and cotton, among others. For six consecutive years, the province’s total grain output has exceeded 130 billion kilograms. While occupying about 6% of China’s cultivated land, Henan province produces approximately 10% of the country’s grain. In addition to ensuring its own food security, the province supplies nearly 40 billion kilograms of raw grain and processed grain products to other regions annually, reinforcing its pivotal role as a national grain production base.
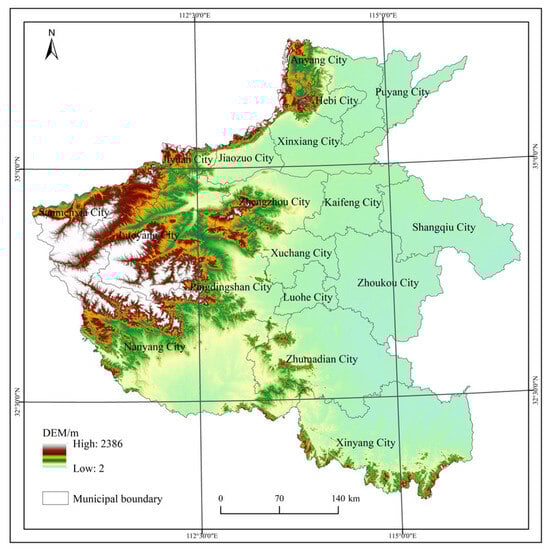
Figure 1.
The location of the study area.
2.2. Data Sources
Henan Province governs 18 prefecture-level cities and 157 county-level administrative divisions. Four districts—Zhongyuan, Weibin, Jiefang, and Weidu—were excluded from the study due to their complete urbanization and severe lack of agricultural data. Thus, a total of 153 districts and counties were selected as research units, covering the period from 2012 to 2023, with key reference years set at 2012, 2017, and 2023. Digital elevation model (DEM) data were obtained from the Geospatial Data Cloud site (https://www.gscloud.cn, accessed on 8 May 2025) with a spatial resolution of 90 m. The cultivated land data for 2012, 2017, and 2023 were derived from the 30-m resolution multi-period land use remote sensing monitoring dataset of China, provided by the Resource and Environmental Science and Data Center of the Chinese Academy of Sciences (https://www.resdc.cn, accessed on 9 May 2025). Administrative boundary data were also acquired from the same source. All spatial data were resampled to a 30-m resolution and projected into the Albers coordinate system using ArcGIS 10.8. Raster resampling was performed using the nearest-neighbor method, with an area error of less than 0.2%. The National Tibetan Plateau Scientific Data Center Platform (https://data.tpdc.ac.cn, accessed on 29 June 2025) provided precipitation data for the corresponding years. Socioeconomic data—such as crop sown area, GDP, and rural per capita disposable income— for 2012, 2017, and 2023 were collected from the Statistical Yearbooks and Statistical Communique for 2013, 2018, and 2024. Among the social and economic driving-factor indicators, 119 data points were originally missing, accounting for 2.4% of the total. These gaps were filled using linear interpolation, which estimates missing values based on a linear function constructed from adjacent time points. This method is well-suited for small-scale, randomly distributed missing values. To validate the approach, 10% of the observed values were randomly masked as “pseudo-missing” and then interpolated. The mean absolute error (MAE) of the linear interpolation was 3.4%, below the 5% tolerance threshold. A t-test further confirmed no significant differences in the mean or variance of any indicator before and after imputation (p > 0.10), indicating that the interpolation did not introduce appreciable bias. After this process, the dataset was complete and suitable for subsequent model analysis.
2.3. Measurement of Cultivated Land Non-Grain Conversion
Scholars often use the ratio of the sown area of non-grain crops to the total sown area of crops (Equation (1)) [15,28]. The calculation formula is as follows:
where Y represents the non-grain ratio of cultivated land, A represents the sowing area of grain crops, and C represents the total sowing area of crops. According to the “Opinions on Preventing the Non-grain Utilization of Cultivated Land and Stabilizing Grain Production” and the “Henan Statistical Yearbook”, the grain crops in this study include cereals, legumes, and tubers. All crops beyond these three categories are defined as economic crops, which aligns with the classification of grain crops in the “First Catalogue of Non-Staple Crops for Registration” published by the Ministry of Agriculture of the People’s Republic of China in 2017.
Y = (1 − A/C) × 100%
2.4. Selection of Driving Factors for Non-Grain Cultivated Land
A complex interplay of natural, socioeconomic, and policy drivers influence the formation of non-grain cultivated land. Building on existing literature [15,29,30,31] and contextual evidence from Henan Province [12,14,32], we developed an indicator system that explicitly incorporates the synergistic objectives of food security, farmers’ income, and ecological protection (Table 1). The system comprises eleven standardized variables, categorized into three dimensions, with each factor assigned a primary objective and one or two synergistic objectives. For instance, per capita agricultural mechanization primarily targets ecological protection (e.g., by reducing fuel-intensive tillage), while also contributing to stabilized grain yields (food security) and freeing up labor for off-farm income (farmers’ income). Similarly, annual precipitation is primarily linked to ecological protection, yet its positive externality helps secure irrigation and lower production costs, thereby jointly supporting food security and farmers’ income. This dual-attribute framework ensures that subsequent mechanism analysis and zoning governance are consistently guided by the logic of multi-objective trade-offs.

Table 1.
Driving Factors and Synergistic Objectives for Cultivated Land Non-Grain.
2.5. Spatial Autocorrelation Analysis
Spatial autocorrelation analysis is a fundamental method for detecting spatial distribution patterns of geographical elements [33,34]. This study employs a combination of global and local spatial autocorrelation to systematically examine the spatio-temporal evolution and agglomeration patterns of non-grain cultivated land across provincial and county levels. The Global Moran’s I measures the overall spatial association degree between all spatial units within the entire region, revealing the agglomeration and dispersion patterns of non-grain cultivated land across Henan Province. Local Moran’s Index identifies local spatial clustering characteristics of regional attributes, reflecting the distribution heterogeneity and localized variations in non-grain cultivated land. The calculation formula is as follows:
where n represents the number of study units, Wij represents the spatial weight, xi and xj represent the “non-grain production grade” values of region i and j, respectively, with being the mean value of xi and xj. The Moran’s I index ranges from −1 to 1. A value significantly greater than 0 indicates positive spatial autocorrelation, implying that similar attribute values are clustered in space; a value significantly less than 0 suggests negative spatial autocorrelation, reflecting a dispersed pattern; and a value near 0 denotes a random spatial distribution. This study further applied local spatial autocorrelation analysis to identify the local clustering patterns of non-grain cultivated land. By calculating the Local Moran’s I index, the spatial association types of counties/districts were classified into four categories: High–High clustering (H–H): both the local county/district and its surrounding areas exhibit a high non-grain ratio, forming “hots pots”. Low–Low clustering (L–L): Both the local county/district and its surrounding areas exhibit a low non-grain ratio, forming “colds pots”. Low–High clustering (L–H): The local county/district has a low non-grain ratio but is surrounded by areas with high values. High–Low Clustering (H–L): The local county/district has a high non-grain ratio but is surrounded by areas with low values. The classification of these clustering types was based on significance tests (p < 0.05), ensuring the reliability of the identified spatial clustering patterns.
2.6. Multiple Linear Regression Model
The multiple linear regression (MLR) model can be used to study the linear relationships between two or more independent variables (X) and a dependent variable (Y) [35,36]. In this study, the non-grain ratios of cultivated land was selected as the dependent variable (Y), while multiple indicators from three dimensions—natural conditions, social conditions, and economic conditions—were chosen as independent variables (X). A stepwise regression method was employed to explore the driving factors of non-grain cultivated land in Henan Province. The formula of the MLR model is as follows:
where Y represents the “non-grain” ratios of cultivated land, β0 represents the intercept term, β1, β2, …, βk represent the regression coefficients of the independent variables, respectively, X1, X2, …, Xk represent the selected driving factors, respectively, and ε represents the random error term.
Y = β0 + β1X1 + β2X2 + …+βkXk + ε
2.7. Geographically and Temporally Weighted Regression Model
The Geographically and Temporally Weighted Regression (GTWR) model extends the traditional Geographically Weighted Regression (GWR) model by incorporating a temporal dimension, utilizing a spatio-temporal distance-weighted matrix to analyze spatio-temporal non-stationarity [37,38]. This approach addresses the spatio-temporal imbalance inherent in traditional GWR model and enhances the accuracy of results. In this study, the MLR model was first employed to identify key influencing factors of non-grain cultivated land. Subsequently, the GTWR model was applied to analyze the spatio-temporal evolution of driving factors for cultivated land “non-grain conversion” in Henan Province from 2012 to 2023. The formula of the GTWR model is as follows:
where denotes the non-grain ratio of cultivated land at location i, and Xik represents the value of the k-th driving factor of non-grain conversion at the same location. The spatio-temporal coordinates of point i are given by (), where and are the spatial coordinates, and is the temporal coordinate. The term refers to the regression intercept at point i, while denotes the local regression coefficient for the k-th driving factor. The residual error term captures the stochastic disturbance at point i.
The bandwidth selection for the GTWR model employs the corrected Akaike Information Criterion (AICc) and iteratively optimizes it using the golden section search method to ultimately determine the optimal combination of spatial and temporal bandwidths. The spatio-temporal weight matrix is constructed based on a Gaussian kernel function, with spatial distance measured by Euclidean distance and temporal distance calculated as the difference in years. The joint spatiotemporal distance function is defined as
where dij is the spatial Euclidean distance, tij is the difference in years, and hs and ht are the spatial and temporal bandwidths, respectively, chosen adaptively by minimizing the AICc. To test model robustness, this study conducted the following three checks: (1) varying the bandwidth parameters by ±10%, which did not lead to substantial changes in the signs or significance of the model’s core variables; (2) replacing the Gaussian kernel function with a Bi-square kernel function, which yielded largely consistent results; and (3) re-estimating the model after removing outlier samples, which resulted in fluctuations of less than 5% in the coefficients of key variables [35].
2.8. Division of Non-Grain Controlled Regions for Cultivated Land
Principal Component Analysis (PCA) is a dimensionality reduction method that transforms original multiple correlated variables into a new set of independent composite variables through linear transformation. The K-means algorithm is a typical distance-based clustering algorithm [39,40]. In this study, PCA was first applied to reduce the dimensionality of the driving factors influencing the non-grain conversion of cultivated land, followed by the use of K-means clustering to classify different regions of drivers.
3. Results
3.1. Evolution Characteristics of Non-Grain Cultivated Land in Henan Province
This classification was generated using the Natural Breaks method in ArcGIS 10.8, as shown in Figure 2. In line with the approaches of Chen et al. [41], Tian et al. [42], and Liu et al. [43], areas with a non-grain ratio exceeding 30% were classified as having a high degree of non-grain conversion and thus demand prioritized regulatory attention. The non-grain ratios of cultivated land in Henan Province were 27.47%, 25.91%, and 30.28% in 2012, 2017, and 2023, respectively. Between 2012 and 2017, the ratio declined by 1.56 percentage points, but from 2017 to 2023, it rebounded sharply, rising by 4.37 percentage points. Overall, the non-grain ratio exhibited a fluctuating upward trend during the past decade. Notably, the peak value of non-grain ratio rose from 74.07% in 2012 to 89.49% in 2023. As shown in Figure 2, in terms of spatial distribution, the non-grain level of cultivated land in Henan Province exhibited significant spatial disparities from 2012 to 2017, with a distinctive” high in the southwest and low in the north” pattern across the area. Between 2017 and 2023, the non-grain ratio in these two areas showed a significant increase. Spatially, areas with a non-grain ratio above 30% were mainly concentrated in the southwestern and central parts of the province, including prefecture-level cities such as Xinyang, Nanyang, Sanmenxia, Luoyang, Zhengzhou, and Kaifeng. At the county level, several counties/districts recorded non-grain cultivation ratios exceeding 50%, including Xichuan, Luanchuan, Tongxu, Qi County, Zhongmu, Shihe District, and Nanzhao. Temporally, areas with non-grain ratios above 30% increasingly clustered in southwestern Henan and the peripheries of the provincial capital, Zhengzhou. A notable finding is that the number of counties/districts with a non-grain cultivation ratio exceeding 50% increased from 6 in 2012 to 26 in 2023.
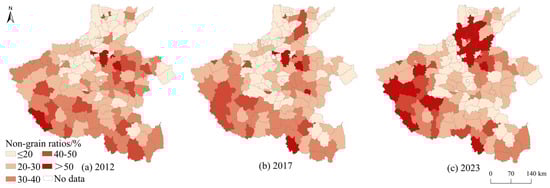
Figure 2.
Spatio-temporal evolution of cultivated land non-grain in Henan Province from 2012 to 2023.
3.2. Spatial Clustering Analysis of Non-Grain Cultivated Land in Henan Province
The Global Moran’s I index of non-grain cultivated land was calculated to assess the presence of spatial clustering in Henan Province. As illustrated in Table 2, the Global Moran’s I values for 2012, 2017, and 2023 were all greater than 0 and statistically significant, confirming a consistent and significant positive spatial autocorrelation of non-grain levels across the province. It is worth noting, however, that the gradual decline in the Global Moran’s I value over this period suggests a weakening trend in the strength of spatial clustering.
Table 2.
The Global Moran’s I index of non-grain on cultivated land in 2012, 2017, and 2023.
The spatial distribution and clustering patterns of the non-grain cultivated land in Henan Province were further analyzed using Local Moran’s I with ArcGIS 10.8. As illustrated in Figure 3, the dominant clustering types observed from 2012 to 2023 were High–High (H–H) and Low–Low (L–L). The number of counties/districts exhibiting H-H clustering decreased from 17 in 2012 to 10 in 2023, indicating a general reduction in such agglomerations. These H-H clusters were primarily concentrated in Nanyang City, Kaifeng City, and their peripheral areas. In Nanyang City, the southwestern part—characterized by mountainous and hilly terrain—serves as a national production base for cotton, oil, and tobacco, contributing to its high level of non-grain conversion [44]. For Kaifeng City, proximity to the provincial capital Zhengzhou and its status as a core city in the Zhengzhou–Kaifeng integration zone have stimulated rapid economic growth and urbanization. This has promoted a shift in cultivated land use from grain production to diversified agricultural activities oriented toward urban markets [45]. Conversely, L-L clustering areas displayed more dynamic spatial variations, mainly distributed across northern Henan-including Jiaozuo, Xinxiang, Hebi, and Anyang, as well as parts of Xuchang City in the central region. These plain-dominated areas contain large-scale grain production bases with favorable agricultural ecological conditions, which helps explain their lower intensity of non-grain conversion.
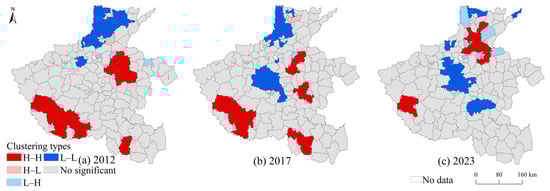
Figure 3.
Spatial agglomeration characteristics of non-grain cultivated land in the study area from 2012–2023.
3.3. Analysis of Driving Factors for Non-Grain Cultivated Land Production in Henan Province
3.3.1. Significance Analysis of Driving Factors
This study employed MLR model to investigate the impact of various driving factors on the spatio-temporal heterogeneity of non-grain cultivated land in Henan Province. Prior to conducting the regression analysis, to ensure the robustness and validity of the results, the variance inflation factor for each driving factor was calculated using Stata 18.0, and factors with a VIF greater than 5 were excluded to mitigate multicollinearity issues [36]. As illustrated in Table 3, the regression results indicate that factor X4 (urbanization rate) was excluded due to its VIF exceeding 5. The remaining ten factors were statistically significant at either the 0.01 or 0.05 level, demonstrating a significant linear relationship between the selected indicators and the non-grain ratio of cultivated land in Henan Province. Based on the standardized regression coefficients, five factors exhibited substantial influence on the non-grain utilization of cultivated land in Henan Province: X1 (per capita level of agricultural mechanization), X6 (labor force per unit of cultivated land area), X8 (output value per unit of cultivated land area), X9 (GDP per capita), and X10 (per capita disposable income of rural residents). These drivers contributed significantly to the degree of non-grain conversion, highlighting their pronounced role in shaping land-use decisions.
Table 3.
Results from fitting the MLR model.
3.3.2. Analysis of GTWR Model Results
Scholars commonly employ Ordinary Least Squares (OLS), Geographically Weighted Regression (GWR), and Geographically and Temporally Weighted Regression (GTWR) models to investigate the spatiotemporal heterogeneity of driving factors behind cultivated land non-grain conversion [36,43]. To identify the optimal model, this study concurrently constructed all three models for comparison. As shown in Table 4, the comprehensive performance of the GTWR model is significantly superior to the other two. Specifically, compared to the OLS model, which only reflects global average relationships (R2 = 0.521), and the GWR model, which considers only spatial non-stationarity (R2 = 0.741), the GTWR model, by incorporating both spatial and temporal dimensions, achieves a substantially higher coefficient of determination of 0.811, representing the best goodness-of-fit. The optimal bandwidths in the GTWR model were determined as 0.114° for spatial distance and 2 years for temporal separation using the AICc criterion. This model also yielded the lowest Residual Sum of Squares (3668) and Root Mean Square Error (2.83) among the three, and its AICc value (1093.6) was considerably lower than those of the GWR (1179.4) and OLS (1398.4) models, indicating an optimal balance between model parsimony and fitting accuracy. Robustness checks, including ±10% bandwidth variation, kernel function substitution, and outlier removal, confirmed the stability of coefficient signs and significance levels, attesting to the high reliability of the GTWR results. Comprehensive analysis demonstrates that the GTWR model can most accurately characterize the spatiotemporal differentiation characteristics of the driving mechanisms behind cultivated land non-grain conversion.
Table 4.
Comparison of fitting results of GWR and GTWR.
The influence of natural factors on non-grain cultivated land is shown in Figure 4. Interpretation of the spatiotemporal variation in GTWR coefficients should be grounded in the synergistic framework outlined in Table 1. Taking the hilly belt of southern Henan as an example, the positive effect of “labor force per unit of cultivated land” on non-grain conversion stems not only from labor surplus (primary objective—grain security) but also from the tendency of surplus laborers to shift to cash crops for higher monetary returns (synergistic objective—farmers’ income). Meanwhile, fragmented farming on steep slopes exacerbates ecological fragility (synergistic objective—ecological protection). Therefore, variations in the sign and magnitude of the coefficients essentially reflect localized trade-offs and synergies among the three overarching objectives. Thus, changes in the sign and magnitude of the coefficients are, in essence, local expressions of the spatial trade-offs and synergies among the three overarching objectives. The driving effect of per capita mechanization level on non-grain cultivated land utilization was predominantly positive in the southern counties of Henan Province, showing a gradual strengthening trend, while eastern counties exhibited a negative influence. The impact of per capita cultivated land area on non-grain cultivated land was mostly positive throughout the province’s counties, slightly higher in southern counties compared to northern and central ones. Less per capita cultivated land area makes scaled operation more difficult, accelerating non-grain utilization of cultivated land. Across all counties in the province, annual precipitation primarily exerted a positive influence, spatially higher in southwestern counties and lower in eastern counties.
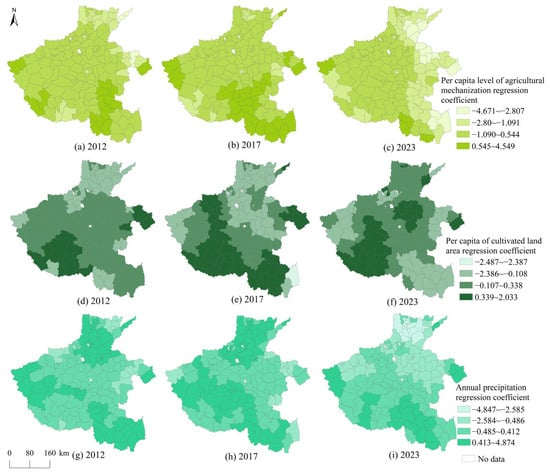
Figure 4.
Regression coefficients of the GTWR model for natural conditions factors.
The influence of social factors on non-grain cultivated land is shown in Figure 5. Industrial restructuring drives the reallocation of production factors, which in turn shapes agricultural adjustments and objectively accelerates the non-grain utilization of cultivated land. This trend is particularly pronounced in the northern and southern regions of Henan Province. In the mountainous counties of western and southern Henan, a higher labor force per unit of cultivated area significantly promotes non-grain conversion. These areas are characterized by limited cultivated land per capita and a relative surplus of agricultural labor. To enhance household income, farmers tend to allocate their limited land to cash crops—such as vegetables, medicinal herbs, and fruit trees—that offer higher economic returns, thereby raising the non-grain ratio as labor density increases. A representative case is tea cultivation in Xinyang, which effectively boosts farmers’ earnings. Consistent with the “investment–return” theory, this positive economic feedback reinforces farmers’ preference for non-grain crops [46].
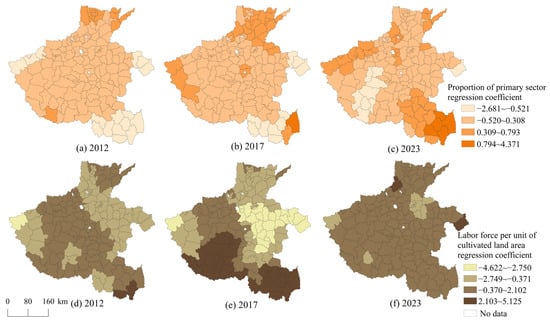
Figure 5.
Regression coefficients of the GTWR model for social conditions factors.
The influence of economic factors on non-grain cultivated land is shown in Figure 6. The coefficients for agriculture-related expenditure are mostly negative, suggesting a general suppressive effect on non-grain cultivated land in Henan Province. Government agricultural subsidies help reduce production costs and enhance farmers’ incentive for grain cultivation. The total agriculture-related expenditure in Henan Province increased from 55.173 billion yuan in 2012 to 133.65 billion yuan in 2023, showing consistent annual growth, which also explains the decline in non-grain cultivated land over the past decade. The regression coefficients for land productivity are mostly positive. Spatially, the coefficients for cultivated land area exhibited a “low in the east and west, high in the center” pattern, with their influence intensifying over time. Compared to northern and southeastern counties, non-grain conversion in western and central Henan is more responsive to land productivity. This can be attributed to the fact that in land-use decisions, the pursuit of higher land productivity by farmers and local governments shapes cultivation behavior, thereby influencing the extent of non-grain conversion. In western counties, steep terrain limits farm size, impeding large-scale grain production [44], which encourages the use of fragmented plots for high-value cash crops to raise income. Changes in per capita GDP may alter production factor prices and consumption demand, thereby influencing the cultivation of non-grain crops. The impact of rural residents’ disposable income on non-grain conversion is not uniform but shows significant spatiotemporal heterogeneity, closely linked to regional development stages. In traditional farming areas, income growth acts as a ‘catalyst’ for farmers to adjust agricultural structure and pursue market profits, thereby promoting non-grain conversion. Conversely, in economically developed regions, income growth, by altering farmers’ livelihood models and preferences, may instead become a factor that suppresses non-grain conversion. The impact of per capita disposable income of rural residents on cultivated land ‘non-grain conversion’ is not constant but exhibits profound spatiotemporal heterogeneity. The direction of this impact is closely linked to the regional development stage. In traditional farming areas, income growth acts as a ‘catalyst’ for farmers to adjust agricultural structure and pursue market profits, thereby promoting non-grain conversion. Conversely, in economically developed regions, income growth, by altering farmers’ livelihood models and preferences, may instead become a factor that suppresses non-grain conversion. For counties in central and southern Henan, the impact of the urban–rural income gap on non-grain cultivated land has gradually shifted from negative to positive. This is especially true in Xinyang City in southern Henan, where the influence was positive between 2017 and 2023, a phenomenon associated with the region’s developed tea industry. Tea planting in Xinyang increases farmers’ income, and consistent with the “investment–income” theory, this positive feedback encourages farmers to continue choosing non-grain crops.
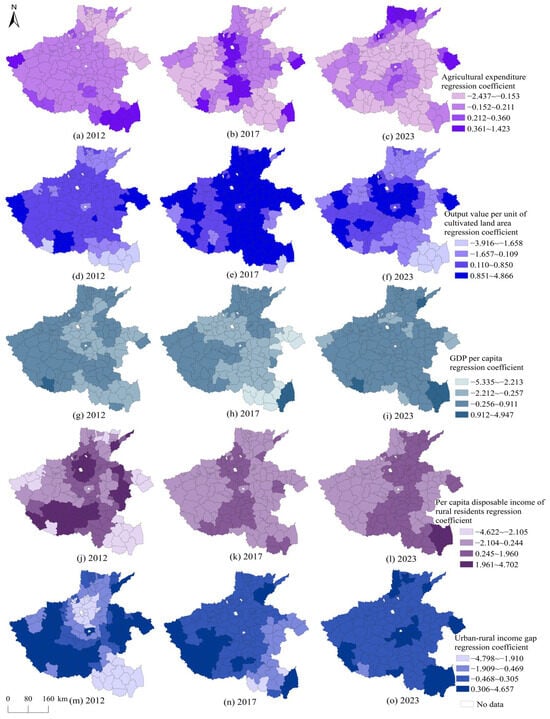
Figure 6.
Regression coefficients of the GTWR model for economic conditions factors.
3.4. Zoning of Non-Grain Cultivated Land in Henan Province
Based on the selected factors, principal component analysis (PCA) was employed to extract the main driving factors. The suitability of the standardized driving factors for principal component analysis was confirmed by Kaiser–Meyer–Olkin (KMO) and Bartlett’s tests (SPSS 27), with a KMO value of 0.732 (exceeding the 0.7 threshold) and a significant Bartlett’s test result (χ2 = 1247.6, df = 45, p < 0.001), thereby rejecting the null hypothesis of an identity matrix and confirming adequate inter-variable correlations for dimension reduction. The results revealed that the cumulative Eigen values of the first three principal components reached 73.668%, effectively summarizing the information conveyed by the original nine factors. Therefore, these three principal components were used to classify the driving types of non-grain production on cropland. The component matrix (Table 5) showed that the first principal component exhibited high loadings on factors such as per capita level of agricultural mechanization (X1) and per capita cultivated land area (X2). The second principal component was primarily influenced by factors including annual precipitation (X5) and agricultural expenditure (X7). The third principal component was mainly positively influenced by output value per unit of cultivated land area (X8), per capita disposable income of rural residents (X10), and urban–rural income gap (X11).
Table 5.
Component Matrix.
Based on the three major driving factors extracted through principal component analysis, the principal component scores of these three factors were calculated for 153 counties and districts in Henan Province. These scores were then used for K-means clustering. The optimal number of clusters (K = 3) was determined using the elbow method, which evaluates the within-cluster sum of squares (WSS) for different K values. Guided by the principle of spatial continuity and informed by local socioeconomic and geographical conditions, the preliminary clustering results for certain areas were appropriately adjusted to enhance the practical relevance of the zoning scheme for regional management, as illustrated in Figure 7. Henan Province was classified into three types of non-grain production areas: agricultural production support, agricultural production weakening, and economically location-guided.
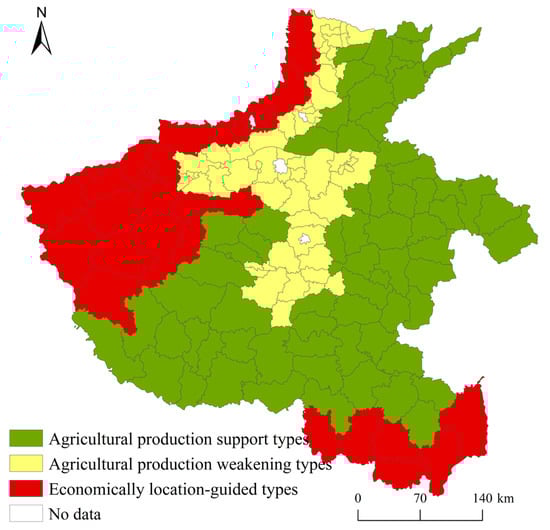
Figure 7.
Zoning of no-grain cultivated land in Henan Province.
The agricultural production support types are primarily distributed in eastern and southern Henan Province, with 69 such areas, accounting for 45.10% of the total, making them the main drivers of no-grain cultivated land in Henan. These counties and districts are predominantly clustered around central urban areas, characterized by rapid economic development, favorable transportation conditions, substantial agricultural investments, and strong agricultural production capacity. These characteristics indicate that the non-grain production areas of the agricultural support type align with their economic development trends. Their advantageous locational conditions facilitate integration with central urban development while retaining agricultural production functions [47]. The agricultural production weakening types are mainly found in central and parts of northern Henan, with 54 such areas, accounting for 35.29% of the total. This category exhibits the most severe level of non-grain conversion, alongside the largest income disparity between urban and rural residents. This pattern arises because these areas focus on developing secondary and tertiary industries to achieve comprehensive regional economic development, with most having transformed into urban construction zones. Consequently, agricultural development has contracted, production conditions have diminished, thereby driving increased ratios of non-grain conversion [47]. The economically location-guided types are primarily distributed in western and northern Henan, with 30 such areas, accounting for 19.61%—the least among the three driving types. These regions show the lowest averages in GDP, urbanization rate, and gross agricultural production value are the most distant from central urban areas. Western Henan, influenced by the foothills of the Qinling Mountains and the Funiu Mountain range, contains extensive mountainous terrain with significant elevation variations. This results in highly fragmented cultivated land, poor farming conditions, and constraints on large-scale grain production. Consequently, farmers tend to use fragmented plots for high-value economic crops such as tobacco and medicinal herbs, which offer higher land productivity and income. These areas also demonstrate greater reliance on agricultural subsidies to reduce planting costs, which helps mitigate further expansion of non-grain cultivated land [48].
3.5. Zoning-Based Control Measures for No-Grain Cultivated Land
The phenomenon of no-grain cultivated land is the result of multiple contributing factors, yet the underlying cause lies in the relatively low economic returns from grain production [9]. The cost of growing grain continues to rise year by year, while grain purchase prices remain relatively low. Consequently, the shift toward non-grain crops has become an inevitable response to market incentives and farmers’ rational economic decision-making. Therefore, enhancing the profitability of grain production is key to effectively managing “no-grain cultivated land.” Based on the “primary–synergistic” objective mapping in Table 1, this study formulates tailored “objective–measure” strategies for the three types of control zones.
Agricultural production support zones focus on the dual objectives of controlling non-grain ratios and increasing profitability, aiming to reduce the non-grain cultivation rate to below 15% while enhancing net grain income. Implementation pathways include promoting the “wheat–corn with subsurface drip irrigation” and provincial-level contract farming, where platforms pre-commit to purchase specified volumes at prices set moderately above the minimum purchase price. Policy incentives involve piloting a “Grain Production Subsidized Loan” program starting in 2024, providing interest subsidies and support for water-saving equipment to participating cooperatives, thereby alleviating financing costs and improving irrigation efficiency.
Agricultural production weakening zones prioritize preserving prime farmland and controlling expansion, with goals to maintain over 80% of permanent prime farmland and limit the annual growth rate of non-grain cultivation to ≤1%. Implementation strategies include exploring the establishment of a “Farmland Bank,” through which the government acquires plots under high development pressure, converts them into state-owned agricultural land, and leases them to grain enterprises. Concurrently, less suitable sloped farmland may be allocated as quota for transaction to new urban districts, with proceeds directed into a provincial “Food Security Fund” dedicated to farmland consolidation in key grain-producing plains. Policy support allows local governments to use special bonds for farmland acquisition and establishes a cross-regional supplementary cropland trading platform.
Economically location-guided zones emphasize zero net expansion and intercropping systems, targeting no increase in non-grain area on slopes under 25 degrees and achieving intercropping coverage of specialty crops with grains of ≥60%. Implementation involves establishing 10,000-mu demonstration sites in areas such as Luoyang and Sanmenxia for models like “forsythia–millet” intercropping, supported by monthly remote sensing and drone monitoring to identify and rectify newly converted non-grain land within specified deadlines. Policy incentives include one-time rewards for certified demonstration plots, while violators face blacklisting and subsidy cancellation. The incorporation of high-profit specialty crops enhances farmer participation, and the use of cost-effective remote sensing technology ensures the long-term viability of monitoring efforts.
4. Discussion
This study systematically examined the spatio-temporal evolution, driving mechanisms, and zonal characteristics of non-grain cultivated land in Henan Province—a critical grain-producing region in China. The integrated application of spatial autocorrelation, multiple linear regression, GTWR modeling, and cluster analysis provides a multidimensional perspective on how natural, socioeconomic, and policy factors interact across space and time to shape land-use decisions. Several key findings warrant further discussion in light of existing literature and regional policy contexts. The fluctuating yet overall increase in the non-grain ratio from 27.47% (2012) to 30.28% (2023) reveals a complex dynamic in the governance of cultivated land. The initial decline to 25.91% in 2017 suggests that provincial and national policies—exerted a measurable yet short-term moderating effect. However, the subsequent rebound, coupled with the rising maximum non-grain ratio and the growing number of high-intensity counties, underscore the persistent and potent economic incentives for farmers to shift to cash crops. This pattern of “retreat before advance” highlights a fundamental tension: while regulatory policies can temporarily curb non-grain conversion, they are insufficient to override long-term market forces without parallel strategies that substantially improve the comparative profitability of grain production. The significant spatial autocorrelation and clear High–High and Low–Low clustering patterns reinforce the role of spatial dependence in agricultural land-use decisions. The gradual decline in Global Moran’s I suggests that policy interventions and market forces may be diversifying land-use patterns, thereby reducing regional homogeneity. Nonetheless, the persistent concentration of non-grain activities in southwestern Henan and around Kaifeng illustrates how regional natural endowments and urban market demand continue to drive specialized agricultural production. These findings align with studies emphasizing the importance of spatial spillover effects and regional clustering in land-use change [49,50]. The GTWR model effectively captured spatio-temporal heterogeneity in driving factors. Key drivers such as per capita level of agricultural mechanization (X1), per capita cultivated land area (X2), and annual precipitation (X3) showed significant and spatially varying influences, with X1 exhibiting a particularly strong effect. The positive association between output value per unit of cultivated land area (X8) and non-grain cultivation, especially in western Henan, corroborates the economic rationale of shifting to high-value crops in areas where terrain limits grain economies of scale. The negative influence of agricultural expenditure (X7) confirms the role of subsidies in stabilizing grain planting, consistent with national efforts to protect staple crop production. Notably, the influence of socioeconomic factors evolved over time. For instance, per capita GDP (X9) showed a negative correlation in earlier years but shifted toward a positive influence in some regions by 2023, suggesting that economic development may initially suppress—yet later promote—crop diversification. This non-linear relationship aligns with theories of agricultural transition during economic development and merits further investigation in other major grain-producing regions. The three-zone typology—agricultural production support, agricultural production weakening, and economically location-guided—offers a pragmatic framework for spatially differentiated governance. By linking each zone’s dominant drivers to tailored policy measures, such as land consolidation in fragmented mountainous areas, eco-agricultural promotion in urban peripheries, and grain subsidies in plains regions, this approach supports more precise and effective spatial governance. It moves beyond one-size-fits-all solutions and acknowledges the complex regional realities of agricultural decision-making.
Several limitations should be acknowledged. First, the study focused on food-based non-grain production due to data constraints; non-food uses (e.g., afforestation, aquaculture) were not included. Second, the drivers selected, while comprehensive, may not capture all relevant socio-institutional factors such as local governance capacity or cultural preferences. Future studies could incorporate mixed-methods approaches, including surveys or interviews, to deepen contextual understanding. Additionally, comparative studies across different major grain-producing regions in China could help identify transferable insights and generalize the model of farmland use transition under urban and market pressure.
5. Conclusions
Based on a comprehensive analysis of the spatiotemporal evolution, driving mechanisms, and zoning characteristics of cultivated land non-grain conversion in Henan Province from 2012 to 2023, this study draws the following conclusions. The non-grain utilization of cultivated land in Henan exhibits significant spatial heterogeneity and clustering patterns, shaped by the combined effects of natural conditions, socioeconomic development, and policy interventions. The non-grain ratio demonstrated an overall fluctuating upward trend, with the continued expansion of high-intensity non-grain areas underscoring the strong economic incentives for cash crop cultivation. Key drivers—such as the per capita level of agricultural mechanization, the urban–rural income gap, and per capita cultivated land area—exhibited notable spatiotemporal heterogeneity in their influences.
By embedding the multi-objective synergy framework of “food security–farmer income growth–ecological protection” into the definition of driving factor attributes, this study provides deeper insights into the mechanisms underlying non-grain conversion. The GTWR model, leveraging its capacity to capture both spatial heterogeneity and temporal non-stationarity, more accurately revealed the spatiotemporal dynamics of driving factors and their roles in multi-objective trade-offs compared to traditional OLS and GWR models, thereby offering a more reliable basis for zonal governance. Using principal component analysis and K-means clustering, three dominant zonal types were identified: agricultural production support zones, agricultural production weakening zones, and economically location-guided zones.
Accordingly, governance strategies should be differentiated and targeted across zones. In agricultural production support zones, the focus should be on reducing the non-grain ratio and enhancing profitability by improving grain income through water-saving irrigation and contract farming. In agricultural production weakening zones, the priority lies in preserving prime farmland and controlling expansion through the establishment of farmland bank and cross-regional quota trading to protect high-quality cultivated land. In economically location-guided zones, implementation should emphasize zero net expansion and intercropping systems by adopting ecological intercropping and remote sensing monitoring, thereby achieving synergy between specialty industries and grain production.
Author Contributions
Methodology, A.F. and Z.X.; Investigation, Y.S., Z.X. and Y.M.; Writing—original draft, A.F. and Z.X.; Writing—review and editing, W.C., L.S. and X.F.; Resources, Z.X.; Supervision, W.C. All authors have read and agreed to the published version of the manuscript.
Funding
This research was funded the Henan Philosophy and Social Science Planning Project (No. 2023CJJ153), Natural Science Foundation project of Henan Province (Grant No. 242300420602), and National Key R&D Program of China (2021YFD1700900).
Data Availability Statement
The original contributions presented in the study are included in the article, further inquiries can be directed to the corresponding author.
Conflicts of Interest
The authors declare no conflicts of interest.
References
- Zhu, D. Economic Mechanisms and Governance Pathways of Cultivated Land “Non-Grain Production”. China Land 2021, 9–11. [Google Scholar] [CrossRef]
- He, T.; Jiang, S.; Xiao, W.; Zhang, M.; Tang, T.; Zhang, H. A non-grain production on cropland spatiotemporal change detection method based on Landsat time-series data. Land Degrad. Dev. 2024, 35, 3031–3047. [Google Scholar] [CrossRef]
- Zhou, Y.; Li, X.; Liu, Y. Cultivated Land Protection and Rational Use in China. Land Use Policy 2021, 106, 105454. [Google Scholar] [CrossRef]
- Barbier, E.B. The Economic Determinants of Land Degradation in Developing Countries. Philos. Trans. R. Soc. Lond. B Biol. Sci. 1997, 352, 891–899. [Google Scholar] [CrossRef]
- MacDonald, D.; Crabtree, J.R.; Wiesinger, G.; Dax, T.; Stamou, N.; Fleury, P.; Lazpita, J.G.; Gibon, A. Agricultural Abandonment in Mountain Areas of Europe: Environmental Consequences and Policy Response. J. Environ. Manag. 2000, 59, 47–69. [Google Scholar] [CrossRef]
- Searchinger, T.D.; Wirsenius, S.; Beringer, T.; Dumas, P. Assessing the Efficiency of Changes in Land Use for Mitigating Climate Change. Nature 2018, 564, 249–253. [Google Scholar] [CrossRef]
- Lark, T.J.; Hendricks, N.P.; Smith, A.; Pates, N.; Spawn-Lee, S.A.; Bougie, M.; Booth, E.G.; Kucharik, C.J.; Gibbs, H.K. Environmental Outcomes of the US Renewable Fuel Standard. Proc. Natl. Acad. Sci. USA 2022, 119, e2101084119. [Google Scholar] [CrossRef] [PubMed]
- Morimoto, T.; Munthali, K.; Murayama, Y. Land Use Changes and Agricultural Abandonment in the Hills of Nepal: A Case Study of the Mardi Watershed. Land 2022, 11, 1425. [Google Scholar] [CrossRef]
- Osawa, T.; Kohyama, K.; Mitsuhashi, H. Multiple Factors Drive Regional Agricultural Abandonment in Japan. Sci. Total Environ. 2016, 542, 478–483. [Google Scholar] [CrossRef]
- Yang, L.; Zhao, H.; Song, W.; Qian, J. Spatial-temporal Characteristics and Influencing Factors of Non-grain Cultivated Land in China. Chin. J. Soil Sci. 2025, 56, 301–309. [Google Scholar] [CrossRef]
- Liang, X.; Jin, X.; Sun, R.; Han, B.; Li, H.; Wang, X.; Gu, Z.; Chen, C.; Zhou, Y. A Typical Phenomenon of Cultivated Land Use in China’s Major Grain-Producing Areas: Taking Binzhou as an Example. Land 2023, 12, 1136. [Google Scholar] [CrossRef]
- Wu, N.; Wei, Y.; Li, L.; Yang, H. Spatial distribution of non-grain crops and formation mechanism: Empirical analysis of Ningling County, Henan Province. Prog. Geogr. 2023, 42, 1298–1310. [Google Scholar] [CrossRef]
- Li, J.; Fang, A.; Wu, K.; Zhao, H.; Chen, W.; Liu, H. Analysis of Spatial Differentiation Characteristics and Driving Factors of “Non-Grain” Cultivated Land in Henan Province. Chin. J. Agric. Resour. Reg. Plan. 2024, 45, 23–34. (In Chinese) [Google Scholar] [CrossRef]
- Yang, B.; Liu, F.; Chen, H.; Ji, G. Spatial-temporal differentiation and driving factors of non-grain production of cultivated land in Henan province from 2000 to 2020. Shanghai Land Resour. 2024, 45, 72–78. [Google Scholar] [CrossRef]
- Wu, Y.; Zhang, P.; Yu, Y.; Xie, R. Progress Review on and Prospects for Non-grain Cultivated Land in China from the Perspective of Food Security. China Land Sci. 2021, 35, 116–124. [Google Scholar] [CrossRef]
- Tang, T.; Wang, Y.; Yu, T.; Wen, S. Spatiotemporal Evolution and Driving Mechanisms of Non-Grain Production of Cultivated Land in County-Level Units of Heilongjiang Province from the Perspective of Grain Security. Chin. J. Agric. Resour. Reg. Plan. 2025. Available online: https://link.cnki.net/urlid/11.3513.S.20250715.1356.020 (accessed on 31 March 2025).
- Xijiri; Zhou, R.; Bao, B.; Burenjirigala. Spatiotemporal patterns and drivers of cultivated land conversion in Inner Mongolia Autonomous Region, northern China. J. Arid. Land 2024, 16, 1197–1213. [Google Scholar] [CrossRef]
- Qu, Y.; Wang, W.; Cui, Y.; Zhan, L.; Wang, D. Spatiotemporal change characteristics and driving mechanisms of “non-grain” production of cultivated land in China based on meta-analysis. Prog. Geogr. 2025, 44, 1559–1577. [Google Scholar] [CrossRef]
- Wang, Y.; Zeng, X.; Liu, Z.; Dong, S.; Jiang, Y. Determinants of the spatiotemporal differentiation of cultivated land non-grain conversion in Liaoning Province: The role of multiple stakeholder decisions. Resour. Sci. 2023, 45, 980–993. [Google Scholar] [CrossRef]
- Wu, D.; Wu, Z.; Li, S.; Liang, Y.; Ma, P.; Li, Z.; Lin, T. Spatiotemporal Evolution and Influencing Factors of Non-grain Cultivated Land in Northern Mountainous Areas of Guangdong Province. Econ. Geogr. 2023, 43, 144–153. [Google Scholar] [CrossRef]
- Wang, Y.; Song, D.; Liu, C.; Li, S.; Yuan, M.; Gong, J.; Yang, J. Spatial Correlation of Non-Agriculturalization and Non-Grain Utilization Transformation of Cultivated Land in China and Its Implications. Land 2025, 14, 1031. [Google Scholar] [CrossRef]
- Zhang, W.; Ma, L.; Wang, X.; Chang, X.; Zhu, Z. The Impact of Non-Grain Conversion of Cultivated Land on the Relationship between Agricultural Carbon Supply and Demand. Appl. Geogr. 2024, 162, 103166. [Google Scholar] [CrossRef]
- Ren, G.; Song, G.; Wang, Q.; Sui, H. Impact of “Non-Grain” in Cultivated Land on Agricultural Development Resilience: A Case Study from the Major Grain-Producing Area of Northeast China. Appl. Sci. 2023, 13, 3814. [Google Scholar] [CrossRef]
- Li, Y.; Zhao, B.; Huang, A.; Xiong, B.; Song, C. Characteristics and Driving Forces of Non-Grain Production of Cultivated Land from the Perspective of Food Security. Sustainability 2021, 13, 14047. [Google Scholar] [CrossRef]
- Liu, Y.; Shen, G.; He, T. Cropping and Transformation Features of Non-Grain Cropland in Mainland China and Policy Implications. Land 2025, 14, 561. [Google Scholar] [CrossRef]
- Yang, Q.; Zhang, D. The influence of agricultural industrial policy on non-grain production of cultivated land: A case study of the “one village, one product” strategy implemented in Guanzhong Plain of China. Land Use Policy 2021, 108, 105579. [Google Scholar] [CrossRef]
- Guan, X.; Wang, X.; Zhao, Y. Morphological Characteristics Identification and Optimization of “Non-grain” Cultivated Land along Yellow River Basin. Trans. Chin. Soc. Agric. Mach. 2021, 52, 233–242. [Google Scholar]
- Xu, C.; Guo, J.; Yi, J.; Ou, M. Analysis on the Evolution of Spatiotemporal Pattern and Driving Factors of Non-grain Cultivated Land in Jiangsu Province from 1996 to 2020. Resour. Environ. Yangtze Basin 2024, 33, 436–447. [Google Scholar]
- Su, Y.; Li, C.; Wang, K.; Deng, J.; Shahtahmassebi, A.R.; Zhang, L.; Ao, W.; Guan, T.; Pan, Y.; Gan, M. Quantifying the spatiotemporal dynamics and multi-aspect performance of non-grain production during 2000–2015 at a fine scale. Ecol. Indic. 2019, 101, 410–419. [Google Scholar] [CrossRef]
- Tang, T.; Wang, Y.; Wen, S.; Yu, T.; Liu, L.; Yang, H. Spatiotemporal Evolution and Driving Mechanisms of Non-Grain Production Rate of Planting Structure in Jilin Province from the Perspective of Grain Security. Land 2025, 14, 212. [Google Scholar] [CrossRef]
- Wang, L.; Xu, J.; Liu, Y.; Zhang, S. Spatial Characteristics of the Non-Grain Production Rate of Cropland and Its Driving Factors in Major Grain-Producing Area: Evidence from Shandong Province, China. Land 2023, 13, 22. [Google Scholar] [CrossRef]
- Su, Y.; Zhu, J.; Liu, X.; Zhu, C.; Yang, L.; Zhi, J.; Sun, H. Spatiotemporal Evolution Characteristics and Driving Mechanism of Non-Grain Production of Cultivated Land in Typical Counties of Central and Eastern China. Chin. J. Agric. Resour. Reg. Plan. Available online: https://link.cnki.net/urlid/11.3513.S.20250908.1353.004 (accessed on 8 September 2025).
- Zhang, Y.; Feng, Y.; Wang, F.; Chen, Z.; Li, X. Spatiotemporal differentiation and driving mechanism of cultivated land non- grain conversion in Guangdong Province. Resour. Sci. 2022, 44, 480–493. [Google Scholar] [CrossRef]
- Bo, H.; Shang, G.; Zhang, Y.; Zhang, Y.; Gao, J.; Guo, X. Analysis of spatial and temporal characteristics and driving factors of “non-grain” cultivated land in Hebei Province. Chin. J. Eco-Agric. 2025, 33, 960–972. [Google Scholar]
- Yang, J.; Zhang, G. Spatial Pattern and Driving Factors of Non grain Cultivated Land in Arid Northwest China: Take Xinjiang as an Example. Areal Res. Development. 2024, 43, 151–157. [Google Scholar]
- Wu, Y.; Xing, P.; Zheng, W.; Xia, X.; Zhang, C. Dynamic evolution and zoning control of cultivated land non-grain in grain production and marketing balance area: A case of Shaanxi Province. Arid. Land Geogr. 2025, 48, 153–167. [Google Scholar] [CrossRef]
- Zhan, W.; Wu, Y.; Zheng, W.; Zhang, H.; Zhang, B. Impacts of Changes of Multi-temporal Land Use/Landscape Patterns on Water Quality in the Yellow River Basin: An Empirical Study Based on Geographically Weighted Regression Modelling. Environ. Sci. 2025, 1–20. [Google Scholar] [CrossRef]
- Liu, L.; Liu, Y.; Deng, X.; Liu, L.; Tan, Z.; Cai, D. Spatiotemporal evolution and influencing factors of cultivated land use efficiency in Hunan Province. J. Agric. Resour. Environ. 2025, 1–13. [Google Scholar] [CrossRef]
- Shi, J.; Wu, X.; Dong, G. Spatial Pattern and Influencing Factors of Non-grain Cultivated Land in the Three River Basin (Yunnan Section). Acta Sci. Nat. Univ. Pekin. 2024, 60, 893–904. [Google Scholar]
- Niu, J.; Ma, Y.; Jin, P.; Zhang, M.; Shan, Y. Spatio-temporal differentiation and types of drivers of non-grain of arable land in food production and marketing balance areas. J. Agric. Resour. Environ. 2024, 41, 769–779. [Google Scholar]
- Chen, F.; Liu, J.; Chang, Y.; Zhang, Q.; Yu, H.; Zhang, S. Spatial Pattern Differentiation of Non-grain Cultivated Land and Its Driving Factors in China. China Land Sci. 2021, 35, 33–43. [Google Scholar]
- Tian, F.; Liu, C.; Zhang, H.; Ding, X. Study on the sensitivity of cultivated land multifunctionality to non-grain utilization in Hebei Province. Geogr. Geo-Inf. Sci. Available online: https://link.cnki.net/urlid/13.1330.P.20250804.1022.002 (accessed on 4 August 2025).
- Liu, H.; Du, X.; Dong, X. Study on the spatial-temporal differentiation and driving mechanism of non-grain cultivation in the black soil region of Northeast China. J. Shenyang Agric. Univ. 2025, 56, 44–55. [Google Scholar]
- Yuan, J. Study on Spatial-Temporal Evolution Characteristics and Driving Factors of Cultivated Land Non-Grain in Henan Province from 2000 to 2020. Master’s Thesis, Central China Normal University, Wuhan, China, 2024. [Google Scholar]
- Yang, C. Spatial-Temporal Characteristics and Driving Factors of Cultivated Land Non-Grain in the Eastern Henan Plain. Master’s Thesis, Northwest A&F University, Xi’an, China, 2024. [Google Scholar]
- Yuan, X. Study on the Coordinated Evaluation of the Non-Agricultural Pressure of Cultivated Land and the New Urbanization Time and Space in the Core Area of Grain Production. Master’s Thesis, East China University of Technology, Nanchang, China, 2019. [Google Scholar]
- Sun, H.; Li, E.; Zhang, S.; Cai, J. The Spatial-Temporal Pattern and Influencing Factors of Agricultural Industrial Agglomeration in Henan Province. J. Henan Univ. (Nat. Sci.) 2024, 54, 404–418. [Google Scholar]
- Fan, X.; Liu, J. Research on spatial-temporal characteristics of producer services in Henan Province: From regional and industry perspectives. J. Henan Univ. (Nat. Sci.) 2016, 46, 9–20. [Google Scholar]
- Guderjan, L.; Habel, J.C.; Schröder, B.; Schmitt, T. Land-use pattern and landscape structure impact butterfly diversity and abundance in organic agroecosystems. Landsc. Ecol. 2023, 38, 2749–2762. [Google Scholar] [CrossRef]
- Thien, B.B.; Phuong, V.T.; Kuznetsov, A.N. Examining the impact of land use and land cover changes on land surface temperature in Vientiane capital, Lao PDR using machine learning algorithms. Landsc. Ecol. Eng. 2025, 21, 593–617. [Google Scholar] [CrossRef]
Disclaimer/Publisher’s Note: The statements, opinions and data contained in all publications are solely those of the individual author(s) and contributor(s) and not of MDPI and/or the editor(s). MDPI and/or the editor(s) disclaim responsibility for any injury to people or property resulting from any ideas, methods, instructions or products referred to in the content. |
© 2025 by the authors. Licensee MDPI, Basel, Switzerland. This article is an open access article distributed under the terms and conditions of the Creative Commons Attribution (CC BY) license (https://creativecommons.org/licenses/by/4.0/).