Abstract
Guanling-Zhenfeng County, a microcosm of the ecologically fragile karst area in southwest China, experiences rapid population growth and urban expansion which intensifies land use transformation and ecological landscape fragmentation. Exploring the spatiotemporal characteristics of landscape fragmentation and its causes in Guanling-Zhenfeng County is of great significance in maintaining the stability of the ecosystem and ecological protection in karst areas. In this study, a comprehensive landscape fragmentation index (FI), geographic probe, multi-scale geographically weighted regression (MGWR), and PLUS model were used to quantitatively explore the spatiotemporal characteristic heterogeneity, causes, and future scenario projections of landscape fragmentation in Guanling-Zhenfeng County from 2000 to 2020. The results showed that: (1) the distribution of each landscape index was characterized by obvious spatial differentiation. Among them, the spatial distribution trends of patch density (PD) and largest patch index (LPI) were opposite and the distribution trends of Shannon diversity index (SHDI) and Shannon evenness index (SHEI) were similar. There were fewer heterogeneous patches in the study area from 2000 to 2020, and the landscape shape was more regular and less fragmented. (2) The overall landscape fragmentation in Guanling-Zhenfeng County from 2000 to 2020 was dominated by moderate fragmentation, with the smallest percentage of extreme fragmentation, and heavy fragmentation was mainly distributed in the north-central part of the study area. (3) Natural and social factors jointly affect the landscape fragmentation in Guanling-Zhenfeng County, and there is a significant interactive enhancement effect among the factors, with population density being the most important influence factor. In addition, the effects of the factors on landscape fragmentation showed significant spatial non-stationarity. (4) The characteristics of landscape fragmentation changes in Guanling-Zhenfeng County under different scenarios varied significantly, with the largest percentage of increase in heavy landscape fragmentation under the business-as-usual scenario (BAU), the next under the land use planning scenario (LUP), and the smallest under the ecological protection scenario (ESP).
1. Introduction
Since the 20th century, increasing warming has led to dramatic changes in the global ecological environment [1,2,3,4]. Accelerated urbanization and rapid population growth have exacerbated regional land use changes, which have a key role to play in the problems of climate change and landscape fragmentation [5,6,7]. Land use is considered to be one of the activities by which humans exert the greatest influence on the Earth’s land surface, with significant impacts on landscape ecosystems [8,9]. Types of land use form the basic structural units of landscape ecosystems, and the structural stability and functionality of landscapes are considered fundamental to maintaining the continued survival and development of human society [10]. When humans promote the transformation of landscape structure and function through land use, oftentimes this behavior will trigger the phenomenon of fragmentation of landscape patterns, and the self-regulation and restoration capacity of the landscape system will face great challenges and uncertainties [11]. Changes in landscape patterns induced by land use change provide a way to indirectly analyze subsequent changes in landscape fragmentation. Exploring landscape fragmentation and its spatiotemporal heterogeneity based on landscape pattern indicators helps to reveal the spatiotemporal pattern and differentiation mechanism of land use, and at the same time provides scientific support for the optimization of land use structure and the sustainable use of land resources.
Southwest China is the largest continuous karst region in the world, and in the context of its unique geological background (widespread distribution of carbonate rocks) and high degree of landscape heterogeneity, the combination of carbonate bedrock characteristics with geomorphology and other features has resulted in an extremely fragile ecosystem that is highly sensitive to changes in the external environment [12,13]. Guanling-Zhenfeng County is in the hinterland of the southwest karst area, with fragmented surface, poor regulation and water retention capacity [14]. Influenced and constrained by the special geological background and climatic conditions, ecological problems such as high rock exposure rate, shallow soil layer, serious soil erosion, etc. exist there, making it an ecologically fragile area [15]. The urbanization process has been accelerating in recent years, and the landscape pattern of Guanling-Zhenfeng County has undergone drastic changes, with the fragmentation of the landscape further aggravated, causing great impacts on the fragile karst ecosystem [16,17]. From the special geographic environment of the karst ecological fragile area, the analysis of spatiotemporal heterogeneity and causes of landscape fragmentation can not only effectively reveal the root causes of the ecological problems in the area, but also have a demonstrative and guiding significance in promoting the research on sustainable management of karst areas and other types of fragile ecological regions around the globe.
Landscape fragmentation has now become an international research hotspot in ecology and global environmental change. Research tendency converges on three aspects: assessment of spatial and temporal change of landscape fragmentation, factors driving landscape fragmentation, and impacts of landscape fragmentation [18,19,20,21,22,23,24,25,26,27,28,29,30]. In evaluating the degree of landscape fragmentation, scholars generally adopt the landscape pattern index method to characterize landscape fragmentation. For instance, Jiao et al. assessed the degree of fragmentation of the green space pattern in the Wuhan metropolitan area through a combination of primary and secondary landscape indicators [18]. Fu et al. revealed the spatiotemporal change of landscape fragmentation in the watershed by selecting a suitable landscape index [19]. Some scholars have also adopted the moving window approach to assess landscape fragmentation [20,21,22]. Previous studies on the drivers of landscape fragmentation have tended to focus on both natural and socioeconomic factors [23,24]. In addition, without considering the spatial heterogeneity of landscape fragmentation, many scholars have integrated and analyzed landscape fragmentation with urbanization, land use, climate, and other factors based on ecological and environmental perspectives, which provides valuable suggestions for ecosystem service management [25,26]. Simultaneously, research on the impacts of landscape fragmentation covers a wide range of fields, and tends to explore the impacts of landscape fragmentation on ecosystem services, habitat quality, and biodiversity [25,27,28].
Summarizing previous studies, research on landscape fragmentation has concentrated on the use of single landscape pattern indicators to characterize landscape fragmentation. It also has a weak research base for predicting future scenarios of landscape fragmentation, which is not conducive to the development of long-term sustainable ecological conservation strategies. Moreover, due to the difficulty of data acquisition and the complexity of technical methods, relatively few systematic studies have been conducted on the spatial and temporal heterogeneity and causes of landscape fragmentation in the karst region of Southwest China. Therefore, a comprehensive landscape fragmentation index (FI), geographic probe, multi-scale geographically weighted regression (MGWR), and PLUS model were used to quantitatively explore the spatiotemporal characteristic heterogeneity, causes, and future scenario projections of landscape fragmentation in Guanling-Zhenfeng County from 2000 to 2020. The research objectives of the paper are: (1) to assess and analyze the spatiotemporal heterogeneity of landscape fragmentation in Guanling-Zhenfeng County from 2000 to 2020, (2) to investigate the driving mechanisms affecting landscape fragmentation in the study area, and (3) to simulate land use changes in Guanling-Zhenfeng County under different scenarios from 2000 to 2060 and reveal the trends of landscape fragmentation at all levels as well as the spatial distribution.
2. Materials and Methods
2.1. Study Area
Guanling County (105°15′–105°49′ E, 25°19′–26°05′ N) is located in the slope area of the eastern Yunnan-Guizhou Plateau on the south side of the ridged slope tilting toward the Guangxi hills, with the terrain high in the northwest and low in the southeast. The terrain varies greatly (370–1850 m), and the mountains often undulate and roll. Zhenfeng County (105°25′–105°56′ E, 25°07′–25°44′ N) is located in the southwestern part of Guizhou Province, on the banks of the Beipanjiang River in the upper reaches of the Pearl River, belonging to the Buyi and Miao Autonomous Prefecture of Qianxinan, and bordering with Guanling and other counties to the north. As of the end of 2021, Guanling and Zhenfeng counties (hereinafter referred to as “Guanling-Zhenfeng Country”) (Figure 1) had a total population of more than 840,000 and a total area of 2979.9 km2. In recent years, rapid population growth and urban expansion in Guanling-Zhenfeng County have exacerbated land use transformation and ecological landscape fragmentation. At the same time, the region is a typical karst rocky desertification (refer to the loss of surface soil, exposure of bedrock, loss of agricultural use of land and ecological degradation due to soil erosion) mountainous area with high and low relief, complex and diverse types of landforms, extensive distribution of carbonate rocks, and serious soil erosion. This study will provide a scientific basis and reference for the overall development planning, regional ecological protection planning, and the formulation of relevant land use policies in the fragile karst ecosystems of southwest China.
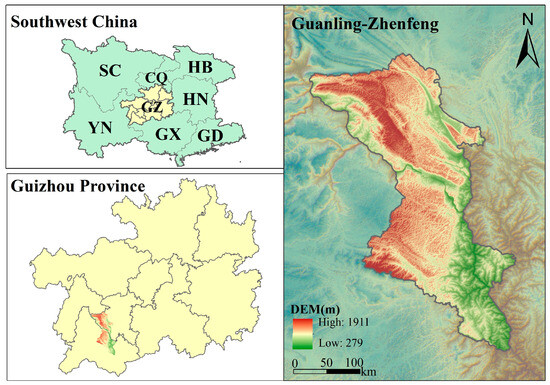
Figure 1.
Location map of Guanling-Zhenfeng County. Among them, the karst areas of Southwest China include eight provinces: SiChuan—SC, YunNan—YN, GuangXi—GX, GuangDong—GD, HuNan—HN, HuBei—HB, and ChongQing—CQ.
2.2. Data Sources and Processing
LULC data (2000, 2010, 2020) were obtained from the Globeland 30. Global geographic information public goods and were divided into five categories: cropland, forest, grassland, water, and building. To verify the accuracy and dependability of LULC data, we integrated Google Maps and field survey data. The findings revealed that the overall classification of LULC data was 84% accurate, and the kappa coefficient was more than 0.80, which meets research requirements. Other sources of data used in this study and more detailed information can be found in Table 1.

Table 1.
Sources of data for the study.
2.3. Research Methods
2.3.1. Landscape Pattern Analysis
Quantitative analysis of landscape patterns and exploration of the dynamic characteristics of landscape pattern changes are the basis for studying the interaction between landscape pattern changes and ecological processes [29]. In the process of landscape pattern analysis, the landscape index is usually chosen for quantitative analysis. In this study, according to the special characteristics of the karst region in Southwest China, with reference to the theory of landscape ecology, the patch density (PD), largest patch index (LPI), landscape shape index (LSI), area-weighted mean shape index (AWMSI), aggregation index (AI), separation index (DIVISION), Shannon evenness index (SHEI), and Shannon diversity index (SHDI) were used as seven indicators to quantify the characteristics of change of landscape fragmentation in the study area from 2000 to 2020, and the calculation methods and descriptions are detailed in the literature [30].
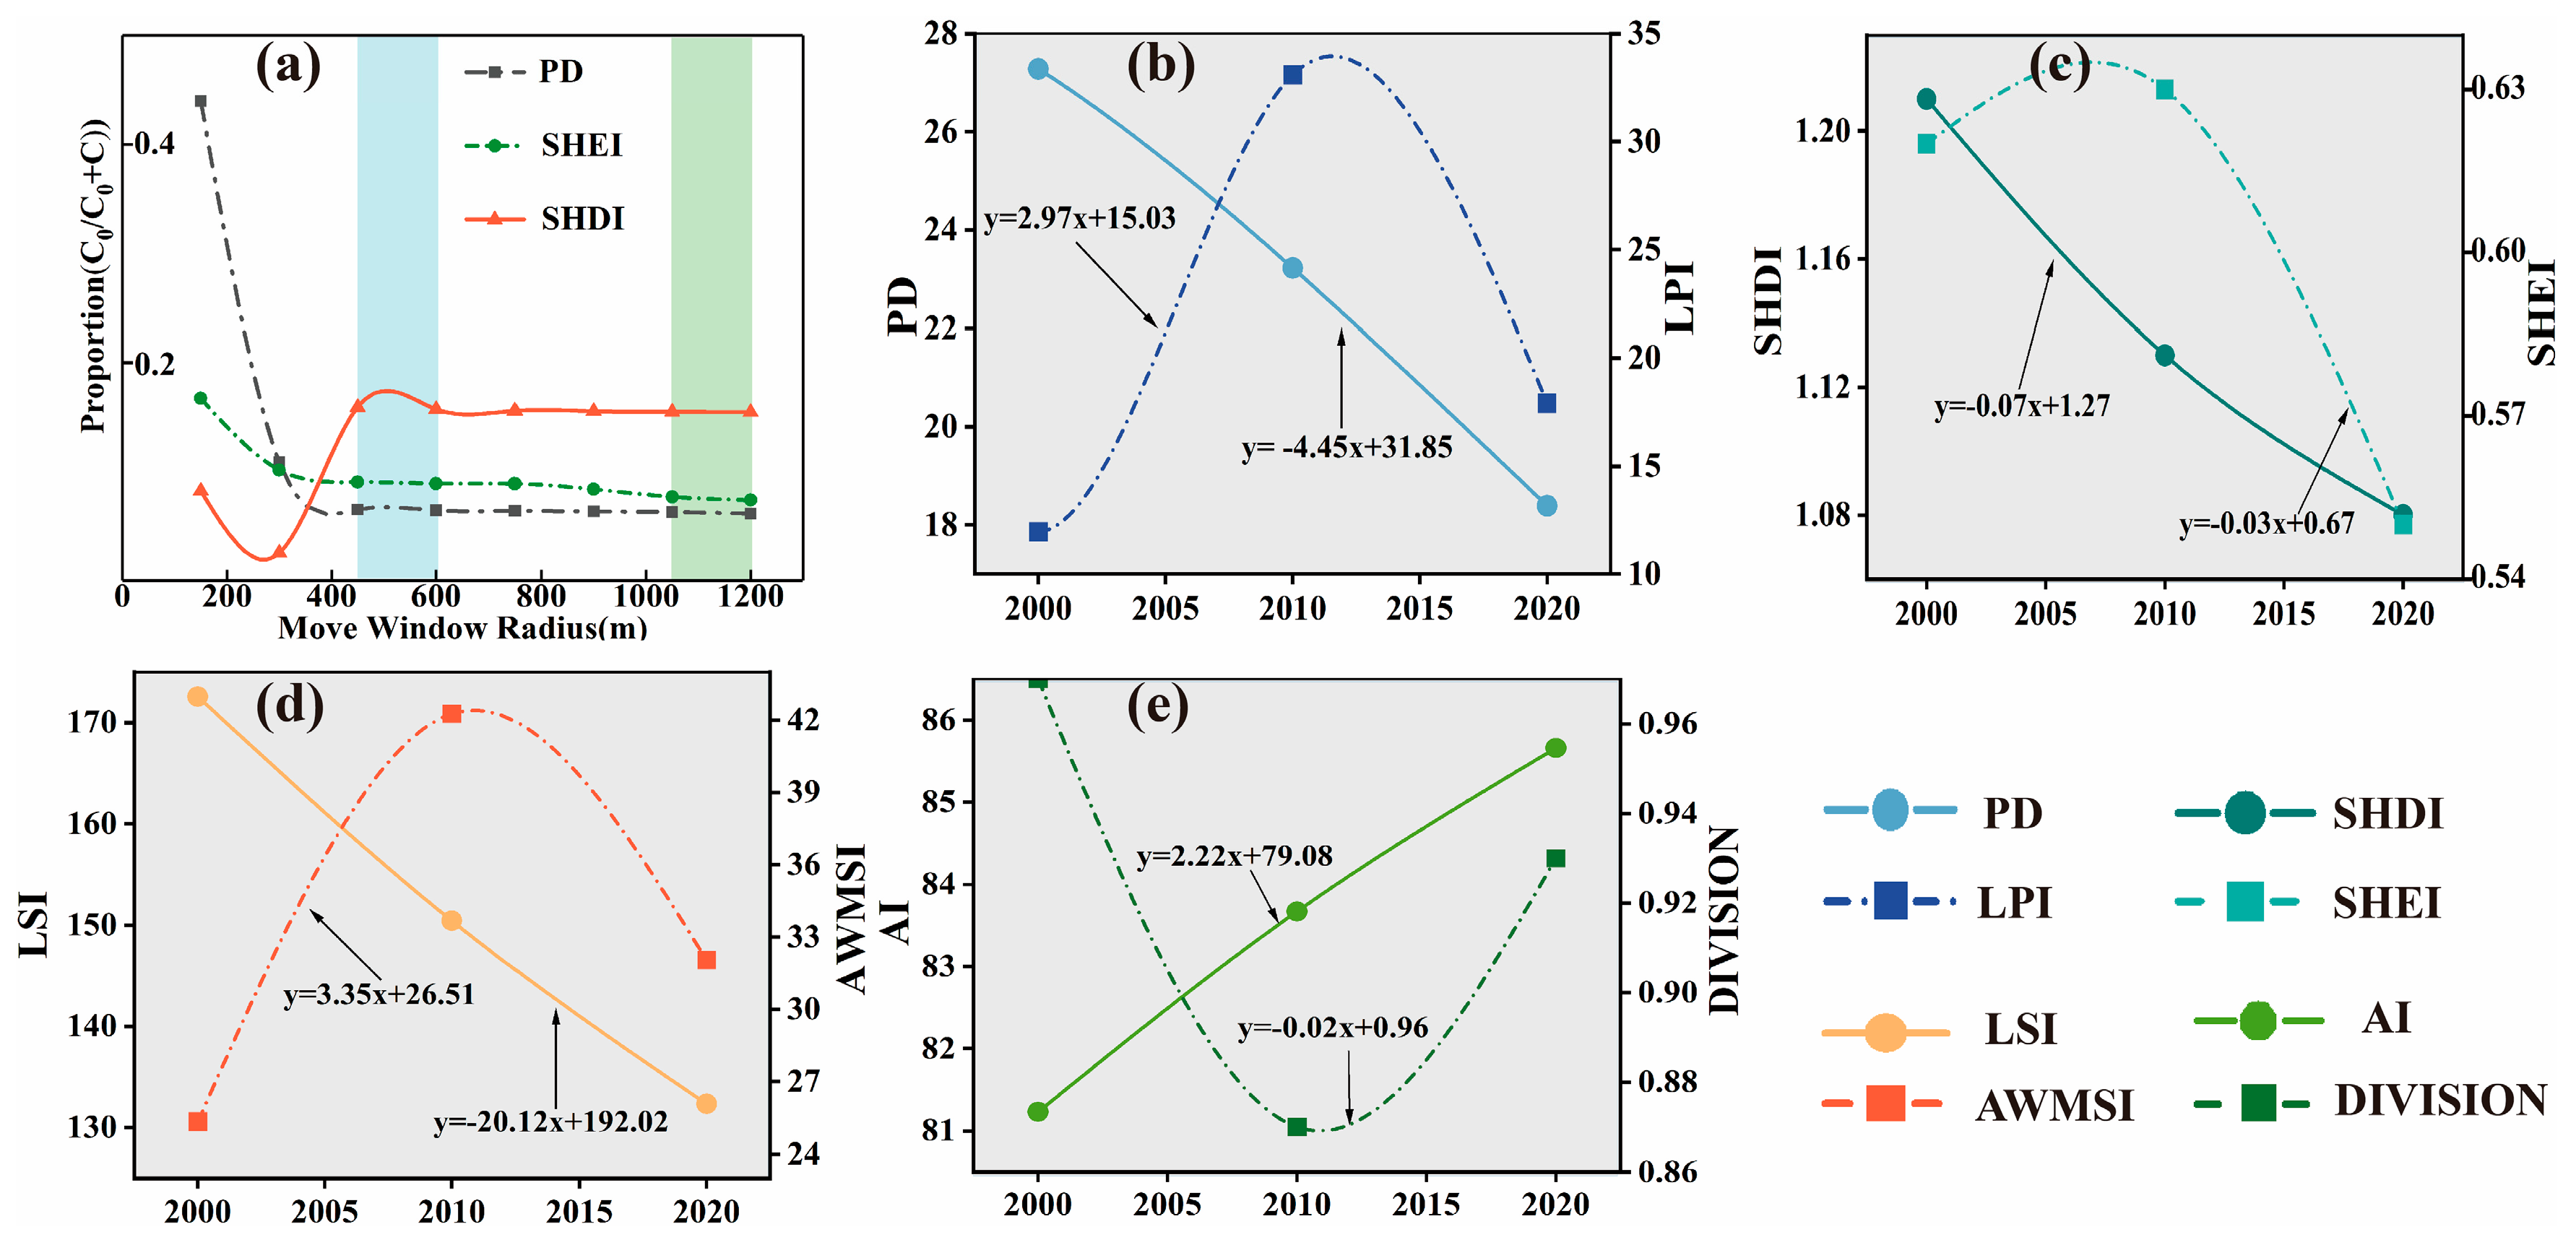
As the landscape pattern index is scale-dependent, a spatial scale that is too large/small cannot accurately reflect the regional landscape characteristics [31]. Based on Fragstats4.2, ArcGIS10.3, and GS+9.0 software interoperation and referring to existing studies [32], three landscape pattern indices, SHDI, SHEI, and PD, were selected for moving window analysis, and GS+9.0 geostatistics software was used to simulate different moving windows. The semi-variance function of landscape fragmentation under different moving window radii was used to analyze the response of the spatial characteristics of landscape indices to scale through the change pattern of the block–base ratio. The semivariance function is calculated as follows:
where h is the target spatial distance, Z(xi) and Z(xi + h) are the values of Z(x) on xi and xi + h, N(h) is the total number of sample pairs. In Figure 2a the basic parameters include the block gold value CO, partial abutment value C+CO and block base ratio CO/(C + CO). The block–basis ratio can reflect the high or low spatial variability of the variables. The smaller the value is, the higher the spatial correlation is and the more stable the spatial structure is [29]. When the block–basis ratio reaches relative stability, it indicates that the degree of variability of spatial variables is low, indicating that this scale is the optimal window radius used to characterize the landscape index of the study area.
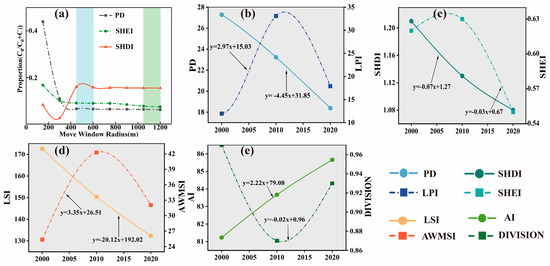
Figure 2.
(a) Landscape pattern index semi-cartogram plot and temporal trends in landscape indices of study area (b–e).
2.3.2. Landscape Fragmentation Index Construction
There is regularity and variability in the changes of landscape fragmentation indices at regional spatial scales, and the distribution of spatial and temporal heterogeneity of landscape fragmentation within the whole region cannot be better characterized among the indices. Constructing a comprehensive index of landscape fragmentation has been effective in addressing this problem [10,33]. Consequently, in this study, a comprehensive landscape fragmentation index was constructed to characterize the degree of landscape fragmentation in Guanling-Zhenfeng County. The expressions are:
where FI is the integrated fragmentation index and PDnor, LPInor, LSInor, DIVISIONnor, AMMSInor, AInor, SHDInor, and SHEInor are the normalized values.
Entropy value is a measure of the degree of disorder or chaos of the system. Information is interpreted as a reduction in the degree of disorder of the system—the greater the entropy value of the system, the smaller the amount of information it contains. The basic idea of the entropy method for determining objective weights is that if the data sequence of an attribute has greater variation, its corresponding weight coefficient will be greater [34]. The steps for determining the weighting coefficients are as follows:
Set the multi-attribute decision-making problem with m decision-making scenarios (denoted as S = {S1, S2, …, Sm}) and n attributes (denoted as C = {C1, C2, …, Cn}); and set the attribute values of scenarios Si and attributes Cj to bij.
- (1)
- For normalized decision matrices B = (bij)m × n, make:
- (2)
- The information entropy value of the attribute output is:when pij = 0, it is specified that pij ln pij = 0, then: 0 ≤ hj ≤ 1.
- (3)
- Calculation of the coefficient of variation of the attribute dj:
- (4)
- Calculating attribute weighting coefficient:
The weighting coefficients a, b, c, d, e, f, g, and h corresponding to the above eight landscape fragmentation indices were finally determined to be 0.2186, 0.091, 0.1277, 0.1808, 0.061, 0.0556, 0.1492 and 0.1161, respectively. Meanwhile, the composite landscape fragmentation index of the study area was divided into five classes at equal intervals: micro-fragmentation (0, 0.2), slight fragmentation (0.2, 0.4), moderate fragmentation (0.4, 0.6), heavy fragmentation (0.6, 0.8), and extreme fragmentation (0.8, 1) [35,36].
2.3.3. Geographic Probe
The study used a geodetector model to measure the causes of landscape fragmentation in Guanling-Zhenfeng County. The model mainly consists of factor detections, interaction detection, ecological detection, and risk detection [15]. This paper is based on previous studies combined with the special geomorphology and data availability of the study area [7,37,38,39,40,41]. The elevation (X1), slope (X2), aspect (X3), lithology (X4), soil type (X5), population density (X6), and distance from the road (X7) were selected as the main influence factors to explore the causes of spatial fragmentation of the landscape. Each driver was discretized by ArcGIS10.3 and used as the independent variable of the geodetector. The calculation formula is as follows [37]:
where q is an indicator of the detectability of landscape pattern influencing factors, the interval is (0, 1), and the larger the value of q is, the stronger the heterogeneity of spatial stratification is. The value of 0 indicates that the factor is irrelevant to the influence of landscape fragmentation. n and σ2 are the sample size and variance, respectively. i denotes the partition (i = 1, 2, 3, …, L). The interaction types of the interaction detectors are shown in Table 2.
Table 2.
Interaction type of interaction detector.
2.3.4. Multiscale Geographically Weighted Regression Model
Traditional regression methods such as ordinary least squares (OLS) assume that regression parameters remain spatially constant, ignoring spatial heterogeneity among geographic relationships. However, spatial heterogeneity is inherent in the process of landscape fragmentation [10,25]. Geographically weighted regression (GWR) considers and estimates regression results for spatial variation and has advantages in explaining the spatially heterogeneous relationships between response variables and explanatory variables, however it uses a fixed bandwidth and does not consider the role of spatial scale in this process [42,43]. Compared with GWR, the multiscale geographically weighted regression (MGWR) model adds spatially smooth variables to GWR, allowing different processes to operate at different spatial scales as well as selecting independent bandwidths for the optimization of the respective variables. This makes the model results closer to the real situation and credible. The MGWR model expression is as follows [44]:
where (ui, γj) denotes the spatial location of sample i, j denotes the number of samples, xi denotes the explained value of the independent variable of sample i, xij denotes the observed value of independent variable j at location i, aj is the regression coefficient of the global variable, βj is the regression coefficient of the local variable, and εi denotes the random error term.
2.3.5. PLUS Model
To better assess and predict future land use changes, various land use simulation models have been developed such as CLUE-S, Cellular Automata CA (Cell Automata), FLUS, and CA-Markov models [44,45,46,47]. These models are usually linear and quantitative based, and cannot consider all land use change processes. The PLUS model is more advantageous using the rule mining framework of the land extension analysis strategy (LEAS) and the random forest-based multitype meta-cellular automata model. In addition, it provides good insight into the potential influence factors of land use change under different future scenarios [7].
Setting multiple scenarios to predict regional landscape fragmentation can help to understand the mechanisms and influencing factors of landscape fragmentation and provide decision makers with different perspectives to formulate scientific and effective ecological protection policies [48]. In this paper, based on the PLUS model and land use simulation data in the study area, we set up a business-as-usual (BAU), land use planning (LUP), and ecological protection (ESP) scenario with reference to existing studies [49,50]. The spatiotemporal patterns of landscape fragmentation in Guanling-Zhenfeng County in 2030 and 2060 were investigated under different scenarios of carbon peak (2030) and carbon neutral (2060).
3. Results
3.1. Characteristics of Landscape Pattern Change
The block–base ratios of the PD- and SHEI-indices decreased with increasing window radii (Figure 2a), and the block–base ratios changed more when the ratio was 150–300 m. The block–base ratios of the SHDI-indices showed a fluctuating change (relatively stable) trend, and the change trend of the block–base ratios of all three indices tended to level off after reaching 450 m. Therefore, 450 m was chosen as the characteristic analysis scale of the landscape pattern in the study area.
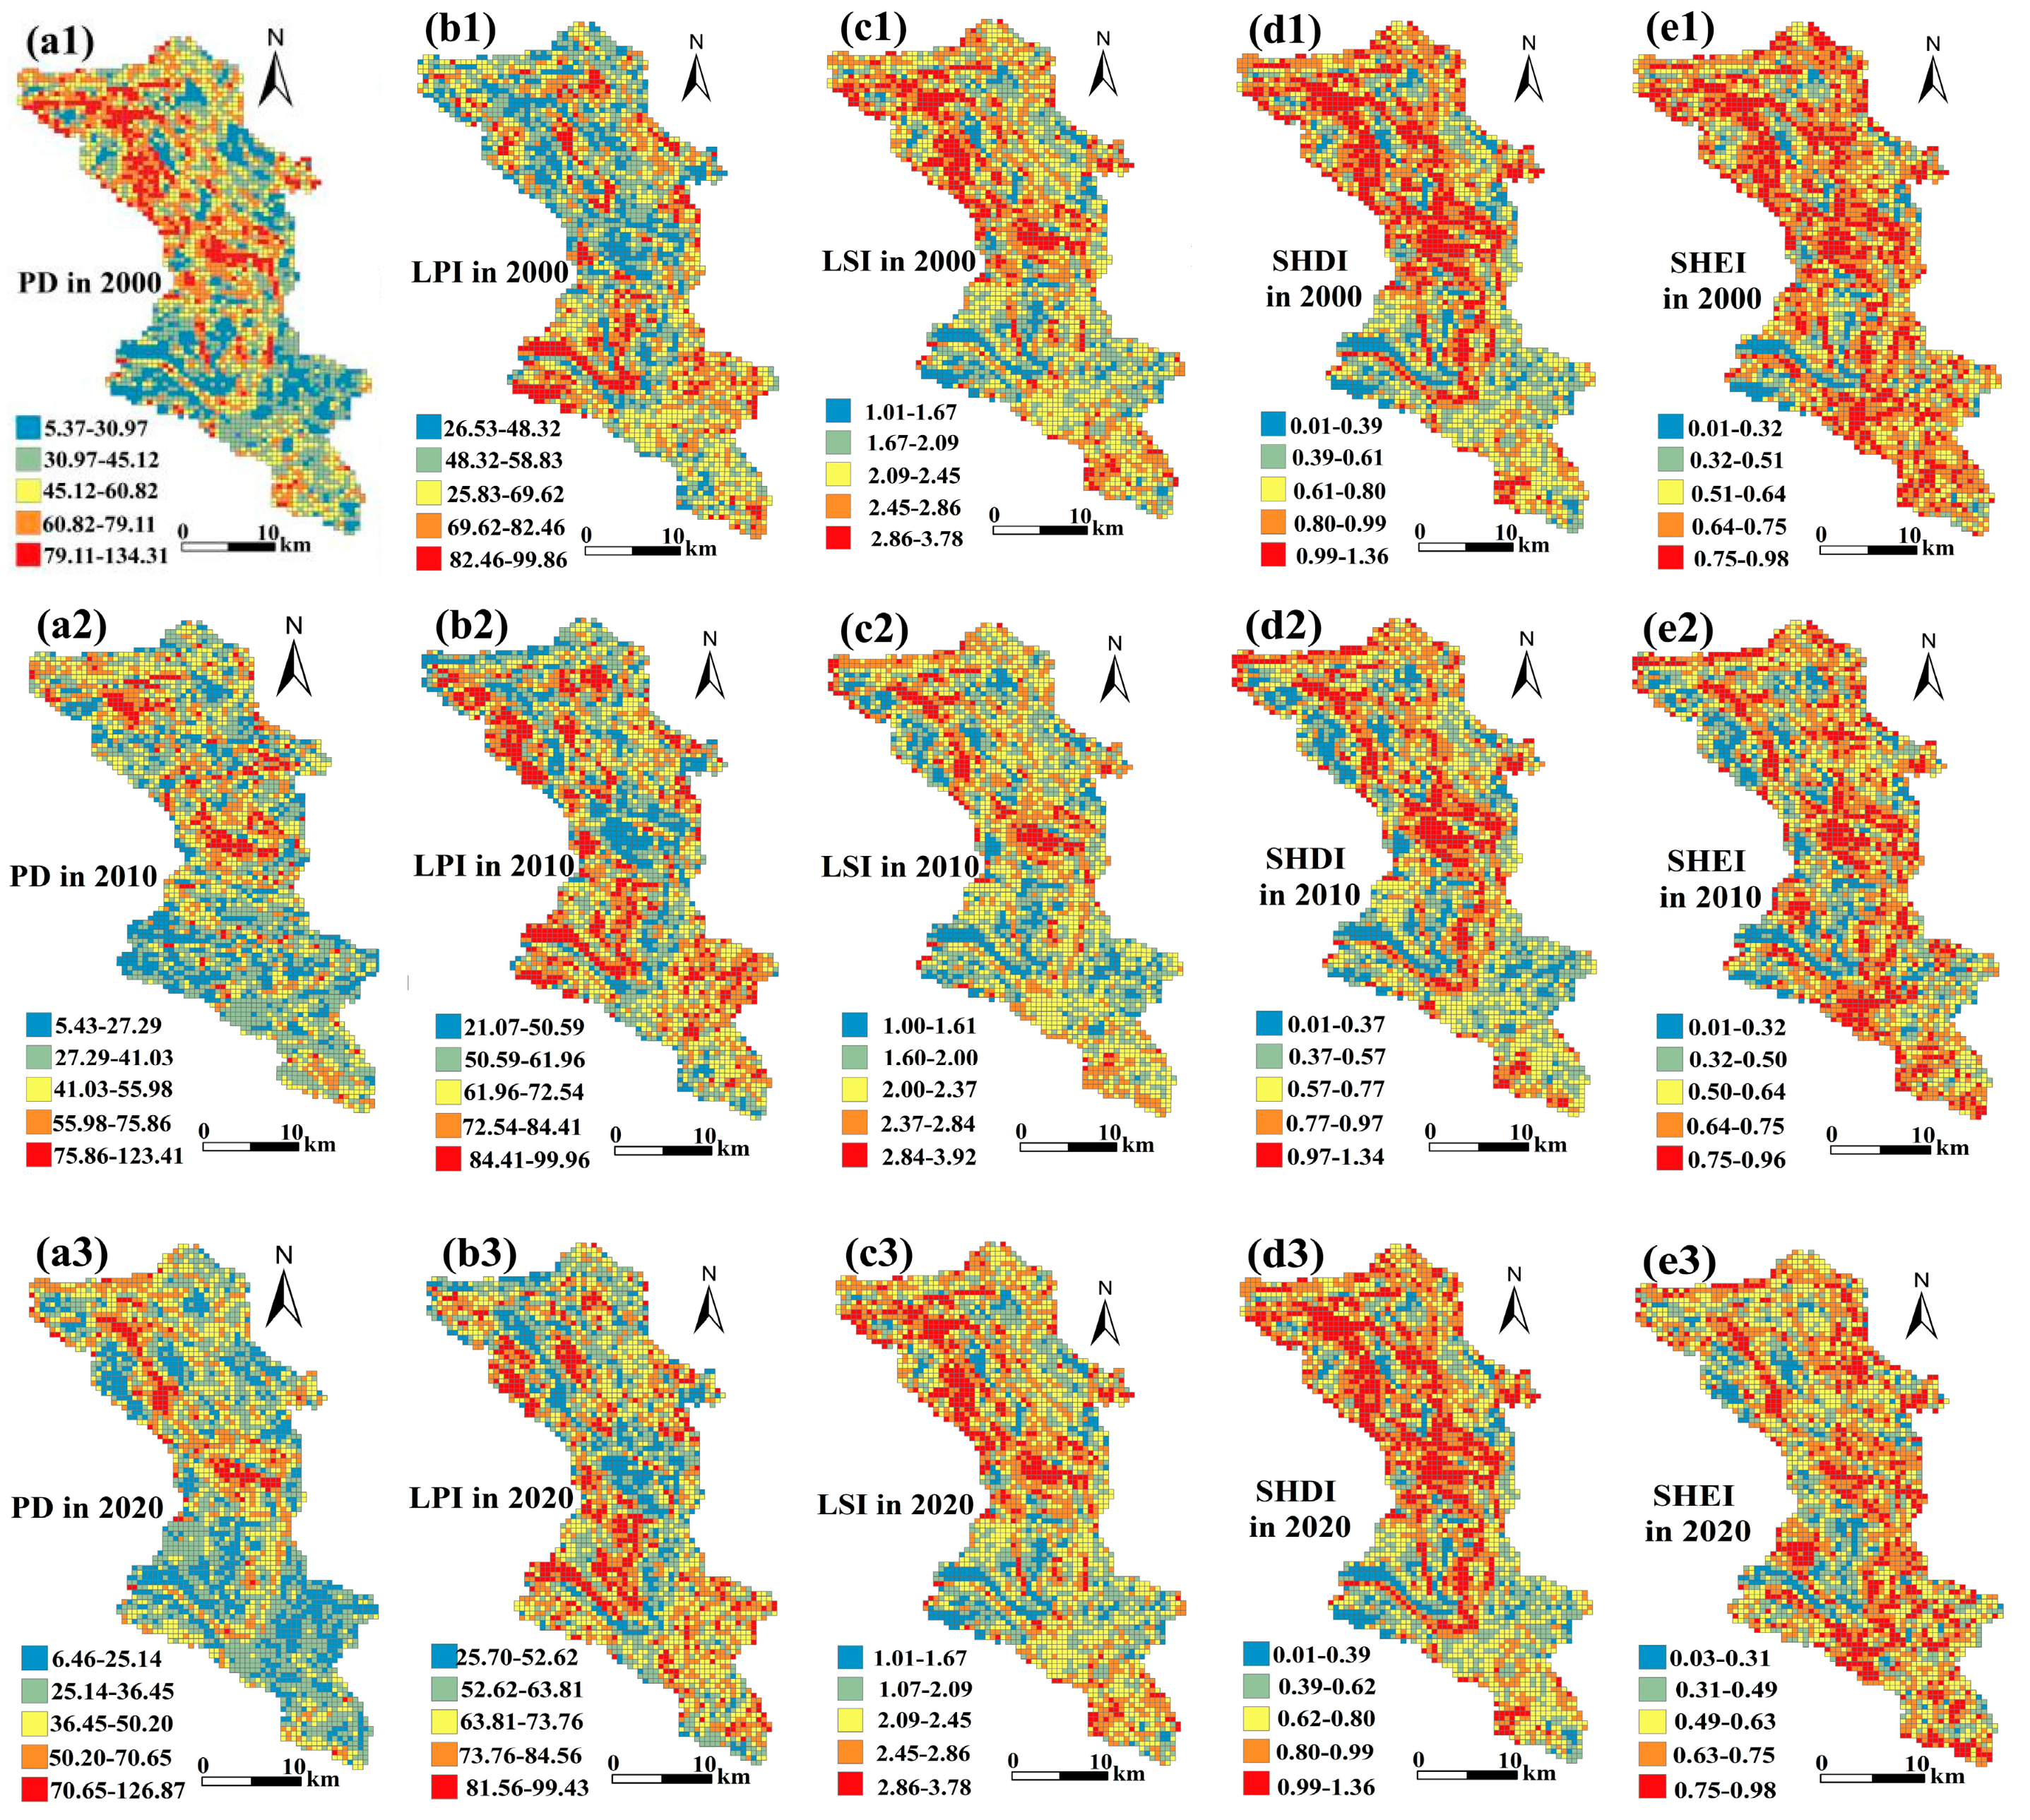
During the study period, largest patch index (LPI), area-weighted mean shape index (AWMSI), and Shannon evenness index (SHEI) increased and then decreased. Patch density (PD), landscape shape index (LSI), and Shannon diversity index (SHDI) decreased year by year, aggregation index (AI) continued to increase, and separation index (DIVISION) decreased and then increased (Figure 2b–e). Landscape fragmentation is influenced by both the natural environment and human activities, and the analysis of changes in the degree of landscape fragmentation based on the grid perspective is conducive to further analysis of the influence of anthropogenic activity and natural factors (Figure 3(a1–e3)). From the spatial scale, the distribution of the selected landscape indices has obvious spatial differentiation characteristics. Among them, the spatial distribution of patch density (PD) and largest patch index (LPI) was opposite, while the distribution trend was similar to that of the landscape shape index (LSI) (Figure 3(a1,b1,c1)). High-value areas of PD and LSI and low-value areas of LPI are mainly distributed in the north-central part of the study area. The distribution trends of the SHDI and SHEI indices are similar (Figure 3(d1,e1)) and the high-value areas are widely distributed in the study area, however the overall trend is decreasing, indicating that the study area is occupied by some landscape types with higher dominance from 2000 to 2020, with fewer heterogeneous patches, more regular landscape shapes, and less fragmentation.
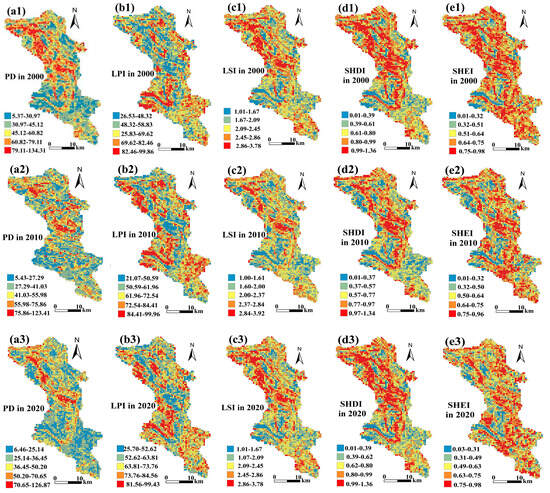
Figure 3.
Spatiotemporal changes of landscape pattern indices in Guanling-Zhenfeng County from 2000 to 2020. (a1–a3, b1–b3, c1–c3, d1–d3 and e1–e3) respectively represent the spatial distribution maps of landscape indices PD, LPI, LSI, SHDI and SHEI in corresponding years.
3.2. Analysis of the Spatiotemporal Pattern of the Composite Index of Landscape Fragmentation
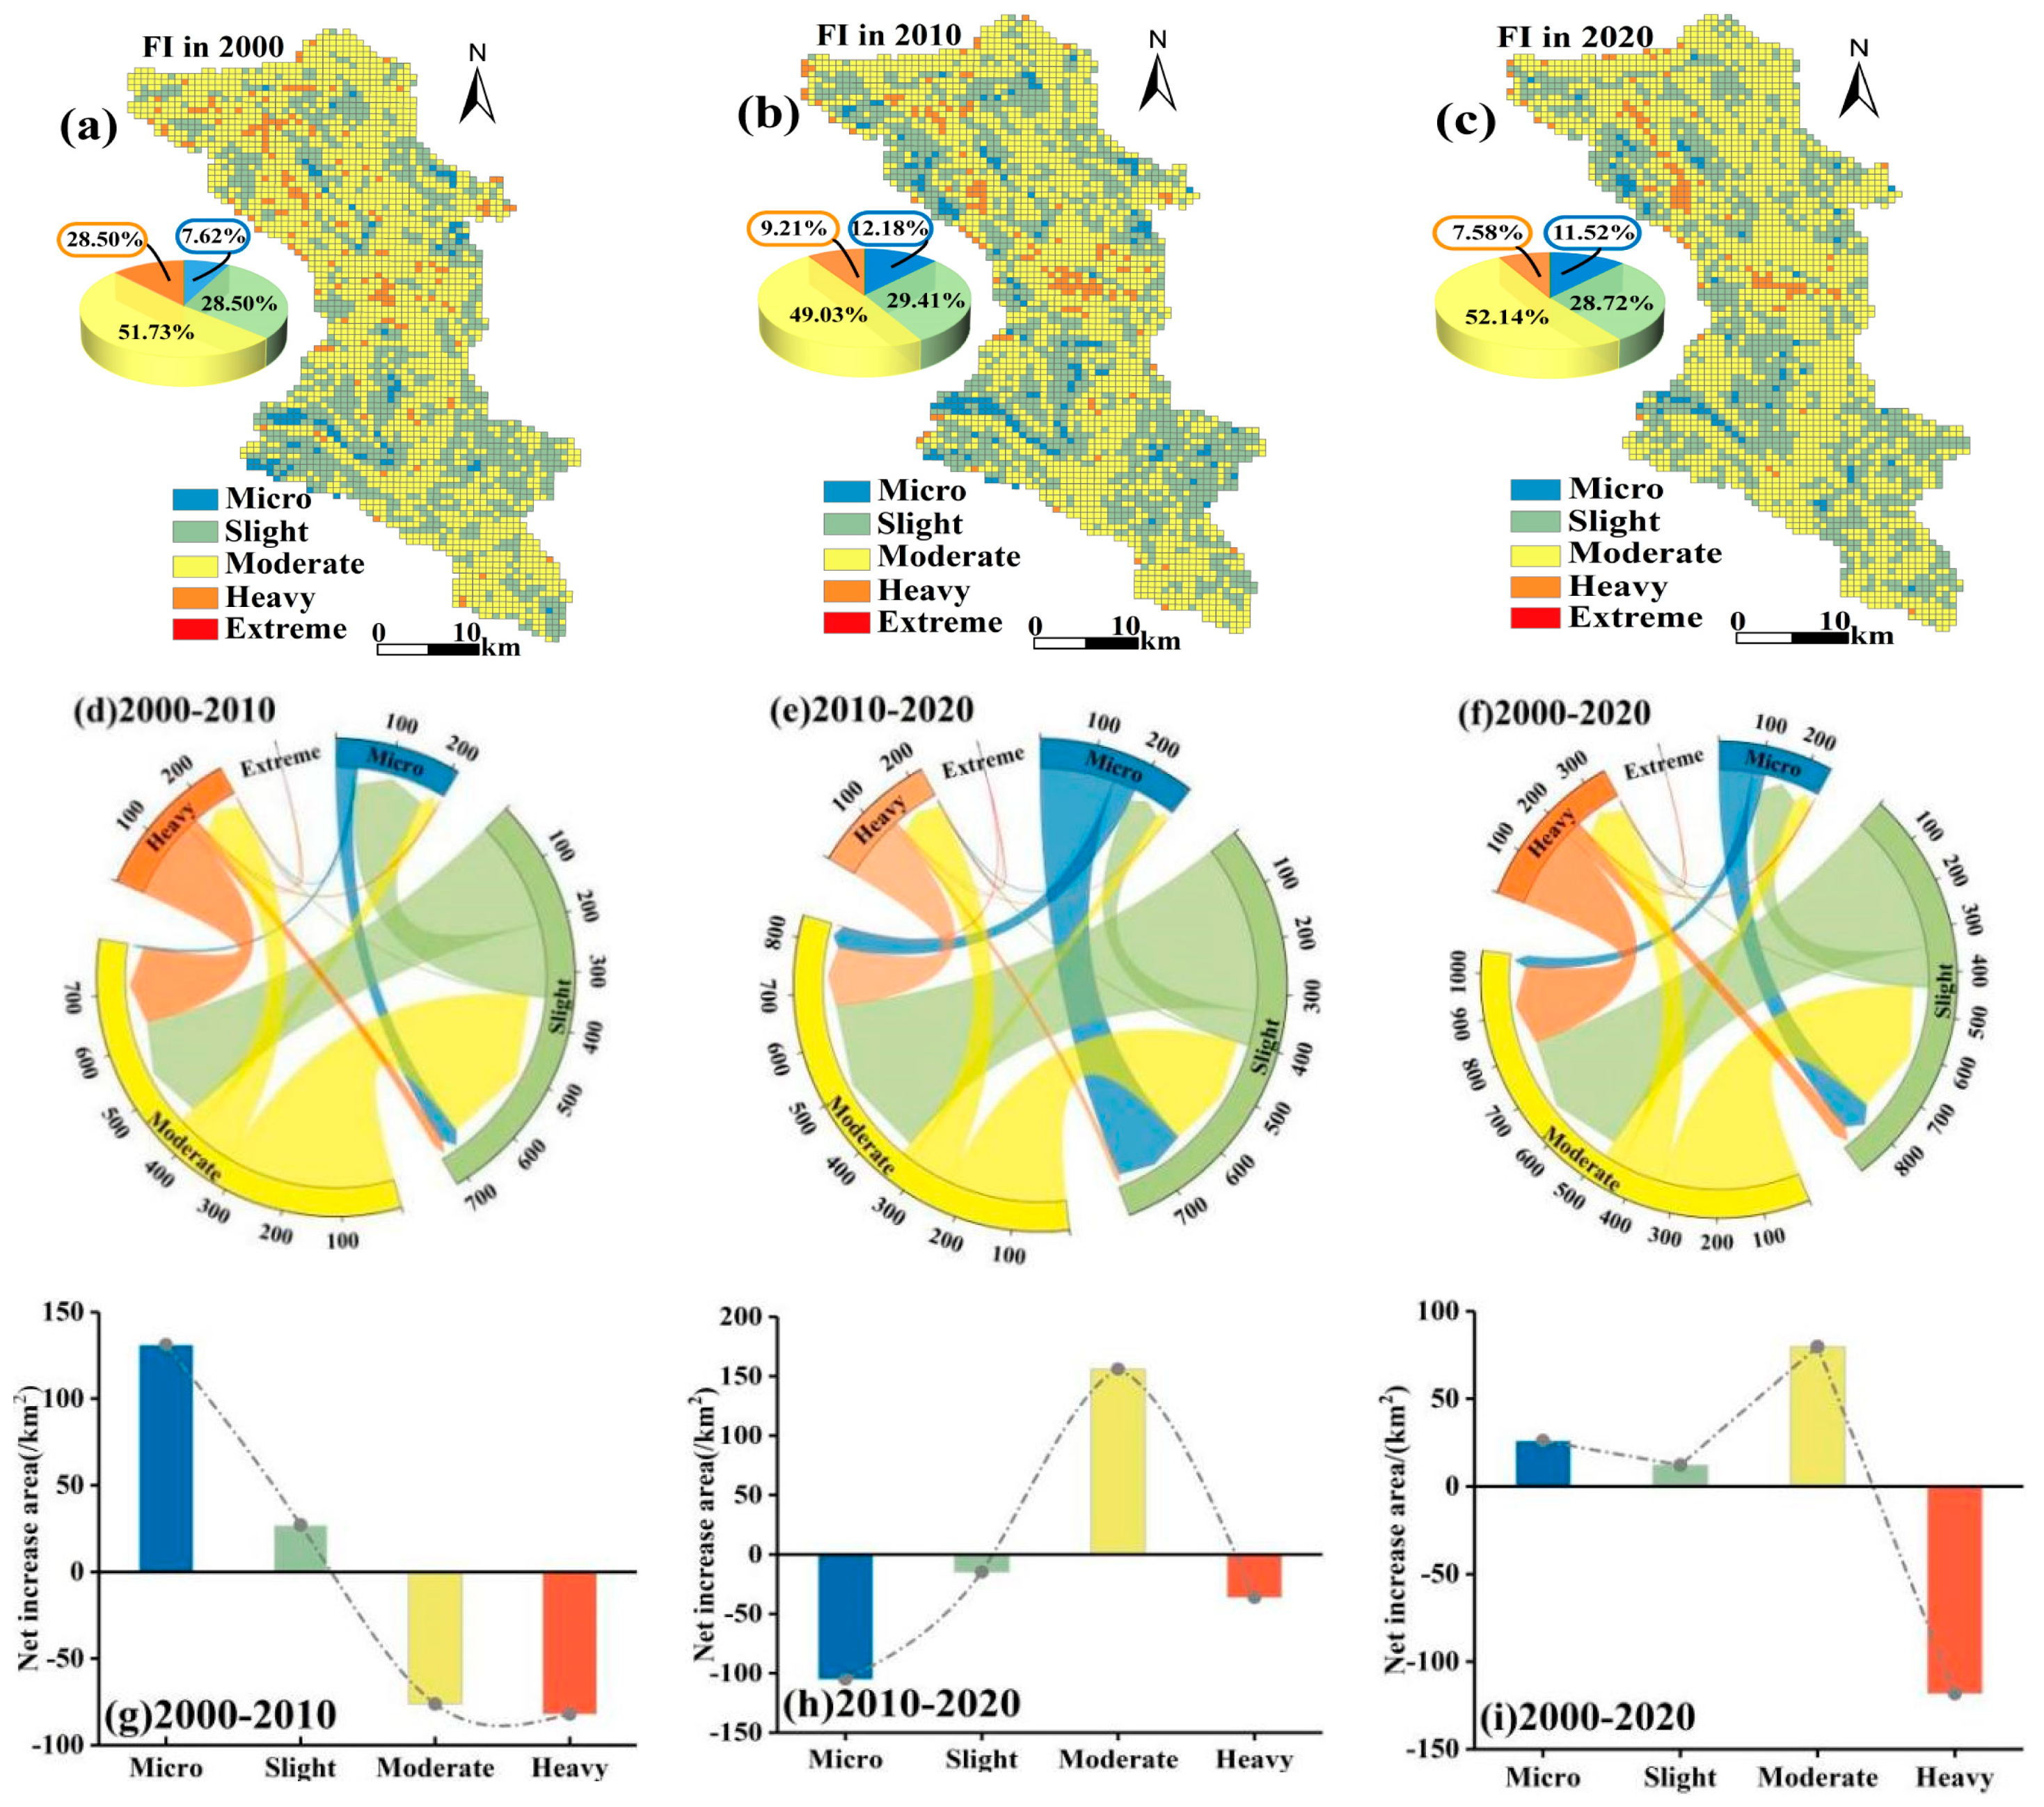
The overall landscape fragmentation in Guanling-Zhenfeng County from 2000 to 2020 was dominated by moderate fragmentation, and the proportion of moderate fragmentation grade in the total area of the study area was 51.73%, 49.03%, and 52.14% in 2000, 2010, and 2020, respectively (Figure 4a–c). The proportion of extreme fragmentation was the smallest. With the change in time, the landscape fragmentation in the study area showed a trend of decreasing the area of heavy and extreme fragmentation and increasing the area of slight and moderate fragmentation. Heavy fragmentation was mainly distributed in the north-central part of the study area, and moderate fragmentation was widely distributed in the study area. From 2000 to 2010, moderate and heavy fragmentation showed a decreasing trend, and slight and light fragmentation showed an increasing trend. Micro fragmentation increased the most, and moderate fragmentation mainly shifted to light fragmentation (Figure 4d,g). Compared with the previous period, only moderate fragmentation showed an increasing trend from 2010 to 2020, and the areas contributed by micro, light, and heavy fragmentation were 44.34 km2, 334.28 km2, and 118.91 km2, respectively (Figure 4e,h). In the period between 2000 and 2020, the three layers of slight, light, and moderate fragmentation showed an increasing trend, and moderate fragmentation increased significantly in most areas. Heavy fragmentation showed a decreasing trend, with a decrease in area of 118.20 km2.
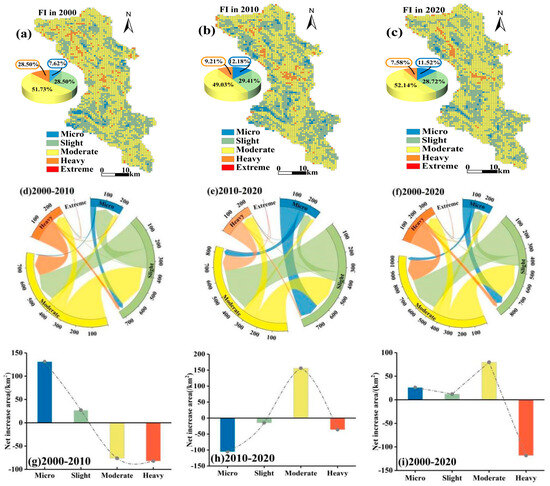
Figure 4.
Spatiotemporal distribution of the integrated index of landscape fragmentation: (a–c) are the distribution maps of the integrated index of fragmentation of each grade in Guanling−Zhenfeng County in 2000, 2010, and 2020, respectively; (d–i) are the chordal maps of the integrated index of fragmentation transfer of each grade in 2000–2010, 2010–2020, and 2000–2020, respectively, and the net increase in area transferred in the corresponding time periods.
3.3. Exploring the Causes of Landscape Fragmentation and Spatial Nonsmoothness
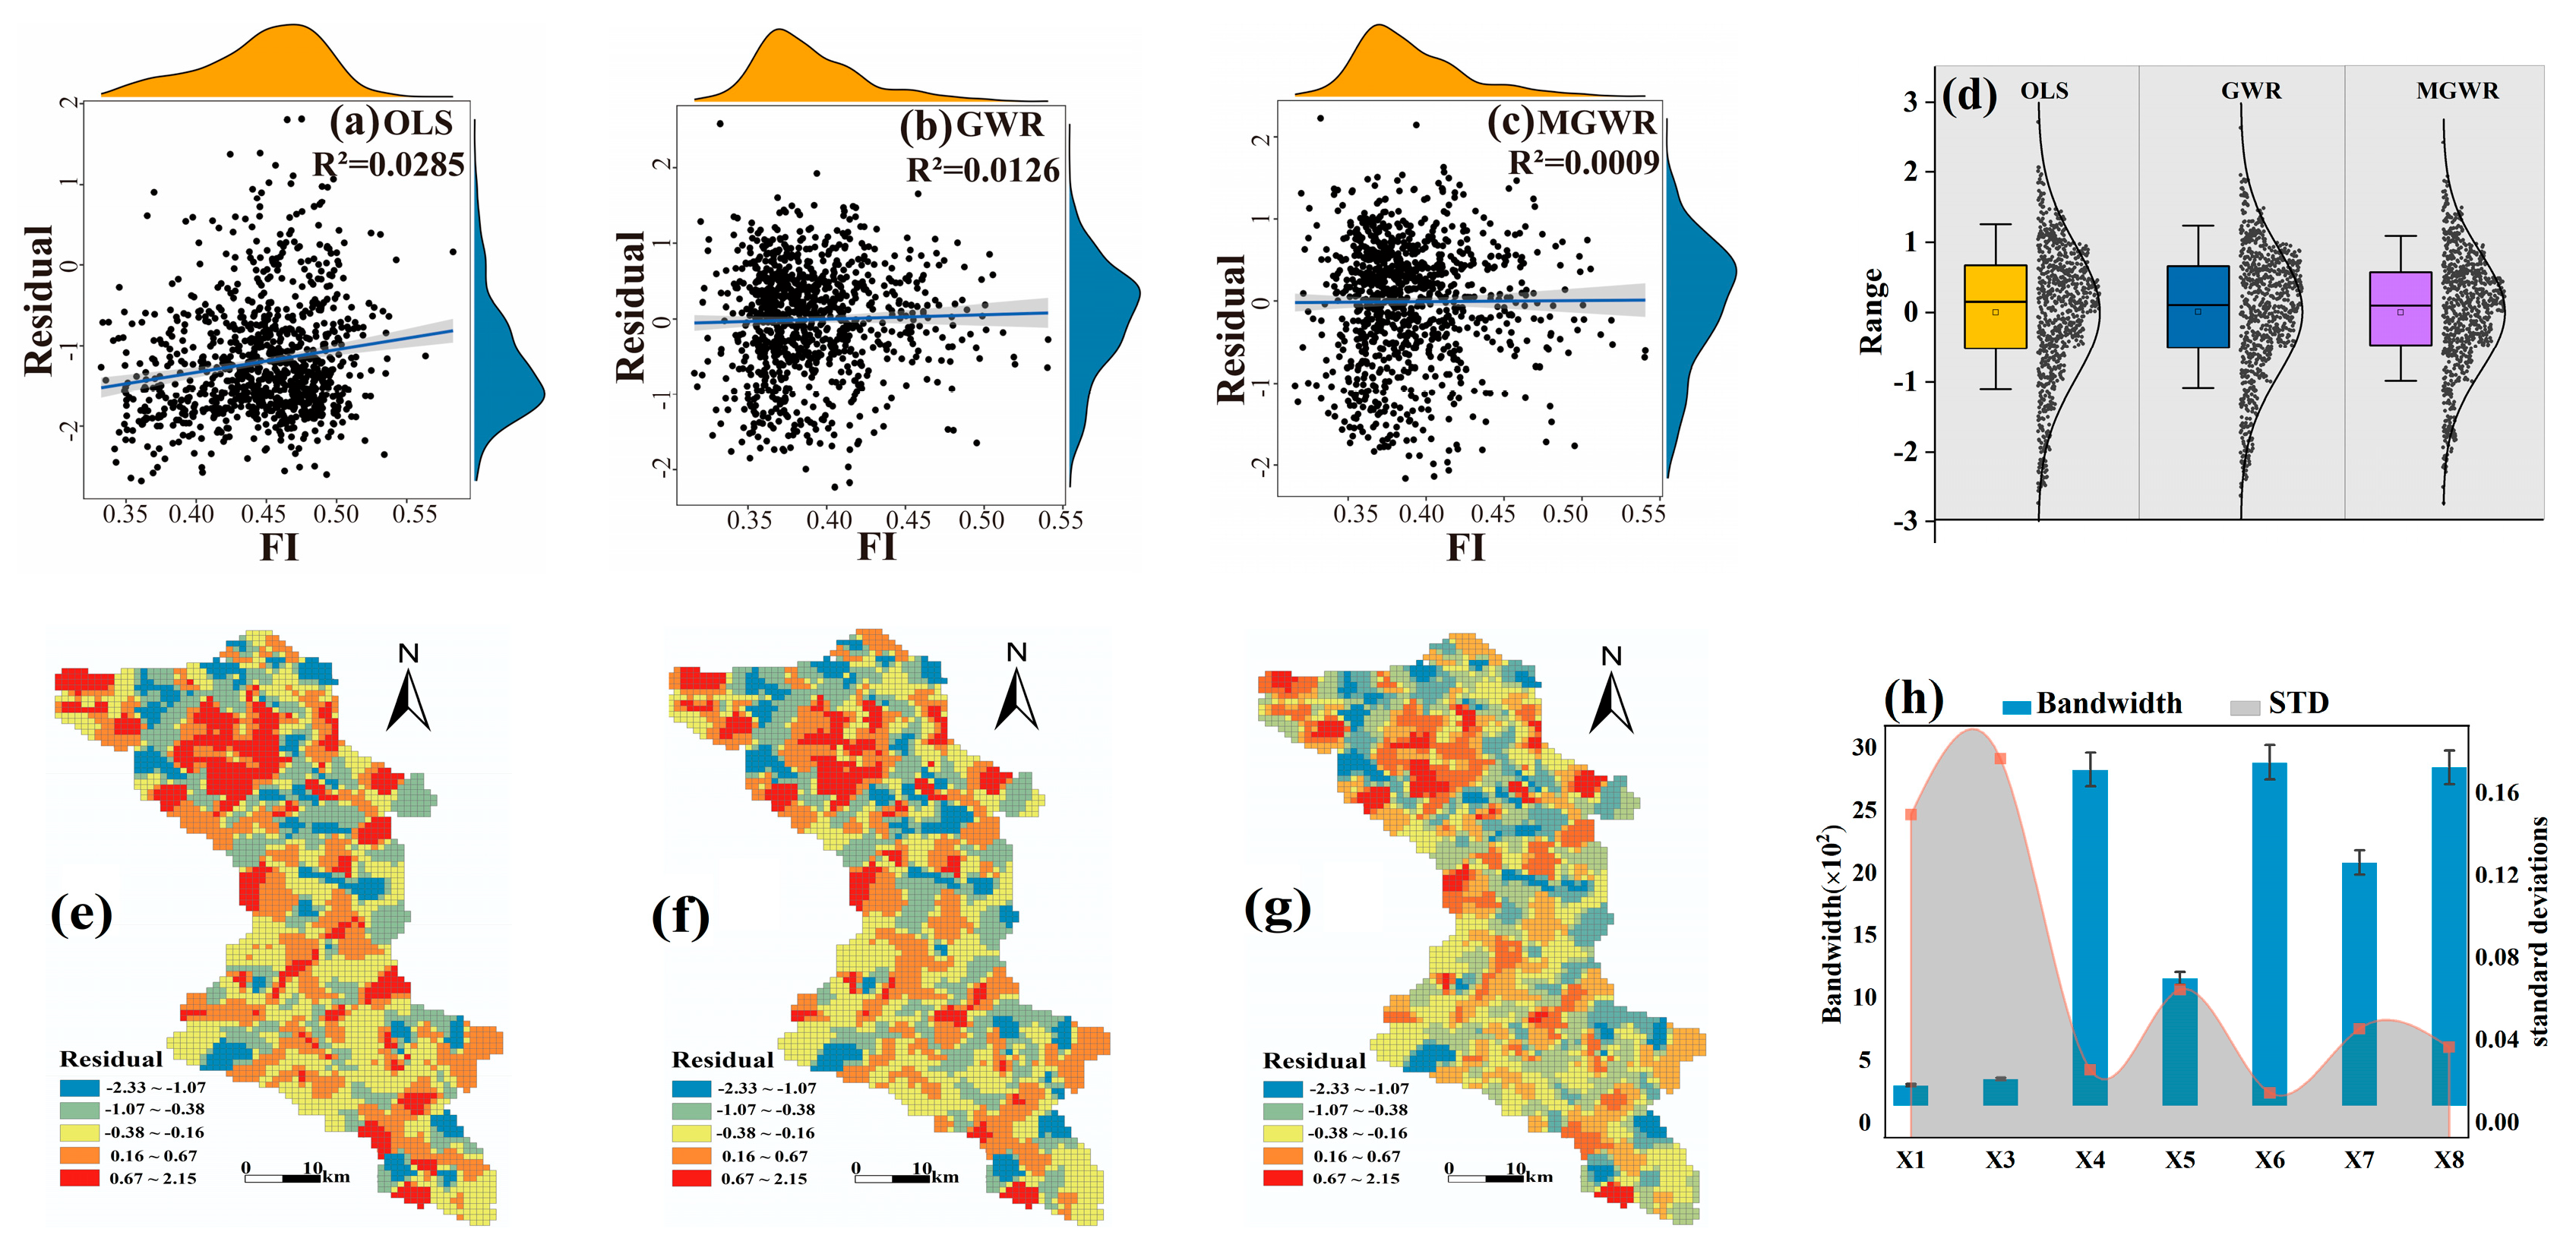
Comparing the MGWR model with OLS and GWR models, MGWR had the smallest heteroscedasticity R2 and the lowest residual spatial autocorrelation (Figure 5). The MGWR model was more advantageous in understanding the spatial non-stationarity of the influencing factors of landscape fragmentation and in explaining the scale effects of different independent variables. In addition, to avoid bias in the results due to interactions among the influence factors, this study conducted a covariance test for each driver and finally selected seven influence factors that passed the test (slope, lithology, soil type, population density, and distance from the road) to further perform multiscale geographically weighted regression modeling analysis with landscape fragmentation.
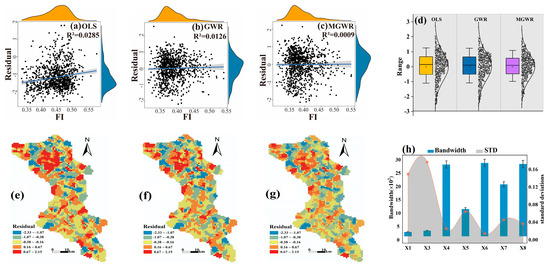
Figure 5.
Comparison of OLS, GWR, and MGWR models: (a–c) show the residual scatter plots of the three models; (d) shows the model residual box plots; (e–g) show the spatial distribution of the residuals of the OLS, GWR, and MGWR models; and (h) shows the optimal bandwidth generated by MGWR and the standard deviation of MGWR parameter estimates.
According to the results of the factor detection analysis (Table 3, Figure 6b), the influence factors explained the spatial heterogeneity of landscape fragmentation in the study area to different degrees. Their explanatory power is in descending order: population density (X6) > distance from the road (X7) > soil type (X5) > lithology (X4) > elevation (X1) > slope (X2) > aspect (X3). The influence force of population density (X6) on landscape fragmentation was significantly higher than that of other factors, with a q-value of 0.1309.
Table 3.
Geodetector results for influence factors of landscape fragmentation.
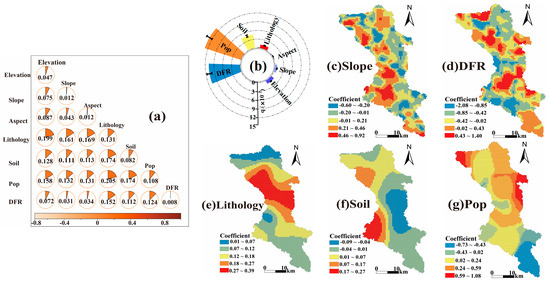
Figure 6.
Results of geodetector analysis: (a) heat map of geodetector interactions; (b) error map of driver contribution for 2000–2020; and (c–g) spatial distribution of MGWR model local regression coefficients of landscape fragmentation influences. Pop—population density, DFR—distance from the road.
Meanwhile, by calculating and comparing the q-value of each single factor and the q-value of the two factors superimposed, the geodetector can determine whether there is an interaction between the two factors and whether the interaction is strong, weak, directional, linear or nonlinear, etc. The degree of influence of all interaction factors on the spatial heterogeneity of landscape fragmentation was significantly enhanced compared to single factors (Figure 6a, Table 3).
The Influence of each factor on landscape fragmentation in different regions has obvious spatial differences (Figure 6c–g), reflecting the spatial non-smoothness of each factor. Among the factors, the regression coefficients of lithology mainly had positive effects on landscape fragmentation, and the positive effects were strongest in the central part of the study area and gradually weakened to the north and south (Figure 6e). The regression coefficient of population density takes values between −0.53 and 1.04, and the high value of the negative coefficient effect is mainly distributed in the north of the study area, while the high value of the positive coefficient effect is concentrated in the south of the study area (Figure 6g). The slope and distance from the road have mainly negative effects on landscape fragmentation in spatial distribution (Figure 6c,d), and the negative effect areas account for 66.12% and 86.37% of the total study area, respectively, meaning that the greater the slope is and the farther the distance from the road is, the lower the degree of landscape fragmentation is. The regression coefficient of population density is mainly positive (Figure 6g), and the area showing a positive effect accounts for 81.27%. It is noteworthy that the regression coefficients of soil type on landscape fragmentation show a “banding” trend from south to north and from east to west, (Figure 6f).
3.4. Patterns of Spatiotemporal Variation in Landscape Fragmentation under Different Scenarios
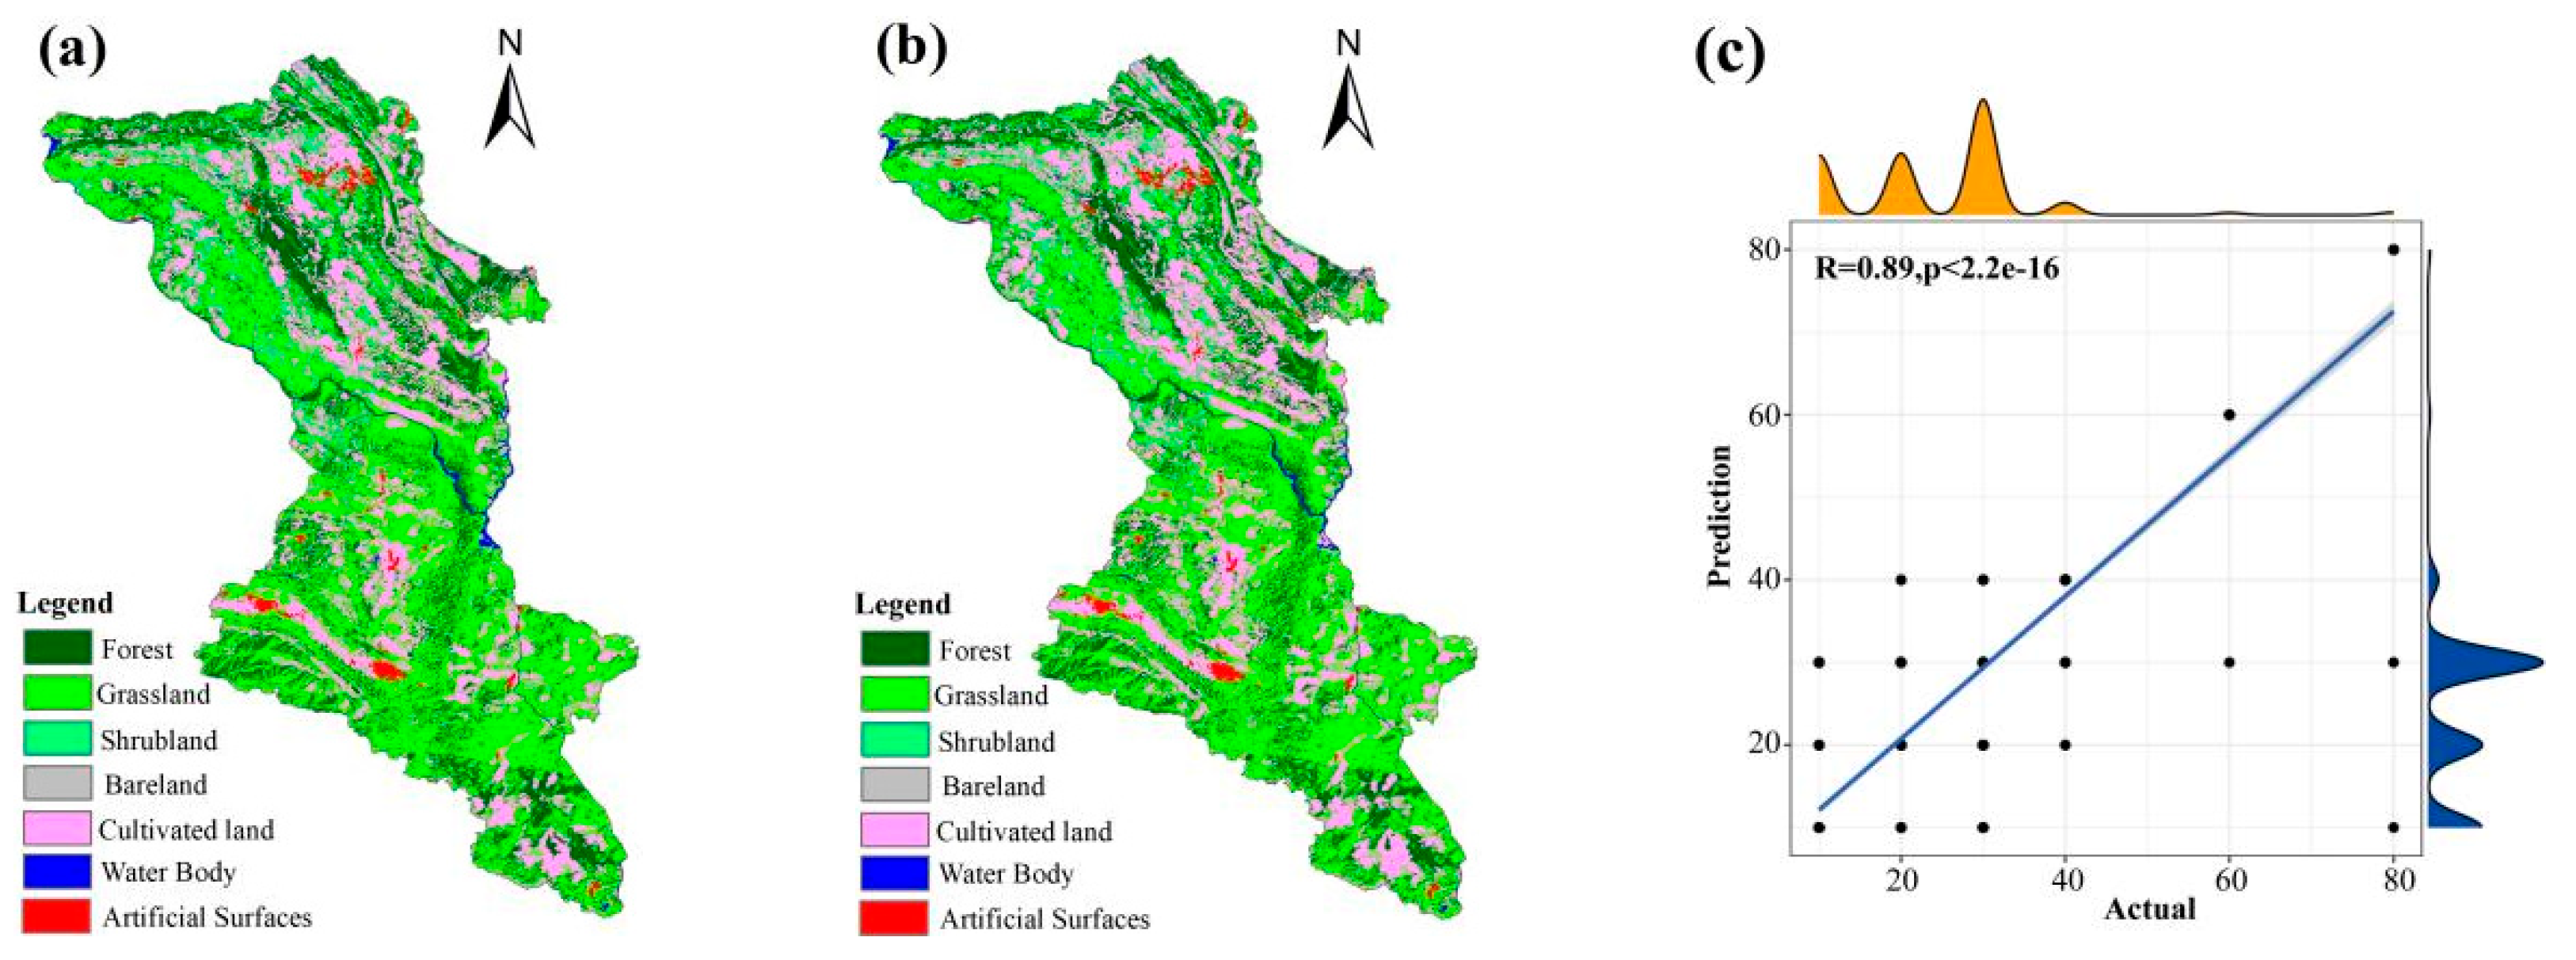
Utilizing the baseline imagery from 2010, the PLUS model was used to predict the area of each kind of LULC in 2020 (Figure 7a,b). By analyzing the correlation between the predicted and actual values, the R-squared value of the fitted curve for the PLUS model is 0.89 (Figure 7c) and the predicted overall accuracy (OA) and figure of merit (FOM) for LULC in 2020 reached 0.87 and 0.14, respectively, satisfying the research needs. Based on the LULC in 2020, the change of LULC in the Guanling-Zhenfeng region in 2030 and 2060 were predicted. In 2030 and 2060, the spatial distribution of landscape fragmentation in the study area differs significantly under different scenarios (Figure 8). In 2030, moderate fragmentation is dominant in the study area and heavy fragmentation is concentrated in the north-central part of the study area, with percentages of 2.67%, 2.08%, and 1.89% under the BAU, LUP, and ESP scenarios, respectively (Figure 8g). In contrast, heavy fragmentation is significantly improved in 2060 under different scenarios, and only the BAU scenario still has a small distribution, with the percentage decreasing to 1.01%. Light fragmentation dominates the fragmentation in the region simulated by the LUP and ESP scenarios (60.94% and 70.18%), while the BAU scenario is still dominated by moderate fragmentation (47.80%).
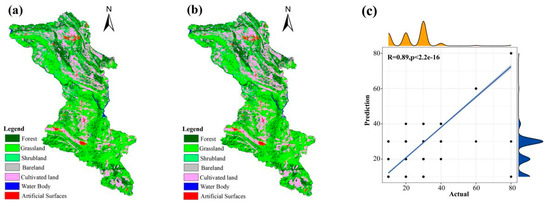
Figure 7.
PLUS model prediction diagram. (a) Actual LULC in 2020; (b) LULC prediction in 2020; (c) PLUS model accuracy fitting curve: 10—cultivated land, 20—forest, 30—grassland, 40—shrubland, 60—waterbody, 80—artificial surfaces.
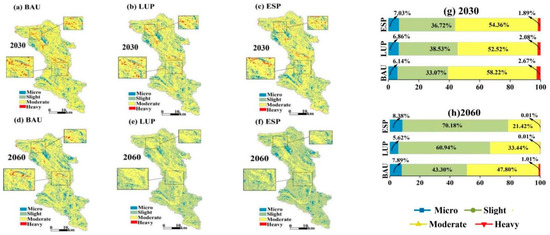
Figure 8.
Spatiotemporal variation characteristics of landscape fragmentation under different future scenarios: (a–f) indicate the spatial distribution of landscape fragmentation under BAU, LUP, and ESP scenarios in 2030 and 2060, respectively; (g,h) are the percentages of fragmentation at each level under the corresponding scenarios.
4. Discussion
4.1. Specificity Analysis
Current research on landscape fragmentation focuses on tropical rainforests around the world, temperate forests in North America and Europe, and the eastern plains and coastal urbanized areas of China [51,52,53]. Relatively few studies have been conducted in karst regions. Nevertheless, the karst region of southwest China was the first to be classified as a fragile environment by the American Association for the Advancement of Science (AAAS) [54,55]. The region’s unique geological features, fragile ecological environment, rapid population growth, urban expansion, and changes in land use patterns have led to a very high degree of landscape fragmentation, which is difficult to recover from once it occurs [15,56,57]. At the same time, the karst region in Southwest China is one of the most concentrated and largest areas of poverty in China, and there is a vicious circle of Poverty-Population-Environment (PPE) that plagues the world today (poverty-population growth-land degradation) [58]. Against this background, it is particularly urgent to carry out research on landscape fragmentation in the southwest karst region.
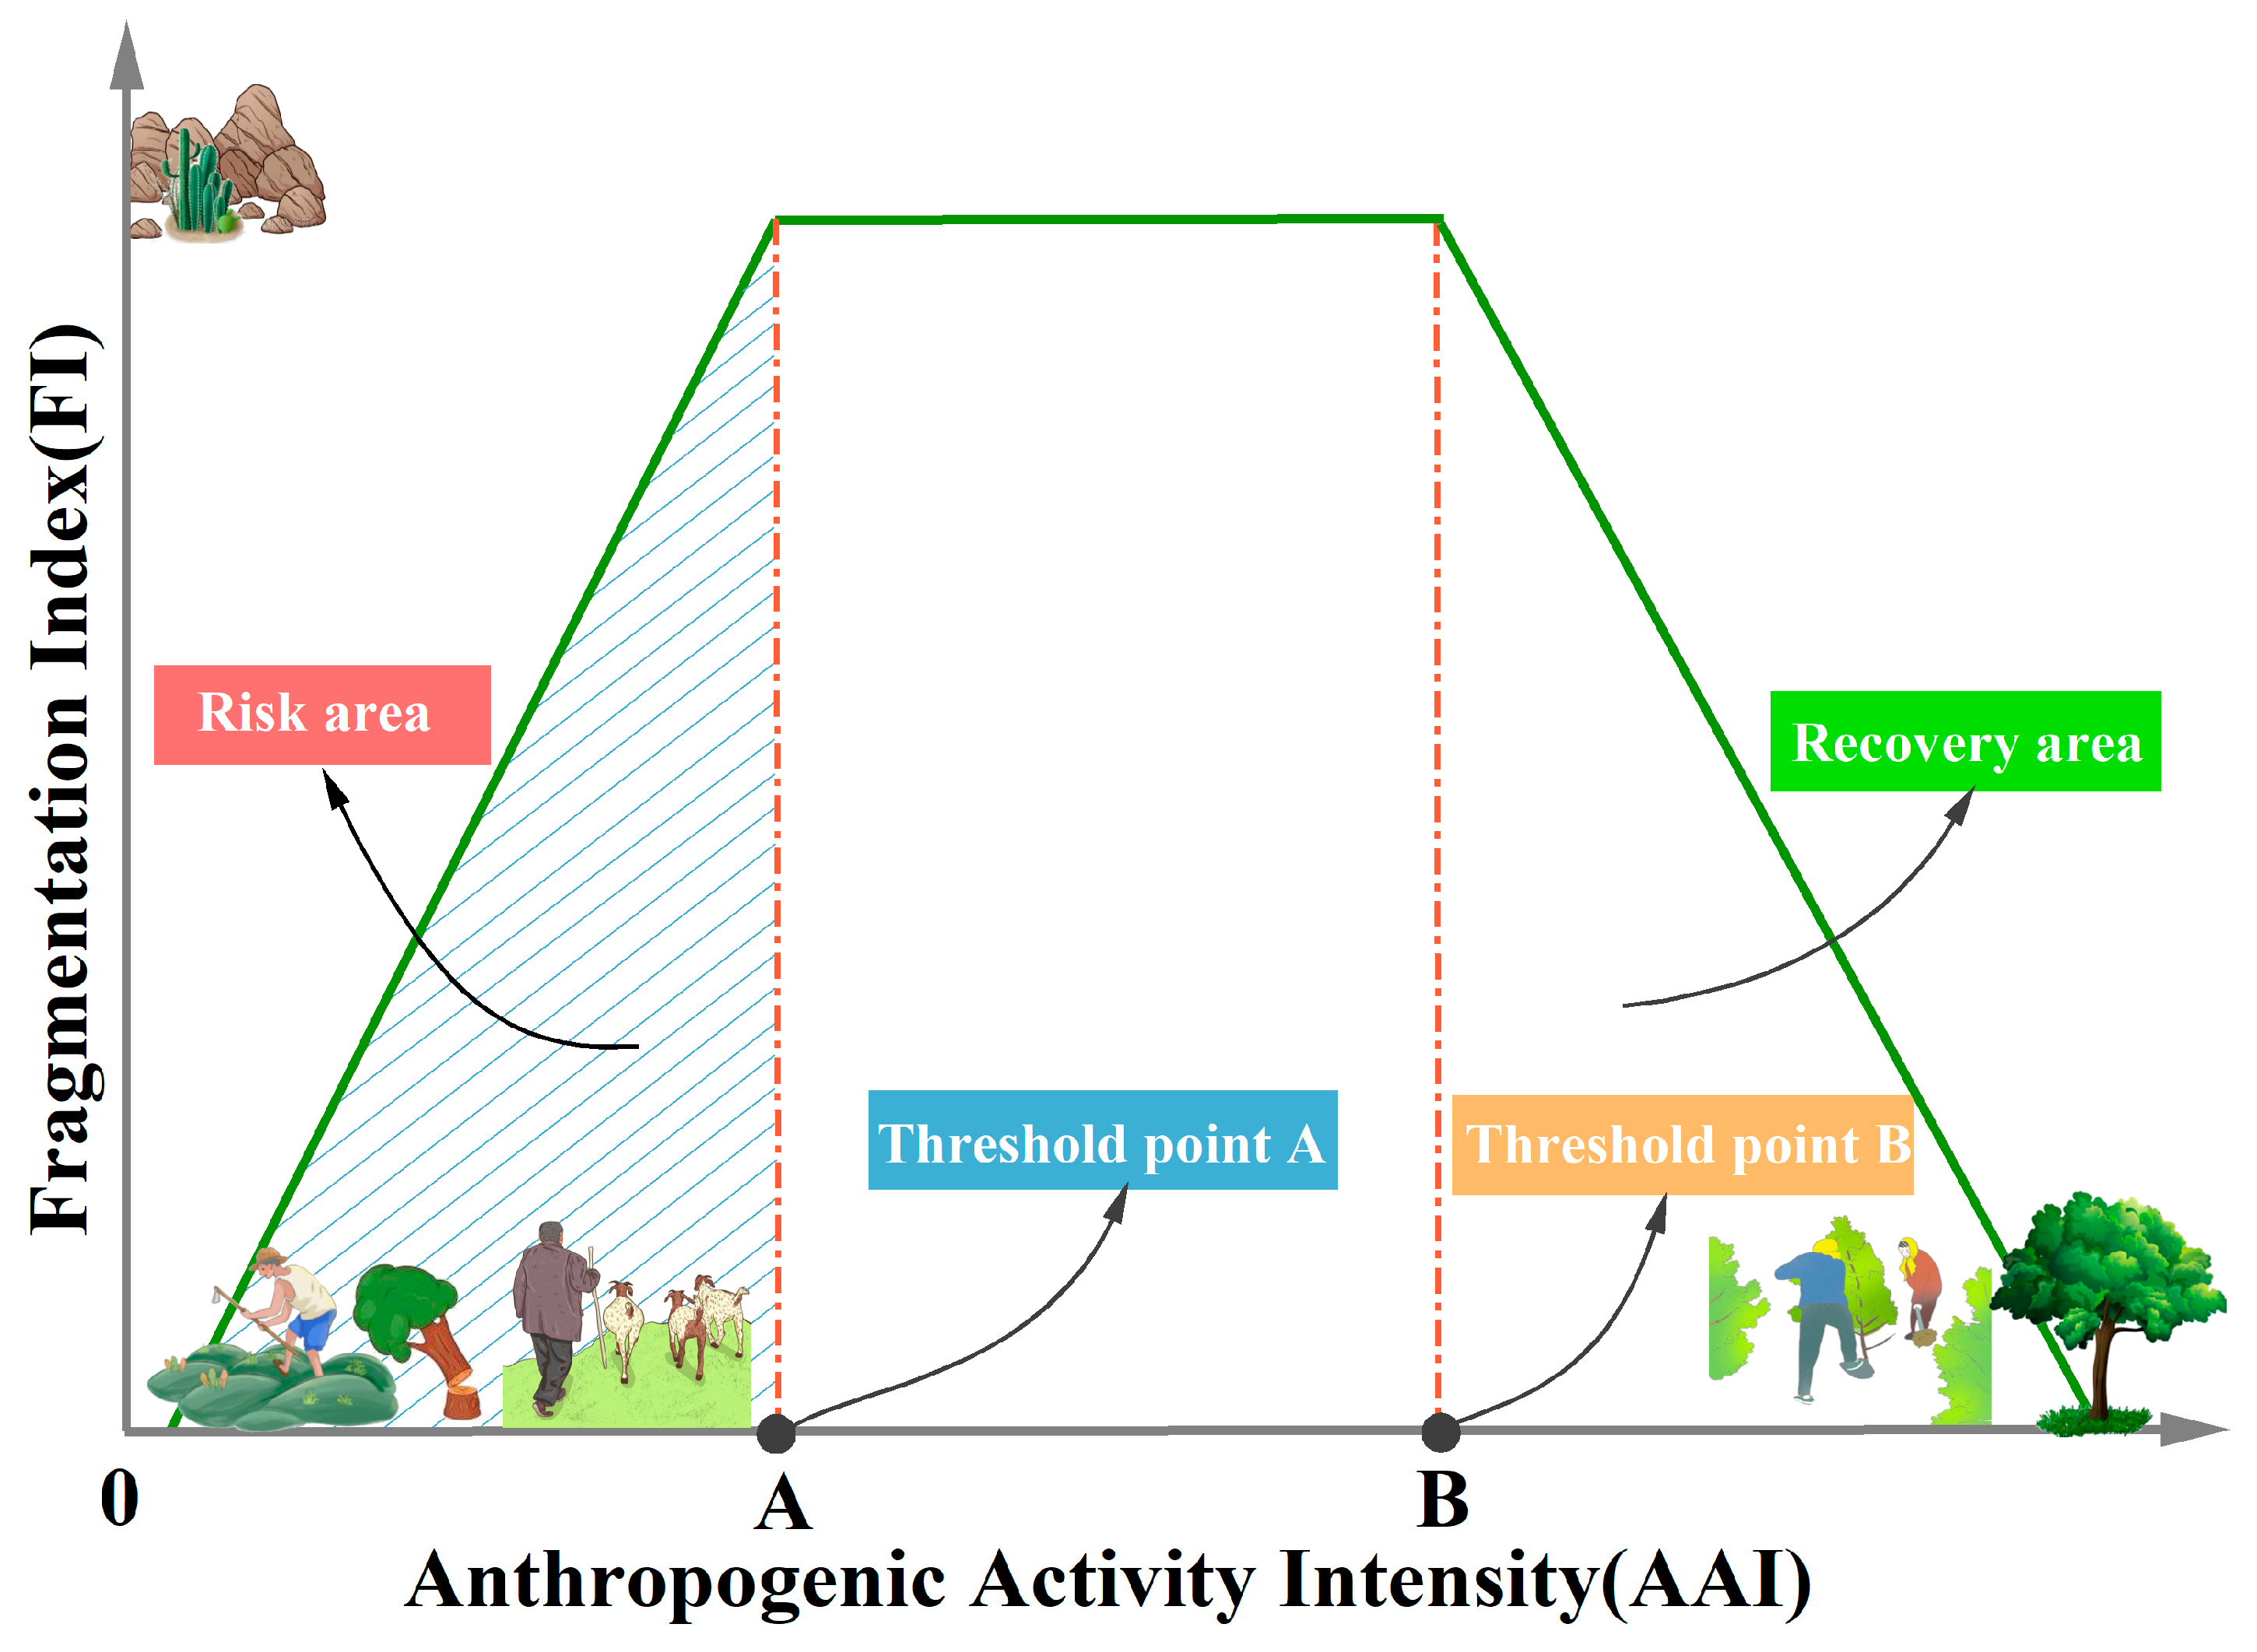
This study explored a combination of geodetectors and multi-scale geographically weighted regression modeling and found that population density was the most significant influencing factor, which is consistent with the results of existing studies [10,59,60]. At the same time, human production and disturbances have become a major source of landscape fragmentation [61,62]. There is a threshold effect for the impact of anthropogenic activity on landscape fragmentation (Figure 9), and if a threshold is exceeded and no positive intervention is implemented on the ecological environment, there will be a loss of ecosystem function and biodiversity [63,64].
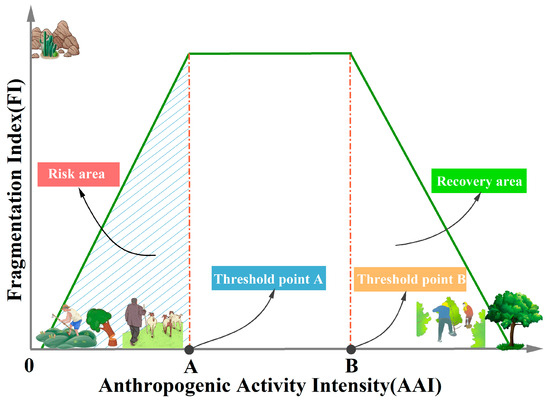
Figure 9.
Schematic diagram of risk area identification, modified from Zhang et al. (2022). Note: the horizontal coordinates represent the Anthropogenic Activity Intensity (AAI) impact intensity values; and the vertical coordinates represent the FI values of the composite index of landscape fragmentation. Points A and B represent the threshold points where the slope of the curve changes significantly; the interval filled by the diagonal line on the left side indicates that FI is positively correlated with AAI and is used to characterize the risk zone of the impact of anthropogenic activity intensity on landscape fragmentation.
Since the the growth of China’s economy and the acceleration of urbanization, land use types have achieved mutual transition, and the landscape pattern has undergone great changes [10]. Enhanced human disturbance has become a key factor in consolidating landscape fragmentation [65].
From 2000 to 2020, the total population of Guanling-Zhenfeng County increased from 316,200 to about 800,000, and the population density exceeded the national average by 64% [66], symbolizing the growing size of cities and population growth. The transition of the population from rural to urban areas will inevitably lead to spatial and temporal shifts in the structure and layout of land use, which is mainly manifested in the reduction of agricultural land such as cropland and forest and the increase of built-up land in urban areas [67,68]. As a mirror of social and economic development, land use can intuitively reflect various problems exposed in the process of social transformation and development through landscape pattern indicators. Due to the special nature of landforms, land use in the karst region of Southwest China needs to consider factors such as topographic undulations and the interaction between surface water and underground karst systems, which makes land use and land use very limited. Therefore, the state should actively study the optimal spatial development pattern of land, construct a spatial planning system, reduce the interference of human activities on the natural landscape system in combination with the background of special natural conditions, and formulate appropriate land use protection and ecological protection strategies.
4.2. Insights and Suggestions for Ecological Management
The results of the MGWR model clearly illustrate the spatially heterogeneous response between landscape fragmentation and different influence factors, which provides substantial support for actionable as well as practical ecological improvement measures. It was found that the area with a positive effect of lithology and landscape fragmentation was mainly located in the central part of the study area, and the corresponding lithologies were mainly tuffs and dolomites, which may be because both lithological distribution areas are extremely vulnerable zones with a wide distribution of lithology and are prone to landscape fragmentation [69]. Therefore, when exploring the influence factors of landscape fragmentation, region-specific lithologies should be fully considered. Meanwhile, population density is an important factor influencing landscape fragmentation in Guanling-Zhenfeng County, which is in high agreement with the findings of Zhang [55], and the high value of the positive effect coefficient between population density and landscape fragmentation is concentrated in the southern part of the study area. The PLUS model combines the spatial factors affecting land use change with geographic image dynamics, which enhances the spatial and temporal dynamic expression and prediction ability of the model and has high accuracy in the simulation of future land use change [37]. Based on the simulation results of the PLUS model, it can be seen that the LUP and ESP scenarios can effectively improve the regional landscape fragmentation phenomenon, and the ESP scenario has a more significant improvement effect. Although the landscape fragmentation phenomenon is also improved in the BAU scenario, the improvement rate is slower than that of the LUP and ESP scenarios, and the proportion of heavy fragmentation increases slowly in the predicted time period. The findings are consistent with those of Gao et al. [70]. Without policy interventions for landscape fragmentation in the ecologically fragile karst areas of Southwest China, deeper fragmentation may occur. To improve regional landscape fragmentation, land use policies in the study area should focus on ecological conservation.
4.3. Pervasive Contributions and Limitations
In the context of the “double carbon target,” vegetation restoration in the karst region of Southwest China has received much attention from scholars because of its great carbon sequestration potential [71,72,73]. However, the existence of landscape fragmentation poses a serious threat to the carbon sequestration capacity of ecosystems and climate change in the southwest karst region [38,56]. In this study, a new and integrated framework for analyzing the change of landscape patterns is proposed by integrating methods such as multiscale geo-weighted regression and the PLUS model, and its formation mechanism is explored from a spatially explicit perspective. By applying this framework, we can not only overcome the limitations of a single analysis method and compensate for the inadequacies of previous studies on the influence factors of landscape fragmentation in karst areas but also provide a more comprehensive and accurate evaluation of the current landscape fragmentation of karst ecosystems in Southwest China, which can provide a theoretical basis and support for maintaining ecosystem connectivity, improving its carbon sequestration capacity, and mitigating climate change [56]. At the same time, combining landscape pattern change with future scenario prediction can better diagnose and predict the change trend of ecosystem landscape fragmentation, which is beneficial for managers to take timely and effective measures to intervene in the ecosystem and promote the protection and restoration of the ecological environment in karst areas. In addition, the research framework can be applied to other regions of the world to provide case studies and references for ecological management in similar karst areas. However, there are still some limitations for further improvement. First, the interaction analysis of geographic probes can only involve two influence factors, which may not be sufficient to reflect the combined contribution of each factor. Second, although this study explored landscape fragmentation in karst ecosystems, only one study area was selected for the study, which may have limitations. Therefore, it is necessary to further expand the scope of the study in future studies and combine other related fields for interdisciplinary cooperation to improve the credibility of the research results.
5. Conclusions
This study provides further insights into the spatiotemporal characteristics and influencing factors of landscape fragmentation in Guanling-Zhenfeng County. On a spatial scale, the distribution of the landscape indices is characterized by significant spatial differentiation. Among them, the spatial distribution trends of patch density (PD) and largest patch index (LPI) were opposite, and the distribution trends of Shannon diversity index (SHDI) and Shannon evenness index (SHEI) were similar. The overall degree of fragmentation in the study area decreases from 2000 to 2020, with moderate fragmentation dominating, extreme fragmentation accounting for the smallest proportion, and heavy fragmentation mainly occurring in the north-central part of the study area. Natural and social factors jointly affect the landscape fragmentation in Guanling-Zhenfeng County, and there is a significant interactive enhancement effect among the factors, with the population density being the most important influence factor. In addition, the effects of the factors on landscape fragmentation showed significant spatial non-stationarity. The characteristics of landscape fragmentation changes under different scenarios varied significantly, with the ecological protection scenario having the smallest percentage of fragmented area in the moderate or higher class. The comprehensive framework proposed in this study not only provides a scientific basis for the formulation of ecological conservation planning and land use policies in the fragile karst ecosystem in Southwest China, but also provides reference value for other regions.
Author Contributions
X.W.: Writing—original draft, data curation, visualization. Z.Z.: conceptualization, supervision, funding acquisition. M.Z.: software, data curation, writing—review and editing. J.W. (Jiale Wang): investigation, writing—review and editing. R.L.: writing—review and editing. J.Z.: writing—review and editing. J.W. (Jiaxue Wan): writing—review and editing. All authors have read and agreed to the published version of the manuscript.
Funding
This research was funded by the National Natural Science Foundation of China (41661088), “Hundred” Level Talents of Guizhou Provincial High-level Innovative Talents Training Program (Qiankehe Platform Talents (20165674)), and the study on the scale effect of characteristic crops identification in Karst Mountain based on Multi-source Remote Sensing (QJH YJSKYJJ (2021)090).
Data Availability Statement
Data will be made available on request. Data are available from the corresponding authors upon request.
Conflicts of Interest
The authors declare that they have no known competing financial interests or personal relationships that could have influenced the work reported in this paper.
References
- Lv, X.; Xiao, W.; Zhao, Y.; Zhang, W.; Li, S.; Sun, H. Drivers of spatio-temporal ecological vulnerability in an arid, coal mining region in Western China. Ecol. Indic. 2019, 106, 105475. [Google Scholar] [CrossRef]
- Di Febbraro, M.; Bosso, L.; Fasola, M.; Santicchia, F.; Aloise, G.; Lioy, S.; Bertolino, S. Different facets of the same niche: Integrating citizen science and scientific survey data to predict biological invasion risk under multiple global change drivers. Glob. Change Biol. 2023, 29, 5509–5523. [Google Scholar] [CrossRef]
- Zhang, L.; Sun, P.; Huettmann, F.; Liu, S. Where should China practice forestry in a warming world? Glob. Change Biol. 2022, 28, 2461–2475. [Google Scholar] [CrossRef]
- Hussain, S.; Huang, J.; Huang, J.; Ahmad, S.; Nanda, S.; Anwar, S.; Zhang, J. Rice production under climate change: Adaptations and mitigating strategies. In Environment, Climate, Plant and Vegetation Growth; Springer: Cham, Switzerland, 2020; pp. 659–686. [Google Scholar]
- Zhang, Z.; Wang, X.; Zhang, Y.; Gao, Y.; Liu, Y.; Sun, X.; Yin, S. Simulating land use change for sustainable land management in rapid urbanization regions: A case study of the Yangtze River Delta region. Landsc. Ecol. 2023, 38, 1807–1830. [Google Scholar] [CrossRef]
- Duan, X.; Chen, Y.; Wang, L.; Zheng, G.; Liang, T. The impact of land use and land cover changes on the landscape pattern and ecosystem service value in Sanjiangyuan region of the Qinghai-Tibet Plateau. J. Environ. Manag. 2023, 325, 116539. [Google Scholar] [CrossRef]
- Liang, J.L.; Chen, W.X.; Li, J.F.; Dong, M.J.; Zhou, T.; Pan, S.P. Spatiotemporal patterns of landscape fragmentation and causes in the Yellow River Basin. J. Ecol. 2022, 42, 1993–2009. [Google Scholar]
- Deng, Z.; Quan, B. Intensity Analysis to Communicate Detailed Detection of Land Use and Land Cover Change in Chang-Zhu-Tan Metropolitan Region, China. Forests 2023, 14, 939. [Google Scholar] [CrossRef]
- Chi, Q.; Zhou, S.; Wang, L.; Zhu, M.; Liu, D.; Tang, W.; Lee, J. Exploring on the eco-climatic effects of land use changes in the influence area of the Yellow River Basin from 2000 to 2015. Land 2021, 10, 601. [Google Scholar] [CrossRef]
- Zou, L.; Wang, J.; Bai, M. Assessing spatial–temporal heterogeneity of China’s landscape fragmentation in 1980–2020. Ecol. Indic. 2022, 136, 108654. [Google Scholar] [CrossRef]
- De Montis, A.; Serra, V.; Ganciu, A.; Ledda, A. Assessing landscape fragmentation: A composite indicator. Sustainability 2020, 12, 9632. [Google Scholar] [CrossRef]
- Wang, K.; Zhang, C.; Chen, H.; Yue, Y.; Zhang, W.; Zhang, M.; Fu, Z. Karst landscapes of China: Patterns, ecosystem processes and services. Landsc. Ecol. 2019, 34, 2743–2763. [Google Scholar] [CrossRef]
- Qiu, S.; Peng, J.; Zheng, H.; Xu, Z.; Meersmans, J. How can massive ecological restoration programs interplay with social-ecological systems? A review of research in the South China karst region. Sci. Total Environ. 2022, 807, 150723. [Google Scholar] [CrossRef]
- Hu, C.; Liu, Z.; Xiong, K.; Lyu, X.; Li, Y.; Zhang, R. Temporal and Spatial Variations in Carbon/Nitrogen Output in the Karst Critical Zone and Its Response to the Forest Ecosystem of Karst Desertification Control. Forests 2023, 14, 1121. [Google Scholar] [CrossRef]
- Chen, J. Analysis on the Evolution and Driving Force of Landscape Pattern in Karst Region-Take Zhenfeng County, Guanling County, Guizhou Province as an Example. Master’s Thesis, Guizhou Normal University, Guiyang, China, 2020. [Google Scholar]
- Li, Y.; Geng, H. Evolution of land use landscape patterns in karst watersheds of Guizhou Plateau and its ecological security evaluation. Land 2022, 11, 2225. [Google Scholar] [CrossRef]
- Wang, Z.; Dai, L. Assessment of land use/cover changes and its ecological effect in karst mountainous cities in central Guizhou Province: Taking Huaxi District of Guiyang City as a case. Acta Ecol. Sin. 2021, 41, 3429–3440. [Google Scholar]
- Jiao, L.M.; Xiao, F.T.; Xu, G.; Lu, Y.N. Spatial-temporal response of green land fragmentation patterns to urban expansion in Wuhan metropolitan area. Resour. Sci. 2015, 37, 1650–1660. [Google Scholar]
- SHI, X.; He, J. The spatial-temporal evolution characteristics of landscape fragmentation in Fenhe River Basin. J. Nat. Resour. 2019, 34, 1606–1619. [Google Scholar]
- Cui, S.; Han, Z.; Yan, X.; Li, X.; Zhao, W.; Liu, C.; Zhong, J. Link ecological and social composite systems to construct sustainable landscape patterns: A new framework based on ecosystem service flows. Remote Sens. 2022, 14, 4663. [Google Scholar] [CrossRef]
- Liu, C.; Zhang, F.; Johnson, V.C.; Duan, P. Spatio-temporal variation of oasis landscape pattern in arid area: Human or natural driving? Ecol. Indic. 2021, 125, 107495. [Google Scholar] [CrossRef]
- Xiong, C.; Wu, Z.; Zeng, Z.; Gong, J.; Li, J. Spatiotemporal evolution of forest landscape pattern in Guangdong-Hong Kong-Macao Greater Bay Area based on “Spatial Morphology-Fragmentation-Aggregation”. Acta Ecol. Sin. 2023, 43, 3032–3044. [Google Scholar]
- Yang, W.R. Spatiotemporal change and driving forces of urban landscape pattern in Beijing. Acta Ecol. Sin. 2015, 35, 4357–4366. [Google Scholar]
- Zhang, J.; Gong, J.; Liu, D. Dynamics and Driving Factors of Landscape Fragmentation Based on Geo Detector in the Bailongjiang Watershed of Gansu Province. Sci. Geogr. Sin. 2018, 38, 1370–1378. [Google Scholar]
- Zheng, L.; Wang, Y.; Li, J. Quantifying the spatial impact of landscape fragmentation on habitat quality: A multi-temporal dimensional comparison between the Yangtze River Economic Belt and Yellow River Basin of China. Land Use Policy 2023, 125, 106463. [Google Scholar] [CrossRef]
- Shi, F.; Liu, S.; An, Y.; Sun, Y. Changes of landscape fragmentation and connectivity with urbanization: A case study of Kunming City. Acta Ecol. Sin. 2020, 40, 3303–3314. [Google Scholar]
- Biswas, G.; Sengupta, A.; Alfaisal, F.M.; Alam, S.; Alharbi, R.S.; Jeon, B.H. Evaluating the effects of landscape fragmentation on ecosystem services: A three-decade perspective. Ecol. Inform. 2023, 77, 102283. [Google Scholar] [CrossRef]
- Riva, F.; Fahrig, L. Landscape-scale habitat fragmentation is positively related to biodiversity, despite patch-scale ecosystem decay. Ecol. Lett. 2023, 26, 268–277. [Google Scholar] [CrossRef] [PubMed]
- Turner, M.; Gardner, R. Quantitative Methods in Landscape Ecology: The Analysis and Interpretation of Landscape Heterogeneity; Springer: New York, NY, USA, 1991; Volume 82. [Google Scholar]
- Wu, L.; He, D.; You, W.; Ji, Z.; Huang, X. A gradient analysis of coastal landscape fragmentation change in Dongshan island, China. Acta Ecol. Sin. 2020, 40, 1055–1064. [Google Scholar]
- Qiu, L.; Tao, T.; Han, S.; Yang, W.Y. Effects of local landscape fragmentation on species richness at a macroecological scale. Acta Ecol. Sin. 2017, 37, 7595–7603. [Google Scholar]
- Lin, J.; Duo, L.; Zou, Z. Dynamic Evolution and Spatial Autocorrelation Analysis of Landscape Fragmentation Under the Background of Urban Expansion-A Case Study of Nanchang City. Res. Soil. Water Conserv. 2022, 29, 362–369. [Google Scholar]
- Shen, R. The Evolution of Landscape Fragmentation and Construction of the Ecological Security Pattern in Xishuangbanna; Yunnan Normal University: Kunming, Yunnan, 2021. [Google Scholar]
- Chen, W.; Xia, J. An Optimal Weights Combination Method Considering both Subjective and Objective Weight Information. Math. Pract. Theory 2007, 37, 17–22. [Google Scholar]
- Xu, C.; Lu, C.; Huang, S. Study on ecological vulnerability and its influencing factors in Zhang Jiakou area. J. Nat. Resour. 2020, 35, 1288–1300. [Google Scholar]
- Xu, H.Q. A remote sensing urban ecological index and its application. Acta Ecol. Sin. 2013, 33, 7853–7862. [Google Scholar]
- Zhao, J.; Cui, L.; Wang, J.; Chen, S. Muli-scenario simulation of urban gren space development and construction Timeline based on PLUS model analysis: A case study of the central Zhan Jiang City. Acta Ecol. Sin. 2023, 43, 1–14. [Google Scholar]
- Zhang, X.; Brandt, M.; Yue, Y.; Tong, X.; Wang, K.; Fensholt, R. The Carbon Sink Potential of Southern China After Two Decades of Afforestation. Earth Future 2022, 10, e2022EF002674. [Google Scholar] [CrossRef] [PubMed]
- Freitas, S.; Hawbaker, T.; Metzger, J. Effects of roads, topography, and land use on forest cover dynamics in the Brazilian Atlantic Forest. Forest. Ecol. Manag. 2009, 259, 410–417. [Google Scholar] [CrossRef]
- Shao, J.; Li, Y.; Meng, Y. Pedo diversity in karst area of Chongqing, China. Acta Ecol. Sin. 2007, 27, 2048–2058. [Google Scholar]
- Whipple, K.; Tucker, G. Dynamics of the stream-power river incision model: Implications for height limits of mountain ranges, landscape response timescales, and research needs. J. Geophys. Res. Solid. Earth 1999, 104, 17661–17674. [Google Scholar] [CrossRef]
- Charlton, M.; Fotheringham, S.; Brunsdon, C. Geographically Weighted Regression White Paper; National University of Ireland Maynooth: Kildare, Ireland, 2009; 14. [Google Scholar]
- Fotheringham, A.; Yang, W.; Kang, W. Multiscale geographically weighted regression (MGWR). Ann. Am. Assoc. 2020, 107, 1247–1265. [Google Scholar] [CrossRef]
- Oshan, T.; Li, Z.; Kang, W. A python implementation of multiscale geographically weighted regression for investigating process spatial heterogeneity and scale. ISPRS Int. J. GeoInformation 2019, 8, 269. [Google Scholar] [CrossRef]
- Schiff, J.L. Cellular Automata. A Discrete View of the World; John Wiley & Sons: Hoboken, NJ, USA, 2008. [Google Scholar]
- Liu, X.; Liang, X.; Li, X.; Xu, X.; Ou, J.; Chen, Y. A future land use simulation model (FLUS) for simulating multiple land use scenarios by coupling human and natural effects. Landsc. Urban. Plan. 2017, 168, 94–116. [Google Scholar] [CrossRef]
- Motlagh, Z.; Lotfifi, A.; Pourmanafifi, S.; Ahmadizadeh, S.; Soffifianian, A. Spatial modeling of land-use change in a rapidly urbanizing landscape in Central Iran: Integration of remote sensing, CA-markov, and landscape metrics. Environ. Monit. Assess. 2020, 192, 1–19. [Google Scholar] [CrossRef]
- Lv, L.; Zhang, J.; Peng, Q.; Ren, P.; Jiang, Y. Landscape pattern analysis and prediction in the Dong Jiang River Basin. Acta Ecol. Sin. 2019, 39, 6850–6859. [Google Scholar]
- Chen, L.; Cai, H.; Zhang, T.; Zhang, X.; Zeng, H. Land use multi-scenario simulation analysis of Rao River Basin based on Markov-FLUS mode. Acta Ecol. Sin. 2022, 42, 3947–3958. [Google Scholar]
- Li, C.; Wu, Y.; Gao, B. Multi-scenario simulation of ecosystem service value for optimization of land use in the Sichuan-Yunnan ecological barrier, China. Ecol. Indic. 2021, 132, 108328. [Google Scholar] [CrossRef]
- Ma, J.; Li, J.; Wu, W.; Liu, J. Global forest fragmentation change from 2000 to 2020. Nat. Commun. 2023, 14, 3752. [Google Scholar] [CrossRef]
- Almeida, D.R.; Stark, S.C.; Schietti, J.; Camargo, J.L.; Amazonas, N.T.; Gorgens, E.B.; Brancalion, P.H. Persistent effects of fragmentation on tropical rainforest canopy structure after 20 yr of isolation. Ecol. Appl. 2019, 29, e01952. [Google Scholar] [CrossRef]
- Adams, A.B.; Pontius, J.; Galford, G.; Gudex-Cross, D. Simulating forest cover change in the northeastern US: Decreasing forest area and increasing fragmentation. Landsc. Ecol. 2019, 34, 2401–2419. [Google Scholar] [CrossRef]
- Wan, J.; Cai, Y.; Zhang, H.; Rao, S. Land Use/Land Cover Change and Soil Erosion Impact of Karst Area in Guanling County, Guizhou Province. Sci. Geogr. Sin. 2004, 24, 573–579. [Google Scholar]
- Zhang, Y.; Ma, Y. Spatio-temporal changes analysis of vegetation coverage in Alar City in 1992–2019 years. Grassl. Turf. 2022, 42, 62–72. [Google Scholar]
- Wu, L.; Zhou, Z. Response of Landscape Pattern Change to Habitat Quality in Karst Area. Environ. Sci. Technol. 2023, 46, 206–217. [Google Scholar]
- He, L.; Zhou, D. Impact of human disturbance on fragmentation of village-level landscape. Chin. J. Appl. Ecol. 2001, 12, 897–899. [Google Scholar]
- Cai, Y.; Meng, J. Ecological reconstruction of degraded land: A social approach. Sci. Geogr. Sin. 1999, 19, 198–204. [Google Scholar]
- Ren, B.; Park, K.; Shrestha, A.; Yang, J.; McHale, M.; Bai, W.; Wang, G. Impact of Human Disturbances on the Spatial Heterogeneity of Landscape Fragmentation in Qilian Mountain National Park, China. Land 2022, 11, 2087. [Google Scholar] [CrossRef]
- Li, S.; Ma, W.; Gu, Y.; Wen, H.; Peng, Y.; Li, C. Analysis of spatial-temporal changes in landscape fragmentation in the Ningxia Yellow River Valley. Acta Ecol. Sin. 2016, 36, 3312–3320. [Google Scholar]
- Seidl, N.P.; Golobič, M. Quantitative assessment of agricultural landscape heterogeneity. Ecol. Indic. 2020, 112, 106115. [Google Scholar] [CrossRef]
- Canedoli, C.; Crocco, F.; Comolli, R.; Padoa-Schioppa, E. Landscape fragmentation and urban sprawl in the urban region of Milan. Landsc. Res. 2018, 43, 632–651. [Google Scholar] [CrossRef]
- Zhang, S.; Xiong, K.; Yao, Q.; Min, X.; Jie, X. Evolution and determinants of ecosystem services: Insights from South China karst. Ecol. Indic. 2021, 133, 108437. [Google Scholar] [CrossRef]
- Bestelmeyer, B. Threshold concepts and their use in rangeland management and restoration: The good, the bad, and the insidious. Restor. Ecol. 2006, 14, 325–329. [Google Scholar] [CrossRef]
- Geri, F.; Amici, V.; Rocchini, D. Human activity impact on the heterogeneity of a Mediterranean landscape. Appl. Geogr. 2010, 30, 370–379. [Google Scholar] [CrossRef]
- Wan, J.; Cai, Y. Land Degradation and Ecological-Reconstruction in Fragile Karst Ecosystem: The Case of Guanling County, Guizhou Province. China Popul. Resour. Environ. 2003, 13, 52–56. [Google Scholar]
- Jiang, P.; Chen, D.; Li, M. Farmland landscape fragmentation evolution and its driving mechanism from rural to urban: A case study of Changzhou City. J. Rural. Stud. 2021, 82, 1–18. [Google Scholar]
- Wang, H.; Liu, X.; Zhao, C.; Chang, Y.; Liu, Y.; Zang, F. Spatial-temporal pattern analysis of landscape ecological risk assessment based on land use/land cover change in Baishuijiang National nature reserve in Gansu Province. China Ecol. Indic. 2021, 124, 107454. [Google Scholar] [CrossRef]
- Li, R.; Wang, S.; Zhou, D.; Zhang, D.; Li, F.; Zhou, Z.; Xiong, K. The Correlation between Rock Desertification and Lithology in Karst Area of Guizhou. Acta Geogr. Sin. 2003, 58, 314–320. [Google Scholar]
- Gao, L.; Tao, F.; Liu, R.; Wang, Z.; Leng, H.; Zhou, T. Multi-scenario simulation and ecological risk analysis of land use based on the PLUS model: A case study of Nan Jing. Sustain. Cities. Soc. 2022, 85, 104055. [Google Scholar] [CrossRef]
- Zhu, M.; Zhou, Z.; Feng, Q.; Wu, X.; Liu, R.; Wu, G.; Luo, W. Contribution of vegetation restoration to carbon sequestration driven by ex-situ poverty alleviation and relocation in ecologically fragile areas-Taking Guizhou, China, as a case. Land Degrad. Dev. 2023, 34, 3905–3919. [Google Scholar] [CrossRef]
- Lou, H.; Yang, S.; Shi, X.; Zhang, J.; Pan, Z.; Li, C. Whether the enhanced terrestrial vegetation carbon sink affect the water resources in the middle-low latitude karst areas of China? J. Hydrol. 2023, 620, 129510. [Google Scholar] [CrossRef]
- Tong, X.; Brandt, M.; Yue, Y.; Horion, S.; Wang, K. Increased Vegetation Growth and Carbon Stock in China Karst Via Ecological Engineering. Nat. Sustain. 2018, 20181, 44–50. [Google Scholar] [CrossRef]


Disclaimer/Publisher’s Note: The statements, opinions and data contained in all publications are solely those of the individual author(s) and contributor(s) and not of MDPI and/or the editor(s). MDPI and/or the editor(s) disclaim responsibility for any injury to people or property resulting from any ideas, methods, instructions or products referred to in the content. |
© 2024 by the authors. Licensee MDPI, Basel, Switzerland. This article is an open access article distributed under the terms and conditions of the Creative Commons Attribution (CC BY) license (https://creativecommons.org/licenses/by/4.0/).