
Spatio–Temporal Patterns and Driving Mechanisms of Urban Land High-Quality Use: Evidence from the Greater Pearl River Delta Urban Agglomeration


Abstract
1. Introduction
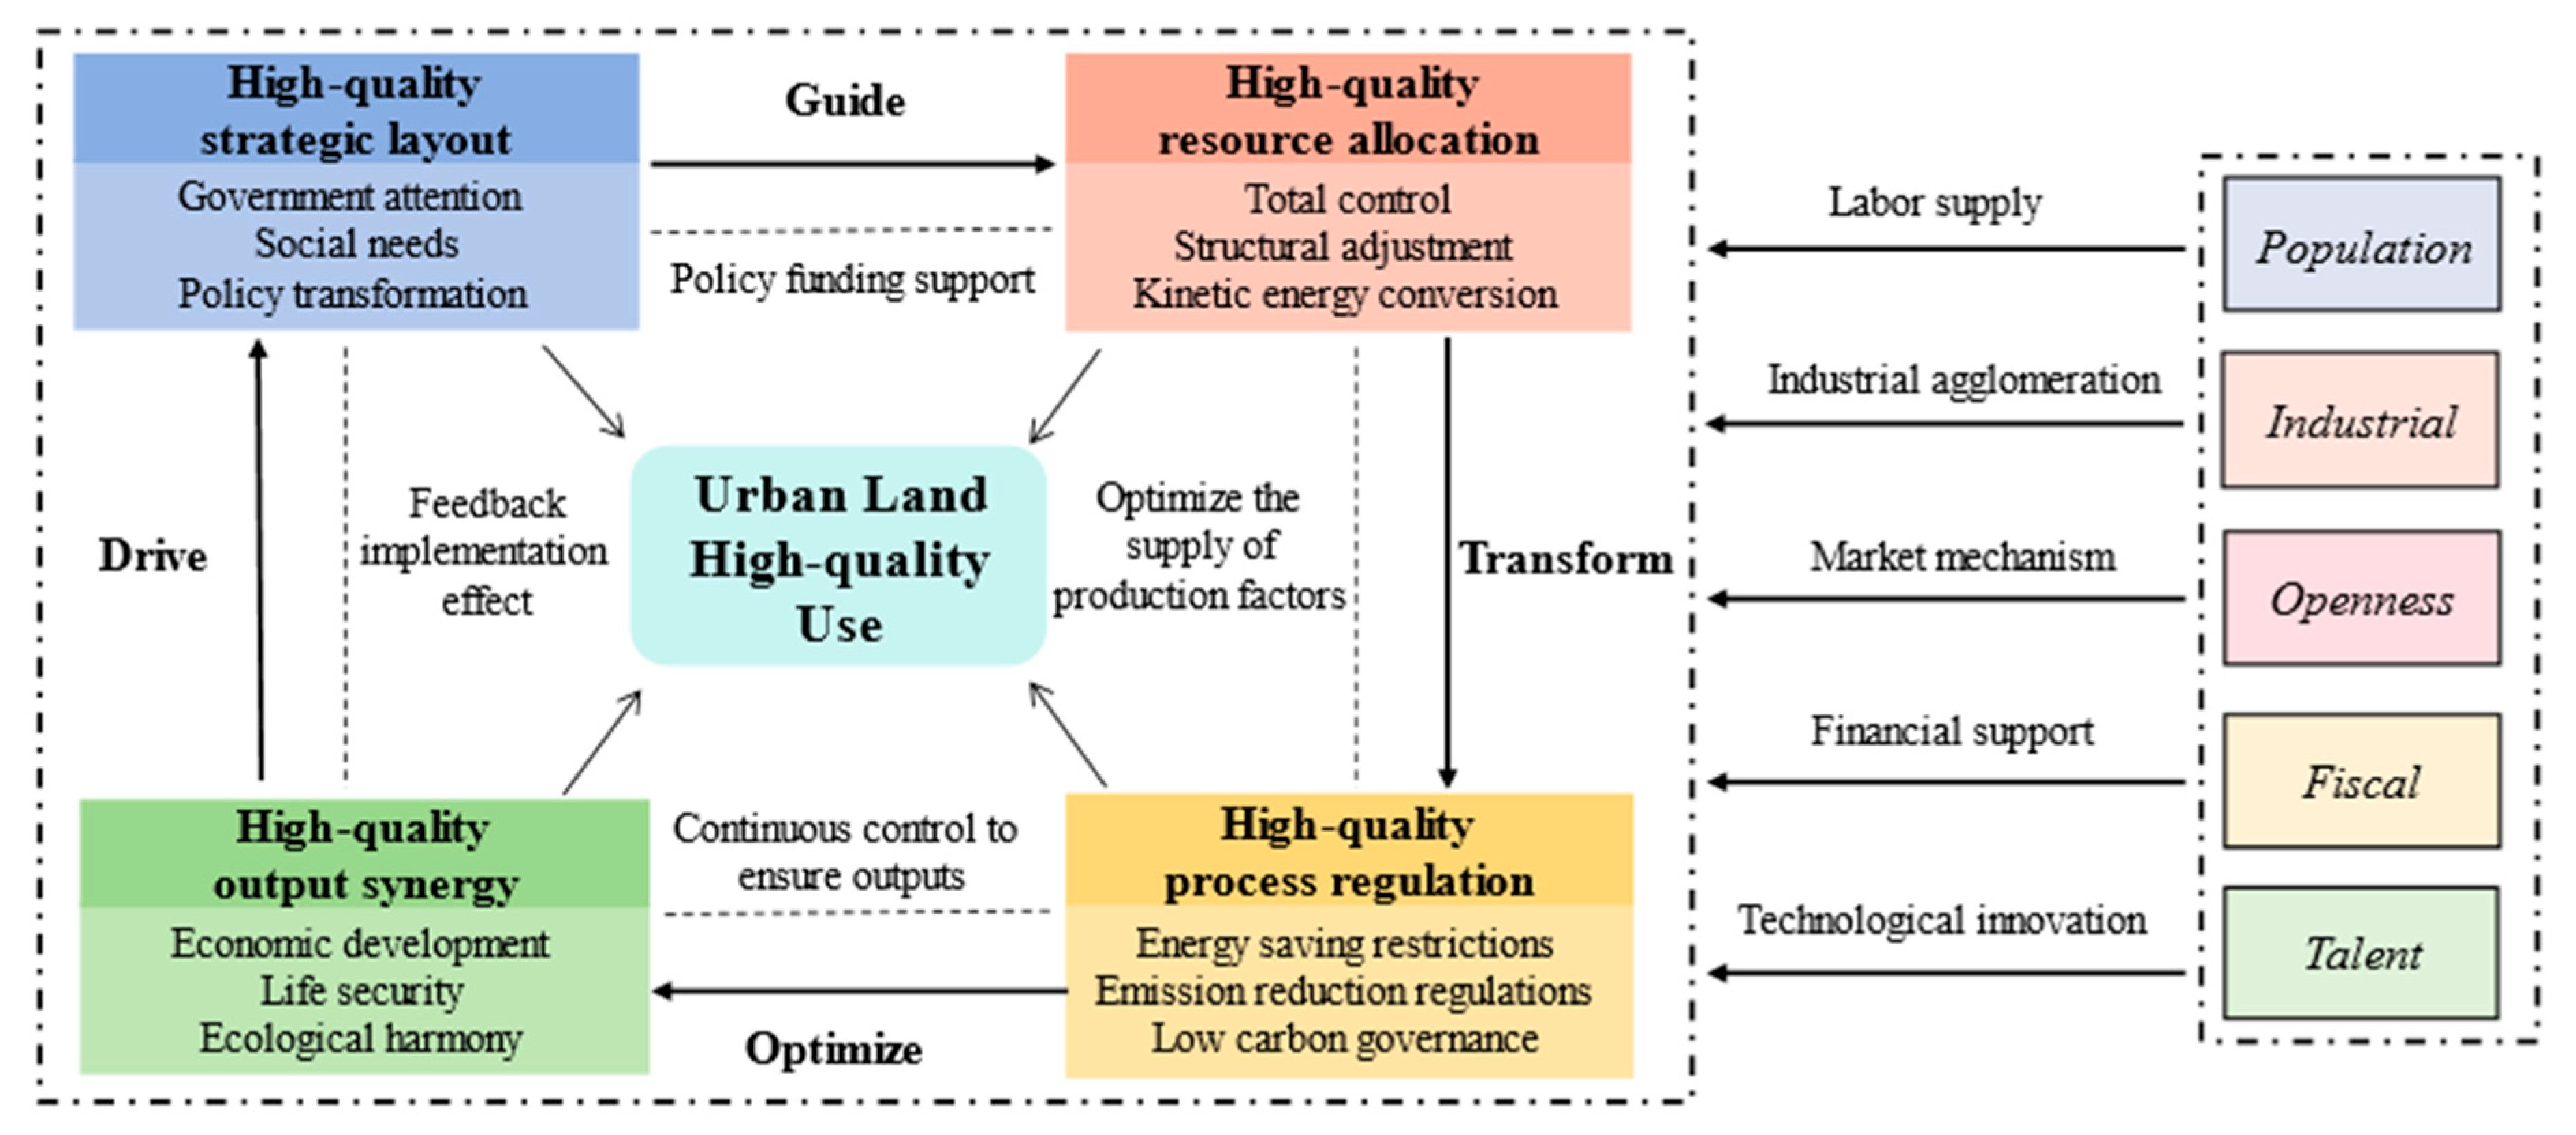
2. Theoretical Framework of ULHU
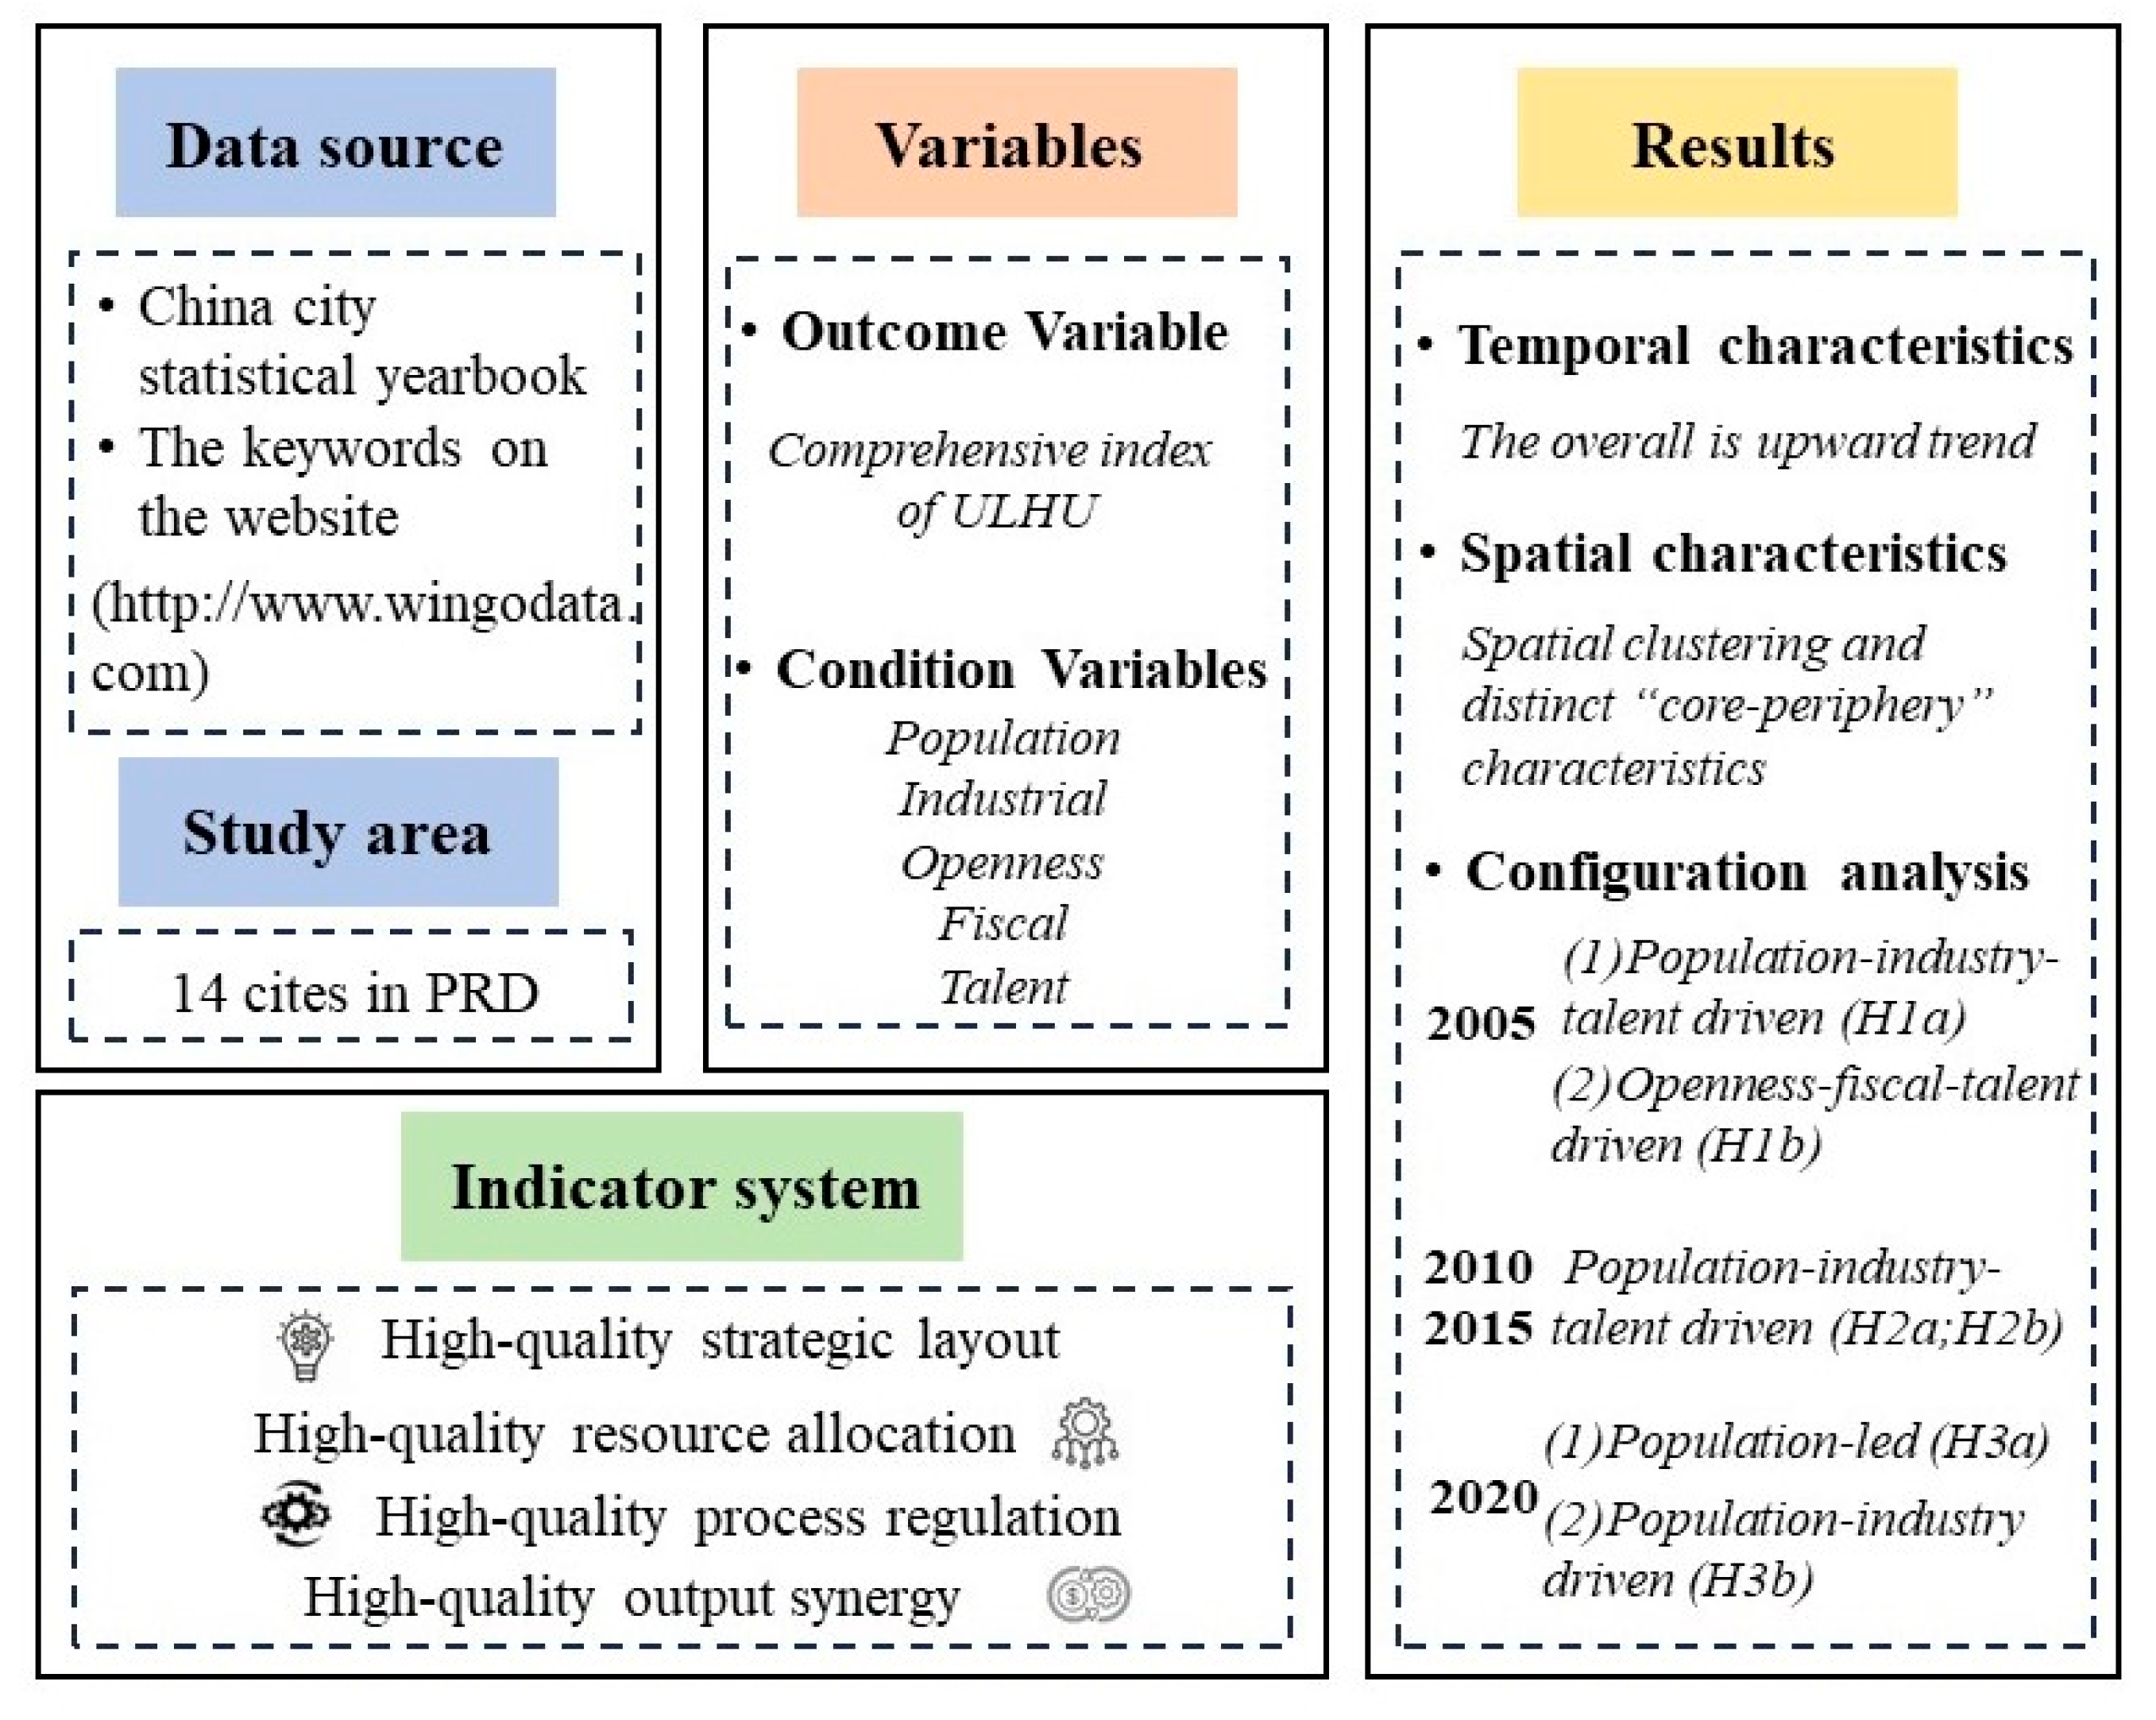
3. Data and Methods
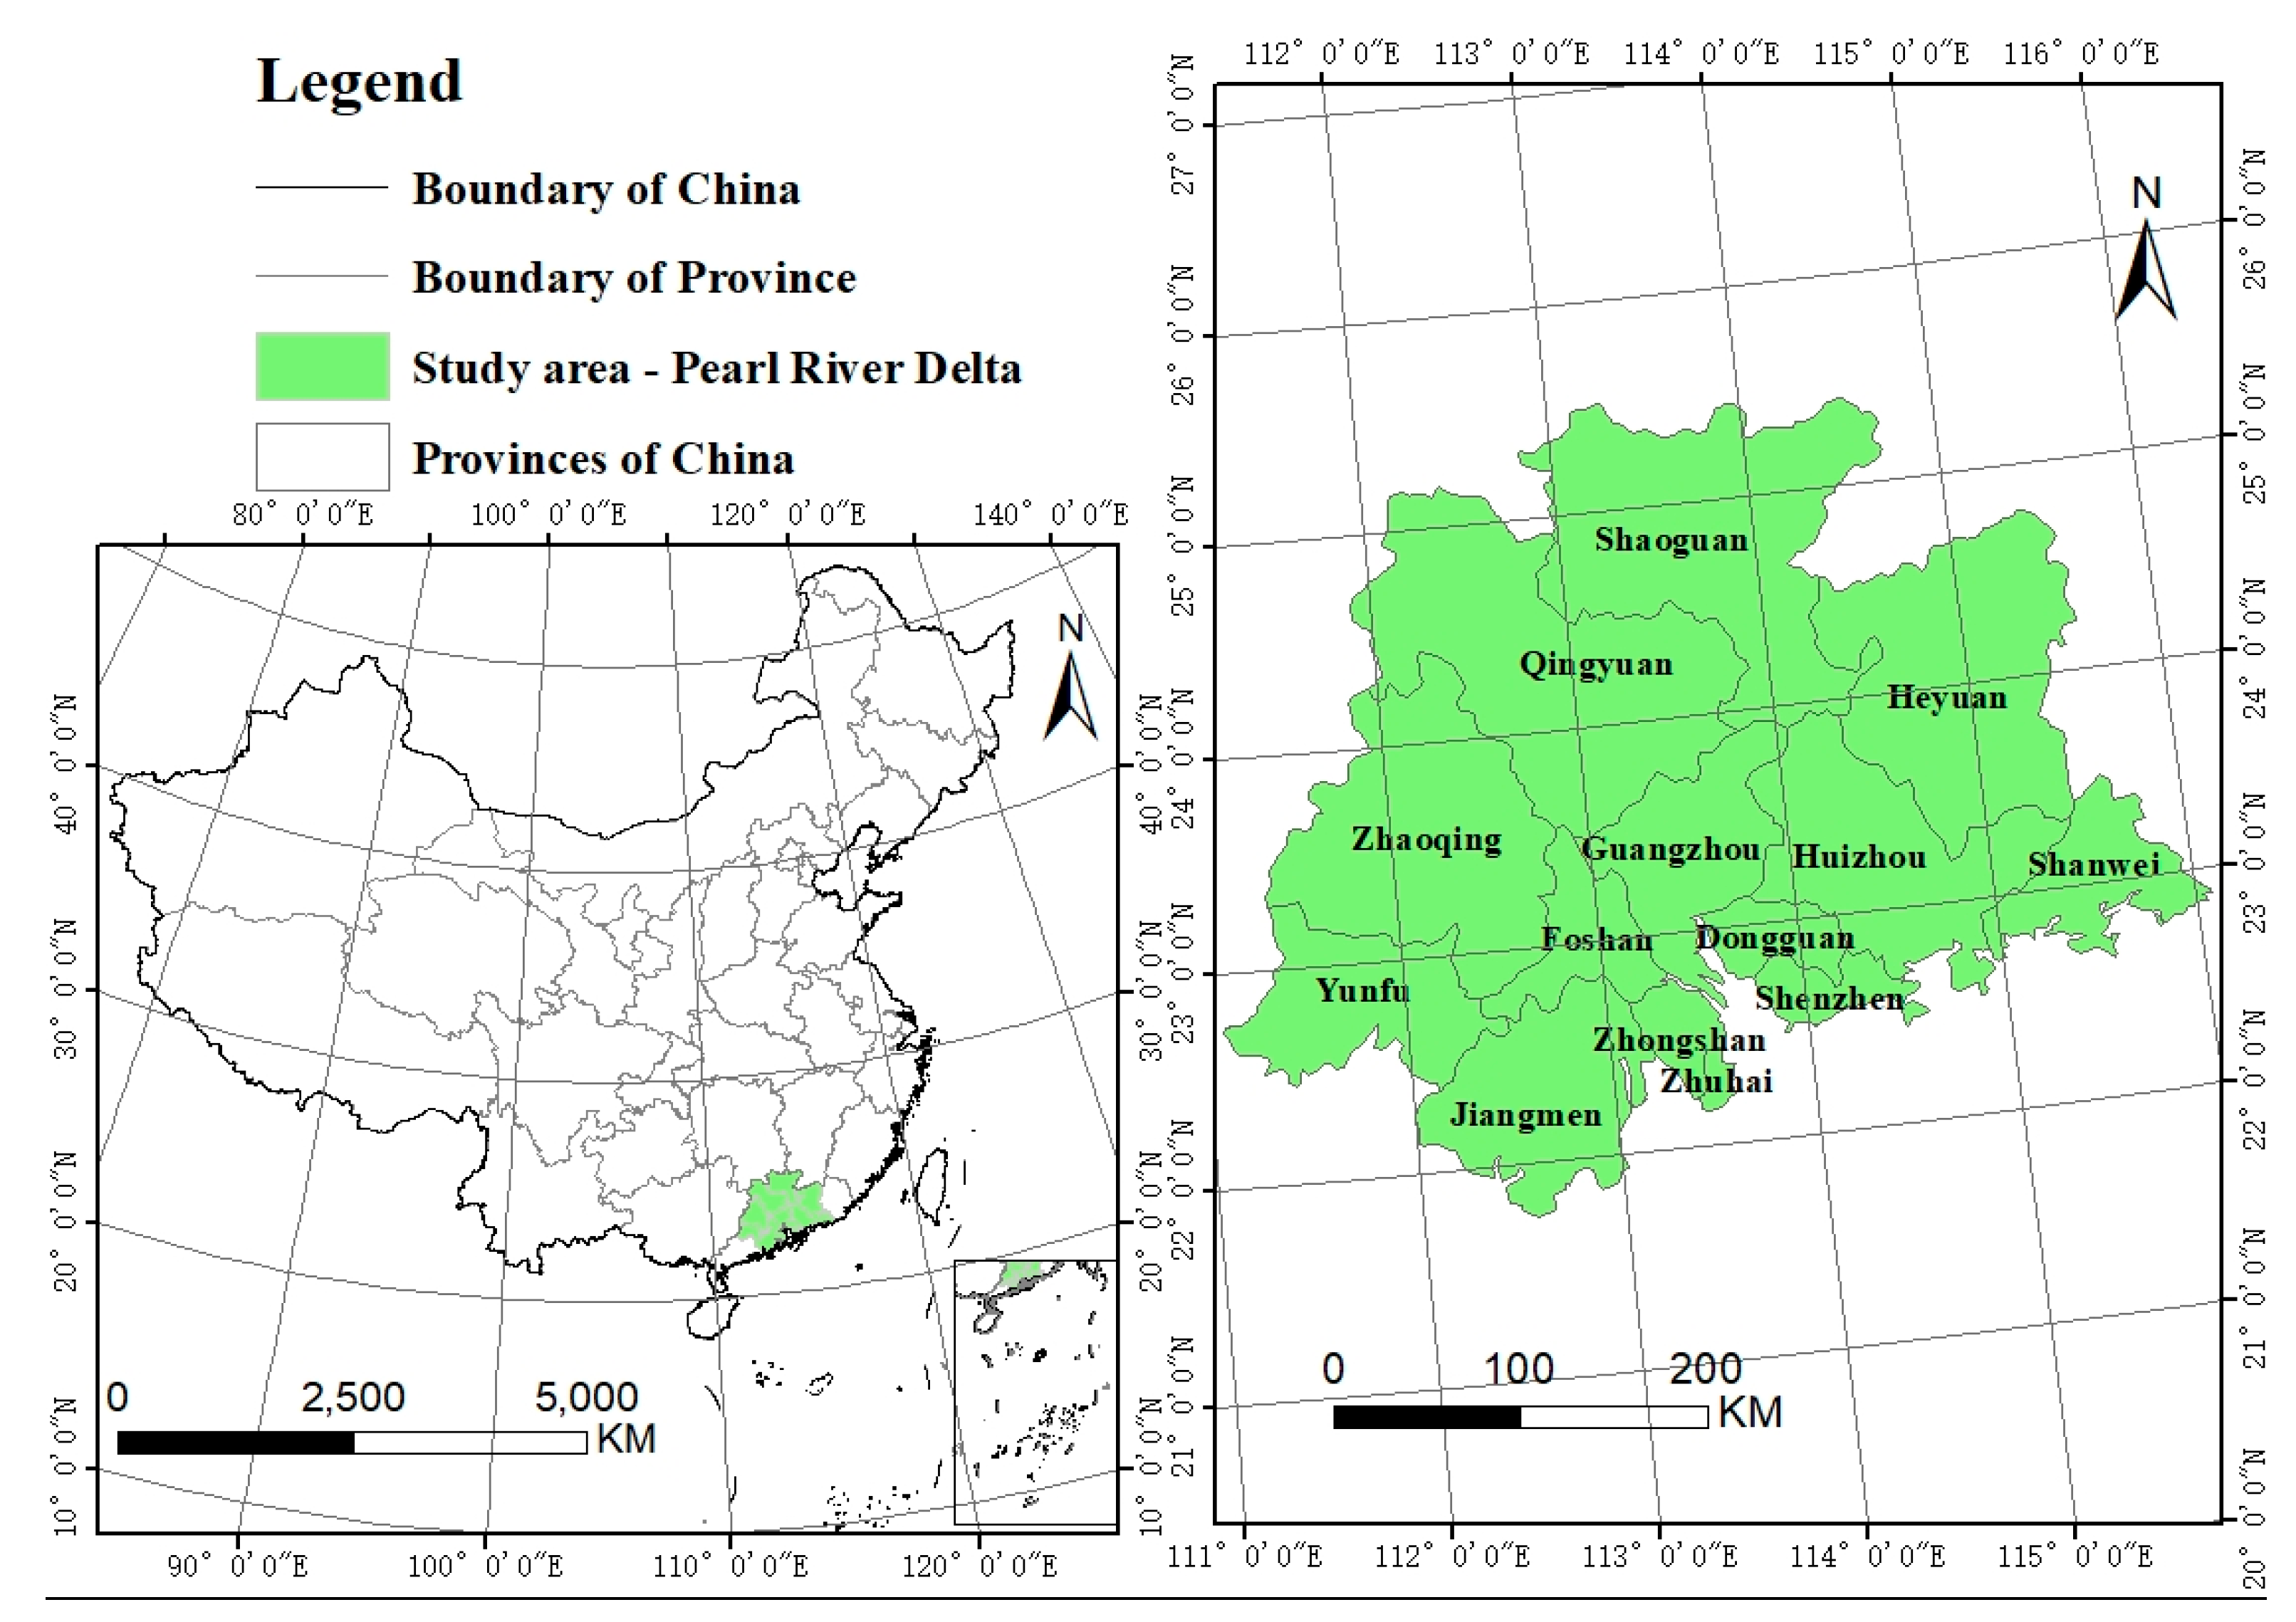
3.1. Study Area
3.2. Variable Selection and Indicator Identification
3.2.1. Outcome Variable
- (1)
- Data collection: The data were systematically chosen from all cities in the PRD urban agglomeration, which is one of the most important regions in China. The raw data is .
- (2)
- Data Standardization: The process of polar deviation standardization was employed to mitigate variations in the scale, order of magnitude relationships, and positive and negative orientations of the indicators.
- (3)
- Calculate the indicator weights: Calculate the weight of the sample under the indicator for that indicator.
- (4)
- Define the entropy value of the metric:
- (5)
- Calculate the information entropy redundancy:
- (6)
- Calculate the weights of the indicators:
- (7)
- Calculate the composite score for each sample:
3.2.2. Condition Variables
- (1)
- Population: This variable is commonly quantified as the ratio between the total urban population and the area of the city’s administrative district. The urban population exerts influence on the economic activities within the city, primarily through production and consumption. Moreover, it ensures a continuous influx of human capital, thereby contributing to the city’s development. Furthermore, the concentration of the population, optimization of the population structure, and enhancement of the population quality can exert positive effects on ULHU [45,51].
- (2)
- Industrial: This variable is assessed by the number of large-scale industrial enterprises that play a crucial role in sustainable urban development. When selecting their locations, enterprises typically take into account the trade-off between transportation convenience, land costs, and even environmental costs. This trade-off prompts the distribution of enterprises within the city to achieve a certain equilibrium, which, in turn, influences the city’s productivity. Consequently, it indirectly impacts the size of the city [52,53].
- (3)
- Openness: This variable is quantified by the proportion of utilized foreign capital in the national GDP and plays a significant role in urban dynamics. Globalization fosters the expansion of foreign trade, particularly in coastal cities and major urban agglomerations. The influx of foreign capital signifies the infusion of advanced technological capabilities and superior management skills into the region, thereby contributing to regional development and ULHU [54].
- (4)
- Fiscal: This variable is assessed by the disparity between budgeted expenditure and budgeted revenue, as well as the ratio of budgeted revenue, which is a significant determinant. While the impact of land finance varies across regions, it plays a crucial role in facilitating urbanization, enhancing infrastructure development, and promoting the development of ULHU [55,56].
- (5)
- Talent: This variable is quantified by the number of college students and plays a crucial role in urban dynamics. College students are a high-quality talent pool and make significant contributions to the process of city construction. This can serve as an indicator of the city’s development potential, which, in turn, brings about increased consumption capacity, stimulates high-quality urban economic development, and enhances its economic resilience [57].
3.3. Data Sources
3.4. Variables Calibration
3.5. Fuzzy-Set Qualitative Comparative Analysis
3.6. Research Steps
4. Results
4.1. Characteristics of the Spatial and Temporal Evolution of ULHU
4.1.1. Temporal Characteristics of ULHU
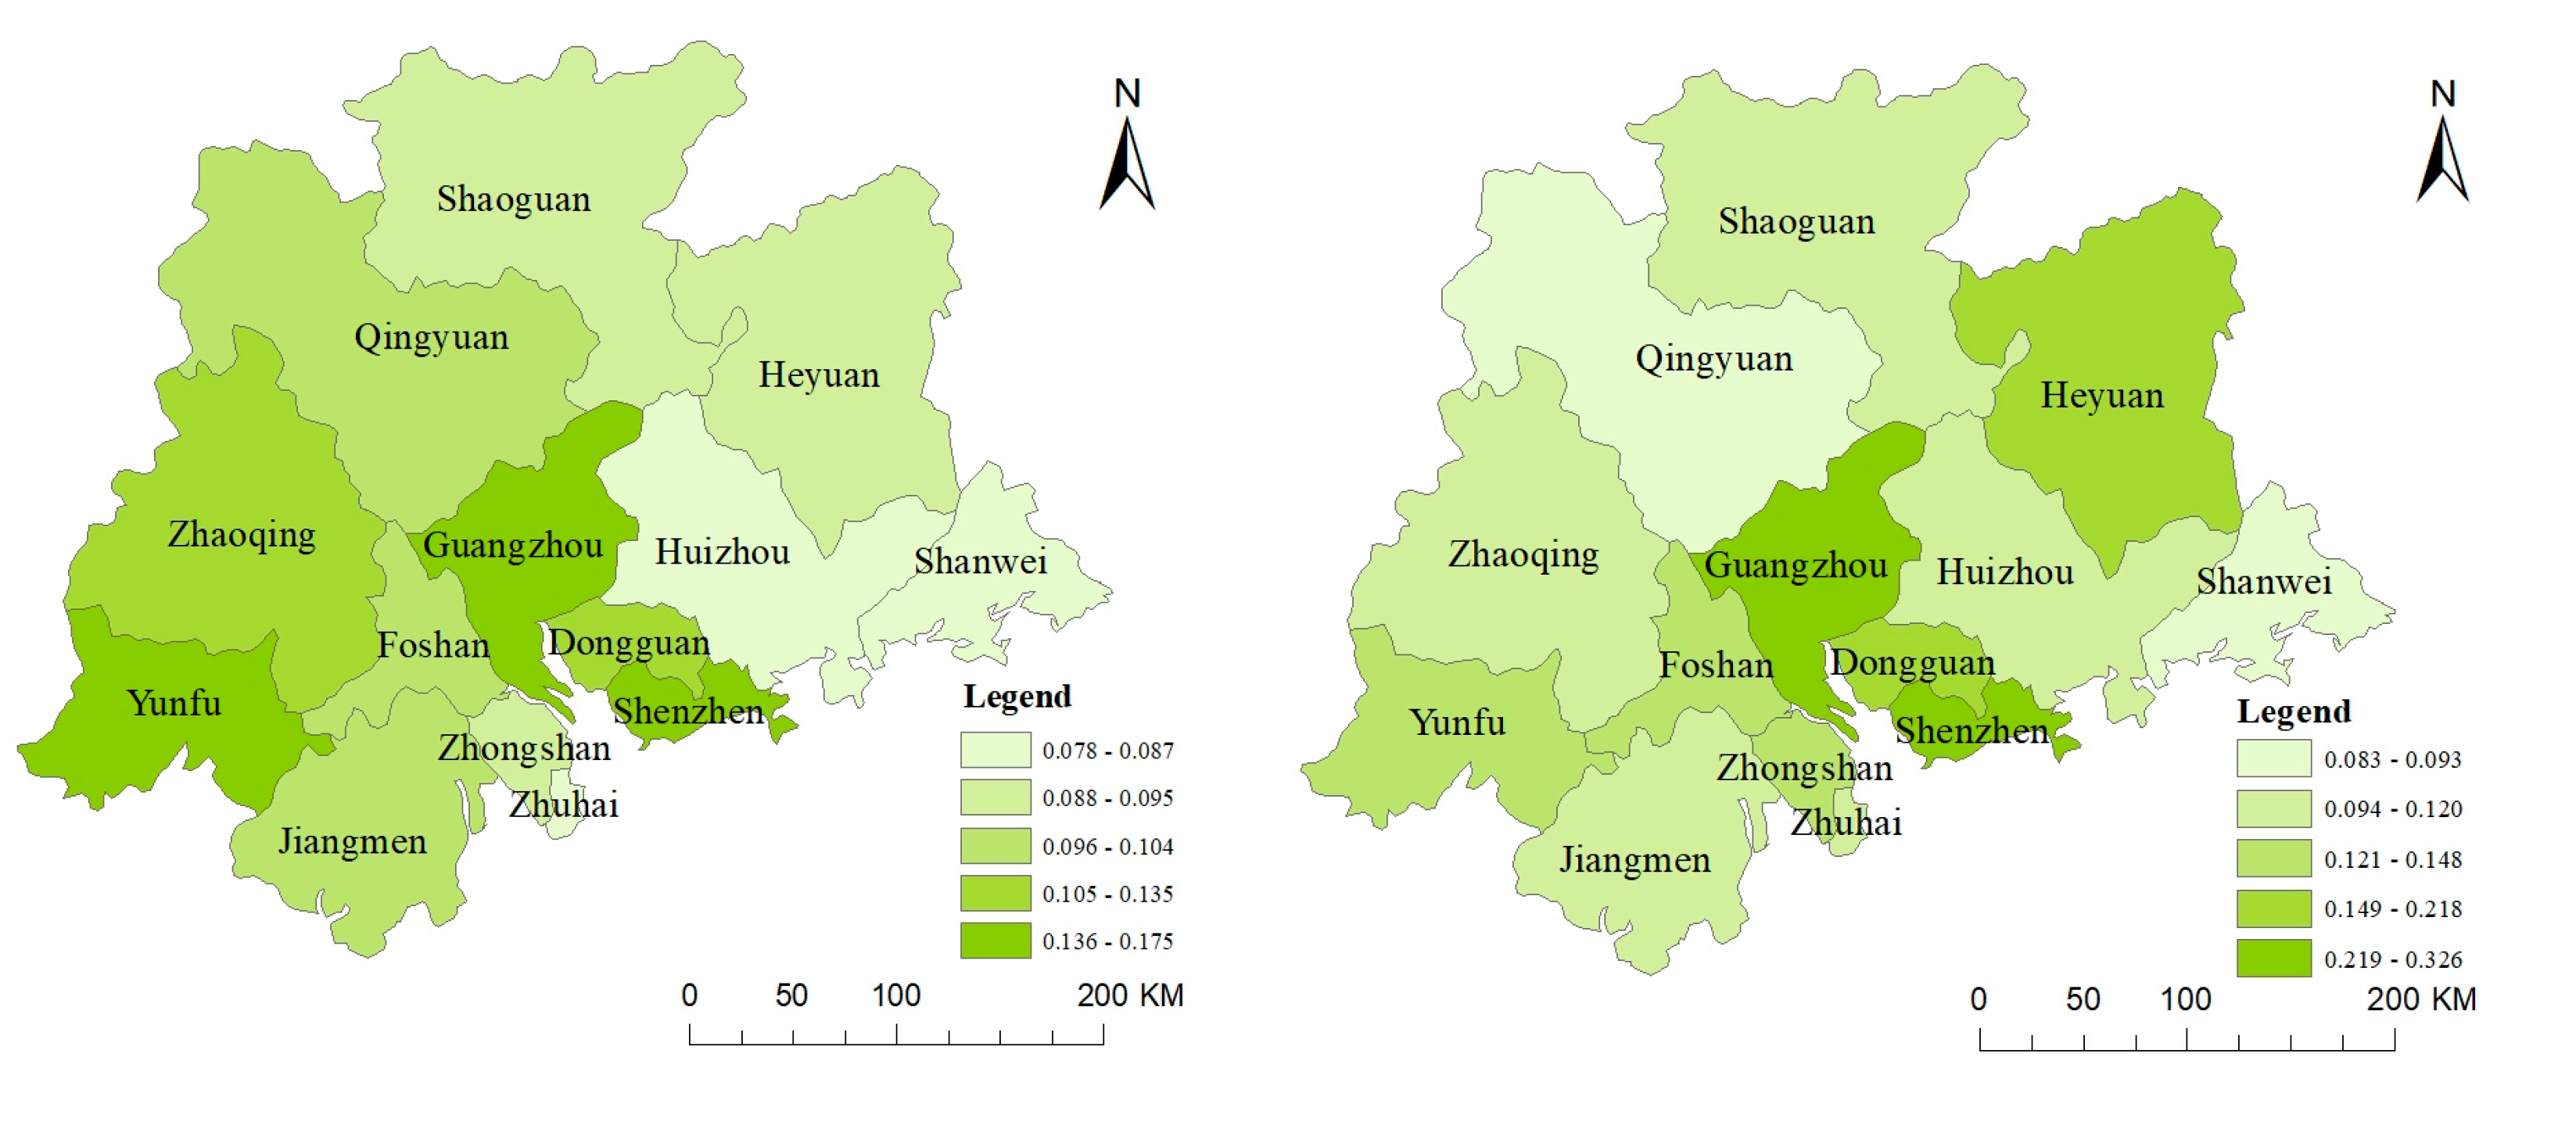
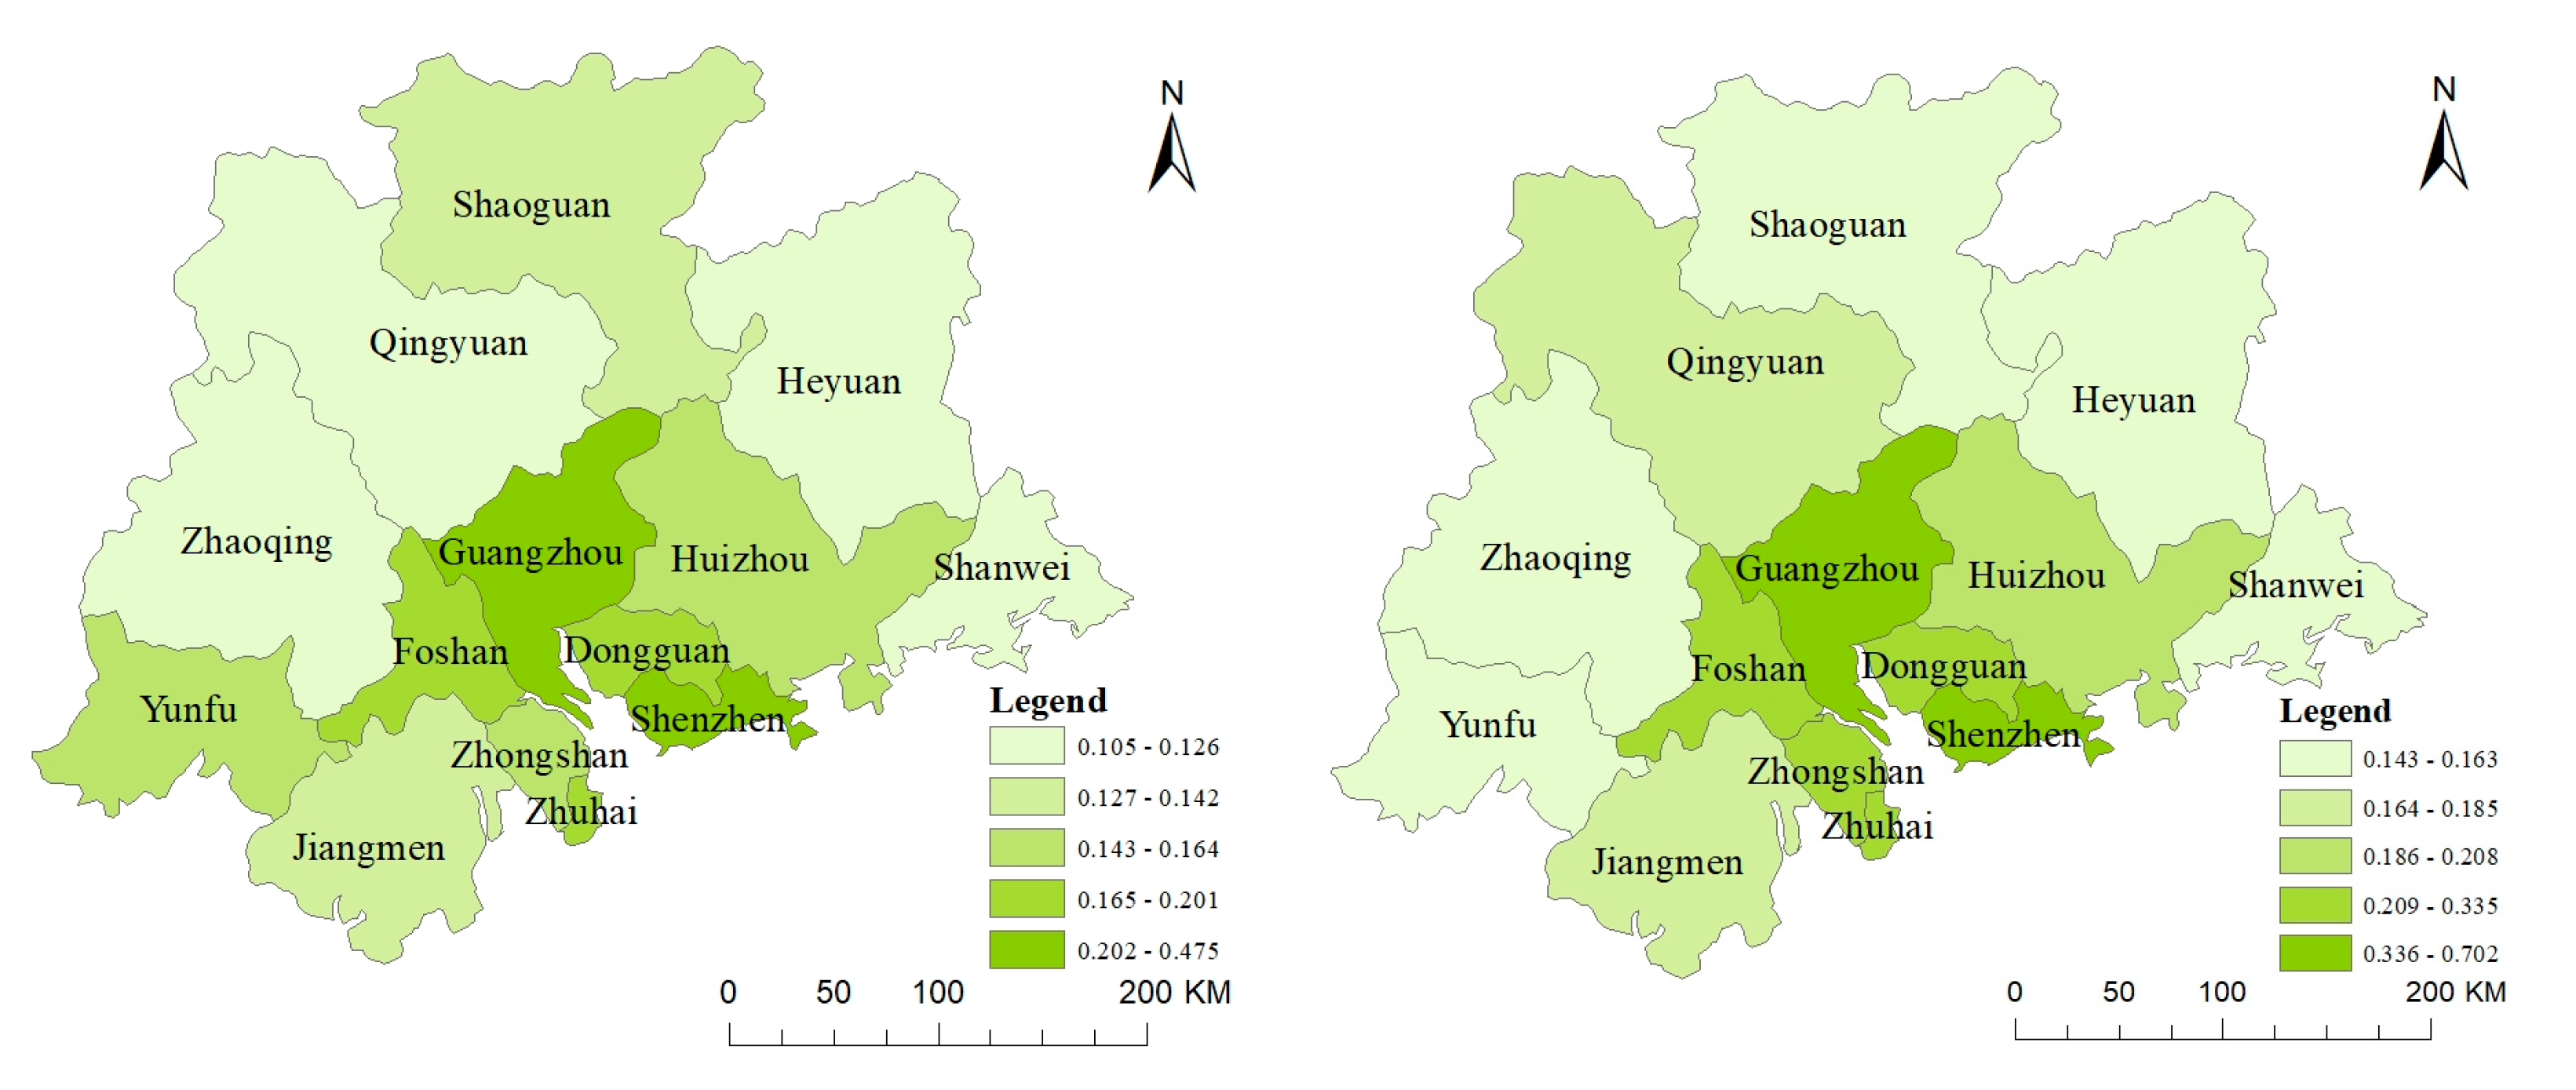
4.1.2. Spatial Characteristics of ULHU
4.2. Configuration Analysis of ULHU
4.2.1. Necessary Condition Analysis
4.2.2. Sufficient Condition Analysis
- (1)
- Period 1 (2005):
- (1)
- Population-industry-talent driven (H1a): H1a is a configuration that highlights the central role played by population density, industrial structure, and talent resources. For these cities, they can attract a significant number of people as the labor force. Simultaneously, this population growth, when coupled with industrial development, can provide sufficient resources to strengthen the construction of urban infrastructure, which can facilitate the transfer of talent resources and improve the level of ULHU. Guangzhou, Shenzhen, Foshan, and Dongguan serve as cases in this configuration. Among them, Guangzhou and Shenzhen, being top-tier cities in China, possess exceptional populations and reserve a substantial pool of talent resources, thereby demonstrating their leading and exemplary roles. Hence, this configuration is particularly suitable for cities with high economic levels. Such cities have the ability to attract and gather production factors, leading to the formation of agglomerative economies.
- (2)
- Openness-fiscal-talent driven (H1b): H1b is a configuration that emphasizes the central role played by openness to the outside world, fiscal capacity, and talent resources. Foreign investment catalyzes by providing additional capital and production factors. When combined with the government’s fiscal investment to promote economic flows and optimize resource allocation, it leads to enhanced regional economic growth and enhanced ULHU. The external benefits brought by talents can further accelerate the process. Zhaoqing stands out as a typical example among the cases within this configuration, which showcases the proactive efforts of governments in developing local openness levels and enhancing talent attraction capabilities. Therefore, this configuration is well-suited for those who can effectively utilize fiscal revenue and external resources to facilitate the development of local cities. By leveraging these resources, the ULHU can be improved, leading to enhanced urban development and overall well-being.
- (2)
- Periods 2–3 (2010 and 2015):
- (3)
- Period 4 (2020):
- (1)
- Population-led (H3a): H3a reflects a configuration where population density serves as the core condition, while the industrial structure and openness to the outside world play a supportive role. This configuration highlights that as population density increases, both the government and enterprises are compelled to adopt efficient policies and strategies to enhance the efficiency of resource utilization and allocation. This, in turn, facilitates the realization of economies of scale, and improves the use and transfer of production factors. Moreover, foreign investment will be utilized to bridge the capital gap, as well as foster the development of advanced technologies. Consequently, productivity can be boosted in these cities, and the ULHU and economic levels can be promoted accordingly. This configuration can effectively explain the dynamics of three cities: Guangzhou, Shenzhen, and Zhongshan. It indicates that these cities are inclined to attract more production factors, such as talents and innovative resources, as well as build an enhanced level of economic openness, which will result in a higher level of ULHU.
- (2)
- Population-industry driven (H3b): The H3b highlights the significance of population density and industrial structure as core conditions, emphasizing the complementary role of talents. The concentration of the population and the growing number of industrial enterprises in the PRD region imply an increase in manufacturing activities. This, in turn, generates substantial capital that can be utilized for local development and further promotes the ULHU. While talent does play a role in this context, it appears to have a relatively minor impact compared to population and industrial resources. This suggests that while talents contribute to improving the efficiency of production factor utilization, their influence is not as significant as the availability of a large population and abundant industrial resources. Cities such as Guangzhou, Shenzhen, Foshan, and Dongguan exemplify cases that can be interpreted within this configuration. These cities have significant advantages in terms of population size, economic development capacity, and talent attraction capacity. In the context of rapid urbanization in China, the collective development of these conditions becomes a pathway to promote ULHU.
4.3. Comparison of Configurations of ULHU
5. Discussions
5.1. Characteristics of Pathways towards ULHU
5.2. Policy Implications
5.3. Theoretical Contributions and Research Limitations
6. Conclusions
- (1)
- The spatial and temporal patterns revealed a widening gap in the level of ULHU among cities within the PRD region. The ULHU levels exhibited heterogeneity, characterized by distinct spatial clustering and a notable “core-periphery” dynamic. Over time, there has been a gradual transition from a fragmented distribution pattern to a more centralized one. Notably, Guangzhou and Shenzhen have emerged as frontrunners in ULHU, reaping the benefits of their rapid economic development.
- (2)
- There are a total of four configurations identified in the study, including Population-industry-talent driven, Openness-fiscal-talent driven, Population-led, and Population-industry driven. The analysis of the driving mechanism has revealed that population density and industrial structure play a central and consistent role in the evolution of ULHU. These two factors exhibited a complementary relationship and served as crucial conditions for achieving ULHU. Conversely, the factors of openness to the outside world and fiscal capacity play a less central role. Consequently, cities enhance their ULHU levels by leveraging the support provided by the core conditions.
Author Contributions
Funding
Data Availability Statement
Conflicts of Interest
References
- Bayer, A.D.; Lautenbach, S.; Arneth, A. Benefits and Trade-Offs of Optimizing Global Land Use for Food, Water, and Carbon. Proc. Natl. Acad. Sci. USA 2023, 120, e2220371120. [Google Scholar] [CrossRef] [PubMed]
- Lu, S.; Zhou, Y.; Song, W. Uncoordinated Urbanization and Economic Growth—The Moderating Role of Natural Resources. Growth Chang. 2021, 52, 2071–2098. [Google Scholar] [CrossRef]
- Nautiyal, S.; Goswami, M.; Shivakumar, P. Urbanization and Peri-Urbanization in Bengaluru. In Field Margin Vegetation and Socio-Ecological Environment; Environmental Science and Engineering; Springer International Publishing: Cham, Switzerland, 2021; pp. 17–40. ISBN 978-3-030-69200-1. [Google Scholar]
- Steinhäußer, R.; Siebert, R.; Steinführer, A.; Hellmich, M. National and Regional Land-Use Conflicts in Germany from the Perspective of Stakeholders. Land Use Policy 2015, 49, 183–194. [Google Scholar] [CrossRef]
- United Nations. World Urbanization Prospects, the 2011 Revision; United Nations: New York, NY, USA, 2012.
- Seto, K.C.; Güneralp, B.; Hutyra, L.R. Global Forecasts of Urban Expansion to 2030 and Direct Impacts on Biodiversity and Carbon Pools. Proc. Natl. Acad. Sci. USA 2012, 109, 16083–16088. [Google Scholar] [CrossRef] [PubMed]
- Cheng, Z.; Li, X.; Zhang, Q. Can New-Type Urbanization Promote the Green Intensive Use of Land? J. Environ. Manag. 2023, 342, 118150. [Google Scholar] [CrossRef] [PubMed]
- Mcdonald, R.I.; Kareiva, P.; Forman, R.T.T. The Implications of Current and Future Urbanization for Global Protected Areas and Biodiversity Conservation. Biol. Conserv. 2008, 141, 1695–1703. [Google Scholar] [CrossRef]
- Mckinney, M.L. Urbanization, Biodiversity, and Conservation. BioScience 2002, 52, 883. [Google Scholar] [CrossRef]
- Chen, D.; Hu, W.; Li, Y.; Zhang, C.; Lu, X.; Cheng, H. Exploring the Temporal and Spatial Effects of City Size on Regional Economic Integration: Evidence from the Yangtze River Economic Belt in China. Land Use Policy 2023, 132, 106770. [Google Scholar] [CrossRef]
- Menzori, I.D.; Sousa, I.C.N.D.; Gonçalves, L.M. Urban Growth Management and Territorial Governance Approaches: A Master Plans Conformance Analysis. Land Use Policy 2021, 105, 105436. [Google Scholar] [CrossRef]
- Zhao, J.; Zhu, D.; Cheng, J.; Jiang, X.; Lun, F.; Zhang, Q. Does Regional Economic Integration Promote Urban Land Use Efficiency? Evidence from the Yangtze River Delta, China. Habitat Int. 2021, 116, 102404. [Google Scholar] [CrossRef]
- Qu, Y.; Zhang, Q.; Zhan, L.; Jiang, G.; Si, H. Understanding the Nonpoint Source Pollution Loads’ Spatiotemporal Dynamic Response to Intensive Land Use in Rural China. J. Environ. Manag. 2022, 315, 115066. [Google Scholar] [CrossRef] [PubMed]
- Liu, Y.; Fang, F.; Li, Y. Key Issues of Land Use in China and Implications for Policy Making. Land Use Policy 2014, 40, 6–12. [Google Scholar] [CrossRef]
- Li, X.; Li, S.; Li, C.; Shi, J.; Wang, N. The Impact of High-Quality Development on Ecological Footprint: An Empirical Research Based on STIRPAT Model. Ecol. Indic. 2023, 154, 110881. [Google Scholar] [CrossRef]
- Song, C.; Liu, Q.; Song, J.; Jiang, Z.; Lu, Z.; Chen, Y. Land Use Efficiency in the Yellow River Basin in the Background of China’s Economic Transformation: Spatial-Temporal Characteristics and Influencing Factors. Land 2022, 11, 2306. [Google Scholar] [CrossRef]
- Yan, Y.; Ju, H.; Zhang, S.; Jiang, W. Spatiotemporal Patterns and Driving Forces of Urban Expansion in Coastal Areas: A Study on Urban Agglomeration in the Pearl River Delta, China. Sustainability 2019, 12, 191. [Google Scholar] [CrossRef]
- Peng, C.; Song, M.; Han, F. Urban Economic Structure, Technological Externalities, and Intensive Land Use in China. J. Clean. Prod. 2017, 152, 47–62. [Google Scholar] [CrossRef]
- Pratama, A.P.; Yudhistira, M.H.; Koomen, E. Highway Expansion and Urban Sprawl in the Jakarta Metropolitan Area. Land Use Policy 2022, 112, 105856. [Google Scholar] [CrossRef]
- Zhang, P.; Yang, D.; Qin, M.; Jing, W. Spatial Heterogeneity Analysis and Driving Forces Exploring of Built-up Land Development Intensity in Chinese Prefecture-Level Cities and Implications for Future Urban Land Intensive Use. Land Use Policy 2020, 99, 104958. [Google Scholar] [CrossRef]
- Gao, X.; Zhang, A.; Sun, Z. How Regional Economic Integration Influence on Urban Land Use Efficiency? A Case Study of Wuhan Metropolitan Area, China. Land Use Policy 2020, 90, 104329. [Google Scholar] [CrossRef]
- Wu, J.; Wu, C.; Zhang, Q.; Zhuang, M.; Xiao, H.; Wu, H.; Ouyang, L.; Liu, Y.; Meng, C.; Song, C.; et al. Spatiotemporal Evolution of Urban Agglomeration and Its Impact on Landscape Patterns in the Pearl River Delta, China. Remote Sens. 2023, 15, 2520. [Google Scholar] [CrossRef]
- Zhang, Z.; Zuo, Q.; Li, D.; Wu, Q.; Ma, J. The Relationship between Resource Utilization and High-Quality Development in the Context of Carbon Neutrality: Measurement, Assessment and Identification. Sustain. Cities Soc. 2023, 94, 104551. [Google Scholar] [CrossRef]
- Kretzer, G.; Kanashiro, M.; Tibiriçá de Saboya, R. Complementarity between urban land uses: A temporal analysis. J. Urban Des. 2023, 1–18. [Google Scholar] [CrossRef]
- Deprêtre, A.; Jacquinod, F.; Barroca, B.; Becue, V. Development of an Intensity of Uses Index to Support Design Decision-Making and Improve Urban Development Quality. Cities 2024, 147, 104779. [Google Scholar] [CrossRef]
- Hsu, K.-C. Effect of Distinct Land Use Patterns on Quality of Life in Urban Settings. J. Urban Plann. Dev. 2019, 145, 05019016. [Google Scholar] [CrossRef]
- Butsic, V.; Radeloff, V.C.; Kuemmerle, T.; Pidgeon, A.M. Analytical Solutions to Trade-Offs between Size of Protected Areas and Land-Use Intensity. Conserv. Biol. 2012, 26, 883–893. [Google Scholar] [CrossRef] [PubMed]
- Brenton, S.; Baekkeskov, E.; Hannah, A. Policy Capacity: Evolving Theory and Missing Links. Policy Stud. 2023, 44, 297–315. [Google Scholar] [CrossRef]
- Chakrabarty, A. Power in Policymaking: Origin and Influence. Int. J. Sustain. Policy Pract. 2023, 19, 29–44. [Google Scholar] [CrossRef]
- Yin, Z.; Liu, Y.; Tang, L.; Zhou, W.; Pan, Y. Spatial-Temporal Evolution of Agricultural Land Utilization Benefits and Tradeoffs/Synergies in the Beijing-Tianjin-Hebei Region. Ecol. Indic. 2023, 156, 111110. [Google Scholar] [CrossRef]
- Xu, F.; Wang, Z.; Chi, G.; Zhang, Z. The Impacts of Population and Agglomeration Development on Land Use Intensity: New Evidence behind Urbanization in China. Land Use Policy 2020, 95, 104639. [Google Scholar] [CrossRef]
- Wang, Z.; Fu, H.; Liu, H.; Liao, C. Urban development sustainability, industrial structure adjustment, and land use efficiency in China. Sustain. Cities Soc. 2023, 89, 104338. [Google Scholar] [CrossRef]
- Simmie, J. Innovation and Clustering in the Globalised International Economy. Urban Stud. 2004, 41, 1095–1112. [Google Scholar] [CrossRef]
- Hu, W.; Li, Z.; Chen, D.; Zhu, Z.; Peng, X.; Liu, Y.; Liao, D.; Zhao, K. Unlocking the Potential of Collaborative Innovation to Narrow the Inter-City Urban Land Green Use Efficiency Gap: Empirical Study on 19 Urban Agglomerations in China. Environ. Impact Assess. Rev. 2024, 104, 107341. [Google Scholar] [CrossRef]
- Sun, C.; Zhang, S.; Song, C.; Xu, J.; Fan, F. Investigation of Dynamic Coupling Coordination between Urbanization and the Eco-Environment—A Case Study in the Pearl River Delta Area. Land 2021, 10, 190. [Google Scholar] [CrossRef]
- Cannatella, D. Industrial Transformation and Sustainable Urban Planning in the Pearl River Delta: A Landscape-Based Approach. In Adaptive Urban Transformation; Nijhuis, S., Sun, Y., Lange, E., Eds.; The Urban Book Series; Springer International Publishing: Cham, Switzerland, 2023; pp. 209–232. ISBN 978-3-030-89827-4. [Google Scholar]
- Lv, C.; Lian, A.; Wang, Z.; Jia, T.; Sun, X.; Dong, R. A Spatiotemporal Pattern Analysis of High-Frequency Land-Use Changes in the Guangdong–Hong Kong–Macao Greater Bay Area, from 1990 to 2018. Land 2022, 12, 102. [Google Scholar] [CrossRef]
- Yang, R.; Qin, B.; Lin, Y. Assessment of the Impact of Land Use Change on Spatial Differentiation of Landscape and Ecosystem Service Values in the Case of Study the Pearl River Delta in China. Land 2021, 10, 1219. [Google Scholar] [CrossRef]
- Patchell, J. China’s Greater Bay Area: Agglomeration, External Economies, Governance and Urbanization, 1st ed.; Routledge: London, UK, 2023; ISBN 978-1-00-302794-2. [Google Scholar]
- Wang, F.; Wang, R.; He, Z. The Impact of Environmental Pollution and Green Finance on the High-Quality Development of Energy Based on Spatial Dubin Model. Resour. Policy 2021, 74, 102451. [Google Scholar] [CrossRef]
- Lu, X.; Tao, X.; Kuang, B.; Tang, Y.; Wang, M. Environmental Assessment, Environmental Attention of Government and Green Utilization Efficiency of Urban Land. China Land Sci. 2023, 37, 104–112. [Google Scholar]
- Kuang, B.; Liu, J.; Fan, X. Has China’s Low-Carbon City Construction Enhanced the Green Utilization Efficiency of Urban Land? IJERPH 2022, 19, 9844. [Google Scholar] [CrossRef]
- Wu, F.; Yang, X.; Chen, Y. Financial Agglomeration and Urban Economic Quality—A Three-Dimensional Perspective of Efficiency, Resilience and Vitality. J. Cap. Univ. Econ. Bus. 2022, 24, 73–87. [Google Scholar]
- Yu, J.; Zhou, K.; Yang, S. Land Use Efficiency and Influencing Factors of Urban Agglomerations in China. Land Use Policy 2019, 88, 104143. [Google Scholar] [CrossRef]
- Lu, X.; Chen, D.; Kuang, B.; Zhang, C.; Cheng, C. Is High-Tech Zone a Policy Trap or a Growth Drive? Insights from the Perspective of Urban Land Use Efficiency. Land Use Policy 2020, 95, 104583. [Google Scholar] [CrossRef]
- Li, J.; Wang, M. The Dual Regulatory Paths of Collaborative Innovation between Local Governments and Enterprises from the Perspective of R&D Subsidy. Sci. Sci. Manag. S. T. 2023, 1–18. [Google Scholar]
- Xu, W.; Xu, Z.; Liu, C. Coupling Analysis of Land Intensive Use Efficiency and Ecological Well-Being Performance of Cities in the Yellow River Basin. J. Nat. Resour. 2021, 36, 114–130. [Google Scholar] [CrossRef]
- Ke, N.; Lu, X.; Zhang, X.; Kuang, B.; Zhang, Y. Urban Land Use Carbon Emission Intensity in China under the “Double Carbon” Targets: Spatiotemporal Patterns and Evolution Trend. Env. Sci. Pollut. Res. 2022, 30, 18213–18226. [Google Scholar] [CrossRef] [PubMed]
- Pan, Y.; Chen, H.; Zhang, Z. Urban Interaction: Spatial Interaction Effects and Driving Factors of High-Quality Use of Urban Land in the Yangtze River Delta. Resour. Environ. Yangtze Basin 2023, 32, 1885–1897. [Google Scholar]
- Fu, Y.; Zhou, T.; Yao, Y.; Qiu, A.; Wei, F.; Liu, J.; Liu, T. Evaluating Efficiency and Order of Urban Land Use Structure: An Empirical Study of Cities in Jiangsu, China. J. Clean. Prod. 2021, 283, 124638. [Google Scholar] [CrossRef]
- Chen, D.; Lu, X.; Hu, W.; Zhang, C.; Lin, Y. How Urban Sprawl Influences Eco-Environmental Quality: Empirical Research in China by Using the Spatial Durbin Model. Ecol. Indic. 2021, 131, 108113. [Google Scholar] [CrossRef]
- He, C.; He, S.; Mu, E.; Peng, J. Environmental Economic Geography: Recent Advances and Innovative Development. Geogr. Sustain. 2022, 3, 152–163. [Google Scholar] [CrossRef]
- Zhang, J.; Zhang, D.; Huang, L.; Wen, H.; Zhao, G.; Zhan, D. Spatial Distribution and Influential Factors of Industrial Land Productivity in China’s Rapid Urbanization. J. Clean. Prod. 2019, 234, 1287–1295. [Google Scholar] [CrossRef]
- He, S.; Yu, S.; Li, G.; Zhang, J. Exploring the Influence of Urban Form on Land-Use Efficiency from a Spatiotemporal Heterogeneity Perspective: Evidence from 336 Chinese Cities. Land Use Policy 2020, 95, 104576. [Google Scholar] [CrossRef]
- Wu, F. Land Financialisation and the Financing of Urban Development in China. Land Use Policy 2022, 112, 104412. [Google Scholar] [CrossRef]
- Zhao, K.; Chen, D.; Zhang, X.; Zhang, X. How Do Urban Land Expansion, Land Finance, and Economic Growth Interact? IJERPH 2022, 19, 5039. [Google Scholar] [CrossRef]
- Gu, H.; Meng, X.; Shen, T.; Wen, L. China’s Highly Educated Talents in 2015: Patterns, Determinants and Spatial Spillover Effects. Appl. Spat. Anal. 2020, 13, 631–648. [Google Scholar] [CrossRef]
- Andrews, R.; Beynon, M.J.; McDermott, A.M. Organizational Capability in the Public Sector: A Configurational Approach. J. Public Adm. Res. Theory 2016, 26, 239–258. [Google Scholar] [CrossRef]
- Invernizzi, D.C.; Locatelli, G.; Brookes, N.; Davis, A. Qualitative Comparative Analysis as a Method for Project Studies: The Case of Energy Infrastructure. Renew. Sustain. Energy Rev. 2020, 133, 110314. [Google Scholar] [CrossRef]
- Verweij, S.; Trell, E.-M. Qualitative Comparative Analysis (QCA) in Spatial Planning Research and Related Disciplines: A Systematic Literature Review of Applications. J. Plan. Lit. 2019, 34, 300–317. [Google Scholar] [CrossRef]
- Damonte, A. Modeling Configurational Explanations. Riv. Ital. Sci. Polit. 2021, 51, 182–197. [Google Scholar] [CrossRef]
- Qin, M.; Tao, Q.; Du, Y. Policy Implementation and Project Performance: A Qualitative Comparative Analysis Based on 29 National Marine Ranchings in China. Mar. Policy 2021, 129, 104527. [Google Scholar] [CrossRef]
- Dul, J.; Van Der Laan, E.; Kuik, R. A Statistical Significance Test for Necessary Condition Analysis. Organ. Res. Methods 2020, 23, 385–395. [Google Scholar] [CrossRef]
- Van Der Zon, M.; De Jong, W.; Arts, B. Community Enforcement and Tenure Security: A Fuzzy-Set Qualitative Comparative Analysis of Twelve Community Forest Management Initiatives in the Peruvian Amazon. World Dev. 2023, 161, 106071. [Google Scholar] [CrossRef]
- Wang, W.; Lan, Y.; Wang, X. Impact of Livelihood Capital Endowment on Poverty Alleviation of Households under Rural Land Consolidation. Land Use Policy 2021, 109, 105608. [Google Scholar] [CrossRef]
- Greckhamer, T.; Furnari, S.; Fiss, P.C.; Aguilera, R.V. Studying Configurations with Qualitative Comparative Analysis: Best Practices in Strategy and Organization Research. Strateg. Organ. 2018, 16, 482–495. [Google Scholar] [CrossRef]
- Wang, S.; Liu, J.; Qin, X. Financing Constraints, Carbon Emissions and High-Quality Urban Development—Empirical Evidence from 290 Cities in China. IJERPH 2022, 19, 2386. [Google Scholar] [CrossRef]
- Schneider, C.Q.; Wagemann, C. Set-Theoretic Methods for the Social Sciences: A Guide to Qualitative Comparative Analysis, 1st ed.; Cambridge University Press: Cambridge, UK, 2012; ISBN 978-1-107-01352-0. [Google Scholar]
- Schneider, C.Q.; Wagemann, C. Standards of Good Practice in Qualitative Comparative Analysis (QCA) and Fuzzy-Sets. Comp. Sociol. 2010, 9, 397–418. [Google Scholar] [CrossRef]
- Pappas, I.O.; Woodside, A.G. Fuzzy-Set Qualitative Comparative Analysis (fsQCA): Guidelines for Research Practice in Information Systems and Marketing. Int. J. Inf. Manag. 2021, 58, 102310. [Google Scholar] [CrossRef]

| Criterion Layer | Indicator Layer | Definition | Reference | Attribute |
|---|---|---|---|---|
| High-quality strategic layout | Government attention | Quantify the frequency of environmental keywords | [41] | + |
| Social needs | The ratio of employees in the tertiary industries to total population | [42] | + | |
| Policy transformation | The proportion of government research and development (R&D) expenditure to GDP | [43] | + | |
| High-quality resource allocation | Total quantity | Urban construction land area | [44] | − |
| Structural adjustment | The proportion of tertiary industries to secondary industries | [45] | + | |
| Development patterns conversion | The total sales revenue of new products by industrial enterprises in the city | [46] | + | |
| High-quality process regulation | Energy saving restrictions | Per capita water consumption | [47] | − |
| Emission reduction regulations | Total amount of SO2 emissions | [44] | − | |
| Low-carbon governance | Carbon emission intensity | [48] | − | |
| High-quality output synergy | Economic development | The output value of the tertiary industry | [47] | + |
| Life security | Per capita disposable income of urban residents | [49] | + | |
| Ecological harmony | Green coverage rate of built-up area | [50] | + |
| Variable Set | Variables | Descriptive Statistics | |||
|---|---|---|---|---|---|
| AVERAGE | STDEVP | MAX | MIN | ||
| Outcome Variables | Comprehensive index of ULHU | 0.19 | 0.12 | 0.70 | 0.08 |
| Condition Variables | Population | 1395.23 | 1773.95 | 8828.00 | 154.00 |
| Industrial | 2874.34 | 2876.66 | 11,525.00 | 179.00 | |
| Openness | 47.09 | 32.58 | 143.22 | 4.44 | |
| Fiscal | 0.98 | 1.08 | 4.79 | 0.01 | |
| Talent | 106,772.60 | 243,226.80 | 1,307,144.00 | 3351.00 | |
| City | 2005 | 2010 | 2015 | 2020 |
|---|---|---|---|---|
| Guangzhou | 0.1749 | 0.2873 | 0.4221 | 0.6044 |
| Shenzhen | 0.1640 | 0.3253 | 0.4748 | 0.7011 |
| Foshan | 0.1043 | 0.1477 | 0.1852 | 0.2965 |
| Dongguan | 0.1336 | 0.2181 | 0.1945 | 0.3354 |
| Huizhou | 0.0790 | 0.1060 | 0.1641 | 0.2081 |
| Zhongshan | 0.0921 | 0.1317 | 0.1636 | 0.3192 |
| Zhuhai | 0.0873 | 0.1090 | 0.2005 | 0.2731 |
| Jiangmen | 0.1034 | 0.1034 | 0.1350 | 0.1851 |
| Zhaoqing | 0.1352 | 0.1156 | 0.1179 | 0.1498 |
| Shanwei | 0.0867 | 0.0930 | 0.1062 | 0.1447 |
| Qingyuan | 0.1027 | 0.0846 | 0.1257 | 0.1793 |
| Yunfu | 0.1573 | 0.1397 | 0.1582 | 0.1629 |
| Heyuan | 0.0954 | 0.2121 | 0.1220 | 0.1491 |
| Shaoguan | 0.0949 | 0.1203 | 0.1422 | 0.1519 |
| Average | 0.1150 | 0.1567 | 0.1937 | 0.2758 |
| Condition Variables | Urban Land High-Quality Use | Urban Land Low-Quality Use | ||
|---|---|---|---|---|
| Consistency | Coverage | Consistency | Coverage | |
| Population | 0.9255 | 0.8533 | 0.3984 | 0.4840 |
| ~Population | 0.4404 | 0.3571 | 0.8793 | 0.9396 |
| Industrial | 0.8692 | 0.8523 | 0.3593 | 0.4643 |
| ~Industrial | 0.4536 | 0.3495 | 0.8857 | 0.8992 |
| Openness | 0.7053 | 0.7053 | 0.4397 | 0.5795 |
| ~Openness | 0.5795 | 0.4397 | 0.7764 | 0.7764 |
| Fiscal | 0.3974 | 0.3324 | 0.8291 | 0.9141 |
| ~Fiscal | 0.8974 | 0.7994 | 0.3945 | 0.4631 |
| Talent | 0.8228 | 0.8339 | 0.4334 | 0.5789 |
| ~Talent | 0.5844 | 0.4391 | 0.8756 | 0.8669 |
| Condition Variable | Configuration | |
|---|---|---|
| H1a | H1b | |
| Population |  | ⊗ |
| Industrial | | ⊗ |
| Openness | ⊗ | |
| Fiscal | ⊗ | |
| Talent | | |
| Consistency | 0.8771 | 0.9161 |
| Raw coverage | 0.4666 | 0.1946 |
| Unique coverage | 0.3597 | 0.0877 |
| Overall Solution Consistency | 0.8797 | |
| Overall Solution Coverage | 0.5543 | |
represents the presence of core conditions, ⊗ represents the absence of core conditions, • represents the presence of peripheral conditions, ⊗ represents the absence of peripheral conditions.| Condition Variable | 2010 | 2015 |
|---|---|---|
| H2a | H2b | |
| Population | | |
| Industrial | | |
| Openness | ||
| Fiscal | ⊗ | ⊗ |
| Talent | | |
| Consistency | 0.9243 | 0.9296 |
| Raw coverage | 0.5481 | 0.6605 |
| Unique coverage | 0.5481 | 0.6605 |
| Overall Solution Consistency | 0.9243 | 0.9296 |
| Overall Solution Coverage | 0.5481 | 0.6605 |
represents the presence of core conditions, ⊗ represents the absence of core conditions, • represents the presence of peripheral conditions, ⊗ represents the absence of peripheral conditions.| Condition Variable | Configuration | |
|---|---|---|
| H3a | H3b | |
| Population | | |
| Industrial | • | |
| Openness | • | |
| Fiscal | ⊗ | ⊗ |
| Talent | • | |
| Consistency | 0.9601 | 0.9650 |
| Raw coverage | 0.5977 | 0.6854 |
| Unique coverage | 0.0497 | 0.1374 |
| Overall Solution Consistency | 0.9673 | |
| Overall Solution Coverage | 0.7351 | |
represents the presence of core conditions, ⊗ represents the absence of core conditions, • represents the presence of peripheral conditions, ⊗ represents the absence of peripheral conditions.Disclaimer/Publisher’s Note: The statements, opinions and data contained in all publications are solely those of the individual author(s) and contributor(s) and not of MDPI and/or the editor(s). MDPI and/or the editor(s) disclaim responsibility for any injury to people or property resulting from any ideas, methods, instructions or products referred to in the content. |
© 2024 by the authors. Licensee MDPI, Basel, Switzerland. This article is an open access article distributed under the terms and conditions of the Creative Commons Attribution (CC BY) license (https://creativecommons.org/licenses/by/4.0/).
Share and Cite
Li, Y.; Chen, D.; Tao, X.; Peng, X.; Lu, X.; Zhu, Z. Spatio–Temporal Patterns and Driving Mechanisms of Urban Land High-Quality Use: Evidence from the Greater Pearl River Delta Urban Agglomeration. Land 2024, 13, 277. https://doi.org/10.3390/land13030277
Li Y, Chen D, Tao X, Peng X, Lu X, Zhu Z. Spatio–Temporal Patterns and Driving Mechanisms of Urban Land High-Quality Use: Evidence from the Greater Pearl River Delta Urban Agglomeration. Land. 2024; 13(3):277. https://doi.org/10.3390/land13030277
Chicago/Turabian StyleLi, Yuying, Danling Chen, Xiangqian Tao, Xiaotao Peng, Xinhai Lu, and Ziyang Zhu. 2024. "Spatio–Temporal Patterns and Driving Mechanisms of Urban Land High-Quality Use: Evidence from the Greater Pearl River Delta Urban Agglomeration" Land 13, no. 3: 277. https://doi.org/10.3390/land13030277
APA StyleLi, Y., Chen, D., Tao, X., Peng, X., Lu, X., & Zhu, Z. (2024). Spatio–Temporal Patterns and Driving Mechanisms of Urban Land High-Quality Use: Evidence from the Greater Pearl River Delta Urban Agglomeration. Land, 13(3), 277. https://doi.org/10.3390/land13030277