Abstract
Climate change poses a fundamental threat to the wetlands. The Mediterranean basin is a biodiversity hotspot, and wetlands are important for maintaining this status. The current study evaluated the halophilous vegetation diversity of one of the most relevant Maltese wetlands, Il-Ballut ta’ Marsaxlokk Natura 2000 site, also identified under the Water Framework Directive. A vegetation analysis was carried out according to the Braun–Blanquet approach. The processed dataset included both data from the literature and unpublished data. To quantify vegetation structure and diversity, a hierarchical classification (Chord distance; Ward linkage) and diversity and ecological indices were performed. Diachronic analysis of the taxonomic diversity indices and the Ellenberg indicator values were taken into account. We used an NMDS analysis to assess the ecological fingerprint of the vegetation. In addition, we provided an actual vegetation map for Il-Ballut ta’ Marsaxlokk, based on drone orthophotos. We identified five EU Directive habitats in the study area (1150*, 1310, 1410, 1420, and 92D0) of which one (1150*) was reported for the first time. The ecological fingerprint of the halophilous vegetation has undergone changes over time, particularly due to increasing temperatures. In fact, the results showed that nutrients and temperature were the strongest environmental drivers of the site. The results and methodology of this study demonstrate how vegetation studies can serve as tools to improve knowledge, management actions, and landscape planning of Natura 2000 sites.
1. Introduction
Wetlands are important ecosystems that provide various ecological services such as coastal protection, habitats for numerous species, and carbon sequestration [1,2]. They cover just around 5–8% of the global terrestrial surface yet account for 20–30% of the global carbon pool [3]. Wetlands are essential for humanity and the environment, and they are frequently identified as the most valuable habitats in a landscape. Global climate processes have undergone extraordinary alterations since the 1950s. The last three decades have seen a warmer climate on the Earth’s surface [4,5]. Climate change has been recognized as a significant threat to wetlands. Climate change can impact wetlands through direct and indirect effects such as rising temperatures, changes in rainfall intensity and frequency, and extreme climatic events such as drought, flooding, and storm frequency [6]. Climate change is a significant stress that can disturb native wetland plant communities and cause extensive ecosystem structure and function changes [7]. Scholars have shown that climate variation can cause changes in vegetation coverage [8,9]. According to Médail [10], ‘natural island microcosms’ are undoubtedly ideal sites to study species or community adaptation to climate change by species or communities. Recently, more than 16,000 wetlands were mapped from almost all of the Mediterranean, which is a crucial area from a biodiversity point of view [11]. This paper presents a case study of a significant Maltese wetland. The Maltese Archipelago is situated in the Central Mediterranean, about 96 km south of Sicily and 284 km from Tunisia [12]. Nevertheless, despite its small surface area, Malta is the most densely populated country in the EU, with 1649 persons per square kilometer [13]. The saline marshlands of the Maltese Islands are coastal wetland biotopes defined by the presence of brackish water and a substratum of sandy/silty sediment. These habitats form at the mouth of valley systems where freshwater and sediment from inland sources interact with seawater. Saline marshlands in Malta are uncommon due to the preponderance of rocky coastlines. Moreover, there are no pristine saline marshlands in the Maltese Islands, and the habitats that currently function as such are generally subject to intensive management and modification [14]. Il-Maghluq ta’ Marsaxlokk is an important wetland within the Il-Ballut ta’ Marsaxlokk Natura 2000 site (code: MT0000014) and is listed under the Water Framework Directive. Notwithstanding their importance in the Maltese and European ecological networks, throughout the years, this site has been subjected to several severe stressors [15]. However, knowledge regarding salt marsh plant communities is poor and has not been updated in the last decade [16]. It is worth mentioning that plant species diversity is a significant feature of biodiversity in wetlands. Analyzing vegetation change is fundamental for conserving, restoring, planning, and managing the wetland landscape. Therefore, a proper assessment of plant diversity is necessary to quantify the impacts of climate change on the Il-Ballut ta’ Marsaxlokk wetland. This paper provides a comparative analysis of the salt marsh vegetation in the Il-Ballut ta’ Marsaxlokk wetland over time (1986 to 2022) using diversity and ecological indices, as well as mapping of the site’s biotope distribution under the objectives of Directive 92/43/EEC.
2. Materials and Methods
2.1. Study Area
Il-Ballut ta’ Marsaxlokk is a Special Area of Conservation (SAC) of International Importance situated in the southeast of Malta (Figure 1). A typical biseasonal Mediterranean climate with mild, wet winters and hot, dry summers characterizes the area. Il-Ballut saline marshland (coastal wetland) is located close to Il-Magħluq ta’ Marsaxlokk, a man-made enclosure for fishermen’s vessels. The site boundary of Il-Ballut incorporates the saline marshland habitats found in the southeast area of the site, the manmade structures at Magħluq, part of Triq il-Power Station, and the fields at Il-Ballut, l-Imsewweb and Tas-Silġ [15]. In the 1950s, this area was part of a series of low-lying fishponds built out of masonry for fish rearing. By the late 1950s, these ponds were dredged to make way for a quay for fishing boats, and only the remnants of the ponds remain flanked by agricultural land. The ponds progressively silted up and were colonized later by vascular plants including Arthrocnemum meridionale (Ramírez, Rufo, Sánchez-Mata & de la Fuente) de la Fuente, Sánchez-Gavilán, Ramírez, Rufo, Sánchez-Mata, Soda inermis Fourr. and Tamarix africana Poir. It was identified by Schembri et al. [17] as a small but very important wetland supporting interaction between halophilous plants and animals. However, the situation started to degrade due to more intensive use of the quay. The situation evolved until the 1990s when environmental engineering works included an embankment on the wetland site. Although much of the flora present was intentionally introduced, regeneration has mostly followed natural pathways driven by abiotic factors, tolerance, and interspecific competition [14]. In 2006, the site was declared as “il-Magħluq coastal wetland” through Government Notice GN 1069/06 and scheduled as a Level 1 (highest level) Area of Ecological Importance/Site of Scientific Importance.
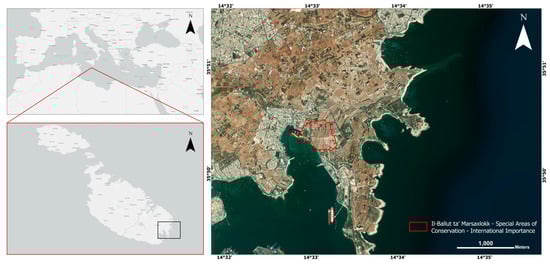
Figure 1.
Location of Il-Ballut ta’ Marsaxlokk S.A.C, Malta (red outline).
2.2. Vegetation Surveys
The vegetation of the salt marsh was investigated using literature searches and field surveys. With regard to the historical vegetation data, only one work carried out by Brullo et al. [16] reported quantitative data about the plant communities growing on the site. Although this research was recently published, the field surveys date back to 1986. In order to evaluate alterations in vegetation diversity over time, we examined records from the same season. Moreover, the database excluded any potential occurrence of “other species” (e.g., nitrophilous plants) in the relevés to avoid interferences in the statistical analysis. Our fieldwork was carried out in October 2022 and May 2023 using a phytosociological approach. This approach, also called the Braun–Blanquet approach [18], considered the relations of plant communities with the environment and the interactions within communities. The phytosociological relevés consider vegetation plots, vegetation cover, and species occurrence. According to the Braun–Blanquet scale, each species was assigned a coverage value ranging from 1 (1–5% coverage) to 5 (75–100% coverage), while for the sporadic species (<1% coverage), the “+” symbol was used. Moreover, drone surveys were carried out in June 2022 in order to evaluate the biotope distribution at the site. All drone flights were conducted using a DJI Mavic mini (SZ DJI Technology Co., Ltd. Shenzhen, China) with a stock camera. Individual flights were planned and carried out using the Litchi app [19] for DJI Drones. Images from each flight were further processed using WebODM [20]. The ortho-mosaic outputs were then imported into QGIS 3.22.8 software [21], and the habitat polygons were created using photo interpretation and field data. Subsequently, ArcGIS Pro 3.0.4 [22] was used for spatial data mapping and analysis. In line with Biondi et al. [23], the identification of EU habitats was carried out using the phytosociological approach. Finally, the habitat type codes were used in accordance with Directive 92/43/EEC [24]. Taxonomic identification was carried out using the “Flora of Italy” [25,26,27,28], while the nomenclature follows the “Portal to the Flora of Italy” [29], de la Fuente et al. [30], and Brullo et al. [16]. The nomenclature of the surveyed syntaxa follows the 4th edition of the International Code of Phytosociological Nomenclature [31], while the syntaxonomical arrangement follows Mucina et al. [32].
2.3. Data Analysis
The statistical, hierarchical classification, and diversity indices were performed using R 4.2.3 software [33]. In particular, the analyses were carried out using “vegan” and “vegetarian” packages [34,35]. The phytosociological relevés were organized into “communities” using hierarchical classification and ordination methods. A total of 26 relevés were processed, of which 13 were from Brullo et al. [16] and 13 were unpublished randomly selected relevés sampled in October 2022. According to Van der Maarel [36], we converted the combined cover–abundance data into an ordinal scale (1–9). The relevés were compared by means of the Ward linkage using Chord distance. The optimal number of clusters was identified using the Silhouette index calculated using the “cluster” package [37]. An analysis of the taxonomic salt marsh diversity for the two different datasets (1986 and 2022) was carried out using species richness, Shannon entropy, Shannon diversity, Shannon evenness, Simpson evenness, and Pielou evenness [38,39,40]. The values for the indices obtained from the two time periods were compared using Student’s t-test and Fisher’s test [41]. Ellenberg indicator values [42,43] for vascular plants were used for the ecological interpretation of all datasets. The Ellenberg ecological indicator values for light (L), temperature (T), soil moisture (M), soil reaction (R), nutrients (N), and salinity (S) were assigned according to Tichý et al. [44]. The environmental gradient of a relevé was calculated as a weighted average of the indicator values for all species present using their abundances as weights [45]. To analyze the vegetation ecological fingerprint and the relationships with environmental factors, we applied non-metric multidimensional scaling (NMDS) using Manhattan distance [46]. The permutation model “envfit” (vegan package) was used to fit the Ellenberg values to ordination diagrams, extracting the significance values and applying Bonferroni correction using the function “p.adjust” (stats package). According to Hill numbers [47], to measure the difference between the two time series, the effective number of species for the species richness, Shannon index, and Simpson index were calculated using the “q” function (vegetarian package). Finally, the multiplicative beta-diversity of the two datasets (1986 and 2022) was processed [40,48,49,50].
3. Results
3.1. Plant Communities
Based on phytosociological relevés (Table S1), the cluster analysis shows the halophilous vegetation community arrangement in Il-Ballut ta’ Marsaxlokk (Figure 2 and Figure 3, and Appendix A). Cluster 1 groups the markedly halophilous vegetation, including an Arthrocnemum-dominated plant community. In particular, this vegetation type is ascribed to Salicornietea fruticosae Br.-Bl. et Tx. ex A. Bolòs y Vayreda et O. de Bolòs in A. Bolòs y Vayreda 1950 class, which is characterized by succulent Amaranthaceae with a chamaephytic or nanophanerophytic life-form. In the study area, a clear dominance of Arthrocnemum meridionale is evident. Usually, this species forms monospecific stands, especially when the soil has a higher concentration of nutrients. In addition, it is common to spot Juncus subulatus Forssk. growing alongside A. meridionale, forming the Arthrocnemo meridionalis–Juncetum subulati Brullo & Furnari 1976 corr. hoc loco association (Appendix B). The occurrence of this species was confirmed during our May fieldwork and is one of the most common associations found in salt marsh habitats. This plant community can be found in salt marshes with sandy to silty–sandy soil that has higher levels of salinity; however, it is limited only to surfaces that have been submerged for extended periods. Cluster 2 arranges the halo-hygrophilous Juncus maritimus Lam. dominated community, which includes perennial grasslands and wet communities of salt marshes growing on perennially moist soils and temporarily flooded. This plant community is represented by a few patches with a very restricted growth surface on the site and is ascribable to Inulo longifoliae–Juncetum maritimi Brullo in Brullo et al. 1988 nom. corr. Brullo et al. 2020. Cluster 3 groups Suaeda spicata (Willd.) Moq., S. vera J.F.Gmel., and Soda inermis dominated communities, which comprises only the literature-based relevés. It includes plant communities belonging to the Therosalicornietea Tx. In Tx. Et Oberd. 1958 class characterized by annual halophilous or halo-nitrophilous vegetation of brackish and salt marshes, with an optimum growing season in late summer–autumn. Probably, this community consists only of the literature relevés because the plant communities surveyed in 2022 do not have enough coverage values to be included in the cluster. As a result, it seems that the plant community is becoming impoverished. Cluster 4 includes annual glasswort halophilic communities that often consist of monophytic populations, which gives them a characteristic red–purple color. It groups annual glasswort (Salicornia L. sp. Pl.) localized in areas submerged in brackish water belonging to the Therosalicornietea class. Cluster 5 represents a halophilous community that thrives in saltwater pools and lagoons. This community is composed of hydrophytes that thrive in completely submerged depressions. This confirms the historical data, as Ruppia cf. drepanensis Tineo ex Guss. Was previously reported in the study area by Brullo et al. [16], but it had not been recorded at the site for many years.
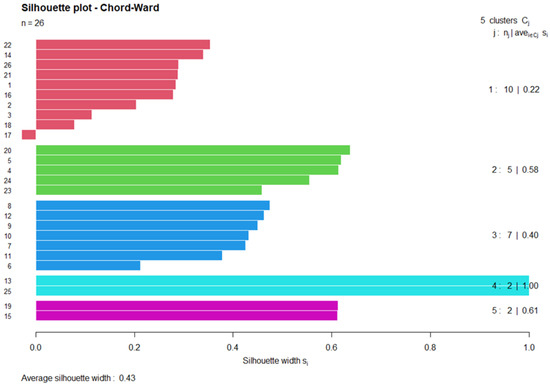
Figure 2.
Silhouette plot of the Chord–Ward clustering for relevés in Il-Ballut ta’ Marsaxlokk. Positive silhouette values mean there are points that are far away from the other clusters and, therefore, each cluster is well separated from the neighboring cluster. Silhouette value ranges from −1 to 1.
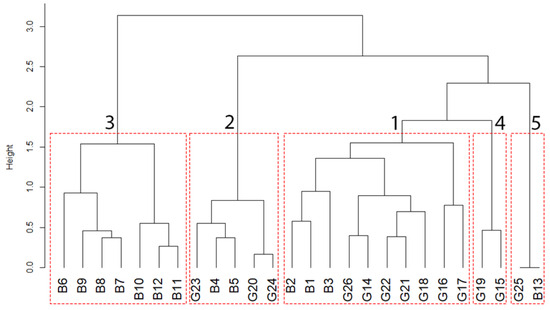
Figure 3.
Hierarchical clustering of phytosociological relevés from Brullo et al. 2020 (B letter) and unpublished data (G letter) using Ward’s method and Chord distance. The cophenetic correlation coefficient was 0.849.
3.2. Diversity and Ecological Indices
The vegetation diversity of each sub-dataset was evaluated using diversity and evenness indices (Table 1). First, the vegetation diversity was evaluated using species richness. In 1986, the highest number of species was recorded with a mean of 4.69 ± 1.31, but currently, there has been a 45% decrease with a mean of 2.30 ± 0.85. The Shannon entropy indices (base e and 2) values were 1.34 ± 0.43 and 1.94 ± 0.63, respectively, in 1986, but in 2022, they were 0.71 ± 0.32 and 1.02 ± 0.47, respectively. Similarly, the Shannon diversity values decreased from 4.09 ± 1.17 in 1986 to 2.13 ± 0.71 in 2022. The Simpson index value in 1986 was 3.61 ± 1.07, but it decreased to 2.01 ± 0.60 in 2022. The Shannon and Simpson evenness indices values were 0.87 ± 0.05 and 0.78 ± 0.09, respectively, in 1986, but in 2022, they were 0.93 ± 0.06 and 0.89 ± 0.10, respectively. With regard to the t-test results, the comparison between all taxonomic diversity indices shows decisive evidence for unequal means (p < 0.001). In addition, the Shannon evenness shows substantial evidence for unequal means (p < 0.01). On the other hand, the Pielou evenness indices do not show significant differences (p > 0.05). Additionally, Hill numbers were used to compare the 1986 and 2022 communities. The results of the two time series were completely different in each case. In 1986, species richness was more diverse compared with 2022, even when focusing on common or dominant species. It is important to note the significant differences between the two communities, and the likely explanation for this contrast is the variance in the distribution of species abundance (Figure 4). The “q” parameter determines the extent to which the measure takes into account the presence of rare species when computing diversity. When computing the Hill number with q = 0, we only consider the total number of species present, not their relative abundance. For q = 1, we use Shannon diversity, based on Shannon entropy, and measure the effective number of species. This method takes into account the number of individuals as well as the abundance of each species, with an emphasis on the more common and abundant species. For q = 2, Simpson diversity is used to calculate the effective number of species, which takes the Simpson concentration index into consideration. This method gives individuals belonging to abundant species greater weight and produces a count of the number of highly abundant species.

Table 1.
Comparative analysis of indices used in the halophilous plant diversity analysis: Student’s t-test (t) and Fisher’s test (F).
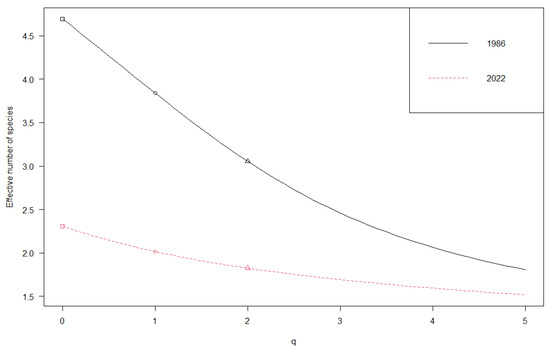
Figure 4.
Plot showing the diversity profile according to Hill numbers: species richness (square), Shannon diversity (circle), and Simpson diversity (triangle).
The Ellenberg values diachronic analysis of the Il-Ballut ta’ Marsaxlokk wetland shows solar radiation and summer drought stress as environmental drivers at the site, along with alkaline soil reaction (Figure 5). However, the plant community recorded in 1986 required lower air temperatures and soil moisture but needed relatively more nutrients. It appears that there was quite a variety of species in the salt marsh communities in the 1980s compared with the present day, indicating a trend toward taxonomic homogenization and the presence of more thermophilous species. The non-metric multidimensional scaling (NMDS) analysis of the entire vegetation using species abundance results in the same clustering (Figure 5). According to the envfit analysis (Table 2), the Ellenberg value’s strongest drivers of the environmental gradients are the nutrients (r2 = 0.47, Pr = 0.012) and temperature (r2 = 0.38, Pr = 0.024) and only slightly the soil reaction.
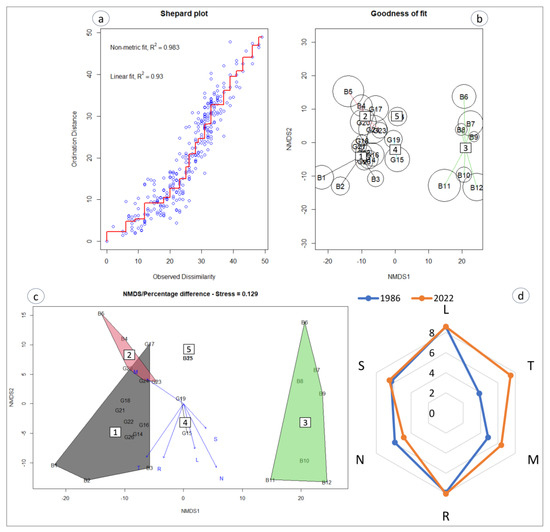
Figure 5.
Non-metric multidimensional scaling (NMDS) of the all-species dataset, (a) Shepard diagram. (b) Goodness of fit, where poorly fitted sites have larger bubbles. (c) Significance of environmental variables (stress value = 0.129). (d) Ecogram of the Il-Ballut ta’ Marsaxlokk wetland plant communities during different periods. Abbreviations: light (L), temperature (T), soil moisture (M), soil reaction I, nutrients (N), and salinity (S). The labels for groups follow those of the cluster.
Table 2.
Output for the multiple regression of Ellenberg values for all datasets. Abbreviations: r2 (coefficient of determination for multiple regression for each environmental gradients), Pr (Monte Carlo permutation test).
We used multiplicative diversity partitioning to calculate beta-diversity (β) with metrics based on diversity indices (Figure 6). For 1986, the curve displays increasing growth as the level of diversity. This indicates that as the diversity of species increases, variations in their composition among different environments or habitats become more noticeable. In fact, species richness significantly influenced the multiplicative beta-diversity in the two different time periods. Moreover, the value depends on the proportion of shared species. The multiplicative measures strongly decrease with increasing emphasis on the dominant species values as a function of the number of species added to each community. Therefore, it is evident that the salt marsh vegetation β-diversity in the study area significantly changed over 36 years.
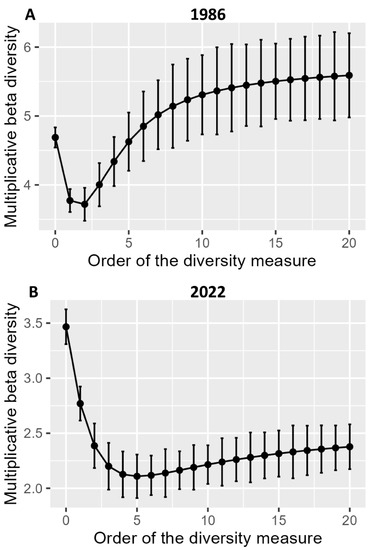
Figure 6.
Multiplicative beta-diversity of the salt marsh communities as a function of the order of the diversity index (A). data from 1986, (B). data from 2022. Error bars represent standard errors computed using the bootstrap method.
3.3. Mapping Annex I Habitats of Directive 92/43/EEC
Based on the RGB drone image analysis and fieldwork, we elaborated an Il-Ballut ta’ Marsaxlokk vegetation biotopes map depicting the directive habitats currently occurring in the study area (Figure 7). In particular, five habitats listed in Annex I of Directive 92/43/EEC were recognized: 1310 “Salicornia and other annuals colonizing mud and sand”, 1410 “Mediterranean salt meadows (Juncetal9hermos9imi)”, 1420 “Mediterranean a9hermosrmo-Atlantic halophilous scrubs (Salicornietea fruticosae)”, 1150* “Coastal lagoons”, and 92D0 “Southern riparian galleries and thickets (Nerio-Tamaricetea and Securinegion tinctoriae). We mapped a total area of 8199.73 m2, with 54% (4390.43 m2) being habitat 1420, 20% (1657.38 m2) being habitat 92D0, 11% (910.48 m2) being habitat 1310, 2% (140.91 m2) being habitat 1410, and 3% (245.59 m2) being habitat 1150* (Figure 8). However, only 10% (854.94 m2) of the total area was not classified as a habitat listed in Annex I of the Habitat Directive due to the presence of nitrophilous and alien species such as Oxalis pes-caprae L. In addition, habitat 92D0 was not reported in the final management plan of the site. This halophilous woody vegetation grows along the edges of salt marshes, is subjected to long periods of submersion, and is characterized by mainly silty soils. The site’s plant communities are ascribed to the Inulo crithmoidis–Tamaricetum africanae Gamisans 1992 association. The occurrence of Ruppia cf. drepanensis within the study area shows a new Directive habitat for Il-Ballut ta’ Marsaxlokk wetland. This species constitutes plant communities belonging to Ruppietea maritimae Tuxen ex Den Hartog & Segal 1964 class, which identify a habitat of priority interest (1150* Coastal lagoons) and is reported for the first time at the site.
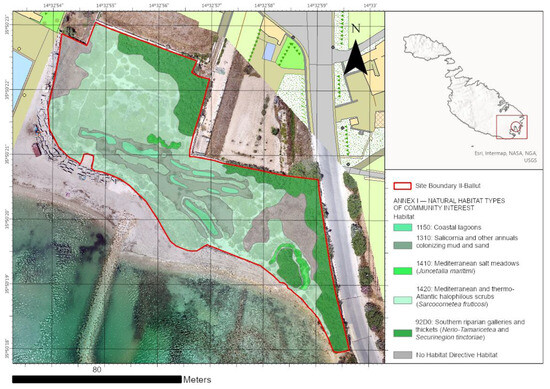
Figure 7.
Il-Ballut ta’ Marsaxlokk wetland habitat map in accordance with Annex I Directive 92/43/EEC.
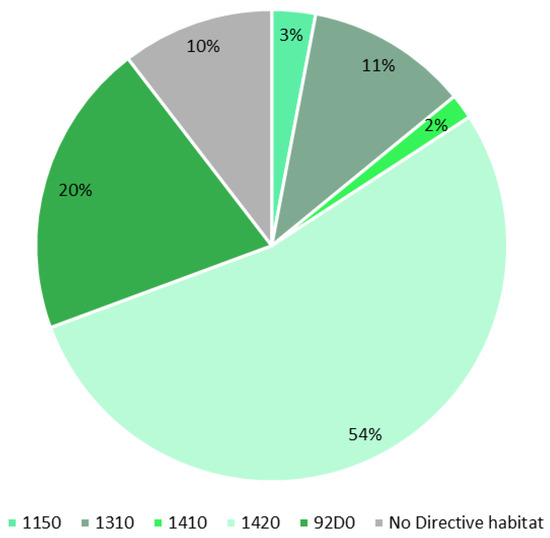
Figure 8.
Diagram comparing the current Annex I habitat coverage in the study area.
4. Discussion
Although Il-Ballut ta’ Marsaxlokk has undergone numerous pressures and changes, the structure of halophilous vegetation has only changed in certain components over the past 36 years. Most of the area (54%) is covered with perennial vegetation belonging to the Salicornietea fruticosae class. This vegetation characterizes the Mediterranean and thermo-Atlantic perennial saltmarsh herblands and shrub and is referred to as habitat 1420 “Mediterranean and thermo-Atlantic halophilous scrubs (Salicornietea fruticosae)”. The results in Figure 2 show that this community has persisted over time, as well as the Juncus-dominated community (habitat 1410 “Mediterranean salt meadows (Juncetalia maritimi)”. By contrast, the vegetation on surfaces characterized by heavy silty–clay soils and organic material is colonized by communities dominated by Suaeda spicata, S. vera and Soda inermis, which appear impoverished in terms of floristic diversity. At the same time, the central part of the salt marshes subject to very long submersion periods shows poor vegetation dominated by annual Salicornia L. species (Therosalicornietea Tx. in Tx. et Oberd. 1958). These plant communities have been the most affected by the changes in recent years. Although the data reported by Brullo et al. [16] only allows us to evaluate the vegetation patterns, not the extent of this vegetation, the comparison with the management plan of the area shows significant changes. In fact, according to Henwood et al. [15], the latter plant community area (EU habitat 1410) was quantified as 760 m2 against the 255.25 m2 mapped by us. This strong reduction may be related to temperature increases in the last decades, since the Mediterranean basin is one of the most responsive areas to climate change caused by human activities [51]. According to Galdies [52], the rate of change in Malta’s mean temperature from 1951 to 2010 was +1.1 °C, with a rising trend of +1.2 °C and +1.1 °C in the maximum and minimum temperatures. The impact of increasing temperature on plant communities is a well-known trend in wetlands [53]. This decrease is, however, a new finding in our study area. Therefore, mapping plant communities using fieldwork and photo interpretation seems necessary for determining the vegetation diversity in Natura 2000 sites [54]. It is worth mentioning that based on the literature, a species appears to be no longer recorded at the site, i.e., Triglochin barrelieri Loisel. In fact, according to Sommier and Caruana Gatto [55], T. barrelieri was quite frequent at Marsaxlokk. This species plays an important ecological function in salt marshes [56]; thus, its apparent absence for a long time shows an evident loss of habitat quality in the study area. The species richness, Shannon, and Simpson indices were found to be significant for the vegetation diversity over the years, which may represent one climate change impact likely to affect salt marshes, i.e., sea level rise. Excessive tidal flooding may deprive plants of light or oxygen, whereas insufficient flooding may result in stressful soil salt levels. Salinity is expected to increase in this scenario, and species composition will shift toward salt-tolerant species, reducing species richness [57]. Otherwise, the salt marsh vegetation is usually characterized by paucispecific plant communities with average richness ranging from 4 to 13 species [58], and the species richness is currently below average in the site. Based on the diversity index, our outcomes showed significant differences between 1986s and 2022s. These differences are related to the intensity of stress factors in the area. For example, the Simpson’s index is susceptible to the population size of distinct species and less responsive to the number of species in each community. On the other hand, the Shannon index, which is sensitive to rare cover type habitat presence, is thus recommended for landscape management within an ecological framework [59]. Therefore, it is possible to state that the vegetation dynamics and structure have changed over the last 36 years. The vegetation map (Figure 7) displays the loss of directive habitat coverage, which is also due to the abundance of Oxalis pes-caprae. The loss of habitat of community interest reported in Figure 7 may be due to the main prominent presence of Oxalis pes-caprae. This invasive alien species, a small geophyte from South Africa that was introduced to Malta at the beginning of the 19th century [60], occurs in the east of the salt marsh. Oxalis pes-caprae covers a potentially suitable area for the EU habitats 92D0 and 1420. Unfortunately, the presence of this species is quite frequent in other Maltese salt marshes threatened by human pressure [61]. The spread of this invasive species suggests that climate change effects are ongoing. It is highly adaptable to the changing climate and has already been observed to thrive in other areas of the Mediterranean [62]. The present study identifies how the evaluation of plant diversity can be used as a tool in nature restoration and conservation. Our findings indicate that plant communities of Mediterranean islands are particularly vulnerable to fluctuations over time, as has been emphasized in previous research [10,63]. Native salt marsh vegetation is highly valued due to the presence of specialized species restricted to specific sites. Such monitoring helps to assess salt marsh overall health, track changes over time, and identify potential threats or stressors. This survey conducted on the Il-Magħluq ta’ Marsaxlokk has presented significant data, and studies of this kind are, therefore, strongly recommended for the other Maltese wetlands.
5. Conclusions
The vegetation dynamics in the studied wetland reflected decreased vegetation diversity, with a loss of Annex I habitat coverage. The combined use of the phytosociological method and diversity indices allowed us to obtain relevant indicators for the ecosystem integrity of the study area. We observed the expansion of alien species such as Oxalis pes-caprae. However, the Nature Trust team is currently taking ongoing management and restoration actions to prevent the spread of invasive species and ensure the long-term conservation of Annex I habitats. Despite the complexity of this topic, the loss of vegetation diversity needs to be urgently addressed because it shows relevant impacts on the ecosystems. Basically, vegetation studies are essential to evaluate the areas of conservation as well as potential related risks. Policymakers must consider the aridity-specific effects of climate change on wetland habitats and their dynamics in conservation plans. Considering the goals of the Ramsar Convention and the Habitats Directive 92/43/EEC, monitoring and protecting wetlands is essential in order to plan future and suitable management actions. Vegetation studies can offer valuable insights into Natura 2000 sites using ecological and diversity indices and phytosociological approaches. This information can help improve future management actions and landscape planning.
Supplementary Materials
The following supporting information can be downloaded at: https://www.mdpi.com/article/10.3390/land12091679/s1, Table S1: Phytosociological relevés and synoptic table.
Author Contributions
Conceptualization, G.T.; methodology, G.T.; investigation, G.T., A.L. and J.G.; data curation, G.T., A.L. and S.L.; statistical analysis, G.T.; writing—original draft preparation, G.T.; writing—review and editing, G.T., A.L., J.G., V.A., J.H., D.T.S., G.G.d.G., P.M., V.R., M.A., V.T., S.S. and S.L. All authors have read and agreed to the published version of the manuscript.
Funding
This research was financially supported by the research programme (PIA.CE.RI. 2020–2022 Line 2 cod. 22722132149 and Line 3 Starting Grant Progetto HAB-VEG cod. 22722132172) funded by the University of Catania.
Data Availability Statement
Not applicable.
Acknowledgments
The authors would like to thank the Environment & Resources Authority team for their support during the fieldwork at Il-Ballut ta’ Marsaxlokk and the Planning Authority for the use of the SIntegraM Basemap (SIntegraM data/service, (2018), Developing Spatial Data Integration for the Maltese Islands, Planning Authority).
Conflicts of Interest
The authors declare no conflict of interest.
Appendix A
Syntaxonomical scheme of the salt marsh vegetation in Il-Ballut ta’ Marsaxlokk site:
Salicornietea fruticosae Br.-Bl. & Tx. ex A. & O. de Bolòs in A. de Bolòs 1950
Salicornietalia fruticosae Br.-Bl.1933
Arthrocnemion glauci Rivas-Mart. & Costa M. 1984
Arthrocnemo meridionalis-Juncetum subulati Brullo & Furnari 1976 corr. hoc loco
Inulion longifoliae Brullo & Furnari 1988 corr. Brullo et al. 2020
Agropyro scirpei-Inuletum longifoliae Brullo in Brullo et al. 1988 corr. Brullo et al. 2020
Suaedion verae Brullo & Furnari 1988
Halimiono portulacoidis-Suaedetum verae (Molinier & Tallon 1970) Gèhu in Géhu et al. 1984
Juncetea maritimi Br.Bl. in Br.-Bl., Roussine & Nègre 1952
Juncetalia maritimi Br.Bl. ex Horvatic 1934
Juncion maritimi Br.Bl. ex Horvatic 1934
Inulo longifoliae-Juncetum maritimi Brullo in Brullo et al. 1988 corr. Brullo et al. 2020
Therosalicornietea R.Tx. in R.Tx. & Oberd. 1958
Therosalicornietalia R.Tx. ex Géhu & Géhu-Franck 1984
Therosalicornion Br.-Bl. 1933
Suaedo spicatae-Salicornietum patulae Brullo & Furnari ex Géhu & Géhu-Franck 1984
Ruppietea maritimae J.Tx. ex Den Hartog & Segal 1964
Ruppietalia maritimae J.Tx. ex Den Hartog & Segal 1964
Ruppion maritimae Br.-Bl. ex Westhoff in Bennema, Sissingh & Westhoff 1943
Ruppietum drepanensis Brullo & Furnari 1976
Appendix B
Phytosociological nomenclature note: The Arthrocnemo–Juncetum subulati Brullo & Furnari 1976 association originally was described for Sicily by Brullo and Furnari [64] and was recently revised by Sciandrello et al. [65] with the new name Arthrocaulo meridionalis–Juncetum subulati Brullo & Furnari 1976 corr. Sciandrello et al. 2019. However, according to the recent literature [30,66,67], the validity of the Arthrocaulon Piirainen & G.Kadereit genus is still being debated within the scientific community. In fact, this name is based on the supposed synonymy between the genera Salicornia and Arthrocnemum. However, the Arthrocnemum typification made by Pfeiffer [68] and later reported by Piirainen et al. [69] is not entirely accepted. Therefore, according to Art. 43 of the ICPN [31], Arthrocnemo–Juncetum subulati Brullo & Furnari 1976 must be correct with the name Arthrocnemo meridionalis-Juncetu– subulati Brullo & Furnari 1976 corr. hoc loco (Arthrocnemo–Juncetum subulati subass. arthrocnemetosum Brullo & Furnari 1976, Not. Fitosoc. 11: 13. 1976).
References
- Perennou, C.; Gaget, E.; Galewski, T.; Geijzendorffer, I.; Guelmami, A. Evolution of wetlands in Mediterranean region. In Water Resources in the Mediterranean Region; Zribi, M., Brocca, L., Tramblay, Y., Molle, F., Eds.; Elsevier: Amsterdam, The Netherlands, 2020; pp. 297–320. [Google Scholar] [CrossRef]
- Tomaselli, V.; Mantino, F.; Tarantino, C.; Albanese, G.; Adamo, M. Changing landscapes: Habitat monitoring and land transformation in a long-time used Mediterranean coastal wetland. Wetl. Ecol. Manag. 2023, 31, 31–58. [Google Scholar] [CrossRef]
- Mitsch, W.J.; Bernal, B.; Nahlik, A.M.; Mander, Ü.; Zhang, L.; Anderson, C.J.; Jørgensen, S.E.; Brix, H. Wetlands, carbon, and climate change. Landsc. Ecol. 2013, 28, 583–597. [Google Scholar] [CrossRef]
- Pachauri, R.K.; Allen, M.R.; Barros, V.R.; Broome, J.; Cramer, W.; Christ, R.; Church, J.A.; Clarke, L.; Dahe, Q.; Dasgupta, P.; et al. Climate Change 2014: Synthesis Report. Contribution of Working Groups I, II and III to the Fifth Assessment Report of the Intergovernmental Panel on Climate Change; IPCC: Geneva, Switzerland, 2014; p. 151. [Google Scholar]
- NOAA. National Centers for Environmental Information, Monthly Global Climate Report for Annual 2022. Available online: https://www.ncei.noaa.gov/access/monitoring/monthly-report/global/202213 (accessed on 25 July 2023).
- Salimi, S.; Almuktar, S.A.; Scholz, M. Impact of climate change on wetland ecosystems: A critical review of experimental wetlands. J. Environ. Manag. 2021, 286, 112160. [Google Scholar] [CrossRef]
- Birnbaum, C.; Waryszak, P.; Farrer, E.C. Direct and indirect effects of climate change in coastal wetlands: Will climate change influence wetlands by affecting plant invasion? Wetlands 2021, 41, 59. [Google Scholar] [CrossRef]
- Rezaei, A.; Gurdak, J.J. Large-scale climate variability controls on climate, vegetation coverage, lake and groundwater storage in the Lake Urmia watershed using SSA and wavelet analysis. Sci. Total Environ. 2020, 724, 138273. [Google Scholar] [CrossRef] [PubMed]
- Chen, Y.; Sun, L.; Xu, J.; Liang, B.; Wang, J.; Xiong, N. Wetland vegetation changes in response to climate change and human activities on the Tibetan Plateau during 2000–2015. Front. Ecol. Evol. 2023, 11, 1113802. [Google Scholar] [CrossRef]
- Médail, F. The specific vulnerability of plant biodiversity and vegetation on Mediterranean islands in the face of global change. Reg. Environ. Chang. 2017, 17, 1775–1790. [Google Scholar] [CrossRef]
- Fois, M.; Cuena-Lombraña, A.; Araç, N.; Artufel, M.; Atak, E.; Attard, V.; Bacchetta, G.; Cambria, S.; Ben Charfi, K.; Dizdaroğlu, D.E.; et al. The Mediterranean Island Wetlands (MedIsWet) inventory: Strengths and shortfalls of the currently available floristic data. Flora Mediterr. 2022, 32, 339–349. [Google Scholar]
- Schembri, P.J. Physical geography and ecology of the Maltese Islands: A brief overview. In Malta: Food, Agriculture, Fisheries and the Environment; Busuttil, S., Lerin, F., Mizzi, L., Eds.; Options Méditerranéennes: Montpellier, France, 1993; Volume 7, pp. 27–39. [Google Scholar]
- Census of Population and Housing 2021. 2022. Available online: https://nso.gov.mt/census-of-population-and-housing-2021-status-report/ (accessed on 26 July 2023).
- Lanfranco, S.; Galea, L.; Van Colen, T. Saline Marshlands of the Maltese Islands. In Landscapes and Landforms of the Maltese Islands. World Geomorphological Landscapes; Gauci, R., Schembri, J., Eds.; Springer: Cham, Switzerland, 2019; pp. 245–259. [Google Scholar]
- Henwood, J.; Falzon, A.; Bonello, A.; Attard, V.; Bonavia, O. Il-Ballut Nature Reserve, Marsaxlokk: Management Plan for the Years 2006–2010; Nature Trust Malta: Valletta, Malta, 2005; pp. 1–112. [Google Scholar]
- Brullo, S.; Brullo, C.; Cambria, S.; del Galdo, G.G. The Vegetation of the Maltese Islands; Springer: Cham, Switzerland, 2020. [Google Scholar]
- Schembri, P.J.; Lanfranco, E.; Farrugia, P.; Schembri, S.; Sultana, J. Localities with Conservation Value in the Maltese Islands, 3rd ed.; Environment Division: Beltissebh, Malta, 1987; p. 27. [Google Scholar]
- Braun-Blanquet, J. Pflanzensoziologie: Grundzuege der Vegetationskunde; Dritte, Neubearbeitete und Wesentlich Vermehrte Auflage; Springer: Milan, Iataly, 1964. [Google Scholar]
- Litchi App 2023. Available online: https://flyLitchi.com (accessed on 26 July 2023).
- OpenDroneMap WebODM (Version 1.9.12 Build 55) [Software]. 2022. Available online: https://opendronemap.org/webodm/ (accessed on 26 July 2023).
- QGIS Development Team. QGIS Geographic Information System. Open Source Geospatial Foundation Project. (Version 3.22.8) [Software]. 2022. Available online: https://www.qgis.org/ (accessed on 26 July 2023).
- ESRI 2011. ArcGIS Desktop: Release 10. Redlands, CA: Environmental Systems Research Institute. Available online: https://www.esriitalia.it/prodotti/la-nostra-offerta/piattaforma-esri/arcgis-10-5 (accessed on 26 July 2023).
- Biondi, E.; Blasi, C.; Burrascano, S.; Casavecchia, S.; Copiz, R.; Del Vico, E.; Galdenzi, D.; Gigante, D.; Lasen, C.; Spampinato, G.; et al. Manuale Italiano di Interpretazione Degli Habitat Della Direttiva 92/43/CEE. Società Botanica Italiana. Ministero dell’Ambiente e Della Tutela del Territorio e del Mare, D.P.N. 2009. Available online: http://vnr.unipg.it/habitat (accessed on 26 July 2023).
- The European Environment Agency (EEA). Available online: https://eunis.eea.europa.eu/habitats-code.jsp (accessed on 26 July 2023).
- Pignatti, S. Volume 1: Flora d’Italia & Flora Digitale. In Flora d’Italia: In 4 Volumi, 2nd ed.; Edagricole-Edizioni Agricole di New Business Media srl: Milano, Italy, 2017. [Google Scholar]
- Pignatti, S. Volume 2: Flora d’Italia & Flora Digitale. In Flora d’Italia: In 4 Volumi, 2nd ed.; Edagricole-Edizioni Agricole di New Business Media srl: Milano, Italy, 2017. [Google Scholar]
- Pignatti, S. Volume 3: Flora d’Italia & Flora Digitale. In Flora d’Italia: In 4 Volumi, 2nd ed.; Edagricole-Edizioni Agricole di New Business Media srl: Milano, Italy, 2018. [Google Scholar]
- Pignatti, S.; Guarino, R.; La Rosa, M. Volume 4: Flora d’Italia & Flora Digitale. In Flora d’Italia: In 4 Volumi, 2nd ed.; Edagricole-Edizioni Agricole di New Business Media srl: Milano, Italy, 2019. [Google Scholar]
- Portal to the Flora of Italy. Available online: http:/dryades.units.it/floritaly (accessed on 26 July 2023).
- De la Fuente, V.; Sánchez-Gavilán, I.; Ramírez, E.; Rufo, L.; Sánchez-Mata, D. Morphological variability of halophytes: Salicornioideae on Iberian Peninsula. In Handbook of Halophytes: From Molecules to Ecosystems towards Biosaline Agriculture; Grigore, M.N., Ed.; Springer: Cham, Switzerdland, 2021; pp. 1223–1258. [Google Scholar]
- Theurillat, J.P.; Willner, W.; Fernández-González, F.; Bültmann, H.; Čarni, A.; Gigante, D.; Mucina, L.; Weber, H. International code of phytosociological nomenclature. Appl. Veg. Sci. 2021, 24, e12491. [Google Scholar] [CrossRef]
- Mucina, L.; Bültmann, H.; Dierßen, K.; Theurillat, J.P.; Raus, T.; Čarni, A.; Šumberová, K.; Willner, W.; Dengler, J.; García, R.G.; et al. Vegetation of europe: Hierarchical floristic classification system of vascular plant, bryophyte, lichen, and algal communities. Appl. Veg. Sci. 2016, 19, 3–264. [Google Scholar] [CrossRef]
- R Core Team. R: A Language and Environment for Statistical Computing. 2022. Available online: https://www.R-project.org/ (accessed on 26 July 2023).
- Oksanen, J. Multivariate Analysis of Ecological Communities in R: Vegan Tutorial. 2015. Available online: https://www.mooreecology.com/uploads/2/4/2/1/24213970/vegantutor.pdf (accessed on 26 July 2023).
- Charney, N.; Record, S. Vegetarian: Jost Diversity Measures for Community Data. R Package Version 1.2. 2012. Available online: http://cran.nexr.com/web/packages/vegetarian/vegetarian.pdf (accessed on 26 July 2023).
- van der Maarel, E. Transformation of cover-abundance values in phytosociology and its effects on community similarity. Vegetatio 1979, 39, 97–114. [Google Scholar]
- Maechler, M.; Rousseeuw, P.; Struyf, A.; Hubert, M.; Hornik, K.; Studer, M.; Roudier, P.; Gonzalez, J.; Kozlowski, K.; Schubert, E.; et al. Cluster: Cluster Analysis Basics and Extensions. R Package Version 2.1.1. Available online: https://CRAN.R-project.org/package=cluster (accessed on 26 July 2023).
- Shannon, C.E. The mathematical theory of communication. In The Mathematical Theory of Communication; Shannon, C.E., Weaver, W., Eds.; University of Illinois Press: Urbana, IL, USA, 1949; pp. 29–125. [Google Scholar]
- Simpson, E.H. Measurement of diversity. Nature 1949, 163, 688. [Google Scholar] [CrossRef]
- Borcard, D.; Gillet, F.; Legendre, P. Numerical Ecology with R; Springer: New York, NY, USA, 2011; Volume 2, p. 688. [Google Scholar]
- R Core Team and Contributors Worldwide. The R Stats Package. Available online: https://cran.r-project.org/package=STAT (accessed on 26 July 2023).
- Ellenberg, H.; Weber, H.E.; Düll, R.; Wirth, V.; Werner, W.; Paulißen, D. Zeigerwerte von Pflanzen in Mitteleuropa. Scr. Geobot. 1991, 18, 1–248. [Google Scholar]
- Pignatti, S.; Ellenberg, H.; Pietrosanti, S. Ecograms for phytosociological tables based on Ellenberg. Ann. Bot. 1996, 54, 5–14. [Google Scholar]
- Tichý, L.; Axmanová, I.; Dengler, J.; Guarino, R.; Jansen, F.; Midolo, G.; Nobis, M.P.; Van Meerbeek, K.; Aćić, S.; Attorre, F.; et al. Ellenberg-type indicator values for European vascular plant species. J. Veg. Sci. 2023, 34, e13168. [Google Scholar] [CrossRef]
- Lepš, J.; Šmilauer, P. Multivariate Analysis of Ecological Data Using CANOCO; Cambridge University Press: Cambridge, UK, 2003. [Google Scholar]
- Legendre, P.; Legendre, L. Numerical Ecology; Elsevier: Salt Lake City, UT, USA, 2012. [Google Scholar]
- Hill, M.O. Diversity and evenness: A unifying notation and its consequences. Ecology 1973, 54, 427–432. [Google Scholar] [CrossRef]
- Jost, L. Entropy and diversity. Oikos 2006, 113, 363–375. [Google Scholar] [CrossRef]
- Jost, L. Partitioning diversity into independent alpha and beta components. Ecology 2007, 88, 2427–2439. [Google Scholar] [CrossRef]
- De Bello, F.; Lavergne, S.; Meynard, C.; Lepš, J.; Thuiller, W. The partitioning of diversity: Showing Theseus a way out of the labyrinth. J. Veg. Sci. 2010, 21, 992–1000. [Google Scholar] [CrossRef]
- Giorgi, F. Climate change hot-spots. Geophys. Res. Lett. 2006, 33, L08707. [Google Scholar] [CrossRef]
- Galdies, C. Temperature trends in Malta (central Mediterranean) from 1951 to 2010. Meteorol. Atmos. Phys. 2012, 117, 135–143. [Google Scholar] [CrossRef]
- Short, F.T.; Kosten, S.; Morgan, P.A.; Malone, S.; Moore, G.E. Impacts of climate change on submerged and emergent wetland plants. Aquat. Bot. 2016, 135, 3–17. [Google Scholar] [CrossRef]
- Rapinel, S.; Rozo, C.; Delbosc, P.; Bioret, F.; Bouzillé, J.B.; Hubert-Moy, L. Contribution of free satellite time-series images to mapping plant communities in the Mediterranean Natura 2000 site: The example of Biguglia Pond in Corse (France). Mediterr. Bot. 2020, 41, 181–191. [Google Scholar] [CrossRef]
- Sommier, S.; Caruana Gatto, A. Flora Melitensis Nova; Stabilimento Pellas: Firenze, Italy, 1915; p. 502. [Google Scholar]
- Šuvada, R.; Dítě, D.; Dítětová, Z.; Jun, P.E. Rare plant species of salt marshes of the Croatian coast. Hacquetia 2018, 17, 221–234. [Google Scholar] [CrossRef]
- Sharpe, J.P.; Baldwin, H.A. Tidal marsh plant community response to sea-level rise: A mesocosm study. Aquat. Bot. 2012, 101, 34–40. [Google Scholar] [CrossRef]
- Géhu, J.M.; Costa, M.; Scoppola, A.; Biondi, E.; Marchiori, S.; Peris, J.B.; Franck, J.; Caniglia, G.; Veri, L. Essai synsystématique et synchorologique sur les végétations littorales italiennes dans un but conservatoire. I—Dunes et vases salées. Doc. Phytosociol. 1984, 8, 393–474. [Google Scholar]
- Nagendra, H. Opposite trends in response for the Shannon and Simpson indices of landscape diversity. Appl. Geogr. 2002, 22, 175–186. [Google Scholar] [CrossRef]
- Papini, A.; Signorini, M.A.; Foggi, B.; Della Giovampaola, E.; Ongaro, L.; Vivona, L.; Santosuosso, U.; Tani, C.; Bruschi, P. History vs. legend: Retracing invasion and spread of Oxalis pes-caprae L. in Europe and the Mediterranean area. PLoS ONE 2017, 12, e0190237. [Google Scholar] [CrossRef]
- Lanfranco, E. The vegetation of the Ghadira nature reserve. CENTRO 1990, 1, 1–4. [Google Scholar]
- Nunes, L.J.R.; Raposo, M.A.M.; Gomes, C.J.P. The Impact of Tourism Activity on Coastal Biodiversity: A Case Study at Praia da Cova Redonda (Algarve—Portugal). Environment 2020, 7, 88. [Google Scholar] [CrossRef]
- Sciandrello, S.; Cambria, S.; Giusso del Galdo, G.; Guarino, R.; Minissale, P.; Pasta, S.; Tavilla, G.; Cristaudo, A. Floristic and Vegetation Changes on a Small Mediterranean Island over the Last Century. Plants 2021, 10, 680. [Google Scholar] [CrossRef]
- Brullo, S.; Furnari, F. Le associazioni vegetali degli ambienti palustri costieri della Sicilia. Not. Fitosoc. 1976, 11, 1–43. [Google Scholar]
- Sciandrello, S.; Musarella, C.M.; Puglisi, M.; Spampinato, G.; Tomaselli, V.; Minissale, P. Updated and new insights on the coastal halophilous vegetation of southeastern Sicily (Italy). Plant Sociol. 2019, 56, 81–98. [Google Scholar]
- Ramírez, E.; Rufo, L.; Sánchez-Mata, D.; De la Fuente, V. Arthrocaulon meridionalis (Chenopodiaceae), a new species of Mediterranean flora. Mediterr. Bot. 2019, 40, 33–41. [Google Scholar] [CrossRef]
- Ramírez, E.; Sánchez-Gavilán, I.; Rufo, L.; Sánchez-Mata, D.; De la Fuente, V. Morphology, anatomy and phylogeny of the two sister halophytic genera Microcnemum and Arthrocnemum (Salicornioideae/Amaranthaceae). Plant Biosyst. 2022, 156, 1422–1437. [Google Scholar] [CrossRef]
- Pfeiffer, L. Nomenclator Botanicus, Vol. 1, Pars 1; Sumptibus Theodori Fischeri: Cassellis, 1873; p. 808. [Google Scholar]
- Piirainen, M.; Liebisch, O.; Kadereit, G. Phylogeny, biogeography, systematics and taxonomy of Salicornioideae (Amaranthaceae/Chenopodiaceae)—A cosmopolitan, highly specialized hygrohalophyte lineage dating back to the Oligocene. Taxon 2017, 66, 109–132. [Google Scholar] [CrossRef]
Disclaimer/Publisher’s Note: The statements, opinions and data contained in all publications are solely those of the individual author(s) and contributor(s) and not of MDPI and/or the editor(s). MDPI and/or the editor(s) disclaim responsibility for any injury to people or property resulting from any ideas, methods, instructions or products referred to in the content. |
© 2023 by the authors. Licensee MDPI, Basel, Switzerland. This article is an open access article distributed under the terms and conditions of the Creative Commons Attribution (CC BY) license (https://creativecommons.org/licenses/by/4.0/).