Abstract
The selective behavior of local governments during regional environmental cooperation could generate a diffusion effect through the black box of reputation mechanism. This study incorporates the reputation mechanism, social capital, and environmental governance performance into a unified analysis framework, empirically testing the moderating effect of the implementation rate of environmental cooperative projects (indicating reputation) on the relationship between two types of social capital and environmental governance performance among cities in the Yangtze River Delta (YRD) and Beijing–Tianjin–Hebei (BTH) regions. The inter-governmental environmental cooperation news and policies are collected by Data Capture technology as a dataset, and a set of social-economic data is also adopted. The spatial econometric regression results show that an increase in reputation could both strengthen the leadership and coordination ability (bridging social capital) of the central cities in the YRD and BTH regions, thus improving their environmental governance performance. However, the bonding social capital path could only significantly work in the BTH region, which unexpectedly increases pollutant emission through excessive internal cohesion. The results indicate that a “community of entangled interest” should be constructed among cities within urban agglomerations, which requires local governments to weaken the concept of their administrative boundary. At the same time, in order to avoid excessive internal condensation, a clear division of rights and responsibilities is also necessary during continuous inter-governmental environmental cooperation. We believe that these findings could provide empirical evidence for local governments to avoid failing to the traps of “agglomeration shadow”.
1. Introduction
As is known, reputation can promote individuals’ cooperation by the means of indirect reciprocity in social networks [1]. It has been proved that raising individuals’ awareness of reputation can promote more people to participate in cooperation among the public goods game [2]. When applying this to the organization level, in the process of partner selection, enterprises usually consider reputation and trust as important criteria, which means that mutual trust could improve this cooperation performance based on the resources they possess [3,4].
Raising reputation is also of vital importance for promoting inter-governmental cooperation. Although it has been recognized that regional cooperation could effectively enhance the regional competitiveness in China [5], problems such as “Industrial isomorphism” and “Broken roads” still appear at the junction of administrative boundaries, which sometimes hinder regional development [6]. Specifically, local governments sometimes leave these previous collaborative arrangements, which might cause damage to the reputation of these local governments and destroy their relationship of mutual trust [7].
In the field of environmental governance, although inter-governmental cooperation could effectively break through the restrictions posed by administrative divisions to address cross-regional pollution problems [8], collaborative frictions still appear among differential local governments [9], which could be influenced by the conflict between top-down pressure and local self-interest [10], as well as local favoritism behaviors during regional cooperation [11]. Specifically manifested as conspicuous collaboration risks and transaction costs, these might result in a campaign-style environmental governance effect [12].
Cross-regional environmental governance is usually a costly, time-consuming, and conflict-ridden process with an uncertain outcome [13]. It might bring out some direct and indirect negative effects when stakeholders renege and perform passive cooperation. Firstly, a direct effect will occur due to the dropout of collaborative resources, which might directly result in the failure of the regional cooperation project on environmental governance. Secondly, a defect of trust could also damage the cooperative performance throughout the diffusion effect of local governmental reputation [14], which could be treated as an indirect effect and lead to an unsustainable performance. The remaining research has defined the disconnected and differential phenomenon between the willingness and implementation of related cooperative projects in the process of inter-governmental collaboration as “selective cooperation” [10], which is especially evident in the field of environmental cooperative governance (Figure 1). In other words, effective implementation in the field of environmental cooperation has great potential for improvement. When local governments have a higher implementing rate towards regional cooperative projects, this could also develop a diffusion effect to improve their performance through the reputation mechanism.
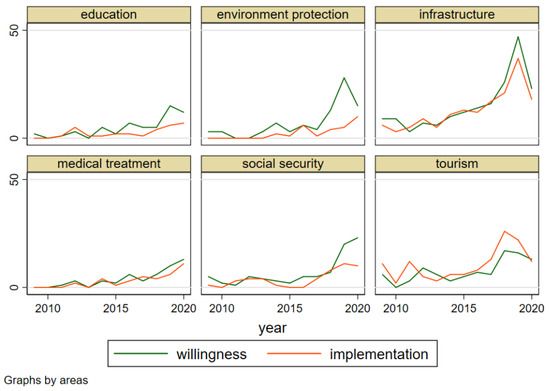
Figure 1.
The time-varying trend of the inter-governmental cooperation policies and news text amounts in YRD and BTH regions. (Notes: We have collected the inter-governmental cooperation policies and news texts during 2009–2020 in the field of education, environmental protection, infrastructure, medical treatment, social security and tourism. It could be observed that the amount gap between cooperative implementation and cooperative willingness is the hugest during regional environmental cooperation).
This paper attempts to adopt the “reputation mechanism” to describe the black box process of inter-governmental strategic interaction, and the indictor “landing rate of environmental cooperative projects” is used to reflect local governments’ reputation, which could perform the effect of signal transmission and cause the interaction and spillover effects of local government behaviors among regional cities. At the same time, it is still unclear how reputation adjusts the transmission of the micro-structure of a regional cooperation network, thus affecting the cooperative performance. Referring to the remaining studies, this paper combines social capital with the related network theory, and measures this social capital with the method of a social network analysis [15,16]. The quantitative strategy is to identify the regulatory effect of reputation on the impact path of different social capitals on environmental cooperative performance, and then summarize the influencing mechanism of local government behavior strategies in regional environmental cooperation.
2. Research Hypothesis and Theoretical Framework
In the process of regional environmental cooperation, its cooperative performance could be affected by the regional social capital connecting among cities. Social capital in regional research could be defined as the structural and cognitive resources formed by the local governments within an urban agglomeration during a long-term interaction. It mainly includes regional social trust, regional network, regional norms, and regional identification [17]. In this study, the social linking network is established by the local governments within an urban agglomeration through achieving a consensus of cooperation or promoting the actual implementation of cooperation, which could be believed as the regional social capital formed by their long-term contacts [18]. The stakeholders (local governments) located in this social linking network could achieve collective resources shared by the other participants within the network, and promote cooperation with others to improve their own behavioral performance through their wide communications and interactions [19]. With the development of the social network analysis method, more and more studies have focused on the relationship between the differential types of social capital embedded in network and governance performance. Specifically, regional social capital could be divided into bridging social capital and bonding social capital [20,21].
Bridging social capital corresponds to a sparse and open network structure, which has a related lower risk of cooperation among the network stakeholders. There are mainly coordination game problems among multiple subjects of the network members, and effective information sharing and transmission are needed to ensure the promotion of cooperation [22]. In the field of regional environmental governance, bridging social capital could reflect the ability of a central city connecting other cities who participate in the regional environmental cooperation. It could share and transmit related environmental governance information (such as the determination of each local government to control environmental pollution and the cost–benefit relationship of inter-governmental environmental cooperation) among the cities in an urban agglomeration during the process of regional environmental governance.
When the risk of cooperation increases, inter-governmental cooperation will be more dependent on bonding social capital, which features a dense and closed network structure. Bonding social capital is mainly used to solve the cooperation game problems among local governments [23]. It has a strong network relationship and its network members are closely connected, which could promote the generation of effective rules and mutual trust [24]. In the field of inter-governmental environmental cooperation, bonding social capital could control the defection risk and strengthen the executive force of local governments. For example, frequent interaction within small cooperative groups increases the trust among the local governments of cities and forms related legal norms, which could increase the cohesion of these cooperative groups.
To sum up, bridging social capital has a micro-structure that could benefit information bridging and transmission, while bonding social capital has a small group structure that features close ranks. The strength of related bridging and bonding social capital could have an impact on the performance of environmental cooperation. We propose Hypothesis 1:
Hypothesis 1.
Bridging social capital and bonding social capital could effectively improve environmental governance performance among urban agglomeration cities.
In the process of inter-governmental environmental cooperation, the reputation of local governments is mainly reflected by the degree of their cooperation enforcement. Referring to the selective cooperation theory [25], influenced by self-interest and a top-down institutional arrangement, local governments usually perform the selective enforcement feature towards regional environmental cooperation agreements, which presents the disconnected and differential phenomenon between the willingness and implementation of related environmental cooperative projects. According to the social impact model, the behavior strategies of local governments within a cooperation network are usually influenced by the behaviors of other actors, which could also be treated as the spillover effect from the reputation of these other actors, and the influencing path is indirect [26].
In order to facilitate understanding, we simplify the analysis model (Figure 2): there is a central city in a small group within an urban agglomeration (Central city A). When the reputation (the implementation rate of cooperation projects) of this central city is increased, it will send a positive signal (spillover effect) to the other members embedded in the regional social network, including the members within the small group that have previously reached a cooperative relationship, and also including cities outside the small group that have not yet reached a cooperative relationship (City F and G) [2,27]. Reputation is the basis for this central city to strengthen the influence of its social capital [28,29]. An increase in reputation could promote more surrounding cities to learn and imitate the cooperation strategies of the central city, expand the range of cities connected to them, and enhance their influence and coordination ability. At the same time, it could also enhance the trust and regulatory constraints between the central city and the other cities that have been connected before, enhancing the cohesion and execution of a small group.
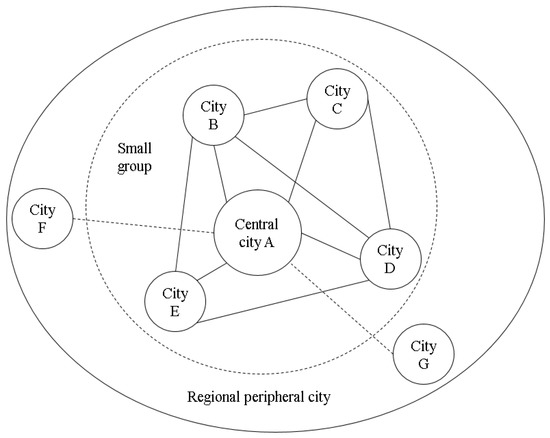
Figure 2.
The simplified regional analytic model.
Reputation will firstly affect the role of the coordination ability of regional social capital. If the reputation of the local governments embedded in a regional social network increases, it will enhance their influence and leadership within the social network, and further play a coordinating role (external diffusion) by bridging more cities’ local governments [30], which enhances the positive effect of bridging social capital on promoting cooperation performance. Through the more convenient transmission and sharing of real regional environmental governance information and resources, it could be easier for the central city to figure out the determination of chief officials from other cities to control pollution and the cost–benefit relationship of the cross-regional environmental cooperation in the various cities within the region, which is helpful for coordinating their behavior preferences and improving the efficiency of local governments in participating in inter-governmental environmental cooperation [31,32]. At the same time, the frequent exchange and coordination of information and resources could contribute to the function of the market mechanism, which could promote the convergence of resource allocation and suppress the occurrence of pollution shelters among stakeholders. Therefore, we propose Hypothesis 2:
Hypothesis 2.
The promotion of reputation could affect the function path of regional bridging social capital. That is, it could enhance the coordination ability of the central city and connect with more peripheral cities, so as to improve the environmental governance performance among urban agglomeration cities.
Reputation could also affect the function process of the cooperation game behavior of local governments. When the reputation of central cities increases, it could also enhance their trust degrees in the social network. Other cities associated in a small group are more inclined to form close cooperative relations and enhance the stability of inter-governmental environmental cooperation projects (internal cohesion), which even fully breaks through the limitation of administrative boundaries. That is, this strengthens the function intensity of bonding social capital by the means of reaching commitments, releasing binding environmental laws and regulations, or forming compact relationships through mutual trust [33]. Stakeholders (local governments) can be encouraged to adopt the strategy of withdrawing from environmental cooperation to achieve higher returns for their own interest [34]. When the local government of a central city is worried about betrayal, effective supervision is needed to ensure the credible commitment of the network participants. All in all, reputation could enhance the function density of bonding social capital by forming closer small group relationships with other local governments [35]. We put forward Hypothesis 3:
Hypothesis 3.
The promotion of reputation could affect the function path of regional bonding social capital. That is, it could enhance the degree of mutual trust and cohesion of local governments within an environmental cooperation small group, so as to improve the environmental governance performance among urban agglomeration cities.
According to the theory analysis above, we advance the following analytic framework (Figure 3):
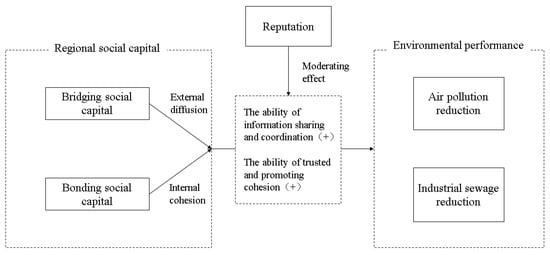
Figure 3.
The theoretical analytic framework.
3. Variable Selection and Methodology
3.1. Variable Selection
3.1.1. Explained Variable
In order to fully measure the regional pollutant emission conditions, this paper uses per capita PM2.5 emissions and industrial sewage emissions to indicate the atmosphere and water pollution conditions, respectively. A reduction in PM2.5 emissions and industrial sewage emissions could effectively reflect the environmental collaborative governance effect, and they are adopted to evaluate the local atmosphere and water pollution governance performance by the Ministry of Ecology and Environment of China.
3.1.2. Core Explanatory Variables
The core explanatory variables are indictors of the various social capital formed by the regional environmental cooperative network. According to the Social Capital Theory, social capital could play the role of guiding cooperation, employment, and building trust among stakeholders. Combining the Social Capital theory, collaborative network structure, and cooperative performance, it could be further developed and adopted in the field of regional governance [36]. Specifically, bridging social capital plays the role of information sharing and coordination, while bonding social capital plays the role of trust consolidating and condensing within small groups in cooperative networks.
Bridging social capital could be indicated by the average degree of centrality within an environmental cooperative network, which is calculated by the number of direct connections among the central participant and other participants [15] (In Figure 2, only 4 cities directly link with the central city A, and the degree centrality of City A is 4). In the field of inter-governmental environmental cooperation, if a city could widely bridge to other cities (with higher bridging social capital), it could be easier to fully figure out the determination of other local governments to control environmental pollution and the cost–benefit relationship of the inter-governmental environmental cooperation. It could contribute to improving the environmental cooperation performance by leveraging its communication and coordination abilities within the cooperative network. Bonding social capital could be indicated by the average clustering coefficient within an environmental cooperative network, which is calculated by the proportion of links among the ego’s partners that exist over the total number that could exist (The calculation formula is: Cluster = n/) [22] (n represents the links among the ego’s partners that exist, while m represents the city numbers directly linked with the central city A. In Figure 2, the average clustering coefficient of Central city A is 5/ = 5/6). Local governments within a small group have a mutually inclusive preference for regional environmental cooperation. Frequent interaction within this small group could promote forming legal norms among the local governments of cities and leverage their mutual trust and cohesion abilities, which is beneficial for promoting effective environmental cooperation among local governments and improving environmental governance performance. The panel data of these two indictors could be obtained through Ucinet 6.0 [37].
3.1.3. Moderating Variable
The moderating variable in this study is the reputation of local governments in regional environmental cooperation. The behavior selection of local governments determines their reputation during inter-governmental environmental cooperation. Referring to the indictor “project landing rate” in related research [38,39], this study adopts the indictor “implementation rate of environmental cooperative projects” (Rateit) to reflect the selective cooperation behavior of local governments. This selective cooperation behavior could play a moderating effect through the black box of reputation mechanism. Formula (1) represents the implementation rate of environmental cooperative projects for city i in year j
Referring to the quantitative operation of policy function intensity [40,41], this study measures the willingness and implementation intensity of inter-governmental environmental cooperation considering two dimensions, with policy (news) number and power. Implementi,t,n represents a total of n cooperative policies (news) implemented by city i in year t. Willingnessi,t,n represents a total of n cooperative policies (news) that city i expresses its willingness for in year t. Wn represents the weight of the policies’ (news) power, which gradually decreases according to the intervention level from central government (W = 3), provincial government (W = 2), to municipal government (W = 1). In order to avoid measurement errors, the arithmetic mean of the current year and lagging year is adopted to calculate the implementation frequency of inter-governmental cooperation (According to an analysis from the data of inter-governmental cooperation news, it could be speculated that the cycle from reaching cooperative willingness to promoting cooperative implementation is usually 1–2 years for most regional cooperation projects). At the same time, we also add 1 to the denominators in Equation (1) to avoid the situation where a denominator is 0.
3.1.4. Control Variables
A huge difference appears in the social and economic development levels among the cities in the YRD and BTH regions. In order to more accurately figure out the relationship among selective cooperation, regional social capital, and cooperative performance, this study adopts the indictors Total Population (pop), Gross Domestic Product (GDP), Proportion of the Secondary Industry to GDP (second), and Environmental Protection Expenditure (exp) as control variables, which could, respectively, reflect the current situation of each city in the fields of population, economics, industrial structure, and local government financial capacity. The study also logarithmizes all the control variables to reduce the volatility of the control variables over time and alleviate the heteroscedasticity in the model [42].
3.2. Methodology
According to the theoretical analysis, the black box of the reputation mechanism appears as the performance interaction among various actors (local governments). That is, there are strong spatial corrections among various factors of the cities in the regional cooperation network. At the same time, this study does not focus on discussing the results of the spillover effect analysis. The spatial econometric model is adopted for a main regression analysis. After a series of model selection tests and the consideration of spatial correlation errors, this study chooses the Spatial Autoregressive Model (SAR) to eliminate the impact of spatial autocorrelation and other factors on the results when performing an OLS regression [43]. The model is designed as shown in Formulas (2) and (3).
Among them, PM2.5it and Sewageit represent the per capita emissions of PM2.5 and the industrial sewage in year t of city i, respectively. W represents the spatial weight matrix. The study adopts a spatial inverse distance matrix to conduct a spatial econometric analysis, and uses a spatial adjacency matrix in the robustness test. Coefficient ρ represents the spatial interaction relationship between local pollutant emissions and adjacent pollutant emissions. Degreeit, Clusteringit, Rateit, Popit, GDPit, Secondit, and expit represent the average degree of centrality, average clustering coefficient, implementation rate of environmental cooperative projects, total population, gross domestic product, proportion of the secondary industry to GDP, and the environmental protection expenditure in year t of city i, respectively. The interaction term could indicate the moderating effect of the implementation rate on the relationship between the regional bridging social capital and environmental governance performance. The interaction term could measure the moderating effect of the implementation rate on the relationship between the regional bonding social capital and environmental governance performance. Since the role of regional social capital depends on the performance interaction and mutual imitative learning effect with neighboring cities [44], the core goal of this study is to analyze the regression coefficients of these two interaction terms (coefficients , ). μit is the individual fixed effect, while is the random error term.
3.3. Data Source and Descriptive Statistics
As the two representative urban agglomerations in China, the Yangtze River Delta (YRD) and Beijing–Tianjin–Hebei (BTH) regions increasingly receive attention from scholars, especially after both being selected for national development strategies in China. The research target of this study is the cities’ local governments in the YRD and BTH regions. Specifically, the inter-governmental cooperation in the YRD region is mostly driven by the self-interest of local governments, which makes it easier to form a win-win outcome. While the BTH region includes Beijing and Tianjin, two municipalities directly under the Central Government of China, it also covers some undeveloped cities in the Hebei province. In order to ensure the interest of capital development, the sustainable development of many cities in Hebei might not be balanced under top-down intervention. This provides an obvious regional heterogeneity for this study to conduct a comparative analysis.
The city-level social and economic data above were sourced from the China City Statistical Yearbook, China Urban Construction Statistical Yearbook and China Civil Affairs’ Statistical Yearbook, ranging from 2010 to 2021. The variables relating to GDP and fiscal expenditure were converted to the level of 2009 constant prices. The pollutant emission data could be collected using several approaches: the city-level industrial sewage emission could be collected from the China City Statistical Yearbook, and the ground–based PM2.5 concentrations could be gained from the website of the Atmospheric Composition Analysis Group. Compared with the Globe Annual PM2.5 Grids at Columbia University, it could reflect the PM2.5 concentration after 2016, in which the city-level PM2.5 concentration was measured based on the V4.GL.03 geophysical satellite [45].
The implementation rate of inter-governmental environmental cooperation projects is adopted to reflect the behavior strategy of the local governments participating in regional environmental collaborative governance. Referring to the current mainstream literature, the regional environmental cooperation intensity could be indicated by the comprehensive indicator combining the policy (news) number and power of regional environmental cooperation [46]. The Newspaper database of the China Digital Literary Library (2009–2020) was adopted as the fundamental database. On the one hand, we collected the news information and policy documents about inter-governmental environmental cooperation in a wide range. The website information capture technology based on Python environment was adopted. On the other hand, news and policy documents of environmental cooperation were clustered according to their cooperative stages and promotion administrative levels. We took the LDA (Latent Dirichlet Allocation) topic analysis model [47] of machine learning to solve the problem of semantic mining in the text clustering by considering the relationships among words, topics, and texts. The inter-governmental environmental cooperation networks in the YRD and BTH regions are shown in Figure 4 and Figure 5. It could be observed that there was a huge gap in the cooperative network density between the willingness and implementation stages, in both the YRD and BTH regions. It is necessary to explore the effect of inter-governmental behaviors on environmental cooperation performance.
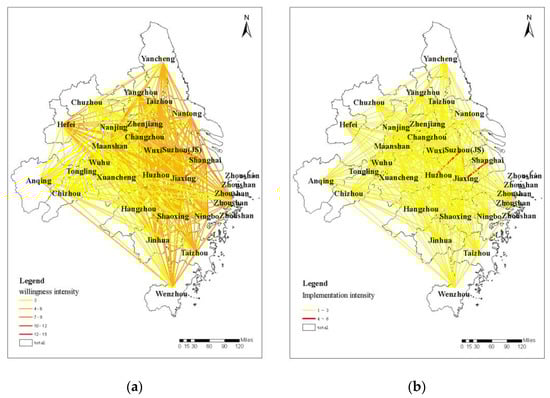
Figure 4.
The inter-governmental environmental cooperation network in YRD. (a) Willingness network; (b) Implementation network. (Note: the willingness network density is 4.3020, while implementation network density is 1.7721).
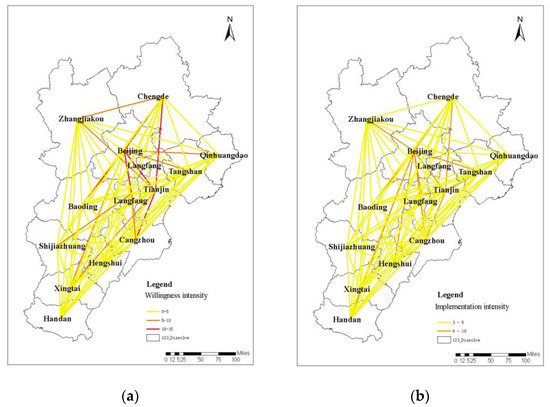
Figure 5.
The inter-governmental environmental cooperation network in BTH. (a) Willingness network; (b) Implementation network. (Note: the willingness network density is 7.411, while implementation network density is 3.949).
According to the database above, a panel data set covering 11 years, from 2009 to 2019 (according to Formula (1), one-year lagging data are used to calculate the implementation rate of environmental cooperation projects. As a result of this, the ultimate panel data only cover 11 years), is formed. There are 13 cities in the BTH region, while there are 27 cities in the YRD region, so the panel data set covers 440 samples. The descriptive statistics are shown in Table 1.

Table 1.
Descriptive statistics.
4. Empirical Analysis
4.1. Spatial Autocorrelation Analysis
Before estimating the spatial econometric regression coefficients, a spatial autocorrelation analysis should be used to reveal the temporal and spatial characteristics of the air pollutant emissions and industrial sewage pollutant emissions, which could be indicated by global Moran’s index. Using the software Arcgis 10.4, the coordinates of the 13 cities in BTH and 27 cities in YRD were extracted, and we could then transfer them into the inverse distance matrix with Stata 15.0. The result of the spatial autocorrelation analysis is shown in Table 2.
Table 2.
The global Moran’s index.
As shown in Table 2, it could be observed that most Moran’s I of the dependent variables were significantly positive from 2009 to 2019, indicating a positive spatial correlation among the cities in the YRD and BTH regions in regard to their PM2.5 and industrial sewage emissions, and the spatial agglomerative effect was significant. As a result of this, it is reasonable to adopt spatial econometric models instead of OLS regression in this study, which could effectively weaken the impact of the spatial mobility of the dependent variables.
4.2. Spatial Regression Analysis
In the benchmark analysis, the study quantitatively explored the influencing mechanism of local governments’ reputation (the implementation rate of environmental cooperative projects) on the relationship between regional social capital and environmental cooperation performance. Table 3 and Table 4 reflect the city-level empirical results of the Spatial Autocorrelation regression (SAR) in the YRD and BTH regions, respectively. Among them, the dependent variable in model (1), (2) is the emissions of PM2.5, while the dependent variable in model (3), (4) is the emissions of industrial sewage. Models (2) and (4) are regressions, adding a series of social and economic control variables. The Spatial Autocorrelation regression results are shown below.
Table 3.
The result of spatial autocorrelation regression in YRD region.
Table 4.
The result of spatial autocorrelation regression in BTH region.
4.2.1. The Empirical Result of YRD Region
According to the SAR result with the sample of the 27 cities in the YRD region in Table 3, since the R-squared of the regressions adding the control variables (R2 = 0.3179/0.5244) is higher than the regressions without the control variables (R2 = 0.1974/0.4456), the regression coefficients in models (2) and (4) are mostly considered. Firstly, the spatial autoregressive coefficient ρ is positive and significant at the 1% level, which indicates that the PM2.5 concentration and industrial sewage emissions show a strong spatial agglomeration with the feature of “high-high, low-low” distribution. This is consistent with the reality. Due to the huge difference in the industrial structure and environmental governance ability among the cities in YRD, the haze and industrial sewage pollution are more serious located in the north of Jiangsu and south of Zhejiang and Anhui, while the air and water resource quality are better in the south of Jiangsu, Shanghai, and north of Zhejiang.
Secondly, we analyze the coefficients of the independent variables indicating the bridging social capital (Degree) and bonding social capital (Cluster). The results show that these two types of social capital could both effectively increase the environmental governance performance to reduce the concentration of PM2.5 and industrial sewage emissions. Hypothesis 1 has been fully validated in the YRD region. At the same time, the coefficients of the implementation rate of environmental cooperation projects (Rate) are not significant, which indicates that the reputation mechanism of local government could not work with a direct effect.
Thirdly, the study mainly focuses on the interaction effect of local governments’ behavior strategies and these two types of social capital. The results show that the interaction term of average-degree centrality (bridging social capital) and implementation rate could significantly reduce the concentration of PM2.5 and industrial sewage emissions (Degree×Rate, β = −0.0079 ***/0.0061 ***). It could be assumed that an increase in reputation could improve the leadership and influence of the central city within a regional cooperative network, facilitating its bridging and coordination role, which could promote the exchange of environmental governance information, thus improving the environmental control performance. However, the interaction term of the average clustering coefficient (bonding social capital) and implementation rate could not significantly affect the environmental governance performance. It could be supposed that the cohesive “small group” type of inter-governmental environmental cooperation is not common among cities in the YRD region. They tend to form open and widely-connected networks instead of a closed network structure. Hypothesis 2 could be fully validated, while Hypothesis 3 is not applicative in the YRD region.
4.2.2. The Empirical Result of BTH Region
The spatial econometric regression results of the 13 cities in the BTH region have an obvious difference compared to the sample of the YRD region. The results of model (2) and (4) are mainly adopted to analyze the regression coefficients (higher R-squared values). Firstly, the spatial autoregressive coefficient ρ is significantly negative at the 1% level, indicating a “high-low” spatial negative spillover feature of the dependent variables in the BTH region. This could be assumed to be due to the “siphon” phenomenon of the environmental governance ability of local governments among adjacent cities.
Second, we explore the relationship between these two types of regional social capital and pollutant emission reduction. It could be observed that the average-degree centrality has a significantly negative effect on the PM2.5 concentration (β = −0.0303 *) and industrial sewage emissions (β = −0.00316 **). However, the coefficients of Cluster are not significant. These results indicate that the information sharing and coordination effect (bridging social capital) of a regional environmental cooperation network work to promote environmental governance performance. However, the impact of promoting trust and internal cohesion (bonding social capital) is masked during the process of inter-governmental environmental cooperation. All in all, Hypothesis 1 has been partly validated in the BTH region
Thirdly, we deeply explore the function mechanism of local governments’ selective behavior during regional environmental cooperation. Similar to the result in the YRD region, the interaction term of average-degree centrality and the implementation rate could also significantly reduce the concentration of PM2.5 and industrial sewage emissions (Degree × Rate, β = −0.441 **/−0.0291 *). However, the coefficients of the interaction term of the average clustering coefficient and implementation rate show the opposite results (Cluster × Rate, β = 0.115 */0.00298 ***), which significantly increase the pollutant emissions. On the one hand, an increase in reputation could enhance the coordination ability of the central city and share environmental governance information with more peripheral cities, so as to improve their environmental governance performance. On the other hand, an increase in reputation could also promote the ability of the internal cohesion of local governments within a small group, which further enhances the path dependence effect of their environmental governance preferences. Specifically, the central city will lead the regional environmental cooperation process, from decision-making to implementation, while peripheral cities will gradually lose their interest in participating in regional cooperation. This will do harm to environmental governance outcomes. Through a comparative analysis of the coefficient values, the absolute values of the pollutant emission reduction (Degree × Rate) are higher than the absolute values of the pollutant emission growth (Cluster × Rate), which indicates that the reputation mechanism could realize an overall pollutant reduction effect. According to the empirical results above, Hypothesis 1 has been totally proved, while Hypothesis 2 cannot be validated in the BTH region.
4.2.3. Robustness Check
Referring to the remaining literature [48,49], this study conducts a robustness test by replacing the spatial weight matrix based on spatial econometric regression. The specific approach is to replace the spatial inverse distance matrix with a spatial adjacency matrix. Since the construction principles of both types of matrices are based on the spatial location conditions of the city unit’s centroid or boundary, the regression results should not deviate too much from the original results. The robustness test results of the SAR with a spatial adjacency matrix are shown in Table 5.
Table 5.
The spatial autocorrelation regression results of YRD and BTH regions (spatial adjacency matrix).
As shown in Table 5, when a spatial adjacency matrix is adopted for a spatial autocorrelation regression analysis, it could be found that the coefficients of the core independent variables are similar to the results in Table 3 and Table 4, regardless of the coefficient values and their significance. The results of the robustness test verify our benchmark regression results, indicating that our empirical conclusions are credible.
5. Conclusions and Discussion
5.1. Conclusions
Regional social capital could be formed from a regional cooperative network during the process of inter-governmental cooperation, and regional policies have effects through different types of social capital paths impacting the cooperative performance. This study incorporated the reputation mechanism, social capital, and environmental governance performance into a unified analysis framework and deeply explored the spatial diffusion process of local governments’ behavior. The empirical strategy was to test the moderating effect of the implementation rate of environmental cooperative projects on the relationship between two types of social capital and the environmental governance performance among the cities in the YRD and BTH regions.
According to the empirical results from the YRD region, the reputation of local government works mainly through the bridging social capital path. An increase in reputation could improve the leadership and coordination ability of the central city among a cooperative network, which could promote the exchange of environmental governance information, thus improving the environmental governance performance. However, since the closed “small group” type of inter-governmental environmental cooperation is not common in the YRD region, the performance promotion path through internal cohesion is not feasible. Local governments in the YRD region tend to form open and widely-connected network structures.
According to the empirical results from the BTH region, the interaction effect of reputation and bridging social capital is similar to the result in the YRD region. However, the moderating effect of reputation through bonding social capital shows the opposite results compared to bridging social capital, which significantly increases the pollutant emissions. This indicates that excessive internal cohesion might strengthen the authority of the central city and enhance the path dependence of local governments’ environmental governance preferences, further deviating from the original intention of inter-governmental environmental cooperation. The above internal cohesion function of reputation might weaken the environmental governance performance through cross-regional cooperation.
5.2. Discussion
Two reasons could be assumed to explain the differential regional cooperation patterns in the YRD and BTH regions. Firstly, the strategic positioning of YRD and BTH are different. The regional development goal of YRD is realizing inter-city “integration”, which is determined to build the “strongest and most active economic growth pole” and a window of “all-round opening up” in China. However, the BTH region has been given the development goal of “regional collaboration”, and its inter-governmental cooperation usually relies on a top-down arrangement to allocate production factors. Secondly, a difference appears concerning intergovernmental relations and their power structures in the YRD and BTH regions. In the YRD region, Shanghai, Jiangsu, Zhejiang, and Anhui are all provincial units and their intergovernmental relations are equal and independent, while in the BTH region, the relationship between Beijing and Tianjin (or Hebei) is more like a central–local relationship, since Beijing is the capital of China. As a result, YRD’s urban agglomeration usually appears as an open and widely-connected cooperative network structure, while an authority-driven and enclosed cooperative pattern is common in BTH’s urban agglomeration, which could generate excessive internal cohesion and the results might deviate from the original intention of the inter-governmental cooperation.
The empirical conclusions above could be beneficial for us to understand the effect of local governments’ selective behavior on regional governance performance through the reputation mechanism. In order to improve the implementation rate of environmental cooperative projects, a “community of entangled interest” should be constructed among local governments [50], which requires these local governments to weaken the concept of administrative boundaries, promoting the integrity of environmental governance among the cities within an urban agglomeration. That is, local governments should put themselves in the position of other stakeholders. At the same time, excessive internal cohesion and fully breaking down administrative divisions are also undesirable during cross-regional environmental governance. Without a clear definition of rights and responsibilities, local governments will have little incentive to participate in environmental governance [51].
The information-sharing mechanism based on horizontal local governments and the punishment mechanism based on vertical power pressure should be adopted to ensure the continuous operation of inter-governmental environmental cooperation, which is useful for suppressing free-riding behavior [52]. At the same time, local governments should carry out cross-border linkage according to actual situations based on a clear division of rights and responsibilities. A representative case is the “United River Chief Policy Pilot” in the YRD integration demonstration zone. It breaks up the administrative border to grant joint enforcement powers to the environmental protection departments of its adjacent cities. Meanwhile, it also clearly defined the rights and responsibilities of different local governments. It achieved an outstanding environmental governance performance (People’s Daily, 9 June 2023. Referring to: http://js.people.com.cn/n2/2023/0609/c360300-40450051.html, accessed on 20 July 2023). Within the current institutional context, local governments remain responsible for local environmental performance, and effective environmental regulation measures should also be adopted to achieve sustainable, instead of campaign-style, environmental governance performance when facing collective action failure.
Author Contributions
Conceptualization, Y.Z.; materials and methods, Y.Z. and J.X.; formal analysis, Y.Z. and D.H.; writing—original draft preparation, Y.Z.; writing—review and editing, Y.Z.; J.X. and D.H.; supervision, J.X. and D.H.; funding acquisition, J.X. All authors have read and agreed to the published version of the manuscript.
Funding
This paper was funded by the National Social Science Foundation of China (22BZZ059).
Data Availability Statement
Not applicable.
Acknowledgments
We want to thank the anonymous referees for their constructive suggestions on the earlier draft of our paper, upon which we have improved the content.
Conflicts of Interest
The authors declare no conflict of interest.
References
- Fu, F.; Hauert, C.; Nowak, M.A.; Wang, L. Reputation-based partner choice promotes cooperation in social networks. Phys. Rev. E 2008, 78, 026117. [Google Scholar] [CrossRef] [PubMed]
- Wang, L.; Chen, T.; Wu, Z. Promoting cooperation by reputation scoring mechanism based on historical donations in public goods game. Appl. Math. Comput. 2021, 390, 125605. [Google Scholar] [CrossRef]
- Franco, M.; Haase, H. The role of reputation in the business cooperation process: Multiple case studies in small and medium-sized enterprises. J. Strategy Manag. 2021, 14, 82–95. [Google Scholar] [CrossRef]
- Goldberg, A.I.; Cohen, G.; Fiegenbaum, A. Reputation building: Small business strategies for successful venture development. J. Small Bus. Manag. 2003, 41, 168–186. [Google Scholar] [CrossRef]
- Li, Y.; Wu, F. Understanding city-regionalism in China: Regional cooperation in the Yangtze River Delta. Reg. Stud. 2017, 3, 313–324. [Google Scholar] [CrossRef]
- Yang, L.; Chen, W.; Wu, F.; Li, Y.; Sun, W. State-guided city regionalism: The development of metro transit in the city region of Nanjing. Territ. Politics Gov. 2021, 1–21. [Google Scholar] [CrossRef]
- Chen, X.; Sullivan, A.A. Should I Stay or Should I Go? Why Participants Leave Collaborative Governance Arrangements. J. Public Adm. Res. Theory 2022, 33, 246–261. [Google Scholar] [CrossRef]
- Ye, C.; Chen, R.; Chen, M.; Ye, X. A new framework of regional collaborative governance for PM2.5. Stoch. Environ. Res. Risk Assess. 2019, 33, 1109–1116. [Google Scholar] [CrossRef]
- Zhao, C.; Wang, X.; Cheung, P.T.; Xu, J. Influence of External Authorities on Collaborative Frictions. Public Adm. Rev. 2023, 83, 603–622. [Google Scholar] [CrossRef]
- Zhao, Y.; Wang, Y. Why Do They Say One Thing and Do Another? Exploring the Factors Influencing the Strategy Selection of Local Governments in the Process of Regional Public Service Cooperation; Working Paper. 2023; Unpublish. [Google Scholar]
- Xing, P.; Xing, H. Blood is thicker than water: Local favouritism and inter-local collaborative governance. Policy Stud. 2022, 1–19. [Google Scholar] [CrossRef]
- Wang, Y.; Zhao, Y. Is collaborative governance effective for air pollution prevention? A case study on the Yangtze river delta region of China. J. Environ. Manag. 2021, 292, 112709. [Google Scholar] [CrossRef]
- Huxham, C.; Vangen, S. Managing to Collaborate: The Theory and Practice of Collaborative Advantage; Routledge: London, UK, 2013. [Google Scholar]
- Havakhor, T.; Soror, A.A.; Sabherwal, R. Diffusion of knowledge in social media networks: Effects of reputation mechanisms and distribution of knowledge roles. Inf. Syst. J. 2018, 28, 104–141. [Google Scholar] [CrossRef]
- Yi, H. Network structure and governance performance: What makes a difference? Public Adm. Rev. 2018, 78, 195–205. [Google Scholar] [CrossRef]
- Huang, C.; Chen, W.; Yi, H. Collaborative networks and environmental governance performance: A social influence model. Public Manag. Rev. 2021, 23, 1878–1899. [Google Scholar] [CrossRef]
- Gao, X. Research on regional cooperation from the perspective of regional social capital. Contemp. World Social. 2013, 5, 123–126. (In Chinese) [Google Scholar]
- Shi, J.; Tang, D. Research on regional innovation networks based on social capital theory. Sci. Manag. Res. 2007, 5, 10–13. (In Chinese) [Google Scholar]
- Ferris, G.R.; Perrewe, P.L.; Douglas, C. Social effectiveness in organizations: Construct validity and research directions. J. Leadersh. Organ. Stud. 2002, 9, 49–63. [Google Scholar] [CrossRef]
- Andrew, S.A.; Carr, J.B. Mitigating uncertainty and risk in planning for regional preparedness: The role of bonding and bridging relationships. Urban Stud. 2013, 50, 709–724. [Google Scholar] [CrossRef]
- Feiock, R.C.; Lee, I.W.; Park, H.J. Administrators’ and elected officials’ collaboration networks: Selecting partners to reduce risk in economic development. Public Adm. Rev. 2012, 72, S58–S68. [Google Scholar] [CrossRef]
- Berardo, R.; Scholz, J.T. Self-organizing policy networks: Risk, partner selection, and cooperation in estuaries. Am. J. Political Sci. 2010, 54, 632–649. [Google Scholar] [CrossRef]
- Lee, I.W.; Feiock, R.C.; Lee, Y. Competitors and cooperators: A micro-level analysis of regional economic development collaboration networks. Public Adm. Rev. 2012, 72, 253–262. [Google Scholar] [CrossRef]
- Coleman, J.S. Social capital in the creation of human capital. Am. J. Sociol. 1988, 94, S95–S120. [Google Scholar] [CrossRef]
- Zhao, Y.; Wang, Y. Selective cooperation: The inter-governmental public service supply in regional governance of Yangtze River Delta. J. Shanghai Adm. Inst. 2022, 23, 27–37. (In Chinese) [Google Scholar]
- Lopez-Pintado, D.; Watts, D.J. Social influence, binary decisions and collective dynamics. Ration. Soc. 2008, 20, 399–443. [Google Scholar] [CrossRef]
- Jiao, Y.; Chen, T.; Chen, Q. The impact of expressing willingness to cooperate on cooperation in public goods game. Chaos Solitons Fractals 2020, 140, 110258. [Google Scholar] [CrossRef]
- Liu, Y.; Chen, T. Sustainable cooperation based on reputation and habituation in the public goods game. Biosystems 2017, 160, 33–38. [Google Scholar] [CrossRef]
- Liu, Y.; Chen, T.; Wang, Y. Sustainable cooperation in Village Opera based on the public goods game. Chaos Solitons Fractals 2017, 103, 213–219. [Google Scholar] [CrossRef]
- Wang, Z.; Chen, T.; Wang, Y. Leadership by example promotes the emergence of cooperation in public goods game. Chaos Solitons Fractals 2017, 101, 100–105. [Google Scholar] [CrossRef]
- Provan, K.G.; Sebastian, J.G. Networks within networks: Service link overlap, organizational cliques, and network effectiveness. Acad. Manag. J. 1998, 41, 453–463. [Google Scholar] [CrossRef]
- Meier, K.J.; O’Toole, L.J., Jr. Managerial strategies and behavior in networks: A model with evidence from US public education. J. Public Adm. Res. Theory 2001, 11, 271–294. [Google Scholar] [CrossRef]
- Burt, R.S. Brokerage and Closure: An Introduction to Social Capital; Oxford University Press: Oxford, UK, 2005. [Google Scholar]
- Scholz, J.T.; Wang, C.L. Learning to cooperate: Learning networks and the problem of altruism. Am. J. Political Sci. 2009, 53, 572–587. [Google Scholar] [CrossRef]
- Shrestha, M.K.; Feiock, R.C. Transaction cost, exchange embeddedness, and interlocal cooperation in local public goods supply. Political Res. Q. 2011, 64, 573–587. [Google Scholar] [CrossRef]
- Yi, H.; Scholz, J.T. Policy networks in complex governance subsystems: Observing and comparing hyperlink, media, and partnership networks. Policy Stud. J. 2016, 44, 248–279. [Google Scholar] [CrossRef]
- Borgatti, S.P.; Everett, M.G.; Freeman, L.C. Freeman. In UCINET for Windows: Software for Social Network Analysis; Analytic Technologies: Harvard, MA, USA, 2002. [Google Scholar]
- Tan, J.; Zhao, J.Z. The rise of public–private partnerships in China: An effective financing approach for infrastructure investment? Public Adm. Rev. 2019, 79, 514–518. [Google Scholar] [CrossRef]
- Tan, J.; Zhao, J.Z. Explaining the adoption rate of public-private partnerships in Chinese provinces: A transaction cost perspective. Public Manag. Rev. 2021, 23, 590–609. [Google Scholar] [CrossRef]
- Peng, J.; Zhong, W.; Sun, W. Policy measurement, policy collaborative evolution and economic performance: An empirical study based on innovation policies. J. Manag. World 2008, 180, 25–36. (In Chinese) [Google Scholar]
- Sun, W.; Peng, J.; Huang, Y. Evolution of technology policies in China: A comparative analysis between central and local levels. J. Sci. Technol. Policy China 2011, 2, 238–254. [Google Scholar] [CrossRef]
- He, L.; Zhang, X. The distribution effect of urbanization: Theoretical deduction and evidence from China. Habitat Int. 2022, 123, 102544. [Google Scholar] [CrossRef]
- Ord, K. Estimation methods for models of spatial interaction. J. Am. Stat. Assoc. 1975, 70, 120–126. [Google Scholar] [CrossRef]
- Young, H.P. Innovation diffusion in heterogeneous populations: Contagion, social influence, and social learning. Am. Econ. Rev. 2009, 99, 1899–1924. [Google Scholar] [CrossRef]
- Hammer, M.S.; van Donkelaar, A.; Li, C.; Lyapustin, A.; Sayer, A.M.; Hsu, N.C.; Levy, R.C.; Garay, M.J.; Kalashnikova, O.V.; Kahn, R.A.; et al. Global estimates and long-term trends of fine particulate matter concentrations (1998–2018). Environ. Sci. Technol. 2020, 54, 7879–7890. [Google Scholar] [CrossRef] [PubMed]
- Du, H.; Guo, Y.; Lin, Z.; Qiu, Y.; Xiao, X. Effects of the joint prevention and control of atmospheric pollution policy on air pollutants-A quantitative analysis of Chinese policy texts. J. Environ. Manag. 2021, 300, 113721. [Google Scholar] [CrossRef] [PubMed]
- Kar, M.; Nunes, S.; Ribeiro, C. Summarization of changes in dynamic text collections using Latent Dirichlet Allocation model. Inf. Process. Manag. 2015, 51, 809–833. [Google Scholar] [CrossRef]
- Ma, D.; Zhang, J.; Wang, Z.; Sun, D. Spatio-temporal evolution and influencing factors of open economy development in the Yangtze River Delta area. Land 2022, 11, 1813. [Google Scholar] [CrossRef]
- Zhao, Y.; Liang, C.; Zhang, X. Positive or negative externalities? Exploring the spatial spillover and industrial agglomeration threshold effects of environmental regulation on haze pollution in China. Environ. Dev. Sustain. 2021, 23, 11335–11356. [Google Scholar] [CrossRef]
- Wang, H.; Ran, B. Network governance and collaborative governance: A thematic analysis on their similarities, differences, and entanglements. Public Manag. Rev. 2022, 25, 1187–1211. [Google Scholar] [CrossRef]
- Xiong, J. The administrative division’s logic of regional urban integration: Governing with administrative division and reforming administrative division with governance. J. Shanghai Adm. Inst. 2017, 23, 65–73. (In Chinese) [Google Scholar]
- Song, M.; Lai, Y.; Zhang, Y.; Li, L.; Wang, E. From Neighbors to Partners: A quantum game model for analyzing collaborative environmental governance in China. Expert Syst. Appl. 2022, 210, 118248. [Google Scholar] [CrossRef]
Disclaimer/Publisher’s Note: The statements, opinions and data contained in all publications are solely those of the individual author(s) and contributor(s) and not of MDPI and/or the editor(s). MDPI and/or the editor(s) disclaim responsibility for any injury to people or property resulting from any ideas, methods, instructions or products referred to in the content. |
© 2023 by the authors. Licensee MDPI, Basel, Switzerland. This article is an open access article distributed under the terms and conditions of the Creative Commons Attribution (CC BY) license (https://creativecommons.org/licenses/by/4.0/).