Abstract
Central Zagros region in Iran is a major hotspot of carbon storage and sequestration which has experienced severe land cover change in recent decades that has led to carbon emission. In this research, using temporal Landsat images, land cover maps were produced and used in Land Change Modeler to predict land cover changes in 2020, 2030, 2040 and 2050 using Multilayer Perceptron Neural Network and Markov Chain techniques. Next, resultant maps were used as inputs to Ecosystem Services Modeler. The Intergovernmental Panel on Climate Change (IPCC) report data was used to extract carbon data. Results show that between 1989–2013 about half of forests have been destroyed. Prediction results show that by 2050 about 75% of existing forests will be lost and between 2013–2020 about 157,000 Mg carbon and by 2050 about 565,000 Mg carbon will be lost with more than US$1.9 million to 2020 and AU$3.2 million by 2050 economic compensation.
1. Introduction
Ecosystem services include all the benefits that humans gain from ecosystems [1,2,3,4,5] and are aimed at establishing a link to human well-being in four categories of service: regulating, provisioning, cultural and supporting. Regulating services consists of the benefits of natural ecosystem regulation processes such as climate setting, land cover change, etc. [3]. Ecosystems with the additional and removal function of greenhouse gases (GHGs), as CO2 from the atmosphere, play an important role in climate regulation as an ecosystem service [6]. In fact, carbon storage of forests, rangelands and other land ecosystems is four times more than the atmosphere (3060 Giga Tons vs. 760 GTs) [7]. Furthermore, concentration of carbon in plants and soil over time, will lead to excess carbon sequestration every year. Domestic carbon storage is one of the main ecosystem services, and studies have shown that the value of one tone of cinnamon is equal to the amount of damage that is avoided by preventing the release of one ton of carbon into the atmosphere [8,9]. In addition, carbon inventory is an important indicator of the land’s potential capacity for carbon storage. Changes in carbon storage may have direct and indirect effects and consequences on socio-economic well-being of human and natural environment [10].
Sustainable land management involves using the land within its capability to ensure the productivity and economic potential of the land is maintained, whilst its ecological function, is not diminished. Where economic, social and environmental factors are considered simultaneously by land managers, the long-term sustainability of the health, resilience and productivity of a property is more likely to be assured. Human activities in terms of land cover change have substantially altered global land cover, so that land cover change is around four times greater in extent than previously estimated from long-term land change assessments [11]. The area used for livestock grazing from 234 million hectares in 1700 reached 3429 million hectares in 2000, accounting for 25% of the Earth’s surface [12]. Land cover change has affected the capability of ecosystems to deliver services. Among ecosystems, forests provide the largest number of ecosystem services. Also, most biodiversity is seen in forest ecosystems. One of the most important services of forest ecosystems is the absorption and stabilization of carbon dioxide and its use in the process of photosynthesis. Zagros forests, which stretch from northwest to southeast of Iran, are one of the strategic regions in Iran. These forests account for more than 33% of the annual rainfall and are the headwater of about half of rivers and springs, which provide 50 billion m3 of water per year as the main source of water supply in the central dry plateau of Iran [13]. Regarding the intensification of global warming in recent years, forests, as the largest source of GHG emissions, especially CO2, play a basic role in regulating global temperature, and the destruction of forest cover in the crisis escalation. Based on the Intergovernmental Panel on Climate Change (IPCC), 20% of the whole carbon dioxide produced in the world comes from deforestation and forest degradation [6]. Integrating the concept of ecosystem services into land cover management issues, selecting areas for protection and ecosystem services compensation requires information about the spatial distribution of services.
With the growing recognition of the importance of ecosystem services, there is a need for adequate software and accurate prediction models that can provide information for ecosystem services to decision-makers, and examine the results of land cover management on services. One of the ecosystem services mapping software, the integrated software ecosystem services pricing and the interaction between them, is the Ecosystem Services Modeler, which is a vertical application within the TerrSet System. It is a spatially powerful decision support system to evaluate ecosystem services, which is based entirely on InVEST toolset developed by the Natural Capital Project.
The aim of this study is to investigate the stored or lost carbon over the study period by addressing the following key questions: how much land cover change has happened and how much will occur in the future?; how much carbon is stored or sequestered and how much it costs?; what is the trend of land cover changes and how it affects carbon sequestration?
2. Materials and Methods
Based on Figure 1 this study includes three main parts: the first part is land cover change analysis and preparation for prediction, the second part is land cover change prediction and the third part is carbon storage and sequestration using Ecosystem Services Modeler (ESM).
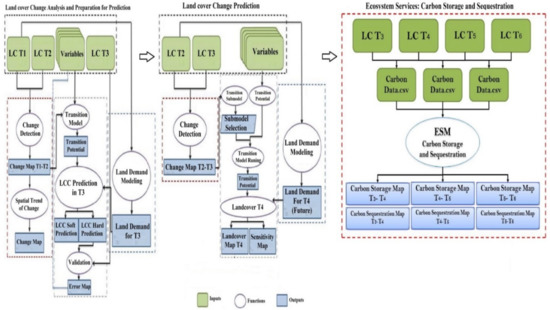
Figure 1.
Flowchart of this study.
For satellite image analysis and modeling, the softwares used in this study are as follows:
- ERDAS IMAGINE 9.2 was used for Landsat image classification, accuracy assessment of images classification and production of land cover maps.
- TerrSet: In this software, two main models were used in this study as follows:
- -
- Land Change Modeler (LCM) was used for land cover change detection, transition sub-model selection, variable selection, transition potential modelling, change demand modelling, model validation and land cover change prediction.
- -
- Ecosystem Services Modeler (ESM) was used for carbon storage and sequestration calculation.
2.1. Study Area
Zagros area, with the three major regions Northern, Central and Southern, stretches from northwest to southeast of Iran. In this research, the central Zagros region in Lorestan province of Iran between 46°50 E to 50°1 E, and 32°40 N to 34°23 N with about 2.8 × 10⁶ ha is studied while 7.6 × 10⁵ ha of this area is covered by the forest (Figure 2) [13].
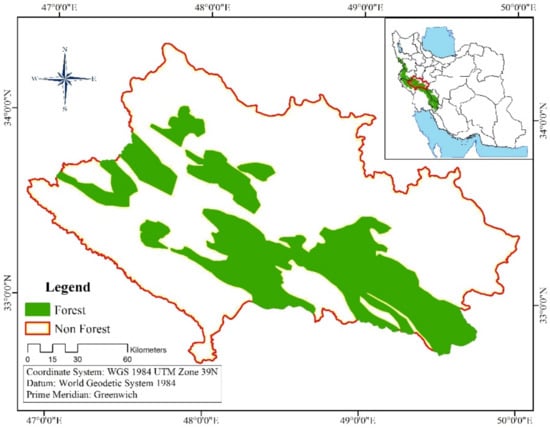
Figure 2.
Study site in west of Iran.
2.2. Land Cover Change Analysis and Preparation for Prediction
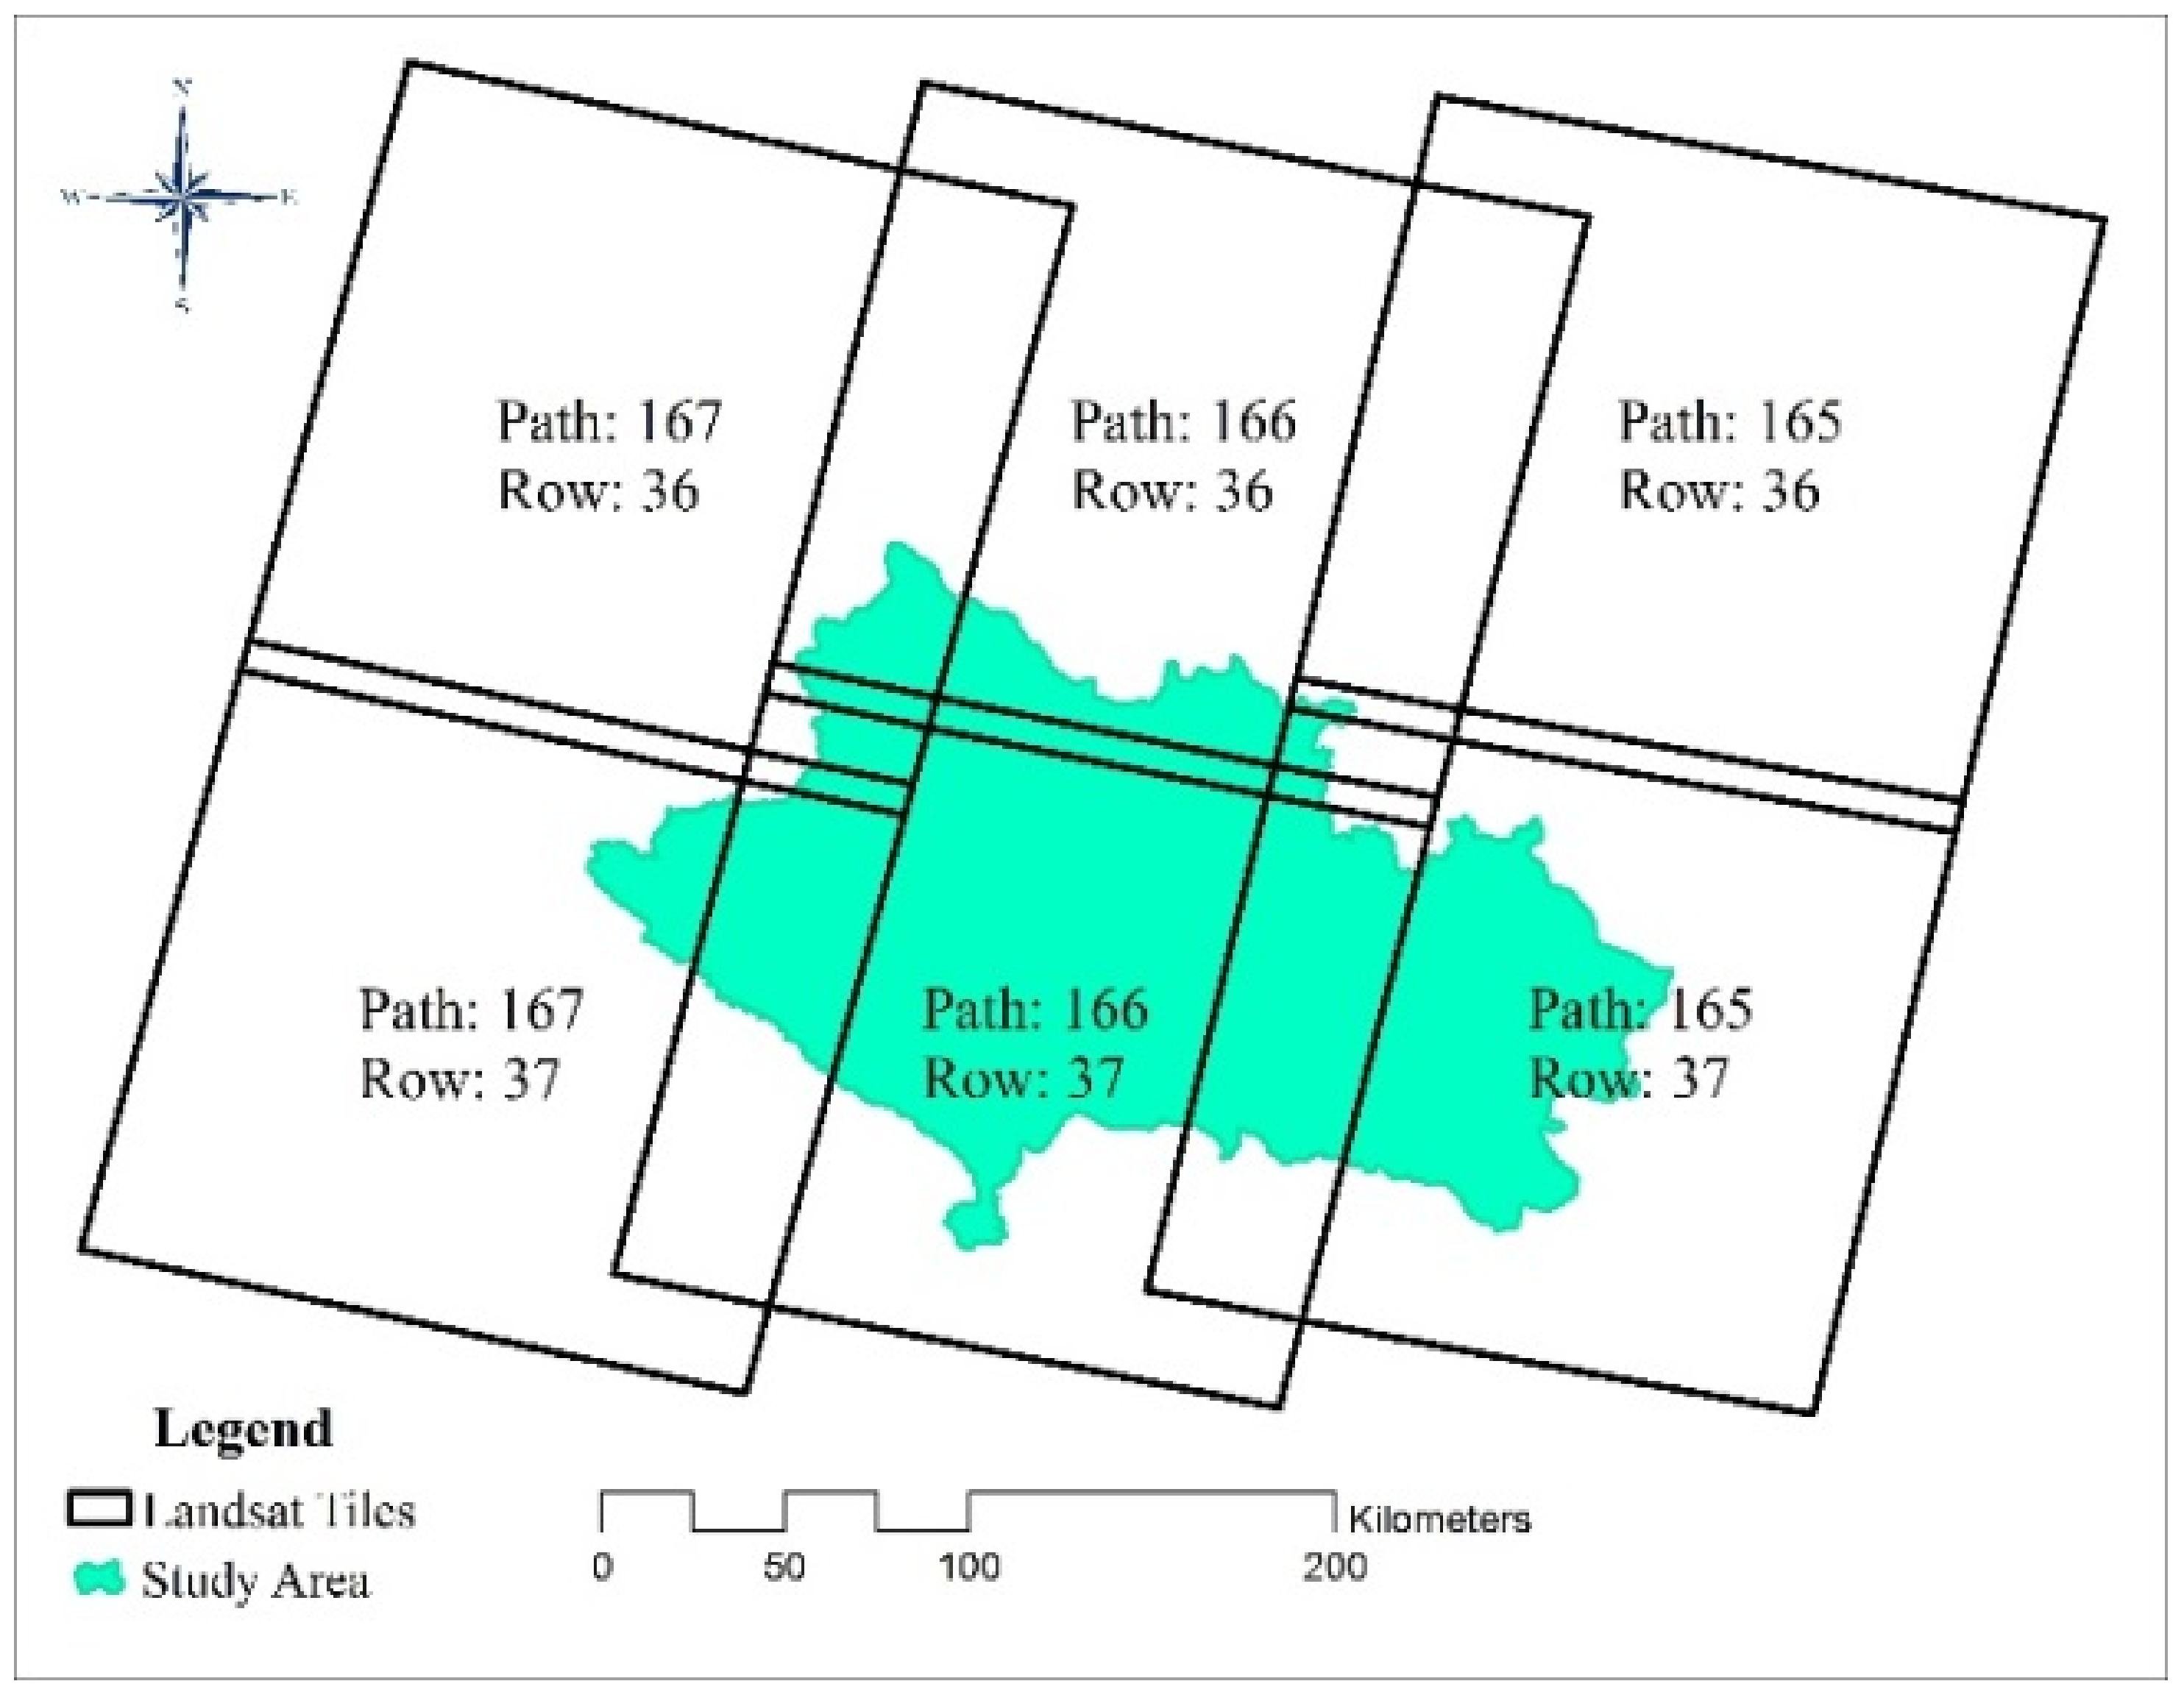
Six Landsat tiles cover the study area (Figure 3). Based on Figure 3 in this step, all Landsat images of the study area from different sensors, such as TM, ETM+ and OLI which were downloaded for the years 1989, 2000 and 2013, respectively. Moreover, street map was downloaded from Open Street Map (OSM) and then it was edited using Landsat images and Google earth maps [13]. Also, carbon data were extracted from Intergovernmental Panel on Climate Change (IPCC) data.

Figure 3.
Landsat tiles in study area.
2.3. Multi-Temporal Land Cover Classification for Land Cover Change Detection
Based on Figure 1, in order to analyze land cover changes, Landsat images were classified using maximum likelihood and object-oriented methods into nine classes: forest, irrigated farming, scattered dry farming, dry farming, range, water, residential, bare land; and transportation using ERDAS IMAGINE 9.2 software.
Maximum likelihood classification is a popular method for determining a known class of distributions as the maximum for a given statistic. The root of maximum likelihood classification can be traced back [14]. An assumption of normality is made for the training samples. The algorithm builds the probability density functions for each category. During classification, all unclassified pixels are assigned membership based on the relative likelihood (probability) of that pixel occurring within each category’s probability density function [14,15]. Training areas were established by choosing one or more polygons for each class. Pixels that fall within the training area were taken as the training pixels for a particular class. In order to select a good training area for a class, the important properties (e.g., uniformity) and how well they represent the same class throughout the whole image were taken into consideration [16,17].
Land cover change detection was carried out using Land Change Modeler (LCM) in TerrSet Software by using the land cover maps of 1989 and 2000 as T1 and T2, respectively which produced T1-T2 land cover change map and 2000 and 2013 as T2 and T3, respectively which produced T2-T3 land cover change map.
2.4. Accuracy Assessment
Accuracy assessment of classified land cover maps was carried out using ground control points (GCP) in ERDAS IMAGINE 9.2 software. Based on Equation (1) [18], the optimum number of GCP was determined as 196 points for each Landsat tile. The study area is covered by 6 Landsat tiles (Figure 1). A summation of 1176 points were checked for each time point and the accuracy assessment measures of KIA (Kappa Index of Agreement), kappa and classification accuracy are shown in Table 1.
where:

Table 1.
Accuracy assessment of land cover classification.
- N: number of GCP
- Z: standard score for suitable of confidence level (e.g., 1.96 for 95% and 2.58 for 99% confidence)
- P: required accuracy
- q: 1-p
- E: acceptable error (e.g., 0.01 for ± 10%)
2.5. Transition Sub-Model Selection
Based on the most important and frequent land cover changes in 1989–2000 and 2000–2013, transition from all other classes to forest selected as deforestation sub-model [13]. Transition potential modelling was done in LCM in TerrSet software.
2.6. Variable Selection
Based on Table 2, variable selection was performed using the literature review and Cramer’s correlation coefficient in LCM in TerrSet software. Cramer is a statistical coefficient that shows chi-square values between 0–1 while 1 shows the most agreement between two variables. In this section, Explanatory power test module of LCM is used to select the suitable variables based on Equation (2) [19].
where:
Table 2.
Variables selected by Cramer’s value.
- t: number of columns-1 or number of rows-1
- n: number of rows
- x: number of columns
2.7. Transition Potential Modelling
Transition potential modelling, which determines the potential of each cell of a land cover class for conversion to another, requires the selection of a suitable approach and definition of transition sub-model. Transition potential modelling is a base for land cover change simulation [13]. In this study, a Multilayer Perceptron Neural network, which includes three main layers of input, hidden and output, is used for transition potential modelling based on two sub-models: (1) deforestation and (2) residential development was performed using LCM in TerrSet software. Deforestation refers to changes from forest to all other land cover classes, and residential development refers to changes from all other classes to residential.
2.8. Change Demand Modelling
To predict land cover changes, Land Change Modeler (LCM) was used. This model, using Markov chain, can predict the possible future change from a land cover class to another under customized scenarios [2,13,20] using TerrSet software. Markov chain is a proper tool for land cover changes prediction, which simplifies the description of land cover changes. This model has the capabilities of explaining and determining the land cover changes [13,21]. In this study, Markov chain has been used in preparing the “probability prediction matrix” in TerrSet software.
2.9. Model Validation
Considering the importance of model validation, a Kappa coefficient was carried out using LCM in TerrSet software to determine model accuracy and persistence based on a comparison of derived land cover maps using Landsat image classification and change simulation in 2013 (as T3).
2.10. Land Cover Change Prediction
Based on the results of model validation, if model accuracy is more than 85% there is a good situation and if it is less, model should be repeated [13]. At last, when model validation gave suitable results, land cover maps of 2000 and 2013 (as T2 and T3) were defined as input maps and land cover change prediction will occur in the future in 2020, 2030, 2040 and 2050.
2.11. Carbon Storage and Sequestration Calculation Using ESM
Currently, the amount of carbon stored in terrestrial ecosystems is four times more than the atmosphere, and they play a very important role in moderating climate change due to the changes in carbon levels. However, changing land cover because of timber harvesting, fire or deforestation may change the amount of carbon stored in a landscape. Thus, land management methods are necessary to preserve terrestrial carbon resources [22].
Four primary sources of carbon storage determine the amount of carbon stored in a terrestrial parcel: aboveground biomass, underground biomass, soil organic matter and dead organic matter [23]. Each of these sources contains different sections that store a certain amount of carbon. Stems, stumps, branches, bark, seeds and foliage of plants are known as aboveground biomass (living biomass top of the soil surface). Live biomass of underground roots is the source of underground biomass. Also, soil organic matter, as the largest carbon pool on land, is composed of biomass of micro-organisms, fresh and partially decomposed residues and humus. Dead or particulate organic matter is also composed of leaf litter and other organic matter mixed with soil [22].
A simplified carbon cycle is used in ESM in TerrSet software to estimate the amount of carbon stored in an area, and to calculate the total amount of destroyed biomass in a forested area [22]. To estimate carbon storage and sequestration, ESM needs land cover maps in raster (*.rst) and the table of carbon pools in *.csv file and they should match with column code of each other [4,22].
In order to explain the difference between stored carbon and precipitated carbon, the definitions of these concepts are explained as follows. Stored carbon is the amount of carbon that is stored in the short term in each carbon pool, while sequestered carbon indicates the amount of long-term stored carbon in each pool [22]. In order to map the amount of carbon stored in the study area, it is necessary to estimate the amount of carbon stored in four main carbon pools for all land cover classes. In this regard, if possible, elevation classes’ data, human disturbances and landscape dynamic data can be used [22].
At the end of processes, three maps were produced as listed below:
Sequestered Carbon (Mg): The total amount of carbon sequestered per land parcel. The amount of it is based on the difference between the amount of carbon between T1 (present) and T2 (future) at land cover level. The resulting map shows the amount of carbon sequestration in which the positive values indicate carbon sequestration and negative values indicate released carbon to the atmosphere.
The value of Currently Stored Carbon: The value of stored carbon represents the market price of carbon in the carbon market in US dollars, which determines the total value of carbon stored in the landscape based on the current land cover.
The value of Sequestered Carbon: The value of sequestered carbon shows the economic value of the amount of carbon sequestered per pixel of the T1 (current) to T2 (future) land cover scenario in US dollars or other currencies, while positive values representing the sequestration gain and the negative values indicates the cost of carbon emissions.
The ESM model can estimate the amount of net changes in carbon stock using the current and future land cover maps, which determine the amount of carbon storage and emissions. In this process, the total amount of sequestered carbon during the study period and its economic value will be determined [22].
2.11.1. Carbon Density
The carbon density values are required for four carbon pools (Cabove, Cbelow, Csoil and Cdead). Due to the lack of carbon data, carbon density data are obtained from the Intergovernmental Panel on Climate Change (IPCC) report. Additionally, carbon capture densities of carbon pools that can be used to maintain the carbon sequestration of forest landscape in each grid are considered as constant values throughout the study period, with the difference that the time for the change is ignored.
Therefore, in this research biomass carbon stock for each land cover class was not calculated and, therefore, the IPCC data were used.
2.11.2. Extracting Carbon Data from IPCC Report
Intergovernmental Panel on Climate Change (IPCC) has published a report on climate change that includes carbon data obtained from previous literature and data collection using half-life of wood product to estimate the average decay rate. Moreover, chapter HWP in 2006 IPCC Guidelines for National Greenhouse Gas Inventories report has introduced applicable methods for the calculation of carbon stored in wood such as decay rate and half-life estimation. Note that if the harvested wood is used to produce different products, the slowest half-life should be applied [10].
3. Results
3.1. Land Cover Changes
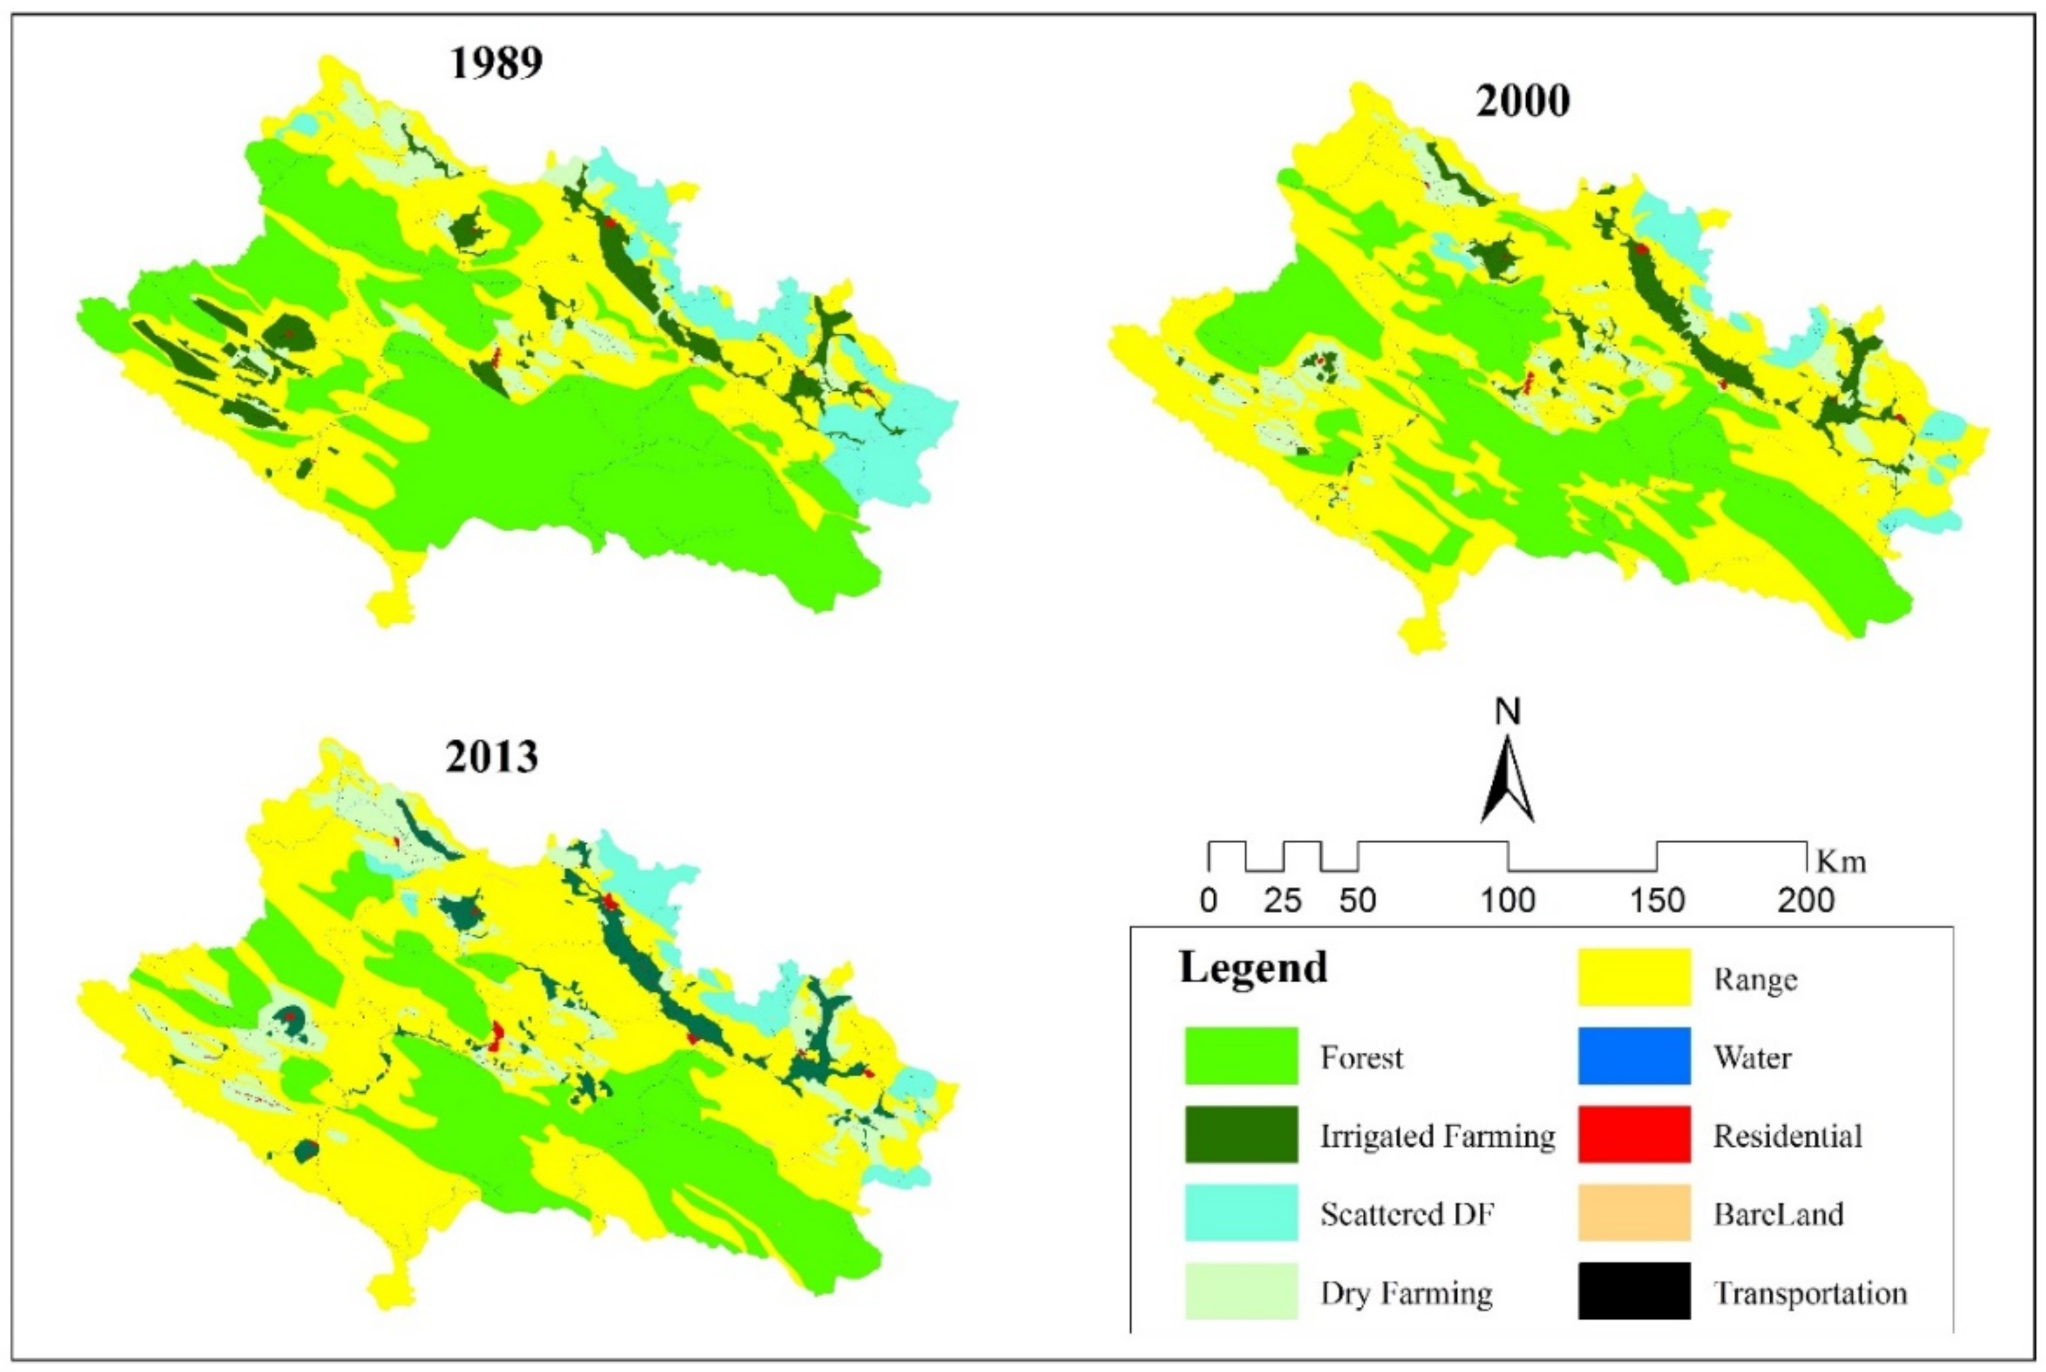
The produced land cover maps during Landsat images classification (Figure 4) had an accuracy of classification of more than 85% [13,24]. At this step, a map with a spatial resolution of 20 m was produced for each time point [13]. The most concentration of Zagros forests in study area is shown in the west, center and south.

Figure 4.
Land cover maps produced by Landsat image classification.
As shown in Figure 5, in 1989 about 45% of study area is covered by Zagros forest, whereas in 2000 it has decreased to 33%. According to Table 3, from 1989 to 2000 more than 6500 ha of Zagros forests has changed to cultivated lands (irrigated farming, scattered dry farming and dry farming) about 460,000 ha to rangeland, about 1300 ha to water resources because of dams and about 100 ha to human made disturbances (residential areas or settlements and roads). Also, in 2000–2013, forest cover has decreased to 27% while more than 270,000 ha has changed to rangeland, about 19,500 ha to cultivated lands (irrigated farming, dry farming), more than 800 ha to water resources, about 200 ha to human made land covers (residential areas and transportation network).
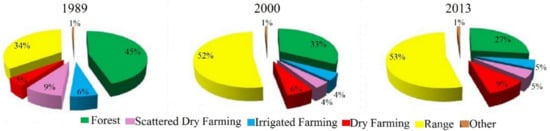
Figure 5.
Percentage of land cover classes.
Table 3.
Deforestation matrix from 1989 to 2013 (unit: hectares).
3.2. Predicting Land Cover Change
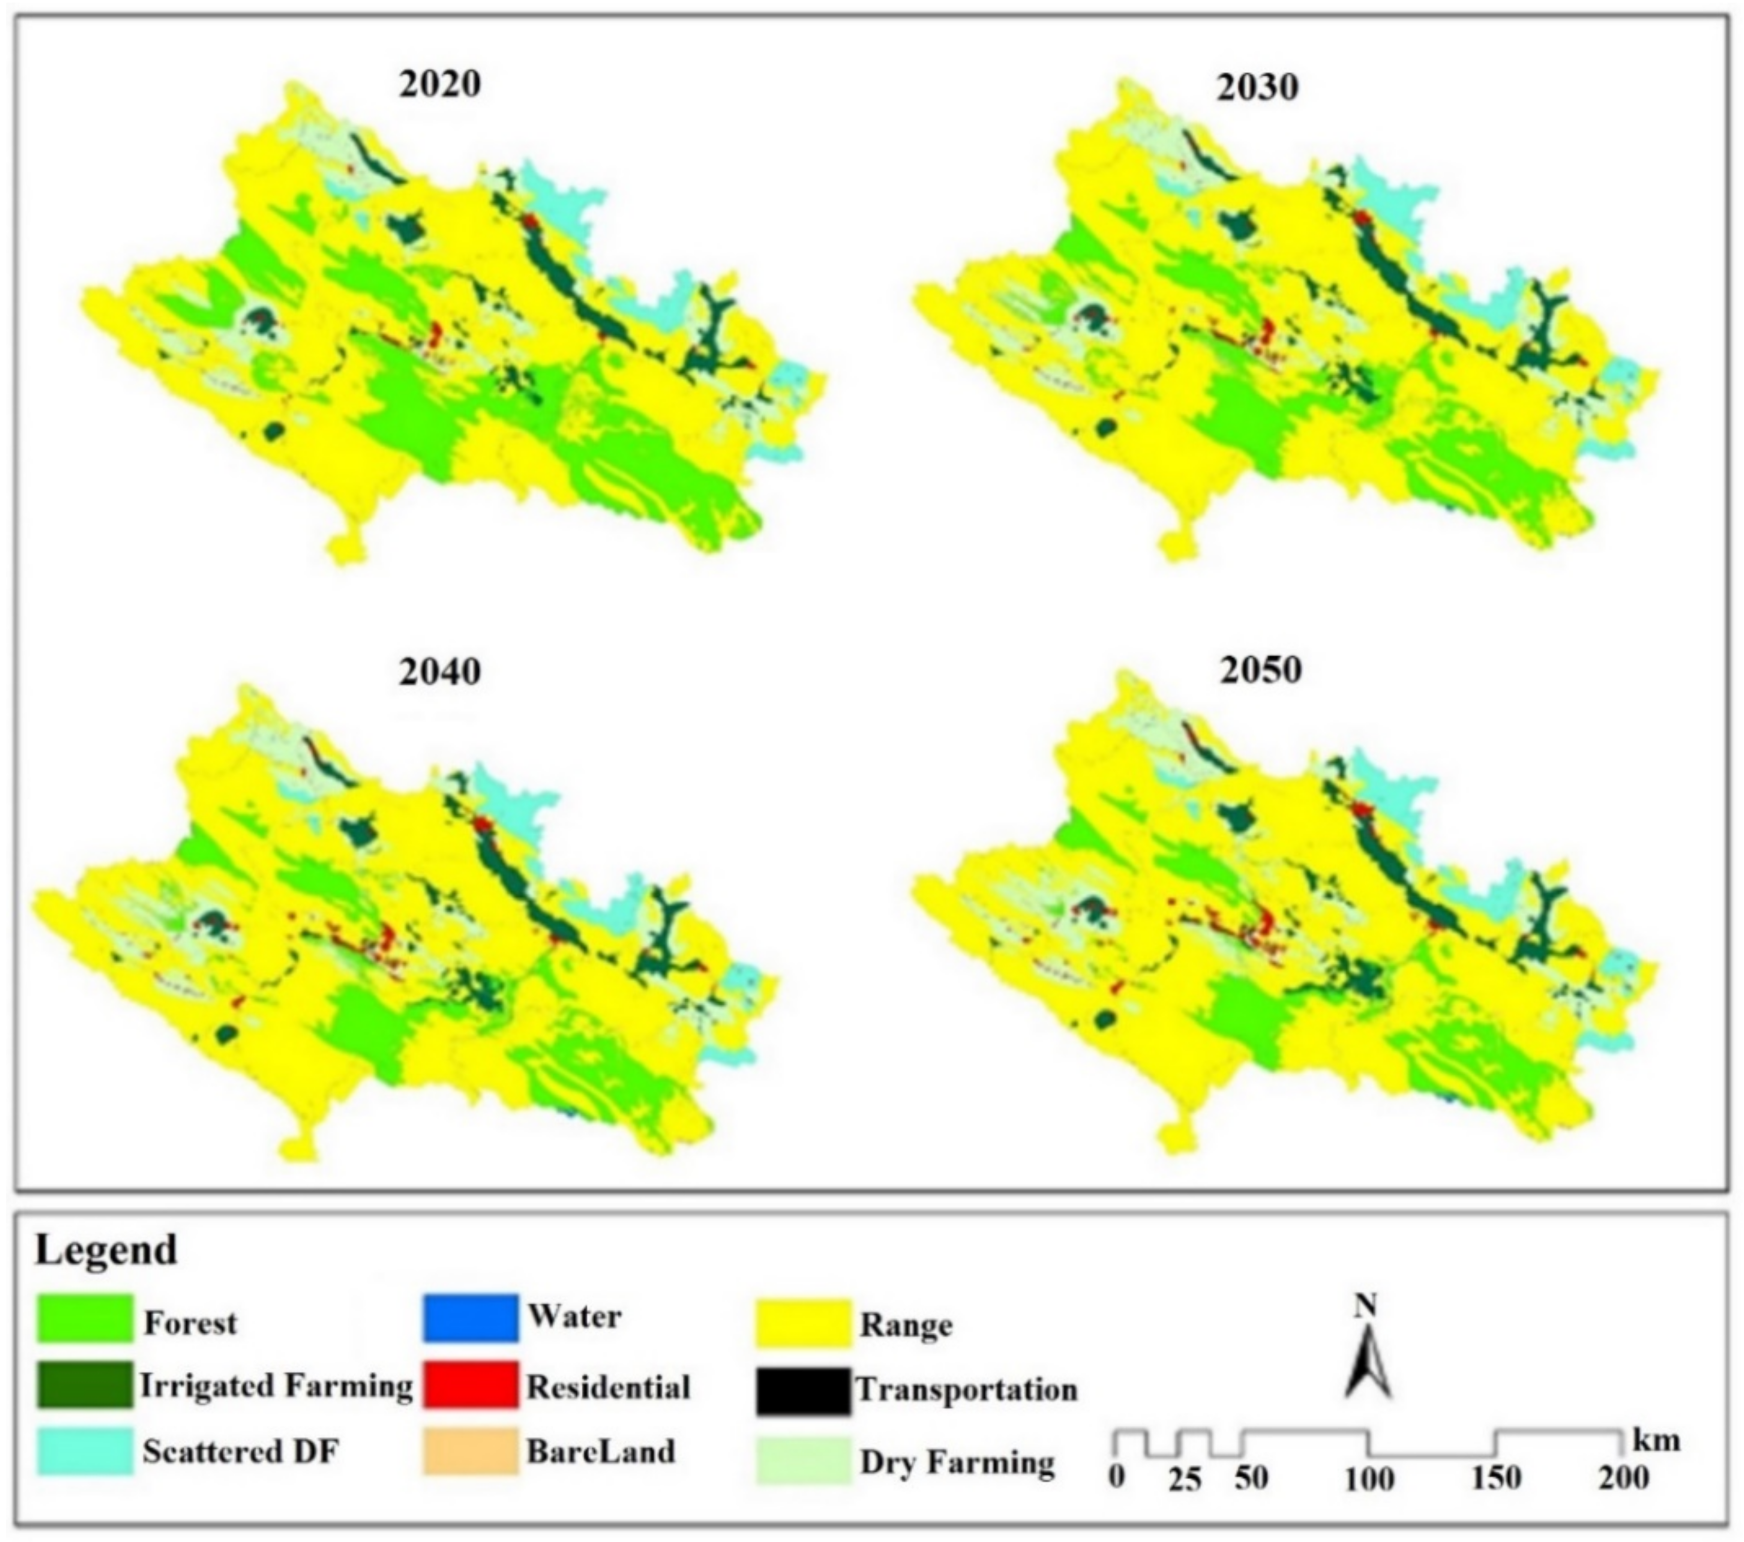
The produced land cover maps using LCM are shown in Figure 6 that predicts land cover maps for 2020, 2030, 2040 and 2050 and visualizes distribution of land cover changes in the study area in the future. As shown in Figure 7 based on a historical scenario in 2020, about 21% of study area is covered by Zagros forests while in 2030 will decrease to 16% and by 2050 it will decrease to 12% and mostly it will be converted to rangelands. On the other-hand conversion of forests to irrigated farming between 2013 to 2050 during these four periods will increase constantly as between 2013–2020 more than 3000 ha, 2020–2030 more than 4500 ha, 2030–2040 more than 5300 ha and 2040–2050 more than 5600 ha of forests will convert to irrigated farming. Moreover, dry farming is increasing constantly while between 2013–2020 about 9%, 2020–2030 about 10%, 2030–2040 more than 11% and 2040–2050 more than 12% of study area will be covered by dry farming. Also based on Table 4 bare land as a human disturbance is increasing constantly while between 2013–2020 more than 76 ha of forests will convert to bare land and to 2050 will increase to more than 600 ha.

Figure 6.
Future landcover maps.
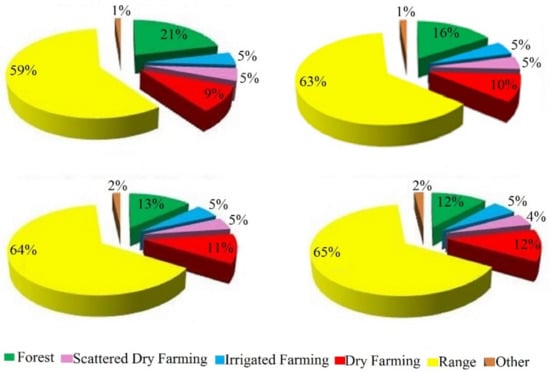
Figure 7.
Percentage of predicted land cover classes.
Table 4.
Deforestation matrix from 2013 to 2050 (unit: hectares).
3.3. Model Validation
Model validation was carried out using validation module in LCM in TerrSet software. In this section, validation is calculated using 3 classes as defined in Table 5. The result is very similar to the ground truth images which indicates the model’s capability in land cover changes prediction, whereas its success in change prediction is 91.89%.
Table 5.
Model validation.
3.4. Carbon Storage and Sequestration in the Central Zagros Region
3.4.1. Current/Future Stored Carbon (Mg)
In this study, land cover map in 2013 is defined as the current land cover map; therefore, current carbon is a fixed value.
3.4.2. Sequestered Carbon (Mg)
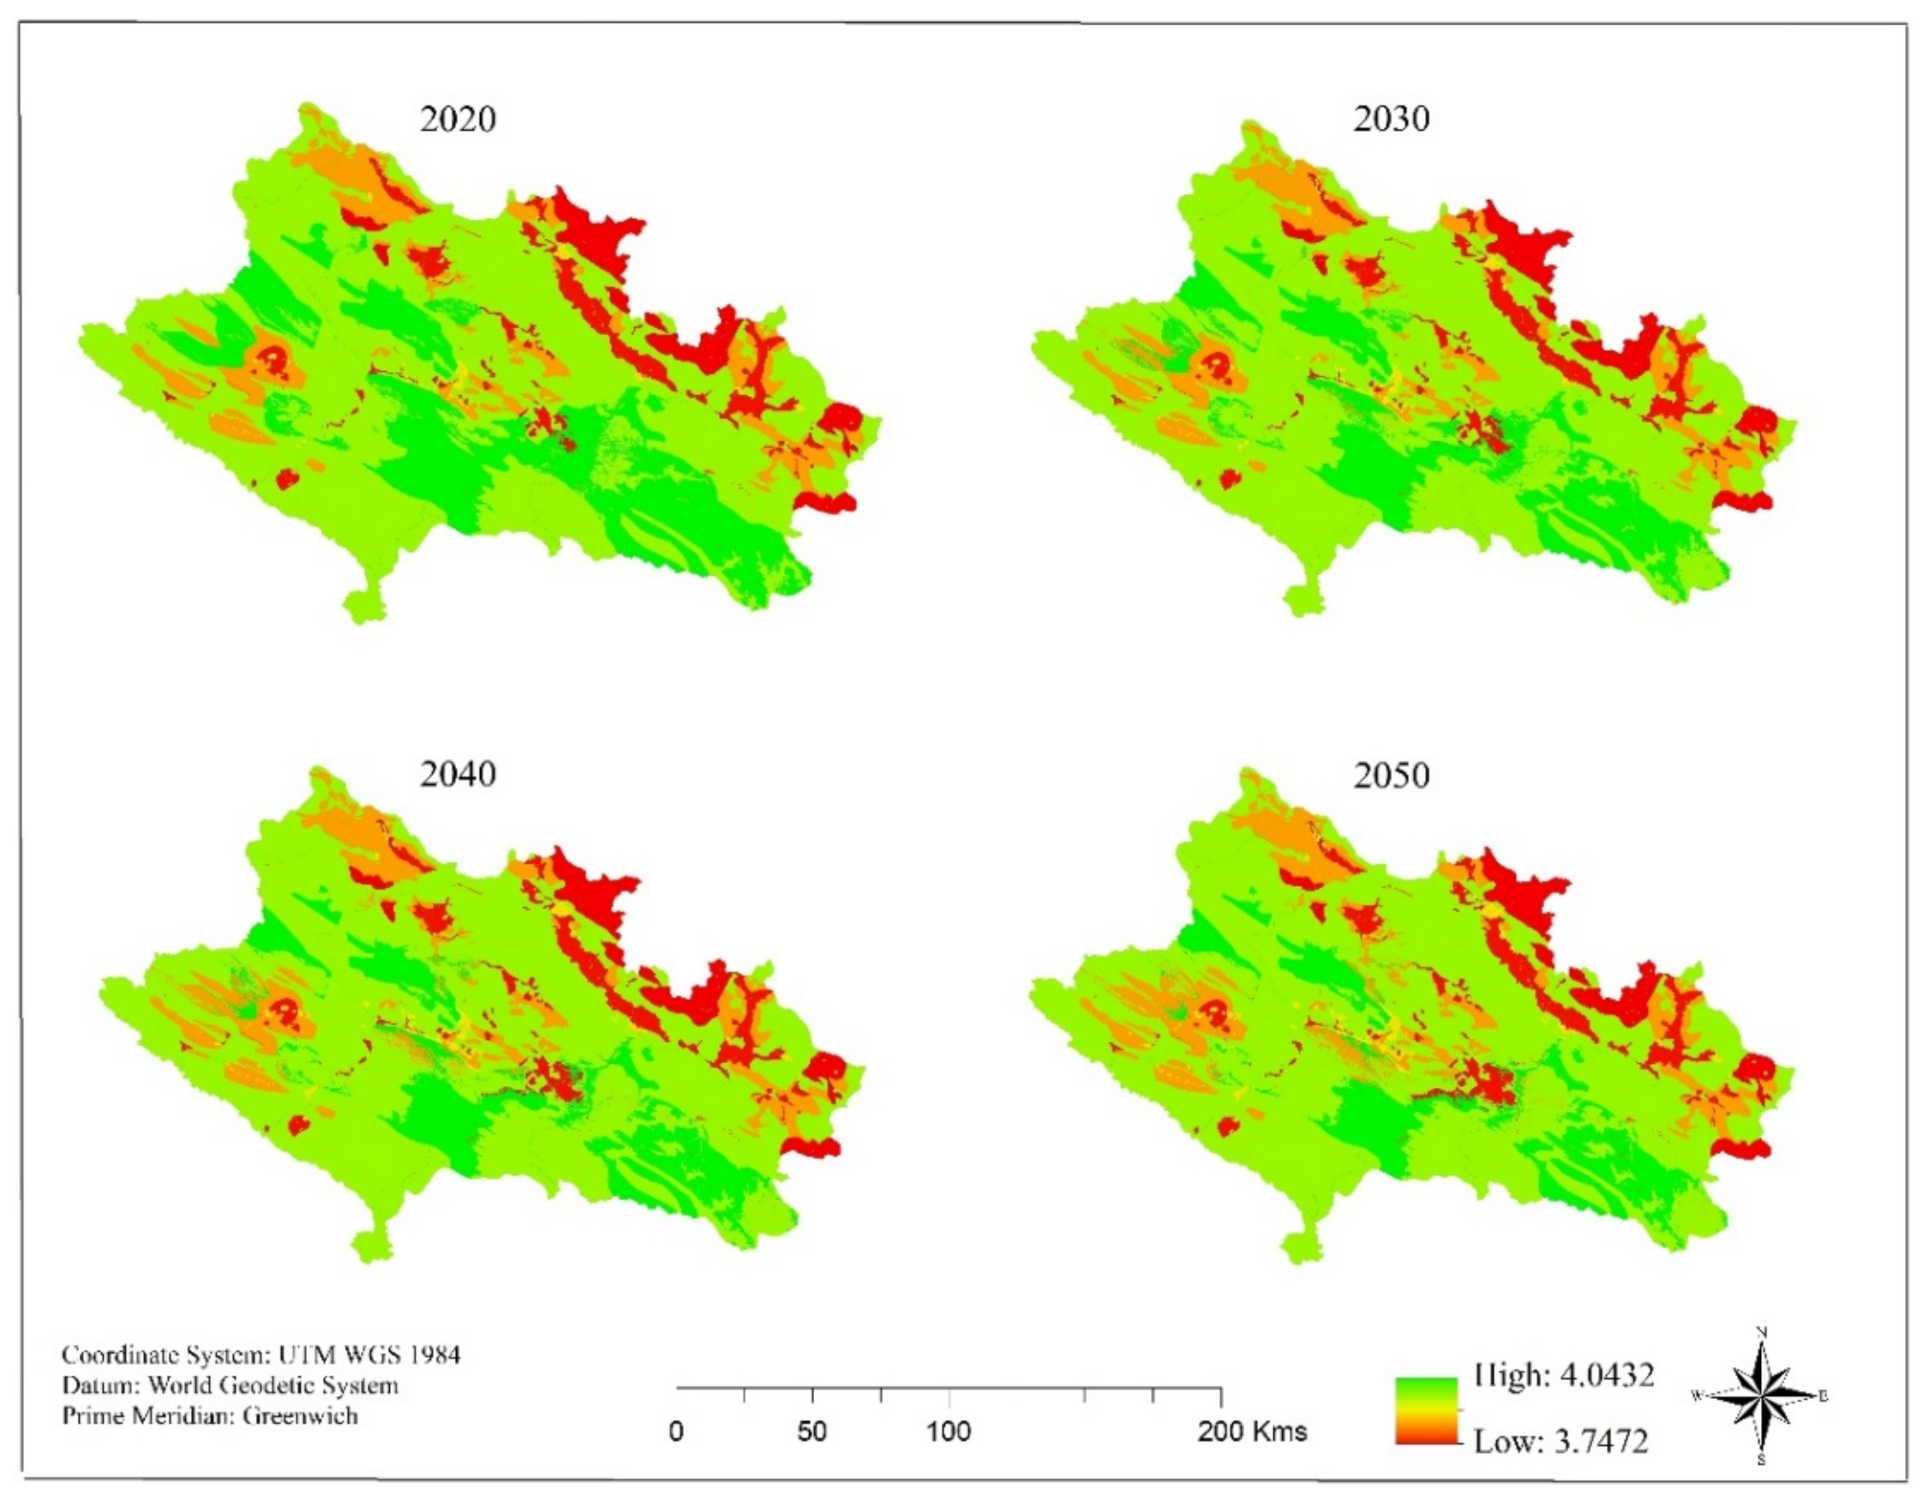
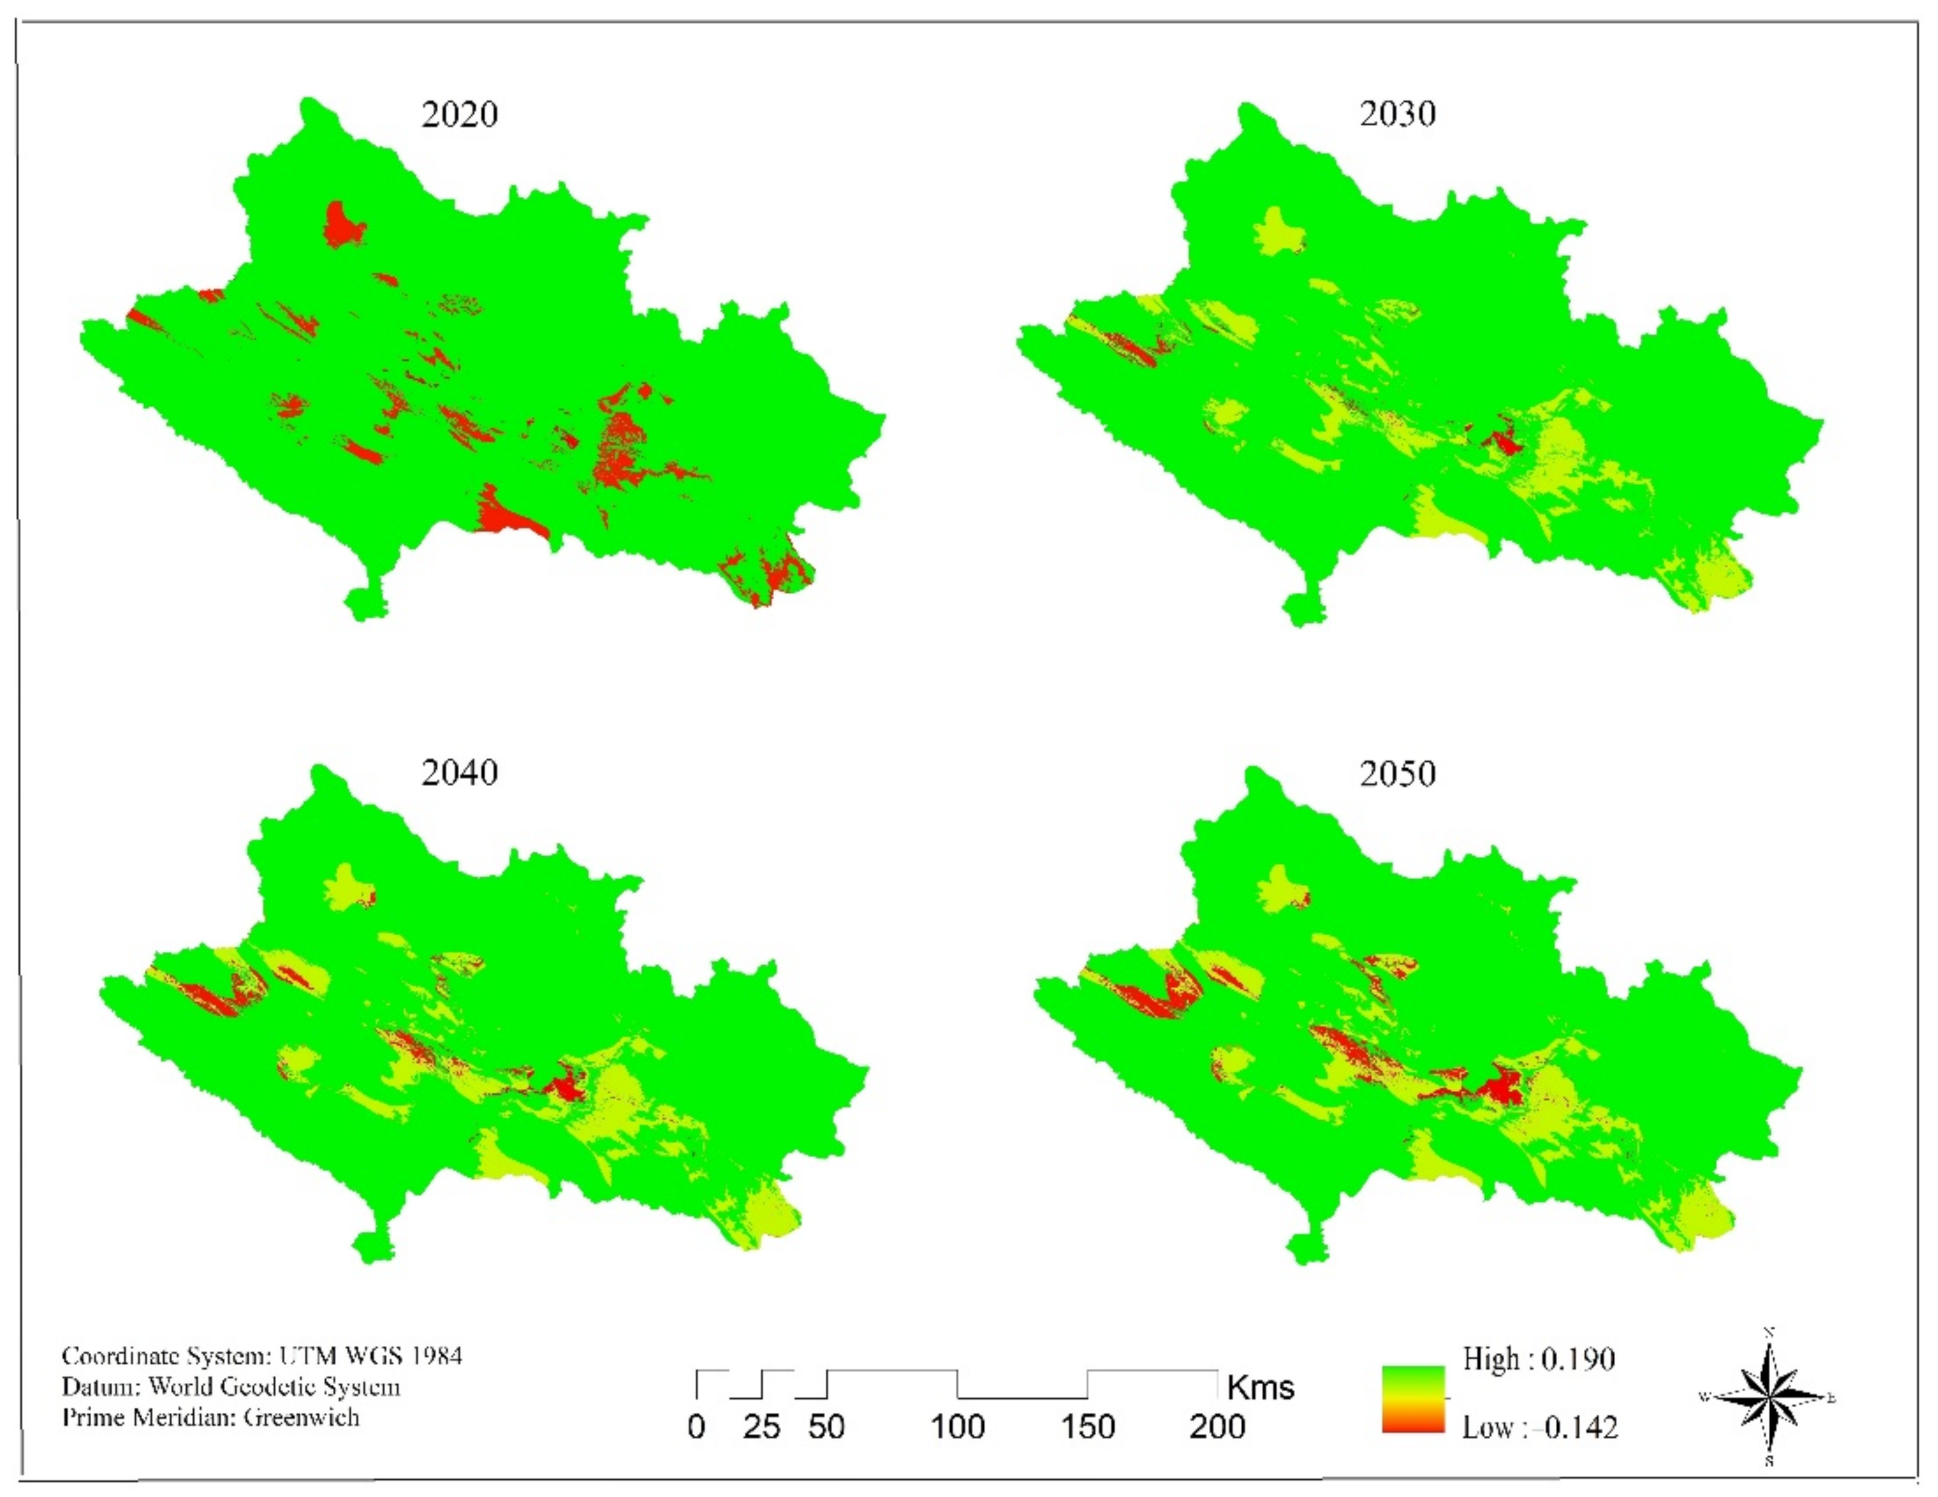
As shown in Figure 8 and Figure 9, the most hotspots of carbon loss occur in the forests because of human influences on natural areas and the conversion of Zagros forests to human made land covers. On the other hand, the amount of sequestered carbon in human disturbances as roads, residential areas, bare lands and cultivated lands is decreasing. As shown in Table 6, from 2013–2020 more than 157,000 Mg carbon will be lost, while based on the prediction results between 2020 to 2030 more than 326,000 Mg carbon will be released. From 2020 to 2030, the amount of carbon loss will be doubled, and this shows the severity of landscape degradation and the pressure of human activities on landscape. From 2030 to 2040 about 465,000 Mg of sequestered carbon will be lost which shows more than 70% growth of carbon relation. At last, between 2040 to 2050 about 565,000 Mg of sequestered carbon will be lost, and this is more than 80% growth of carbon emission.
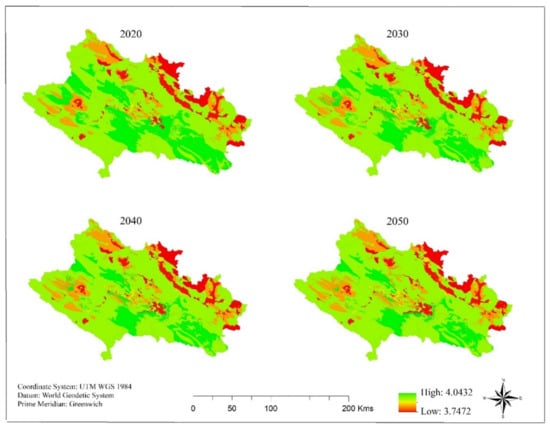
Figure 8.
Predicted values of stored Carbon.
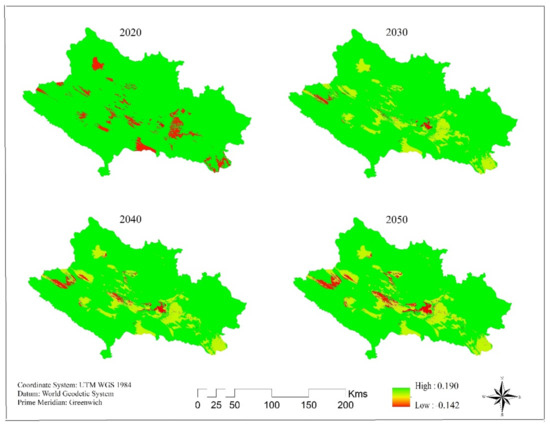
Figure 9.
Predicted values of sequestered carbon.
Table 6.
The results of carbon density change prediction.
3.4.3. Value of Currently Stored Carbon
In this study, we used US$43 as the price of carbon per metric ton [22].
3.4.4. Total Value of Sequestered Carbon
As shown in Table 6, the economic compensation of land cover changes in carbon sequestration from 2013 to 2020 is more than US$1.9 million, while in 2020–2030 more than US$3 million and in 2030–2040 more than US$3.3 million and in 2040–2050 more than US$3.2 million, which shows a great economic compensation due to the relation of sequestered carbon in the central Zagros region.
As shown in Figure 8 and Figure 9, the comparison of land cover maps with the hotspots of carbon storage and sequestration show that the most carbon storage and sequestration will occur on forests and rangelands while human made land covers such as cultivated lands, residential areas, transportation network have occupied the most carbon loss.
3.5. The Relation of Land Cover Change with Carbon Storage and Sequestration
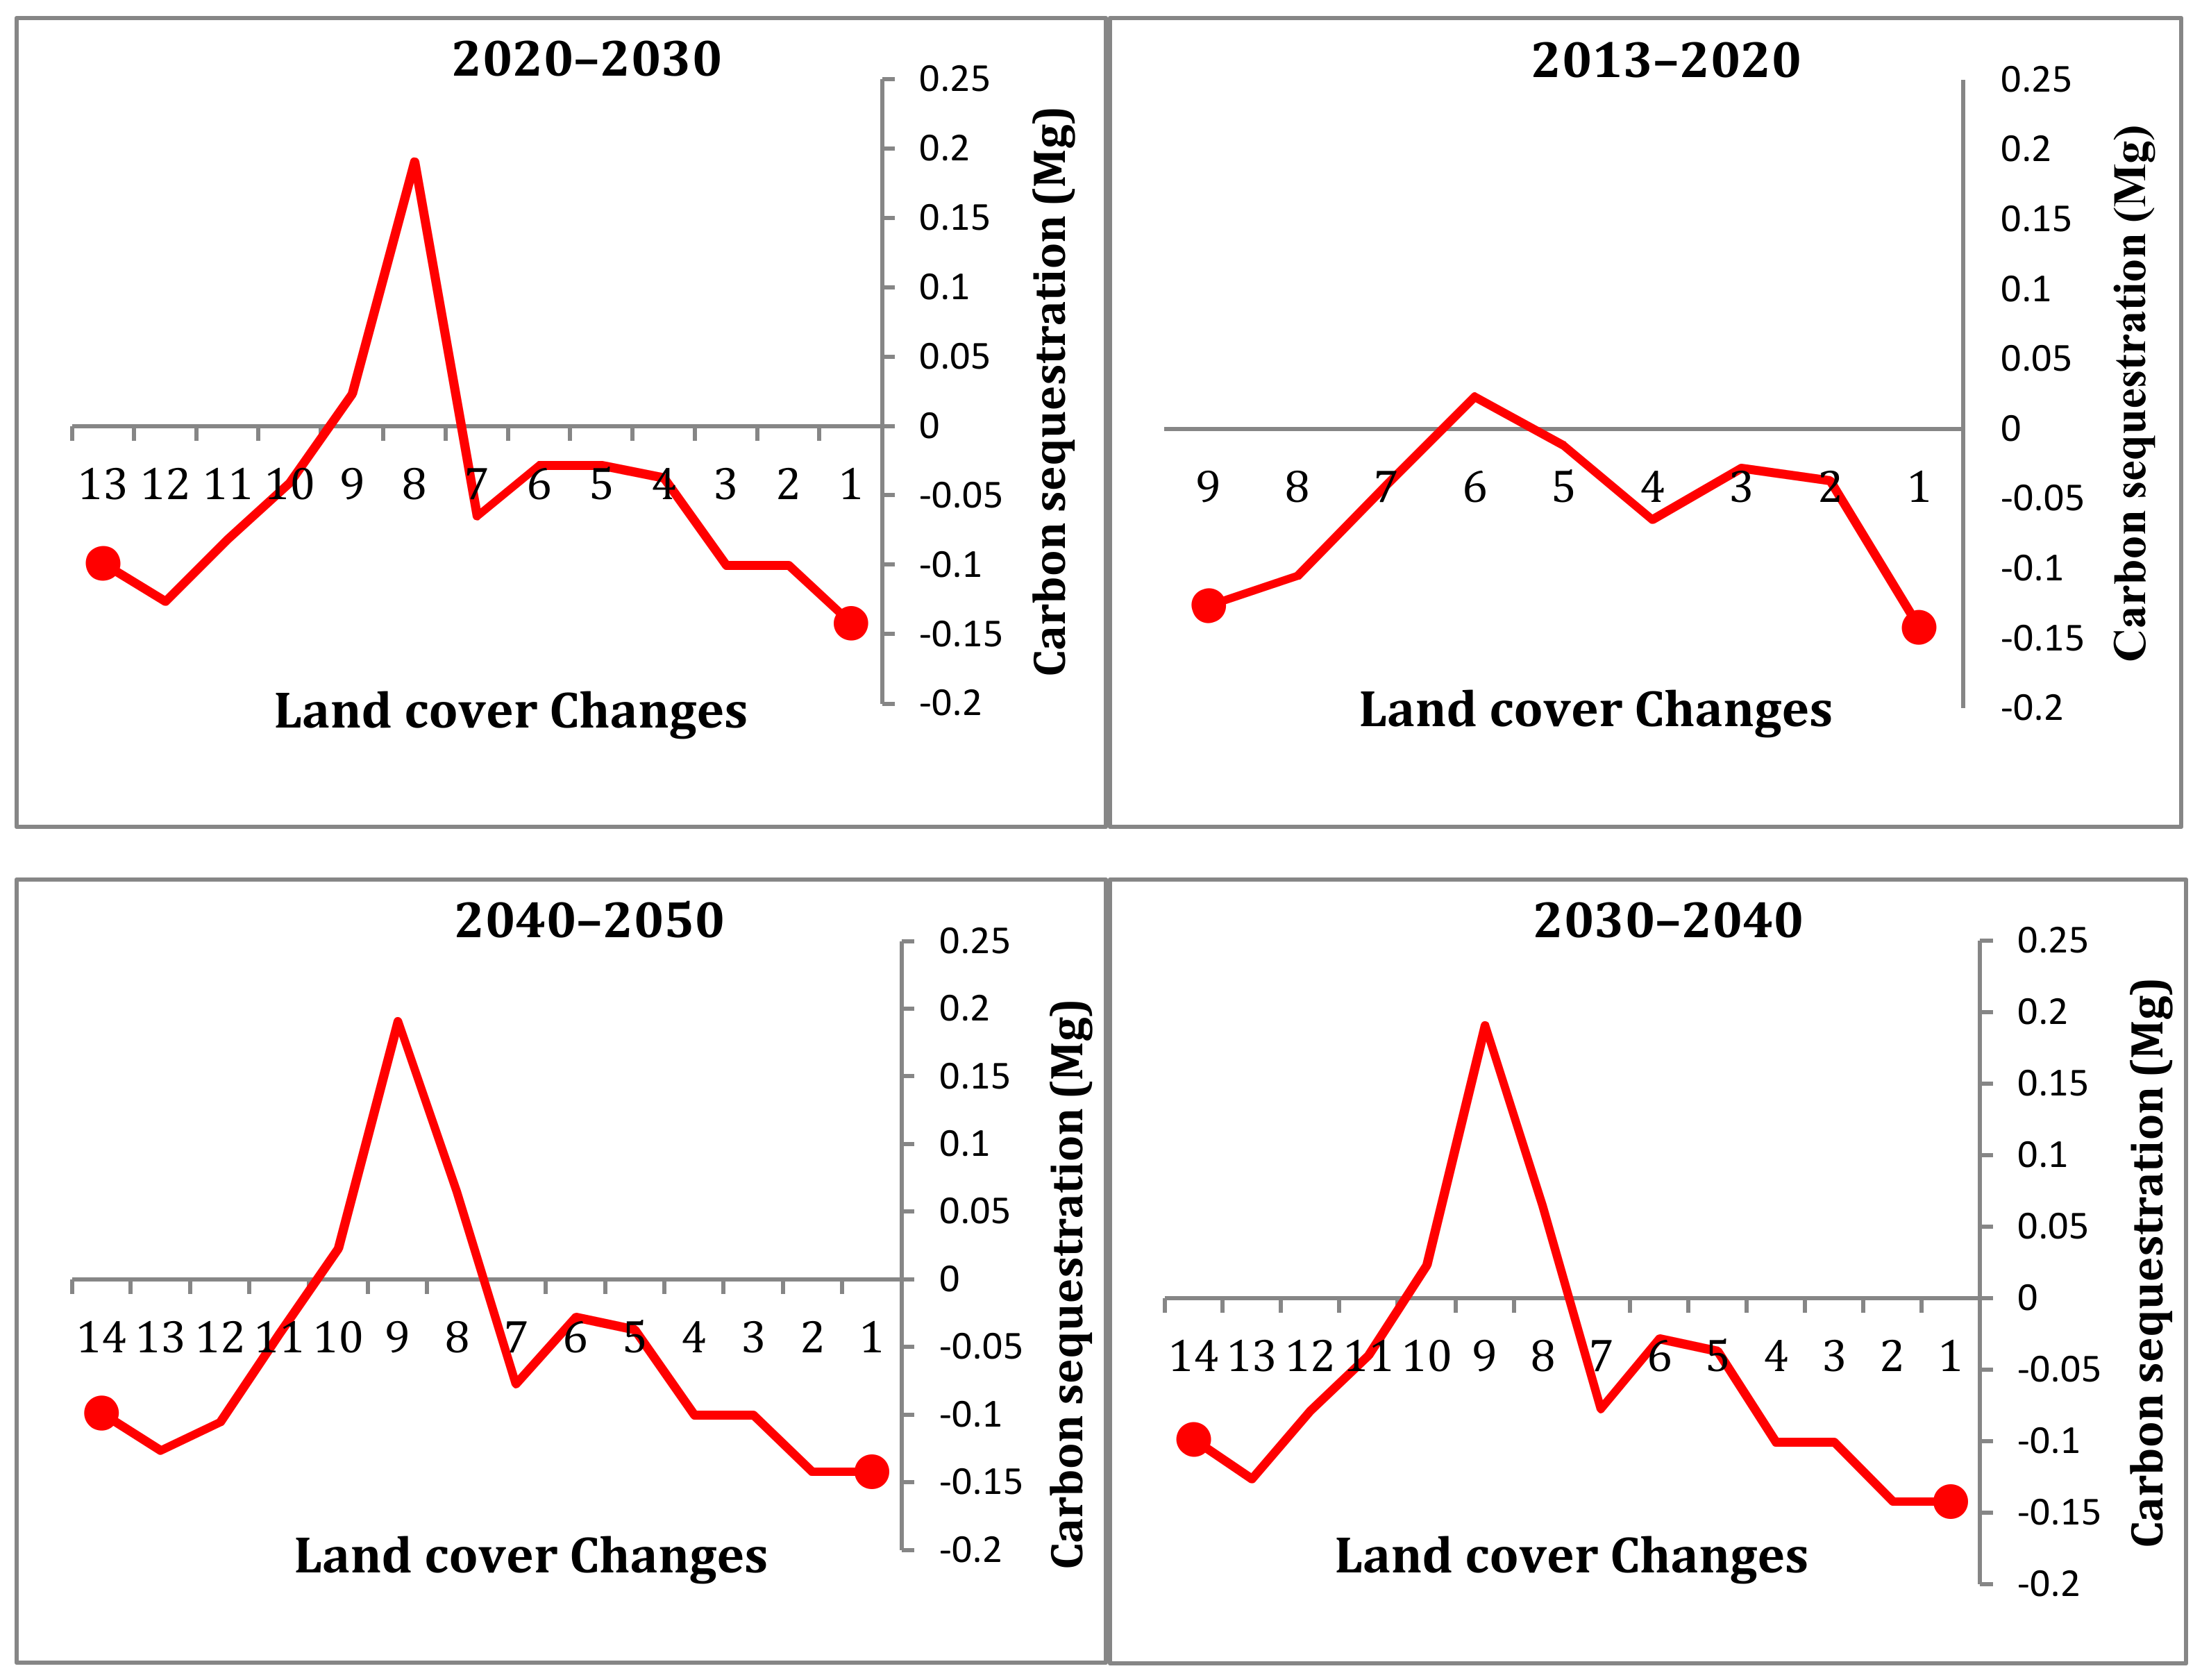
Figure 10 shows the relation of land cover changes with carbon sequestration. To derive these charts in each time period from 2013 to 2050, a change map is produced and its relation with carbon sequestration is extracted. In each chart, major changes are shown. Based on Figure 10, each change is shown with a unique value. For example, conversion of forest to irrigated farming has occupied negative values, which represents carbon emission. Also, conversion of rangeland to irrigated farming is shown by negative values which means carbon emission to atmosphere. Moreover, conversion of forest and rangeland to dry farming has a direct relation with carbon emission. There is an important note that in all periods conversion of forest to rangeland leads to carbon emission which represents importance of forest cover in comparison to rangeland in carbon sequestration. Also, conversion of forest to residential areas leads to carbon emission, so that forests have occupied the most values of carbon sequestration while conversion of forests to human made land covers is the main cause of carbon emission.

Figure 10.
The relation of land cover changes with carbon sequestration. (Land cover change classes: 1: Forest to irrigated farming, 2: Range to irrigated farming, 3: Forest to dry farming, 4: Range to dry farming, 5: Forest to Range, 6: Forest to Water, 7: Forest to Residential, 8: irrigated farming to Residential, 9: Scattered dry farming to Residential, 10: Dry Farming to Residential, 11: Range to Residential, 12: Water to Residential, 13: Forest to Bare land and 14: Forest to Transportation).
4. Discussion
Central Zagros region as a strategic environmental zone of Iran during last decade experienced rapid land cover change while at the beginning of study period about half of study area was covered by Zagros forests while human disturbances caused severe deforestation in this region that affects ecosystem services. The main forces of land cover changes consist of overgrazing, timber harvest, cut of trees, fire and human-made land cover development such as residential areas, cultivated lands [14,25,26] and roads, which are also evident in the results of this study. Residential areas development is a key issue in land cover change [27], because most of the settlements at first have occurred in the adjacent of suitable lands for cultivation. When the residential areas grow, these suitable lands will be converted to settlement and in order to safeguard food requirement, the surrounding lands will be converted to cultivated lands. On the other hand, most of these lands have a poor fertilization and after a short time, cultivation in these lands won’t be profitable, and finally these destroyed lands will be released and its result is bare land or a poor rangeland [28] that expansion of bare lands near residential areas in this study confirms it.
However, the land cover change and its impacts on ecosystem services of the central Zagros region Iran are not well addressed in existing literatures, despite its immense importance for natural resources management in this region. So that, this study was an effort to reveal the land cover history of Central Zagros region Iran since 1989 and to assess the changes in ecosystem services caused by the land cover change, using freely available Landsat data. Using remote sensing data is the most feasible and cost-effective way to assess land cover change with high spatial, spectral and temporal resolution over large areas [21]. Using a global data set of ecosystem value coefficients along with the land cover data gives a scope to eliminate the cost of ground data collection and getting quick and reliable information for similar data poor area [21].
Tolessa et al. (2017) mentioned that land cover change is a major driver of ecosystem services changes. Carbon storage and sequestration as a key ecosystem service having a direct relation with land cover/cover. Based on results of this study, carbon storage and sequestration is decreasing in land cover classes during study period due to a high rate of transition from natural land covers to human-made as a result of human influences [10]; while the conversion of forests to rangeland causes the most carbon loss in this land cover class because of large area; this can be a good comparison between forests and rangeland which shows the capability of forests in carbon sequestration versus rangelands because of the enlarged area coverage, more density of plant cover and bigger assigned coefficients value therefore, a decrease in the values of this component of ecosystem prevents a balanced flow of landscape ecosystem services [29]. Generally, transition from natural land covers, especially forests to human made land covers such as cultivated lands, bare land, transportation network, residential areas or natural landcovers such as rangeland causes carbon loss. On the other hand, the conversion of scattered dry farming to residential areas will cause carbon storage because the amount of stored carbon in lands covered by scattered dry farming is so low while in a residential area due to the plantation of green areas such as trees, shrubs, etc., the amount of stored carbon in comparison to scattered dry farming is more. The amount of carbon storage and sequestration as an ecosystem service of central Zagros region is extremely decreased because of forest degradation and the expansion of human made land covers, which emphasizes other findings elsewhere [29,30,31,32].
Primary reason for the increase in carbon emission, is a rapid and severe deforestation in Central Zagros region, which leads to a high commercial compensation in this region. Total sequestered carbon is constantly decreasing because of human disturbances which will cause ecosystem services loss and at last human health will be affected. Also, impact on the net ecosystem service values caused by the large change in total value of sequestered carbon shows that human activities in study area impose a high economic damage. Forest has large contribution on total value of ES despite large change in area, because the forest land provides higher amount of carbon storage and sequestration [21].
One of the limitations of this study is related to ESM model that lies in this hypothesis that ESM model does not consider changes due to the self-purification and self-regulation power of ecosystems over time and considers any changes in carbon storage due to sudden changes in land cover. Accordingly, if there is no change in land cover during the study period, the net carbon sequestration rate will be zero. To resolve this limitation, we have used long time period land cover data to prevent the effects of abrupt changes in land cover. Another limitation of this study is the lack of updated carbon data in the study area to be used in estimations.
5. Conclusions
In this paper, using Landsat satellite images, land cover maps were produced and used as the inputs of LCM. Land cover change prediction was carried out using Markov Chain and Multilayer Perceptron Neural network based on two sub-models: (1) Deforestation, (2) Residential development; then land cover change prediction was carried out for 2020, 2030, 2040 and 2050. Due to the lack of updated carbon data, we used IPCC data to extract carbon data on four carbon pools as aboveground, belowground, soil organic matter and dead organic matter. The predicted land cover maps and carbon data were used as the inputs of ESM in Carbon storage and sequestration tool. The results show that Zagros forests have occupied the most land cover changes due to human disturbances which has led to the reduction of carbon storage and sequestration. This study simulates the results of human activities in the central Zagros region and its consequences which will lead to severe deforestation and at last the reduction of ecosystem services especially storage and the sequestration of carbon. The results can be used by environmental planners to improve and protect natural land covers, especially forests to protect the ecosystem services and their continuity.
Author Contributions
M.J., F.H., M.G.: Methodology, formal analysis, writing—original draft, data curation; M.G., B.P.: Conceptualization, supervision, writing—review and editing; B.P., K.N.A.M. and H.-J.P.: writing—review and editing; funding: B.P. and K.N.A.M. All authors have read and agreed to the published version of the manuscript.
Funding
The study is supported by the Centre for Advanced Modelling and Geospatial Information Systems (CAMGIS), University of Technology Sydney. This research was also funded by University Kebangsan Malaysia, DANA IMPAK PERDANA, with grant no: DIP-2021-006.
Data Availability Statement
Data sharing is not applicable to this article as no new data were created or analyzed in this study.
Acknowledgments
The authors extend their appreciation for the support provided by the authorities of Tarbiat Modares University (T.M.U.) and Isfahan University of Technology (I.U.T) in Iran.
Conflicts of Interest
The authors declare no conflict of interest.
References
- Xu, J.H.; Ai, N.S.; Chen, Y. Qualitative analysis and fractal modelling on the mosaic structure of landscape in the central area of Shanghai metropolis. J. Geogr. Sci. 2003, 13, 199–206. [Google Scholar]
- Costanza, R.; De Groot, R.; Sutton, P.; Van der Ploeg, S.; Anderson, S.J.; Kubiszewski, I.; Farber, S.; Turner, R.K. Changes in the global value of ecosystem services. Glob. Environ. Change 2014, 26, 152–158. [Google Scholar] [CrossRef]
- Millennium Ecosystem Assessment (MA). Ecosystems and Human Well-Being: Synthesis; Island Press: Washington, DC, USA, 2005. [Google Scholar]
- Wang, Y.; Dai, E.; Yin, L.; Ma, L. Land cover/land cover change and the effects on ecosystem services in the Hengduan Mountain region, China. Ecosyst. Serv. 2018, 34, 55–67. [Google Scholar] [CrossRef]
- Xu, Z.; Fan, W.; Wei, H.; Zhang, P.; Ren, J.; Gao, Z.; Ulgiati, S.; Kongf, W.; Dong, X. Evaluation and simulation of the impact of land cover change on ecosystem services based on a carbon flow model: A case study of the Manas River Basin of Xinjiang, China. Sci. Total Environ. 2019, 652, 117–133. [Google Scholar] [CrossRef] [PubMed]
- IPCC (International Panel on Climate Change). Guidelines for National Greenhouse Gas Inventories. AFOLU (Agriculture, Forestry and Other Land Cover). 2006. Available online: http://www.ipcc-nggip.iges.or.jp/public/2006gl/vol4.html (accessed on 10 March 2022).
- Lal, R. Soil carbon sequestration impacts on global climate change and food security. Science 2004, 304, 1623–1627. [Google Scholar] [CrossRef] [PubMed] [Green Version]
- Stern, N. The Economics of Climate Change: The Stern Review; Cambridge University Press: Cambridge, UK, 2007. [Google Scholar]
- Tol, R.S.J. The economic effects of climate change. J. Econ. Perspect. 2009, 23, 29–51. [Google Scholar] [CrossRef] [Green Version]
- Arunyawat, S.; Rajendra, P.S. Assessing Land cover Change and Its Impact on Ecosystem Services in Northern Thailand. Sustainability 2016, 8, 768. [Google Scholar] [CrossRef] [Green Version]
- Winkler, K.; Fuchs, R.; Rounsevell, M.; Herold, M. Global land use changes are four times greater than previously estimated. Nat. Commun. 2021, 12, 2501. [Google Scholar] [CrossRef]
- Pielke, R.A.; Pitman, A.; Niyogi, D.; Mahmood, R.; McAlpine, C.; Hossain, F.; Glodewijk, K.K.; Nair, U.; Betts, R.; Fall, S.; et al. Land cover/land cover changes and climate: Modelling analysis and observational evidence. J. Clim. Change 2011, 2, 828–850. [Google Scholar]
- Japelaghi, M.; Gholamalifard, M.; Shayesteh, K. Spatio-temporal analysis and prediction of landscape patterns and change processes in the Central Zagros region, Iran. RSASE 2019, 15, 100244. [Google Scholar] [CrossRef]
- Sun, J.; Yang, J.; Zhang, C.; Yun, W.; Qu, J. Automatic remotely sensed image classification in a grid environment based on the maximum likelihood method. Math. Comput. Model. 2013, 58, 573–581. [Google Scholar] [CrossRef]
- Hagner, O.; Reese, H. A method for calibrated maximum likelihood classification of forest types. Remote Sens. Environ. 2007, 110, 438–444. [Google Scholar] [CrossRef]
- Ahmad, A. Analysis of maximum likelihood classification on multispectral Data. Int. J. Appl. Math. Sci. 2012, 6, 6425–6436. [Google Scholar]
- Campbell, J.B. Introduction to Remote Sensing; Taylor & Francis: London, UK, 2002; pp. 397–399. [Google Scholar]
- Fuller, R.; Groom, G.; Jones, A. The land cover map of Great Britain: An automated classification of Landsat Thematic Mapper data. Photogramm. Eng. Remote Sens. 1994, 60, 553–562. [Google Scholar]
- Cramer, H. Mathematical Methods of Statistics; Princeton University Press: Princeton, NJ, USA, 1999. [Google Scholar]
- Ahmed, B.; Ahmed, R. Modelling urban land cover growth dynamics using Multi Temporal satellite images: A case study of Dhaka, Bangladesh. ISPRS 2012, 1, 3–31. [Google Scholar]
- Akber, M.A.; Rahman Khan, M.W.; Islam, M.A.; Rahman, M.M.; Rahman, M.R. Impact of land use change on ecosystem services of southwest coastal Bangladesh. J. Land Use Sci. 2018, 13, 238–250. [Google Scholar] [CrossRef]
- Eastman, J.R. Chapter Nine: Ecosystem Services Modeler. In TerrSet Manual; Clarklabs: Worcester, MA, USA, 2015; pp. 249–252. [Google Scholar]
- Penman, J.; Gytarsky, M.; Hiraishi, T.; Krug, T.; Kruger, D.; Pipatti, R.; Buendia, L.; Miwa, K. Good Practice Guidance for Land Use, Land-Use Change and Forestry, Glossary; The Institute for Global Environmental Strategies (IGES) for the IPCC: Kanagawa, Japan, 2003. [Google Scholar]
- Khalyani, A.H.; Mayer, A.L. Spatial and Temporal Deforestation Dynamics of Zagros Forests (Iran) from 1972 to 2009. Landsc. Urban Plan. 2013, 117, 1–12. [Google Scholar] [CrossRef]
- Allen, J.C.; Barnes, D.F. The causes of deforestation in developing countries. Geogr. Assoc. 1985, 75, 163–184. [Google Scholar] [CrossRef]
- Torahi, A.A. Forest mapping and change analysis, using satellite imagery in Zagros mountain, Iran. Leban. Sci. J. 2013, 14, 63–75. [Google Scholar]
- Matinfar, H.R. Change detection monitoring of Khoramabad Region (Iran) via remote sensing. Geophys. Res. Abstr. 2010, 12, 448. [Google Scholar]
- Zebardast, L.; Yavari, A.; Sadeghi, A.; Makhdoum, M. Using an effective mesh size metric in the analysis of the fragmentation of forest cover in road effect zone in the Golestan National Park. JES 2011, 37, 15–20. (In Persian) [Google Scholar]
- Tolessa, T.; Senbeta, F.; Kidane, M. The impact of land cover/land cover change on ecosystem services in the central highlands of Ethiopia. Ecosyst. Serv. 2017, 23, 47–54. [Google Scholar] [CrossRef]
- Kindu, M.; Schneider, T.; Teketay, D.; Knoke, T. Changes of ecosystem service values in response to land cover/land cover dynamics in Munessa–Shashemene landscape of the Ethiopian highlands. Sci. Total Environ. 2016, 547, 137–147. [Google Scholar] [CrossRef] [PubMed]
- Leh, M.D.K.; Matlocka, M.D.; Cummingsa, E.C.; Nalley, L.L. Quantifying and mapping multiple ecosystem services change in West Africa. Agric. Ecosyst. Environ. 2013, 165, 6–18. [Google Scholar] [CrossRef]
- Tittonell, P. Beyond CO2: Multiple Ecosystem Services from Ecologically Intensive Grazing Landscapes of South America. Front. Sustain. Food Syst. 2021, 5, 664103. [Google Scholar] [CrossRef]


Publisher’s Note: MDPI stays neutral with regard to jurisdictional claims in published maps and institutional affiliations. |
© 2022 by the authors. Licensee MDPI, Basel, Switzerland. This article is an open access article distributed under the terms and conditions of the Creative Commons Attribution (CC BY) license (https://creativecommons.org/licenses/by/4.0/).