
Carbon Storage in Biomass and Soil after Mountain Landscape Restoration: Pinus nigra and Picea abies Plantations in the Hyrcanian Region

 ,
,  ,
,  and
and 
Abstract
:1. Introduction
2. Materials and Methods
2.1. Study Area
2.2. Study Design
2.3. Tree Biomass
2.3.1. Above-Ground Biomass (AGB)
Allometric Method
FAO Method
2.3.2. Below-Ground Biomass (BGB)
2.4. Understory Biomass
2.5. Deadwood Biomas
2.6. Litter Biomass
2.7. Carbon Stock in above-Ground Biomass (AGB), below-Ground Biomass (BGB), Litter, Deadwood (DW), and Soil
2.7.1. Carbon Stock in AGB, BGB, Litter, and DW
2.7.2. Carbon Stock in Soil
2.8. Statistical Analysis
3. Results
4. Discussion
5. Conclusions
Author Contributions
Funding
Data Availability Statement
Acknowledgments
Conflicts of Interest
References
- IPCC. IPCC expert meeting on climate change, food, and agriculture. In Land Use, Land-Use Change, and Forestry; Special Report of the IPCC; Intergovernmental Panel on Climate Change: Geneva, Switzerland, 2015; Available online: http://www.ipcc.ch/pdf/supportingmaterial/FoodEM_MeetingReport_FINAL.pdfIPCC (accessed on 1 February 2022).
- IPCC. Default biomass conversion and expansion factors. IPCC guidelines for national greenhouse gas inventories e Agriculture, Forestry and Other Land Use. In Intergovernmental Panel on Climate Change; The Institute for Global Environmental Strategies for the IPCC: Kanagawa, Japan, 2006. [Google Scholar]
- Wan, J.Z.; Wang, C.J.; Qu, H.; Liu, R.; Zhang, Z.X. Vulnerability of forest vegetation to anthropogenic climate change in China. Sci. Total Environ. 2018, 621, 1633–1641. [Google Scholar] [CrossRef]
- Sharma, C.M.; Gairola, S.; Baduni, N.P.; Ghildiyal, S.K.; Suyal, S. Variation in carbon stocks on different slope aspects in seven major types of temperate region of Garhwal Himalaya, India. J. Biosci. 2011, 36, 701–708. [Google Scholar] [CrossRef] [PubMed]
- Danquah, J.A.; Appiah, M.; Pappinen, A. The effect of African mahogany species on soil chemical properties in degraded dry semi-deciduous forest ecosystems in Ghana. Int. J. Agric. Biol. 2012, 14, 321–328. [Google Scholar]
- Dixon, R.K.; Solomon, A.M.; Brown, S.; Houghton, R.A.; Trexier, M.C.; Wisniewski, J. Carbon Pools and Flux of Global Forest Ecosystems. Science 1994, 263, 185–190. [Google Scholar] [CrossRef] [PubMed]
- Houghton, R.A. Aboveground Forest Biomass and the Global Carbon Balance. Glob. Chang. Biol. 2005, 11, 945–958. [Google Scholar] [CrossRef]
- Kramer, P.J.; Kozlowski, T.T. Physiology of Wood Plants; McGraw Hill: New York, NY, USA, 1979. [Google Scholar]
- Lamlom, S.; Savidge, R. A reassessment of carbon content in wood: Variation within and between 41 North American species. Biomass-Bioenergy 2003, 25, 381–388. [Google Scholar] [CrossRef]
- Yen, T.M. Culm height development, biomass accumulation and carbon storage in an initial growth stage for a fast-growing moso bamboo (Phyllostachy pubescens). Bot. Stud. 2016, 57, 10. [Google Scholar] [CrossRef] [PubMed] [Green Version]
- Yen, T.M.; Wang, C.T. Assessing carbon storage and carbon sequestration for natural forests, man-made forests, and bamboo forests in Taiwan. Int. J. Sustain. Dev. World Ecol. 2013, 20, 455–460. [Google Scholar] [CrossRef]
- Yosef, B.A.; Eshetu, Z.; Garedew, E.; Kassa, H. Carbon stock potentials of woodlands in north western lowlands of Ethiopia. J. Sustain. For. 2019, 38, 629–650. [Google Scholar] [CrossRef]
- FAO. Global Forest Resources Assessment How Are the World’s Forests Changing? 2nd ed.; Food and Agriculture Organization of the United Nations: Rome, Italy, 2016; pp. 1–54. [Google Scholar]
- Yen, T.M.; Huang, K.L.; Li, L.E.; Wang, C.H. Assessing carbon sequestration in plantation forests of important conifers based on the system of permanent sample plots across Taiwan. J. Sustain. For. 2020, 39, 392–406. [Google Scholar] [CrossRef]
- Vesterdal, L.; Schmidt, I.K.; Callesen, I.; Nilsson, L.O.; Gundersen, P. Carbon and nitrogen in forest floor and mineral soil under six common European tree species. For. Ecol. Manag. 2008, 255, 35–48. [Google Scholar] [CrossRef]
- Prescott, C.E.; Grayston, S.J. Tree species influence on microbial communities in litter and soil: Current knowledge and research needs. For. Ecol. Manag. 2013, 309, 19–27. [Google Scholar] [CrossRef]
- Kozlowski, T. Physiological ecology of natural regeneration of harvested and disturbed forest stands: Implications for forest management. For. Ecol. Manag. 2002, 158, 195–221. [Google Scholar] [CrossRef]
- Lal, R. Global soil erosion by water and carbon dynamics. In Soils and Globle Change; Lal, R., Kimble, J., Levine, E., Stewart, B.A., Eds.; Lewis Publishers: Boca Raton, FL, USA, 1995. [Google Scholar]
- Sundquist, E.T. The Global Carbon Dioxide Budget. Science 1993, 259, 934–941. [Google Scholar] [CrossRef]
- Jackson, R.B.; Banner, J.L.; Jobbágy, E.G.; Pockman, W.; Wall, D.H. Ecosystem carbon loss with woody plant invasion of grasslands. Nature 2002, 418, 623–626. [Google Scholar] [CrossRef]
- Zou, X.; Bashkin, M. Soil carbon accretion and earthworm recovery following revegetation in abandoned sugarcane fields. Soil Biol. Biochem. 1998, 30, 825–830. [Google Scholar] [CrossRef]
- FAO. FAO Global Forest Resources Assessment Program: Islamic Republic of Iran; Country FAO: Rome, Italy.
- Bastin, J.F.; Finegold, Y.; Garcia, C.; Mollicone, D.; Rezende, M.; Routh, D.; Zohner, C.M.; Crowther, T.W. The global tree restoration potential. Science 2019, 365, 76–79. [Google Scholar] [CrossRef]
- Clemente, A.S.; Werner, C.; Maguas, C.; Cabral, M.S.; Martins-Loucao, M.A.; Correia, O. Restoration of a Limestone Quarry: Effect of Soil Amendments on the Establishment of Native Mediterranean Sclerophyllous Shrubs. Restor. Ecol. 2004, 12, 20–28. [Google Scholar] [CrossRef]
- Kou, M.; Garcia-Fayos, P.; Hu, S.; Jiao, J. The effect of Robinia pseudoacacia afforestation on soil and vegetation properties in the Loess Plateau (China): A chronosequence approach. For. Ecol. Manag. 2016, 375, 146–158. [Google Scholar] [CrossRef]
- De Martonne, E. Aréisme et Indice D’aridité; Comptes Rendus de L’Academy of Science: Paris, France, 1926; pp. 1395–1398. [Google Scholar]
- Tavankar, F.; Rafie, H.; Latterini, F.; Nikooy, M.; Senfett, M.; Behjou, F.K.; Maleki, M. Growth parameters of Pinus nigra J.F. Arnold and Picea abies (L.) H. Karst. plantations and their impact on understory woody plants in above-timberline mountain areas in the north of Iran. J. For. Sci. 2018, 64, 416–426. [Google Scholar] [CrossRef]
- Lo Monaco, A.; Luziatelli, G.; Latterini, F.; Tavankar, F.; Picchio, R. Structure and Dynamics of Deadwood in Pine and Oak Stands and their Role in CO2 Sequestration in Lowland Forests of Central Italy. Forests 2020, 11, 253. [Google Scholar] [CrossRef] [Green Version]
- Lo Monaco, A.; Todaro, L.; Sarlatto, M.; Spina, R.; Calienno, L.; Picchio, R. Effect of moisture on physical parameters of timber from Turkey oak (Quercus cerris L.) coppice in Central Italy. For. Stud. China 2011, 13, 276–284. [Google Scholar] [CrossRef]
- Mac Dicken, K.G. A Guide to Monitoring Carbon Storage in Forestry and Agro forestry Projects; Forest Carbon Monitoring Program; Winrock International Institute for Agricultural Development: North Little Rock, AR, USA, 1997. [Google Scholar]
- Gao, Y.; Cheng, J.; Ma, Z.; Zhao, Y.; Su, J. Carbon storage in biomass, litter, and soil of different plantations in a semiarid temperate region of northwest China. Ann. For. Sci. 2014, 71, 427–435. [Google Scholar] [CrossRef] [Green Version]
- Behjou, F.K.; Lo Monaco, A.; Tavankar, F.; Venanzi, R.; Nikooy, M.; Mederski, P.S.; Picchio, R. Coarse Woody Debris Variability Due to Human Accessibility to Forest. Forests 2018, 9, 509. [Google Scholar] [CrossRef] [Green Version]
- Birdsey, R.A. Carbon Storage and Accumulation in United States Forest Ecosystems; General Technical Report GTR-WO-59; USDA Forest Service: Washington, DC, USA, 1992. [Google Scholar]
- Hamilton, J.G.; DeLucia, E.H.; George, K.; Naidu, S.L.; Finzi, A.; Schlesinger, W.H. Forest carbon balance under elevated CO2. Oecologia 2002, 131, 250–260. [Google Scholar] [CrossRef]
- Walkley, A.; Black, I.A. An examination of the Degtjareff method for determining soil organic matter, and a proposed modification of the chromic acid titration method. Soil Sci. 1934, 37, 29–38. [Google Scholar] [CrossRef]
- Peichl, M.; Arain, M.A. Above- and belowground ecosystem biomass and carbon pools in an age-sequence of temperate pine plantation forests. Agric. For. Meteorol. 2006, 140, 51–63. [Google Scholar] [CrossRef]
- Taylor, A.R.; Wang, J.R.; Chen, H.Y. Carbon storage in a chronosequence of red spruce (Picea rubens) forests in central Nova Scotia, Canada. Can. J. For. Res. 2007, 37, 2260–2269. [Google Scholar] [CrossRef]
- Justine, M.F.; Yang, W.; Wu, F.; Tan, B.; Khan, M.N.; Zhao, Y. Biomass Stock and Carbon Sequestration in a Chronosequence of Pinus massoniana Plantations in the Upper Reaches of the Yangtze River. Forests 2015, 6, 3665–3682. [Google Scholar] [CrossRef] [Green Version]
- Paul, E.A.; Clark, F.E. Soil Microbiology and Biochemistry, 2nd ed.; Academic Press: San Diego, CA, USA, 1996. [Google Scholar]
- Harrison, K.G.; Broecker, W.S.; Bonani, G. The Effect of Changing Land Use on Soil Radiocarbon. Science 1993, 262, 725–726. [Google Scholar] [CrossRef]
- Picchio, R.; Mercurio, R.; Venanzi, R.; Gratani, L.; Giallonardo, T.; Lo Monaco, A.; Frattaroli, A.R. Strip Clear-Cutting Application and Logging Typologies for Renaturalization of Pine Afforestation—A Case Study. Forests 2018, 9, 366. [Google Scholar] [CrossRef] [Green Version]
- Guedes, B.S.; Olsson, B.A.; Egnell, G.; Sitoe, A.A.; Karltun, E. Plantations of Pinus and Eucalyptus replacing degraded mountain miombo woodlands in Mozambique significantly increase carbon sequestration. Glob. Ecol. Conserv. 2018, 14, 00401. [Google Scholar] [CrossRef]
- Chen, L.C.; Liang, M.J.; Wang, S.L. Carbon stock density in planted versus natural Pinus massoniana forests in sub-tropical China. Ann. For. Sci. 2016, 73, 461–472. [Google Scholar] [CrossRef] [Green Version]
- Sharma, K.P.; Bhatta, S.P.; Khatri, G.B.; Pajiyar, A.; Joshi, D.K. Estimation of Carbon Stock in the Chir Pine (Pinus roxburghii Sarg.) Plantation Forest of Kathmandu Valley, Central Nepal. J. For. Environ. Sci. 2020, 36, 37–46. [Google Scholar] [CrossRef]
- Soto-Cervantes, J.A.; Carrillo-Parra, A.; Rodríguez-Laguna, R.; Corral-Rivas, J.J.; Pompa-García, M.; Dominguez-Calleros, P.A. Survival, growth and carbon content in a forest plantation established after a clear-cutting in Durango, Mexico. PeerJ 2020, 8, e9506. [Google Scholar] [CrossRef]
- Zhang, X.; Zhang, X.; Han, H.; Shi, Z.; Yang, X. Biomass Accumulation and Carbon Sequestration in an Age-Sequence of Mongolian Pine Plantations in Horqin Sandy Land, China. Forests 2019, 10, 197. [Google Scholar] [CrossRef] [Green Version]
- Henderson, G.S. Soil Organic Matter: A Link between Forest Management and Productivity. In Carbon Forms and Functions in Forest Soils; Soil Science Society of America: Madison, WI, USA, 2006; pp. 419–435. [Google Scholar]
- Noormets, A.; McNulty, S.G.; Domec, J.; Gavazzi, M.; Sun, G.; King, J.S. The role of harvest residue in rotation cycle carbon balance in loblolly pine plantations. Respiration partitioning approach. Glob. Chang. Biol. 2012, 18, 3186–3201. [Google Scholar] [CrossRef]
- He, J.; Dai, Q.; Xu, F.; Peng, X.; Yan, Y. Variability in Carbon Stocks across a Chronosequence of Masson Pine Plantations and the Trade-Off between Plant and Soil Systems. Forests 2021, 12, 1342. [Google Scholar] [CrossRef]


| Site Properties | Site I | Site II | Site III |
|---|---|---|---|
| Altitude (m above sea level) | 1800 | 1750 | 1700 |
| Land use | Plantation | Plantation | Control |
| Vegetation type | Forest | Forest | Grassland |
| Tree species | Pinus nigra | Picea abies | Scattered Quercus macranthera and Carpinus orientalis |
| Soil type | Clay loam | Clay loam | Clay loam |
| Area (ha) | 20 | 20 | 20 |
| Slope (%) | 22–25 | 20–24 | 23–27 |
| Parameter | Pinus nigra Plantation | Picea abies Plantation | Control |
|---|---|---|---|
| Tree density (stem ha−1) | 307.1 ± 13.9 a | 233.5 ± 14.4 b | 62.4 ± 5.1 c |
| Tree DBH (cm) | 16.2 ± 2.0 a | 14.6 ± 1.9 ab | 11.1 ± 1.9 b |
| Tree height (m) | 7.4 ± 0.8 ab | 8.3 ± 0.8 a | 6.9 ± 0.5 b |
| Stand basal area (m2 ha−1) | 6.40 ± 0.61 a | 4.08 ± 0.50 b | 0.64 ± 0.02 c |
| Standing volume (m3 ha−1) | 27.05 ± 2.31 a | 19.45 ± 2.07 b | 2.10 ± 0.29 c |
| Fallen DW volume (m3 ha−1) | 1.47 ± 0.15 a | 0.88 ± 0.05 b | 0.19 ± 0.04 c |
| Standing DW (m3 ha−1) | 0.71 ± 0.06 a | 0.58 ± 0.06 b | 0.10 ± 0.02 c |
| Total DW volume (m3 ha−1) | 2.18 ± 0.20 a | 1.46 ± 0.21 b | 0.29 ± 0.05 c |
| Tree Species | DC0-Live | DC1 | DC2 | DC3 | DC4 | DC5 |
|---|---|---|---|---|---|---|
| P. nigra | 0.55 ± 0.04 b | 0.40 ± 0.03 b | 0.35 ± 0.03 b | 0.31 ± 0.03 b | 0.26 ± 0.03 b | 0.17 ± 0.03 a |
| P. abies | 0.51 ± 0.03 b | 0.37 ± 0.03 b | 0.33 ± 0.03 b | 0.29 ± 0.03 b | 0.25 ± 0.03 b | 0.17 ± 0.03 a |
| Q. macranthera | 0.76 ± 0.06 a | 0.63 ± 0.06 a | 0.56 ± 0.05 a | 0.45 ± 0.05 a | 0.39 ± 0.04 a | 0.20 ± 0.04 a |
| C. orientalis | 0.72 ± 0.06 a | 0.60 ± 0.05 a | 0.53 ± 0.05 a | 0.44 ± 0.05 a | 0.36 ± 0.04 a | 0.19 ± 0.04 a |
| Tree Component | Allometric Equations | R2 | SEE | F-Value |
|---|---|---|---|---|
| P. nigra | ||||
| Leaf | B = 0.417(D2H)0.257 | 0.8021 | 0.07 | 64.86 ** |
| Branch | B = 0.766(D2H)0.501 | 0.8124 | 0.09 | 60.62 ** |
| Trunk | B = 8.469(D2H)0.231 | 0.8188 | 0.06 | 76.82 ** |
| Root | B = 3.257(D2H)0.134 | 0.8958 | 0.02 | 146.16 ** |
| Whole tree | B = 16.265(D2H)0.234 | 0.8762 | 0.05 | 113.25 ** |
| P. abies | ||||
| Leaf | B = 0.508(D2H)0.230 | 0.8190 | 0.04 | 72.37 ** |
| Branch | B = 7.808(D2H)0.236 | 0.8523 | 0.04 | 92.34 ** |
| Trunk | B = 5.087(D2H)0.296 | 0.8201 | 0.04 | 68.39 ** |
| Root | B = 0.819(D2H)0.318 | 0.8342 | 0.05 | 70.44 ** |
| Whole tree | B = 12.018(D2H)0.288 | 0.8173 | 0.04 | 71.58 ** |
| Q. macranthera | ||||
| Leaf | B = 0.076(D2H)0.483 | 0.8326 | 0.06 | 84.57 ** |
| Branch | B = 4.072(D2H)0.203 | 0.7751 | 0.03 | 51.71 ** |
| Trunk | B = 8.778(D2H)0.156 | 0.7298 | 0.03 | 43.21 ** |
| Root | B = 1.184(D2H)0.187 | 0.7456 | 0.04 | 41.02 ** |
| Whole tree | B = 12.059(D2H)0.201 | 0.8262 | 0.03 | 80.84 ** |
| C. orientalis | ||||
| Leaf | B = 0.039(D2H)0.574 | 0.7472 | 0.05 | 74.39 ** |
| Branch | B = 2.946(D2H)0.246 | 0.7356 | 0.04 | 52.50 ** |
| Trunk | B = 10.608(D2H)0.126 | 0.6116 | 0.03 | 51.93 ** |
| Root | B = 0.849(D2H)0.226 | 0.7959 | 0.03 | 44.67 ** |
| Whole tree | B = 12.100(D2H)0.197 | 0.7740 | 0.03 | 76.50 ** |
| Tree Component | Pinus nigra | Picea abies | Quercus macranthera | Carpinus orientalis |
|---|---|---|---|---|
| Leaf | 3.00 ± 0.35 (3.1) a | 2.80 ± 0.27 (3.1) a | 2.02 ± 0.25 (5.2) b | 1.80 ± 0.20 (5.5) b |
| Branch | 37.50 ± 2.38 (38.8) a | 36.04 ± 2.10 (39.4) a | 12.40 ± 1.45 (32.2) b | 11.75 ± 1.22 (35.7) b |
| Trunk | 40.09 ± 2.50 (41.4) a | 37.18 ± 2.71 (40.7) a | 17.65 ± 2.01 (45.9) b | 13.90 ± 2.17 (42.2) c |
| Root | 16.12 ± 0.85 (16.7) a | 15.40 ± 0.82 (16.8) a | 6.41 ± 0.42 (16.7) b | 5.49 ± 0.40 (16.7) b |
| Whole tree | 96.71 ± 9.20 a | 91.42 ± 9.07 a | 38.48 ± 4.10 b | 32.94 ± 3.75 c |
| Biomass Type | Pinus nigra Plantation | Picea abies Plantation | Control |
|---|---|---|---|
| Tree component | |||
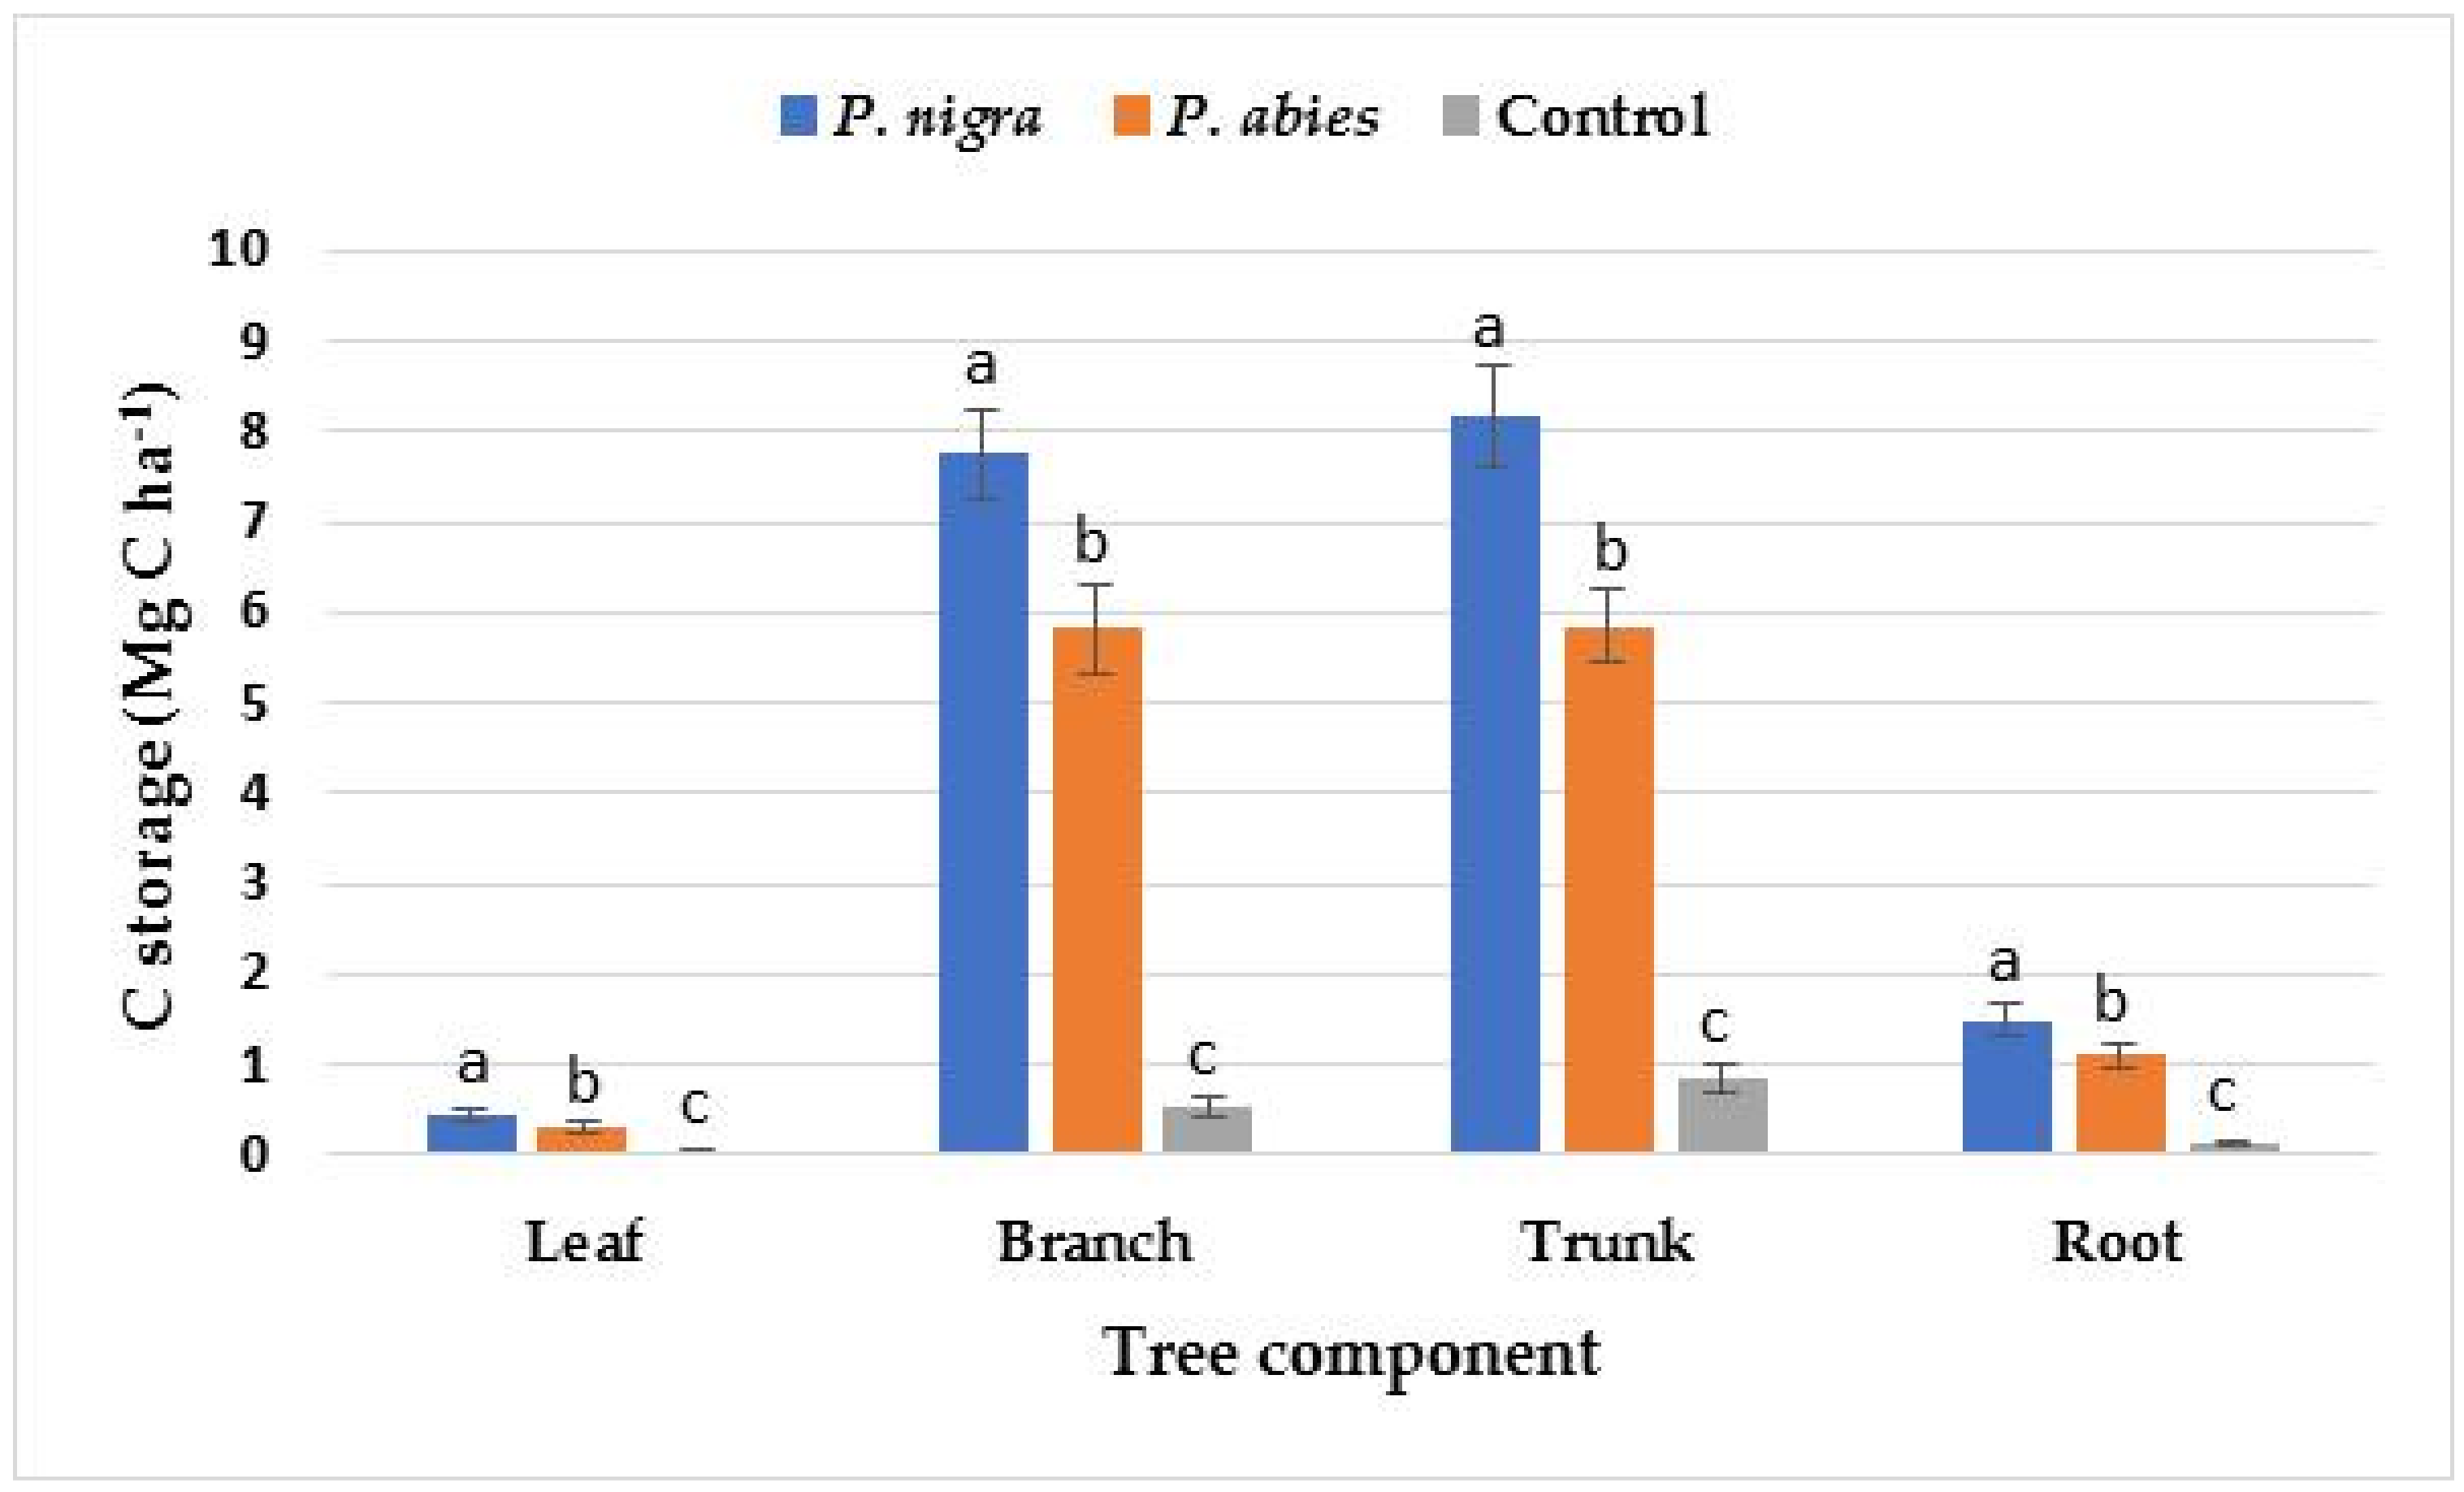
| Leaf | 0.92 ± 0.08 a | 0.65 ± 0.07 b | 0.13 ± 0.02 c |
| Branch | 14.59 ± 1.05 a | 10.98 ± 1.02 b | 1.02 ± 0.10 c |
| Trunk | 15.38 ± 1.10 a | 11.02 ± 1.60 b | 1.60 ± 0.09 c |
| Root | 2.80 ± 0.11 a | 2.08 ± 0.16 b | 0.26 ± 0.04 c |
| Shrub component | |||
| Leaf | 0.23 ± 0.04 b | 0.24 ± 0.07 b | 0.41 ± 0.05 a |
| Branch | 1.10 ± 0.07 b | 1.15 ± 0.10 b | 2.60 ± 0.10 a |
| Root | 0.44 ± 0.05 b | 0.47 ± 0.06 b | 0.98 ± 0.08 a |
| Herb component | |||
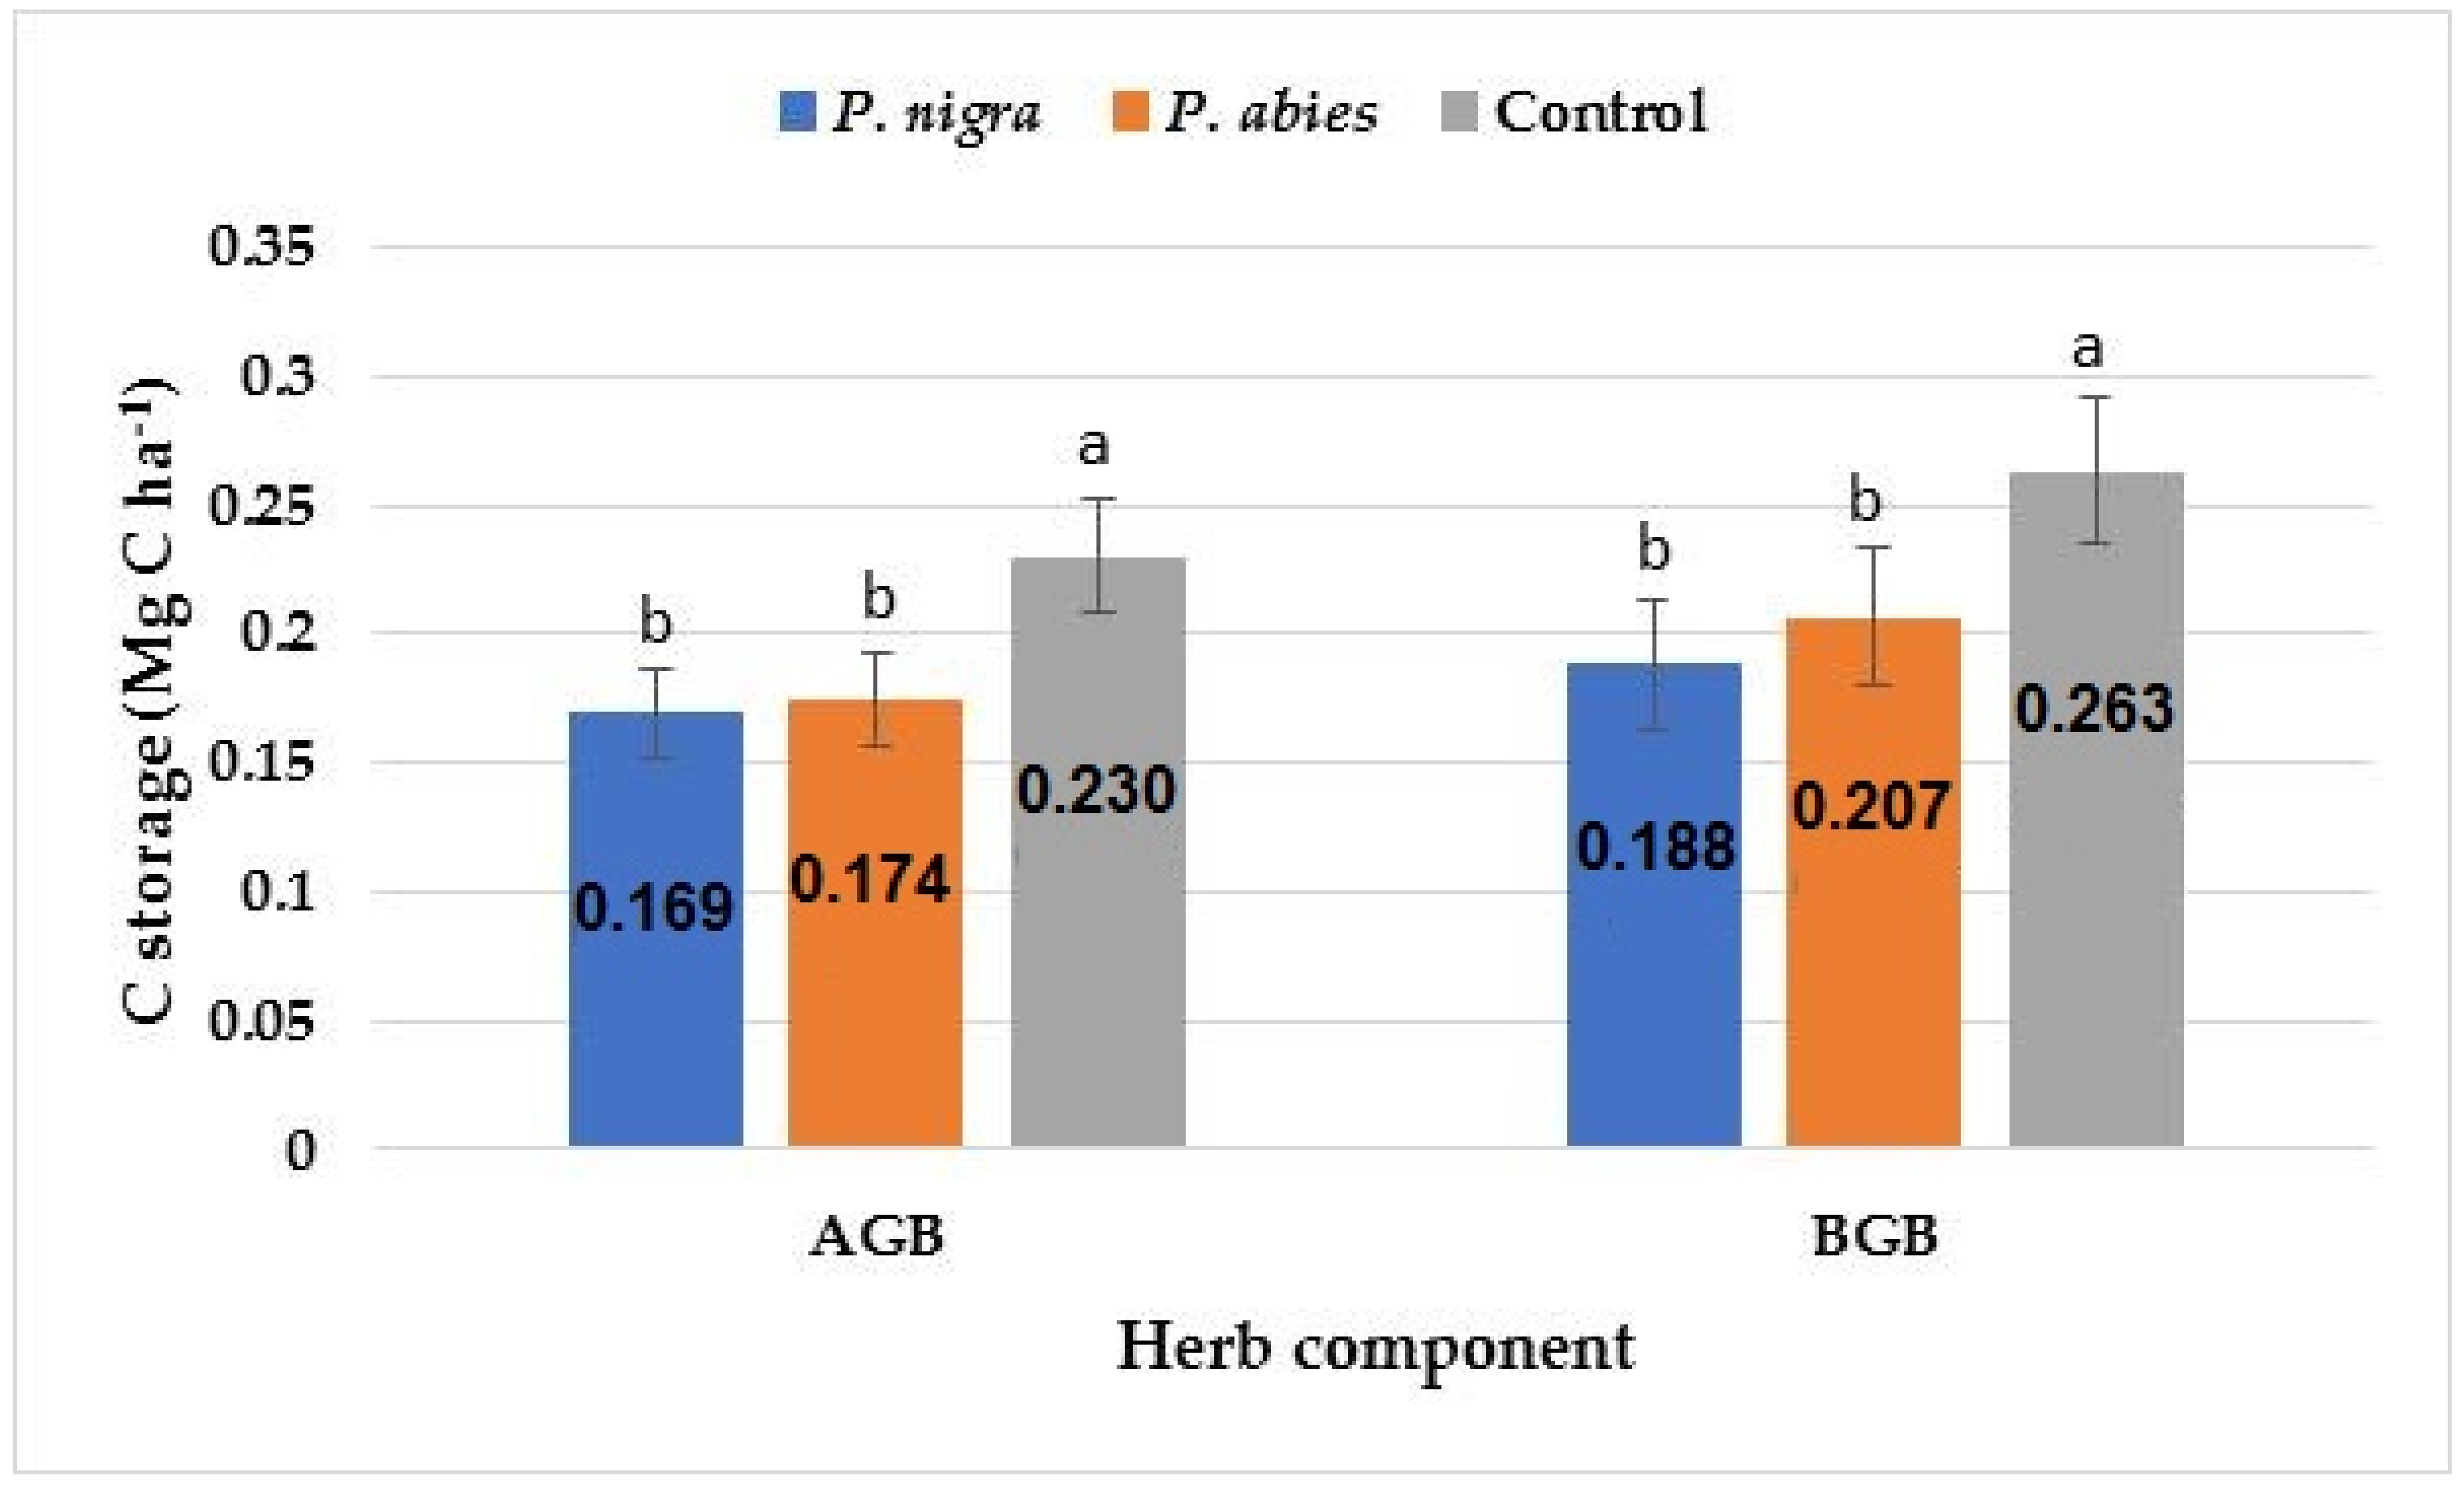
| Above-ground | 0.36 ± 0.05 b | 0.37 ± 0.05 b | 0.49 ± 0.05 a |
| Below-ground | 0.40 ± 0.05 b | 0.44 ± 0.06 b | 0.56 ± 0.05 a |
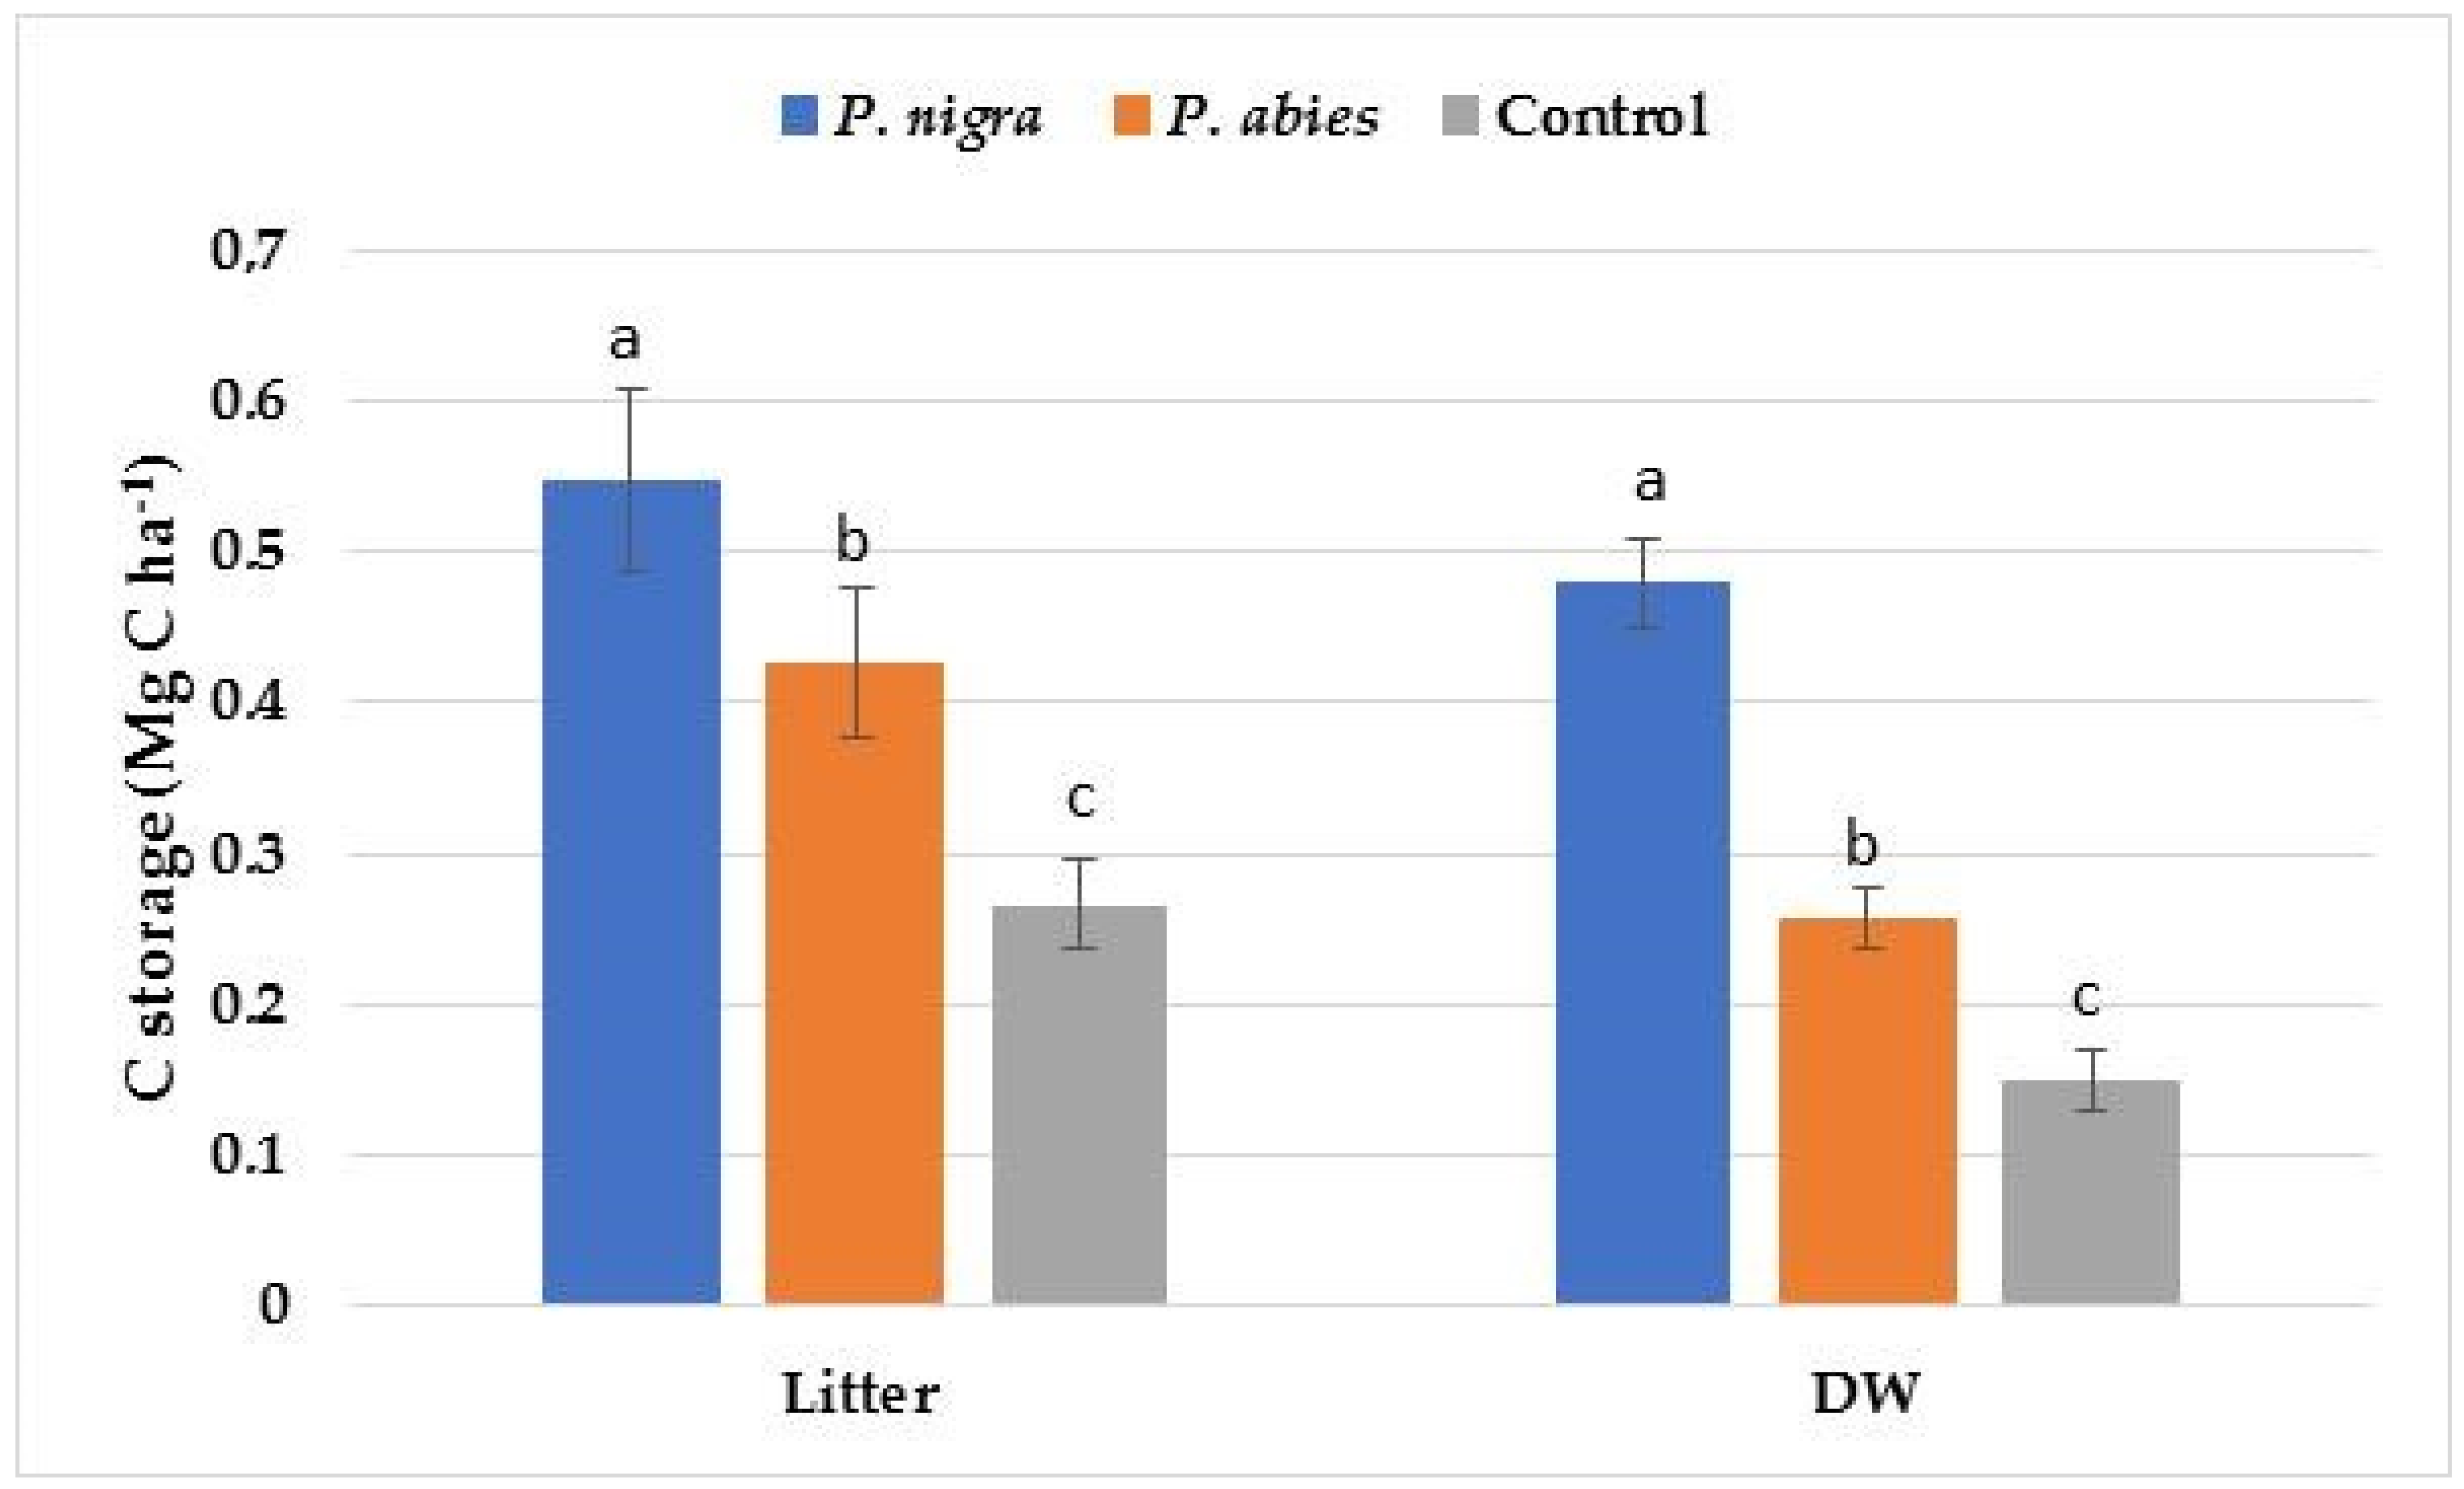
| Litter | 1.48 ± 0.10 a | 1.15 ± 0.13 b | 0.72 ± 0.06 c |
| DW | 0.96 ± 0.09 a | 0.57 ± 0.06 b | 0.30 ± 0.04 c |
| Total Biomass | 38.66 ± 2.17 a | 29.12 ± 2.36 b | 9.07 ± 0.96 c |
| Parameter | Pinus nigra Plantation | Picea abies Plantation | Control |
|---|---|---|---|
| (A) AGB by the oven-dry biomass of the tree (kg tree−1) | 80.59 ± 2.55 a | 76.02 ± 2.74 a | 29.76 ± 2.20 b |
| (B) AGB by the oven-dry biomass of the inventoried volume (kg tree−1) | 40.09 ± 2.50 a | 37.18 ± 2.71 a | 15.77 ± 2.16 b |
| Biomass Expansion Factor (BEF) | 2.01 ± 0.13 a | 2.04 ± 0.15 a | 1.89 ± 0.19 a |
| VOB (m3 ha−1) | 27.05 ± 2.31 a | 19.45 ± 2.07 b | 2.10 ± 0.29 c |
| WD (g cm−3) | 0.55 ± 0.04 b | 0.51 ± 0.03 b | 0.74 ± 0.06 a |
| AGB (Mg ha−1) | 29.90 ± 2.54 a | 20.23 ± 2.14 b | 2.94 ± 0.48 c |
| Decay Class | Volume (m3 ha−1) | Biomass (Mg ha−1) | C storage (Mg ha−1) | ||||||
|---|---|---|---|---|---|---|---|---|---|
| P. nigra | P. abies | Control | P. nigra | P. abies | Control | P. nigra | P. abies | Control | |
| DC1 | 0.68 ± 0.10 a | 0.57 ± 0.10 a | 0.11 ± 0.03 b | 0.33 ± 0.09 a | 0.23 ± 0.06 b | 0.10 ± 0.02 c | 0.16 ± 0.04 a | 0.11 ± 0.03 b | 0.05 ± 0.01 c |
| DC2 | 0.54 ± 0.10 a | 0.39 ± 0.08 b | 0.07 ± 0.02 c | 0.24 ± 0.05 a | 0.15 ± 0.03 b | 0.07 ± 0.02 c | 0.12 ± 0.03 a | 0.07 ± 0.02 b | 0.04 ± 0.01 c |
| DC3 | 0.39 ± 0.05 a | 0.24 ± 0.05 b | 0.04 ± 0.01 c | 0.17 ± 0.03 a | 0.09 ± 0.03 b | 0.06 ± 0.01 b | 0.08 ± 0.02 a | 0.04 ± 0.01 b | 0.03 ± 0.01 c |
| DC4 | 0.32 ± 0.05 a | 0.15 ± 0.03 b | 0.04 ± 0.01 c | 0.13 ± 0.03 a | 0.06 ± 0.01 b | 0.04 ± 0.01 b | 0.07 ± 0.02 a | 0.03 ± 0.01 b | 0.02 ± 0.01 c |
| DC5 | 0.25 ± 0.05 a | 0.11 ± 0.03 b | 0.03 ± 0.01 c | 0.09 ± 0.02 a | 0.04 ± 0.01 b | 0.03 ± 0.01 b | 0.05 ± 0.01 a | 0.02 ± 0.01 b | 0.01 ± 0.00 c |
| Soil Characteristics | Soil Depth (cm) | Pinus nigra Plantation | Picea abies Plantation | Control |
|---|---|---|---|---|
| BD (g cm−3) | 0–10 | 0.69 ± 0.03 b | 0.71 ± 0.05 b | 0.82 ± 0.05 a |
| 10–20 | 0.80 ± 0.04 a | 0.82 ± 0.06 a | 0.89 ± 0.06 a | |
| OC (%) | 0–10 | 5.85 ± 0.22 a | 4.57 ± 0.24 b | 3.51 ± 0.20 c |
| 10–20 | 3.76 ± 0.15 a | 3.03 ± 0.17 b | 2.15 ± 0.11 c | |
| SCS (Mg C ha−1) | 0–10 | 40.36 ± 1.16 a | 32.45 ± 1.10 b | 28.78 ± 1.07 c |
| 10–20 | 30.08 ± 1.03 a | 24.85 ± 1.11 b | 19.13 ± 0.98 c | |
| SCSR (Mg C ha−1 yr−1) | 0–10 | 0.46 ± 0.02 a | 0.15 ± 0.02 b | |
| 10–20 | 0.44 ± 0.03 a | 0.23 ± 0.03 b |
Publisher’s Note: MDPI stays neutral with regard to jurisdictional claims in published maps and institutional affiliations. |
© 2022 by the authors. Licensee MDPI, Basel, Switzerland. This article is an open access article distributed under the terms and conditions of the Creative Commons Attribution (CC BY) license (https://creativecommons.org/licenses/by/4.0/).
Share and Cite
Picchio, R.; Tavankar, F.; Rafie, H.; Kivi, A.R.; Jourgholami, M.; Lo Monaco, A. Carbon Storage in Biomass and Soil after Mountain Landscape Restoration: Pinus nigra and Picea abies Plantations in the Hyrcanian Region. Land 2022, 11, 422. https://doi.org/10.3390/land11030422
Picchio R, Tavankar F, Rafie H, Kivi AR, Jourgholami M, Lo Monaco A. Carbon Storage in Biomass and Soil after Mountain Landscape Restoration: Pinus nigra and Picea abies Plantations in the Hyrcanian Region. Land. 2022; 11(3):422. https://doi.org/10.3390/land11030422
Chicago/Turabian StylePicchio, Rodolfo, Farzam Tavankar, Hamid Rafie, Aezam Rezae Kivi, Meghdad Jourgholami, and Angela Lo Monaco. 2022. "Carbon Storage in Biomass and Soil after Mountain Landscape Restoration: Pinus nigra and Picea abies Plantations in the Hyrcanian Region" Land 11, no. 3: 422. https://doi.org/10.3390/land11030422
APA StylePicchio, R., Tavankar, F., Rafie, H., Kivi, A. R., Jourgholami, M., & Lo Monaco, A. (2022). Carbon Storage in Biomass and Soil after Mountain Landscape Restoration: Pinus nigra and Picea abies Plantations in the Hyrcanian Region. Land, 11(3), 422. https://doi.org/10.3390/land11030422