Abstract
The protection of natural spaces is a practice that is widely used by governments or nongovernmental organizations seeking to preserve the scenic beauty of landscapes and their natural resources in spaces that stand out for their natural and cultural value and have not been heavily impacted by human activity. Proper tourism management of these spaces can promote the economic, social, and environmental development of a territory and its local communities. The objective of this paper is to examine the role of resources in the performance of protected area tourism destinations from a sustainability perspective. The information provided by the managers of 102 protected spaces in Spain (national parks, nature parks, and biosphere reserves) is analyzed. The results provide relevant information about managing resources to strengthen the sustainable performance of these spaces. The findings indicate that different types of resources affect different dimensions of sustainable performance; for instance, natural resources affect the local quality of life and the area’s sustainability, certain created resources can unite and foster local communities and support environmental sustainability, and some supporting resources can attract tourists.
1. Introduction
The International Union for the Conservation of Nature (IUCN) defines a protected area (PA) as a “clearly defined geographical space, recognized, dedicated and managed, through legal or other effective means, to achieve the long-term conservation of nature with associated ecosystem services and cultural values” [1] (p. 8). Currently, many diverse economic activities take place in PAs, and tourism is one of the principal uses of these spaces. Tourism in PAs is a major part of the global tourism industry and is present in almost all global reserves [2,3].
However, tourism in these areas must be sustainable [4]. The sustainable management of PAs, which are understood as tourism destinations, takes into consideration the economic, societal, and environmental balance [5,6,7,8] and is oriented toward achieving sustainable development goals. The imperative of sustainability in PA management also applies to the management of PA resources, which must be protected and preserved.
Along these lines, it is worth highlighting studies that have applied land suitability analysis methods [9,10] to the evaluation of tourist activities [11,12,13,14,15,16,17,18] and determining their degree of convenience and suitability for different areas of a territory. These works provide useful knowledge for decision making and the development of land use policies. They represent a valuable contribution to advancing the direction of sustainable management of PAs or territories with environmental fragility and a variety of ecosystems.
However, once tourist activities are implemented in a specific PA, the managers of that territory (now a tourist destination) must face the fact that the essential and ancillary resources of the PA have become means to attract tourists and improve the competitive performance of the PA as a tourism destination [19,20,21,22,23,24,25,26,27].
The difficult balance of protecting PA resources, while simultaneously using them to achieve the performance of the area in terms of its role as a tourism destination, is a challenge for managers of these spaces that can only be faced by contemplating the concept of performance from an expanded perspective that incorporates sustainability. With the aim of providing knowledge that contributes to meeting this challenge, this paper analyzes the relationship between a PA destination’s resources and sustainable performance.
We explore the following research questions:
- What dimensions of the performance of PA tourism destinations should be considered from a sustainability perspective?
- What types of tourism resources are found in PAs?
- How do these resources influence the various dimensions of a PA’s sustainable performance?
Some empirical studies have focused on evaluating, weighing, and classifying the resources of nature-based destinations [28,29,30,31]. From a broader territorial destination approach (countries, regions, etc.), a few papers have sought to advance the research from factor ranking to an assessment of the impact of various factors (including resources) on tourism destinations’ performance [25,32,33,34,35,36]. However, the performance of a destination is usually assessed from an economic perspective (measured as tourism’s attractiveness, tourism industry growth, or productivity). Additionally, these studies have sought to offer an overall view of the wide range of determinant factors rather than a detailed exploration of the influence of the resources.
PAs are chosen destinations for exploration, as each tourism destination is different [37], and specific investigations must be conducted for specific destinations [38,39]. The complexity of the tourism-related performance of PAs, as well as the particular importance of their resources, justifies their analysis. These destinations owe their special complexity to the large variety of objectives, expectations, and stakeholders involved in them as well as their social and environmental fragility. The results obtained will allow us to advance toward establishing a resource-based tourism performance model for PAs from a sustainability perspective.
To achieve the stated objectives, the remainder of this paper is organized into four sections. In the next section, a literature review is conducted to frame the scope of the present research in relation to prior studies. The study hypotheses are then proposed. In the third section, measurement scales are proposed regarding the sustainable performance of PAs and their resources, and the data and analytical techniques used to test the proposed hypotheses are described. The fourth section presents and discusses the main findings. Finally, the fifth section lays out the conclusions, limitations, and future lines of research.
2. Theoretical Background and Hypothesis Development
2.1. The Sustainable Performance of PAs as Tourism Destinations
A tourism destination’s performance has traditionally been studied in terms of supply and, in relation to its economic dimension, understood as the destination’s competitiveness based on the competitiveness of the associated companies [40,41] and relative to other destinations in relation to maintaining or increasing market share. This approach focuses on factors such as “price differentials” [42] (p. 9), “tourism expenditure” [43] (p. vii), “attract[ing] visitors” [27] (p. 9), or “economic returns” [44] (p. 247). Several studies have examined PAs from the perspective of their ability to attract visitors [45,46,47,48]. Since one objective of any tourism destination is to be attractive to potential visitors, the economic variables related to attractiveness should be considered performance indicators.
A hasty transfer of the competitiveness concept from the business field to the field of tourism destinations suggests that performance involves the generation of tourism products or experiences and attracting visitors; however, sustainable performance must transcend those matters. The authors of [49,50,51] call for complex and multidimensional performance measurement.
In addition to the economic dimension, environmental, social, cultural, political, and technological factors must also be considered [52]. Thus, to move beyond the simplistic view that considers only the economic impact of tourism, tourism must also be analyzed in terms of the changes it causes in local living conditions [53], resources, and infrastructure [43,54]. These circumstances influence residents’ quality of life (QoL) [53,55]. From another perspective, the authors of [56,57,58] suggest that residents’ QoL impacts destination performance through its effect on the friendliness, warmth, or hospitality of local people toward tourists as well as by equipping them with training and skills to establish relationships with tourists. It is likewise worth recalling that in many destinations, the local community itself becomes a tourist attraction. Specifically, studies on PAs or areas with especially fragile or vulnerable features show that residents’ QoL and the resulting behavioral patterns provide essential support for the tourism-oriented development of the destination [58,59,60].
Ref. [61] observe that the value of tourism has evolved from noneconomic measures of QoL to more abstract ones, such as perceived QoL, the sense of well-being, or sustainability. In this dynamic approach to tourism, which emphasizes perceived well-being and long-term effects, the tourism sustainability concept has taken on increasing importance. Hence, the tourism development models for the destination type examined here (PAs) stress the implementation of sustainability-based management strategies [5,7,62] based on three pillars: (1) the preservation of natural and environmental resources; (2) the preservation of the social community, its culture, and its structure; and (3) the preservation of the local economy to ensure its survival and its sustained and steady economic development over time.
Thus, in very complex destinations such as PAs, a holistic approach to tourism destination performance must consider the destination’s attractiveness, the local population’s well-being, and the three dimensions of sustainability.
2.2. Resources in Tourism Destinations
Resource analysis in conceptual models of tourism destination competitiveness (developed from the late 1990s to the present day) has advanced from comparative advantage postulates, focused on the availability of abundant resources, to the search for competitive advantages, whereby a destination’s competitiveness is understood as the capability of the destination to add value to products or services similar to those offered by competing destinations. Resources are key, as demonstrated in the model of [19], in which they play a dual role as both attractors and supporting factors. Similarly, [20] situate the various resources that they identify on the same level; it is the linkage between them that generates results.
Resource-based theory has also examined the role of resources in performance. In this theoretical approach, the sources of competitive advantage consist of a set of organizational resources and exclusive capabilities that cannot be copied or imitated [63,64]. In the tourism destination context, having resources that are heterogeneous and not easily transferable would create a value proposition [65], affect tourism destination performance [66], and increase the durability of competitiveness [67,68].
Thus, in a transposition of the resource-based view of firms to the field of tourism destinations, [69] argue that just as a firm’s resources are the basis for its ability to supply products [68] and the core of its business competitiveness, a destination’s resources are the basis for generating tourism experiences and for achieving destination performance.
All these arguments give rise to the hypothesis of the present research:
Hypothesis 0:
Resources positively influence the competitive and sustainable performance of PAs as tourism destinations.
However, according to resource-based theory, different resources play different roles in regard to competitiveness and value creation [70]. Thus, particular combinations of resources could lead to different performance models.
The authors of [19,27] take on the task of classifying different types of resources of tourism destinations. They refer to the factors or resources with which a tourism destination is endowed, including both created and naturally occurring resources. These elements motivate tourists to visit and help develop the capabilities of a destination and are classified as core resources and supporting resources or factors. Core, primary, or attractive resources refer to the physiography (nature, climate, etc.), culture and history, market ties, leisure and recreational activities, events, and tourism superstructure of a destination. Complementary or supporting resources refer to factors that facilitate the development of a successful tourism industry, such as infrastructure, “facilitating” resources and services (financial institutions and the availability and quality of local human and capital resources, educational institutions, etc.), hospitality, enterprises, political will, and accessibility.
Ref. [20] build on the model proposed by [19,27], developing an integrative model that maintains the dual typology and reclassifies core resources into two types of resources: endowed or inherited resources and created resources. They argue that core and complementary or supporting resources must be interrelated to generate attractiveness and visitation.
The model proposed by [23], in an effort to overcome the limitations of earlier models, also includes resources, in this case, as part of both the exogenous and endogenous comparative advantages. Thus, most of the resources that earlier models considered core and inherited resources became exogenous comparative advantages. Human resources and innovation-related knowledge resources are considered endogenous comparative advantages, while certain supporting or complementary resources (accessibility design, transport, accommodations, public services, food, etc.) make up the competitive advantages in this model.
Consequently, we group the resources recognized by the different models into three types of resources: (1) core attractors, i.e., natural or inherited resources, or identity resources, because they endow the destination with certain differentiating features; (2) the resources created around the first group; and (3) resources that support, facilitate, or may be used to enhance the tourist-oriented attractiveness of the destination. We subdivide the working hypothesis into three Sub-hypotheses to separately examine the different resources considered in tourism destinations:
Hypothesis 1:
Natural/identity resources positively influence all dimensions of the sustainable performance of PAs as tourism destinations;
Hypothesis 2:
Created resources positively influence all dimensions of the sustainable performance of PAs as tourism destinations;
Hypothesis 3:
Supporting resources positively influence all dimensions of the sustainable performance of PAs as tourism destinations.
Additionally, models that consider sustainability as a variable [71] or analyze nature-based tourism [31,72] include other types of resources aimed at reducing environmental degradation and endowing natural resources with quality. Therefore, for PAs, we must formulate a fourth hypothesis:
Hypothesis 4:
Resources geared toward environmental conservation positively influence all dimensions of the sustainable performance of PAs as tourism destinations.
3. Materials and Methods
3.1. Study Areas
This study focuses on PAs in Spain. Within the PA model, it is necessary to focus our unit of analysis since there are protected natural spaces and areas protected by various international instruments. In Spain, protected natural spaces are regulated through Law 42/2007 regarding Natural Heritage and Biodiversity and by the specific Law for National Parks (Law 30/2014 of December 3 on National Parks). In article 29 of Law 42/2007, protected natural spaces are classified “according to the assets and values to be protected and the management objectives to be met”. Table 1 details this classification and collects the data that show the current situation in Spanish territory.

Table 1.
Definition, number, and land area of protected spaces by protection category in Spain.
There are currently 16 declared national parks, 152 natural parks, 291 nature reserves, 359 natural monuments, 61 protected landscapes, 2 protected marine areas, and more than 800 additional spaces with other figures developed by autonomous communities. In Spain, 36.2% of the terrestrial surface and 12.3% of the marine surface is protected.
In addition, article 41 of Law 42/2007 includes the Natura 2000 Protected Network [73]. This network is defined as “a coherent ecological network made up of Sites of Community Importance (SCIs), Special Areas of Conservation (SACs) and Special Protection Areas (SPAs) for Birds, whose management will take into account economic, social and cultural demands, as well as regional and local particularities”. The SCIs, SACs, and SPAs for birds in Spain are considered PAs, with the designation Red Natura 2000 PA and with scope and limitations established by autonomous communities in their legislation and in the corresponding planning instruments. With respect to the Natura 2000 network, Spain contributes a greater area than other European countries, with approximately 220.000 km2, representing 27.4% of the country [73].
Likewise, article 49 of the Law lists the areas protected by international instruments. Among the international protection figures, we highlight the biosphere reserve. Biosphere reserves, according to article 1 of the UNESCO statutory framework, are “areas of terrestrial and coastal/marine ecosystems or a combination thereof, which are internationally recognized within the framework of UNESCO’s programme on Man and the Biosphere (MAB)” [74]. Article 3 of the statutory framework states that biosphere reserves must fulfill the following three functions: “Conservation (contribute to the conservation of landscapes, ecosystems, species and genetic variation); Development (foster economic and human development which is socio-culturally and ecologically sustainable); and Logistical support (support for demonstration projects, environmental education and training, research and monitoring related to local, regional, national and global issues of conservation and sustainable development)”.
Among European countries, Spain currently has the most biosphere reserves with 53 recognized biosphere reserves, several of which are cross-border, with a total area of six million hectares, representing 12% of the Spanish land area (6 million hectares) [73].
Due to the enormous spectrum of existing PAs, we selected three specific types of spaces for our analysis: national parks, natural parks, and biosphere reserves. Our selection is based on the following issues:
- All three protection categories allow for the development of tourism in combination with the preservation of space, with ecotourism being an ideal typology.
- Most protected land in Spain falls into one of these three categories, which are the protection categories with the greatest national and/or international recognition.
- National parks as protected land have been consolidated worldwide as an important attractive space and attractor of tourists [45,75,76,77]. The authors of [6] state that the National Park label is a mark of high environmental quality. It is also one of the categories that attracts the most visitors in Spain, with approximately 15 million visitors to the 16 existing national parks [73] (p. 72).
- Most PAs in Spain are in the natural park category. There are 152 natural parks (including rural and regional parks) that account for 40.5% of the total PA [73]. In addition, [73] (p. 92) report that these areas received nearly 16 million visits in 2018.
- Biosphere reserves are internationally recognized and designated by UNESCO. According to [73], there are 738 biosphere reserves in 134 countries. Spain has the greatest number of biosphere reserves at 53.
3.2. Sampling Strategy and Data Collection Methods
A total of 221 PAs (16 national parks, 152 nature parks, and 53 biosphere reserves) were identified (Figure 1). However, in some cases, a single area was classified under more than one of the aforementioned protection categories. Since the actual area to be studied was the same, these areas were each counted as just one PA. Thus, the final sample consisted of 202 PAs.
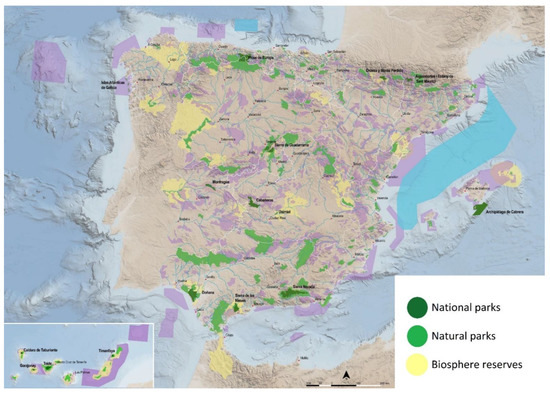
Figure 1.
Location of the PAs analyzed.
The sample was created using the stratified sampling method in finite populations. Proportional allocation was used to determine the number of sample units [78]. In keeping with these considerations, simple random sampling was conducted, resulting in a sample size of 102 (Table 2).
Table 2.
Stratified sampling in accordance with proportional allocation.
According to [39,79], the ideal information providers are people with relevant knowledge concerning what makes a tourism destination competitive. The survey thus targeted people who, in each case, had assumed the role of destination manager of the PA (under the management plan for a PA, each area must have someone in charge of managing its resources and activities).
Data were collected by e-mail following initial phone calls. Prior to the data collection, several pretests were conducted to identify potential problems with the survey.
3.3. Measures
3.3.1. Sustainable Performance of PAs
Although multiple indicators have been used to measure tourism attractiveness, QoL, and the sustainability dimensions of tourism performance, in the case of PAs, the items selected were those that, in the authors’ view, best reflect the specificity of a destination and about which the qualified respondents selected to complete the questionnaire could provide answers.
Indicators were taken from [20,24,80] to enable an approximate measure of the capability of each PA to attract tourists. To obtain QoL and tourism sustainability variables, indicators were selected from the scales proposed by [56,81]. Some indicators in these scales are conceptually used to measure QoL, while others are better suited to measuring tourism sustainability. The authors of [82] suggest that QoL should be measured through subjective indicators referring to individuals’ perceived well-being. This conception locates QoL in the value assigned to a way of life itself, regardless of other issues, such as income or economic growth. Preserving that way of life in a way that is compatible with value creation gives rise to the concept of tourism sustainability [5]. Thus, the three areas of sustainable value creation inherent to tourism’s sustainability (economic, social, and environmental) are reflected in different ways.
The measurement used a 5-point Likert scale. Principal component factor analysis with orthogonal varimax rotation and Cronbach’s alpha were used to ensure the validity and reliability of the scales. Table 3 shows that the measures used adjust the 5 expected factors: (1) tourism attractiveness, (2) social well-being or QoL of the local population, (3) economic sustainability of the local community, (4) social sustainability or creation of a sense of community, and (5) environmental sustainability or nature conservation.
Table 3.
Measurement scale for the sustainable performance of a PA.
3.3.2. PA Resources
To assess the resources of each PA, the public managers of each area were asked to rate the level of development of a set of resources on a 5-point Likert scale. The proposed range of indicators constitutes an adaptation to the PA tourism destination of the diversity of categories and resource levels proposed in [20,23,24,27], as well as the specificity of resources proposed in the nature-based tourism models developed by [31,83].
The indicators were classified as follows: (1) core natural resources, i.e., the endogenous and differential resources of each PA; (2) resources created around those core resources to increase their value; (3) supporting, complementary, or peripheral resources, which contribute accessory value to the core identity resources; and (4) resources generated by environmental conservation, since the type of tourism carried out in a PA can be expected to regard its environmental quality as a resource.
To test the validity and reliability of the measures used, principal component analysis was applied to the set of 28 scores, and Cronbach’s alpha was calculated for each resulting factor.
As Table 4 shows, the scores for natural resources fit a single factor. The groups of items related to created resources and supporting resources are each divided into two distinct blocks of indicators, giving rise to four more factors. Specifically, a second factor emerges with a strong loading of indicators referring to created resources that showcase or adapt identity resources for tourists. A third factor includes the indicators of resources created as facilities in the context of natural resources to facilitate visitors’ stays (tables, benches, and trash cans). The supporting resource indicators are split between the fourth and fifth factors. Supporting infrastructure related to the creation of a network of tourism services (accommodations, restaurants, and shops) makes up the fourth factor. The fifth factor has a strong loading of indicators referring to supporting infrastructure aimed at enabling access to the PA, connecting it to its area of influence and basic services, and connecting it to other tourism destinations or tourism service or product locations outside the PA that might be of interest to visitors. Finally, a sixth factor emerges with a strong loading of indicators associated with environmental conservation elements, such as lack of litter, clean trails, or the absence of trampled vegetation, resource destruction, illegally constructed buildings, and erosion.
Table 4.
Principal component and reliability analysis of the PA resource measures.
3.4. Analysis
Figure 2 illustrates the model of the relationships and proposed hypotheses. To test the Sub-hypotheses, five multiple regression models were run. The bidirectional stepwise regression method was chosen. This method involves the iterative step-by-step construction of the final regression model by adding or eliminating explanatory variables. The purpose is to choose, among the set of all possible explanatory variables, only those with a significant influence on the corresponding explained variable [84]. This method is appropriate for situations in which, due to the large number of possible independent variables, there are no previous studies to guide the analyst with respect to the selection of relevant variables. In the present case, although the literature predicts that destination resources (considered as a whole) will have a large impact on destination performance, no studies have yet examined in depth which resources have a greater or smaller influence or which have a significant and relevant effect. Thus, the stepwise procedure for selecting variables was used to select, from all possible resource variables, only those that significantly influence the various dimensions of the PA destination performance construct, ultimately resulting in regression models that provide the best possible fit.
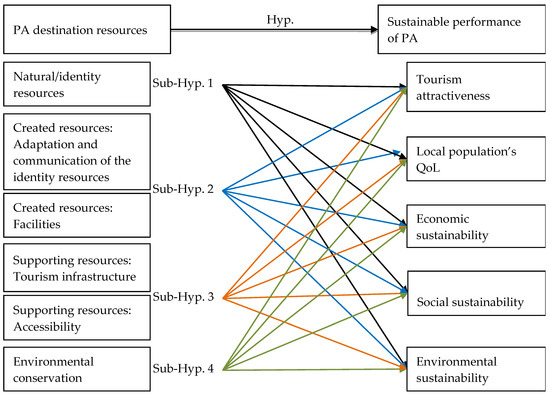
Figure 2.
Research model: research hypotheses.
4. Results and Discussion
The results show a direct effect of resources on sustainable performance, although not all types of resources significantly explain the performance of a PA (Table 5). This is true for all the dimensions of tourism performance taken as dependent variables, resulting in only partial support for the main working hypothesis as well as the various sub-hypotheses derived from it.
Table 5.
Regression analysis results.
4.1. Natural/Identity Resources
Refs. [23,85] found these types of resources to be the most important to and determinant of destination performance. A more detailed analysis of the sustainable performance concept (splitting it into its constituent dimensions) shows that natural resources are not a determinant variable for attracting visitors (this finding is consistent with that reported in [69]). Tourists may not consider the natural/identity resources of a PA when selecting a tourism destination. The destination’s designation as a PA already ensures the existence of such resources in tourists’ eyes, but this also results in all types of PAs being viewed as equal. In other words, natural resources cannot be used to make a particular PA stand out from the others.
However, the influence of these resources on the performance dimensions related to the local population’s QoL and the economic, social, and environmental sustainability of the PA highlight their importance for residents’ well-being and living conditions. It should also be recalled that the residents of a destination often also recommend visits and support tourism activities [57,58,86].
4.2. Created Resources
Ref. [85] includes some created resources as “core resources” and “attractors,” finding that they are part of the group of factors that are most important for and determinant of performance. While the present results are largely consistent with this finding, they enable a more detailed diagnosis.
The results of this study show that the created resources aimed at adapting a PA and conveying an appealing image of its natural/identity resources significantly affect its social and environmental sustainability. This clearly demonstrates that some inherited resources, when appropriately showcased, are recognized as valuable and important by the local population, thereby enhancing both their sense of belonging or connection to the community to which they belong (implicit issues in the social sustainability dimension) and the conservation of natural and environmental resources, in which local residents play an important stewardship role through their everyday behavior.
In contrast, the resources created to facilitate visitors’ stay in the PA do not influence any dimension of destination performance.
4.3. Supporting Resources
Tourism infrastructure services also significantly influence residents’ QoL and economic sustainability. Local residents can be both users and suppliers of these services. Hence, the creation of a strong, cohesive, and well-organized tourism infrastructure network significantly impacts their personal and economic well-being.
In contrast, the supporting resources aimed at enhancing the accessibility of a PA do not influence any dimension of destination performance. The author of [85] found that, in addition to infrastructure, accessibility was a very important and determinant supporting factor for performance. In PAs, however, special value seems to be placed on the infrastructure available at the destination to ensure people’s well-being while they are there; however, people do not seem to be overly concerned about how well-connected the area is to other places.
Tourism attractiveness is only significantly affected by the existence of tourism infrastructure services. These are essential resources in any tourist destination; they serve to satisfy the basic needs of visitors [79] and largely ensure the influx of visitors to the PA. This finding is consistent with the model proposed by [23], which suggests that identity and created resources are comparative advantages. However, only the implementation of supporting resources (which, in the present case, unlike in [23], are limited to tourism infrastructure and do not include accessibility design) allows destinations to develop genuine competitive advantages that enhance tourism attractiveness. Similarly, regarding tourism with respect to countries [69], sun and beach destinations [87], or island destinations [28], it has been proven that the more support resources a destination has, the more competitive it is. The authors of [69] likewise observe that in their area of study, other attributes (such as safety, the hospitality and friendliness of residents, destination accessibility, cleanliness, attractions, and well-marked roads and attractions) have greater weight than natural/identity resources, which are, nevertheless, considered main attractors by most of the previous studies.
4.4. Resources Aimed at Environmental Conservation
In the case of PAs, core, identity, or primary resources and created or supporting resources influence various dimensions of sustainable and competitive performance. However, some resources considered important in earlier works on nature tourism, such as those related to environmental conservation [31,83], turn out to have no influence on performance. Consequently, no support was found for hypothesis 4.
5. Conclusions
This paper has analyzed the effects of different types of destination resources (natural/identity, created, supporting, and environmental conservation) on the various identified dimensions of the sustainable performance (tourism attractiveness, local population’s QoL, and economic, social, and environmental tourism-focused sustainability) of PAs. As suggested by the models that rank the determinants of destination competitiveness, we have found that the resources of a PA destination influence its sustainable performance. However, each dimension of that performance results in different resource influences.
The tourism attractiveness of PA destinations is influenced by the tourism infrastructure only as a supporting resource. Qualifying, amplifying, or advanced factors are the key elements when determining the increase or decrease in competitiveness. However, making the PA more accessible, or recognizing the identity resources, does not create tourism attractiveness. We suggest that among destinations that have gained external recognition of their identity resources from a public body, as has occurred in the case of PAs, identity resources are perceived similarly or fairly similarly across all natural spaces. This finding is in line with resource-based theory, as we find that only resources that are rare or scarce (not homogeneous among destinations), difficult to imitate, specialized, immovable, and nonnegotiable are critical.
Consequently, a strictly economistic, short-term vision that associates the results of the destination with its competitiveness and attractiveness to tourists could lead to the devaluation of the identity resources of the destination. These resources, which are considered essential for nature tourism (natural resources, flora and fauna, and the landscape), may not be a source of an immediate competitive advantage; however, they provide social support for the local community (the local population’s QoL) and are fundamental to its survival (economic sustainability). In this specific type of destination, which has a recognized protection status that ensures the existence of wildlife and landscape values, these resources can be understood as a clear source of lasting human development, although not as a means of immediate tourism promotion. In addition, providing the destination with tourism support infrastructure has a positive impact on the QoL of the local population and its economic sustainability, since the infrastructure will generate employment and economic activity for residents.
Social and environmental sustainability are influenced not only by the existence of natural/identity resources but also by their public recognition and externalization (through the creation of resources to showcase, adapt, and offer interpretations of the available natural resources). This exhibition will most likely strengthen the community’s connection to the territory and lead to its assumption of responsibility for its conservation.
All PA resources should be cared for, strengthened, and managed. As a supporting contribution to their management, previous studies have sought to identify and rank each type of resource. However, beyond these measurements, the repercussions and influence of any resource management action on destination performance, understood as multidimensional and sustainable results, must be considered before the action can be carried out. This paper provides evidence and guidelines in this regard.
Nevertheless, more research is needed to deepen our understanding of the relationship between the resources and sustainable performance of a PA tourism destination. Future work should include other variables in the design of a fully explanatory model of sustainable performance, which would allow us to specifically determine the importance of the resources themselves in relation to other variables and to assess potential synergistic effects associated with matching destination resources with other determinant variables of performance. It would also be useful to analyze whether the different management models influence the relationship between resources and sustainable performance. Complementing the vision of managers of the natural spaces (used for this work) with the perception of tourists who visit the PAs would also serve to confront different perspectives and deepen our understanding of possible different visions of the roles of PAs in sustainable performance.
Author Contributions
Conceptualization, L.B.-C. and A.G.-C.; methodology, L.B.-C. and A.G.-C.; formal analysis, M.I.D.-C., L.B.-C. and A.G.-C.; data curation, L.B.-C.; writing—original draft preparation, L.B.-C.; writing—review and editing, J.A.F.-B.; visualization, M.I.D.-C. and A.G.-C.; supervision, A.G.-C.; and funding acquisition, J.A.F.-B. All authors have read and agreed to the published version of the manuscript.
Funding
This research received no external funding.
Data Availability Statement
The data that support the findings of this study are available upon reasonable request from the authors.
Acknowledgments
We thank all the reviewers for their feedback on earlier versions of the manuscript.
Conflicts of Interest
The authors declare no conflict of interest.
References
- Dudley, N. Guidelines for Applying Protected Area Management Categories; IUCN: Gland, Switzerland, 2008. [Google Scholar]
- Leung, Y.; Spenceley, A.; Hvenegaard, G.; Buckley, R.; Groves, C. Tourism and Visitor Management in Protected Areas: Guidelines for Sustainability; IUCN: Gland, Switzerland, 2018. [Google Scholar]
- Spenceley, A.; Kohl, J.; McArthur, S.; Myles, P.; Notarianni, M.; Paleczny, D.; Pickering, C.; Worboys, G. Visitor management. In Protected Area Governance and Management; Worboys, G.L., Lockwood, M., Kothari, A., Feary, S., Pulsford, I., Eds.; ANU Press: Camberra, Australia, 2015; pp. 715–750. [Google Scholar]
- Eagles, P.F.J.; Bowman, M.E.; Teresa Chang-Hung, T. Guidelines for Tourism in Parks and Protected Areas of East Asia; IUCN: Gland, Switzerland; Cambridge, UK, 2001. [Google Scholar]
- Tsaur, S.; Lin, Y.; Lin, J. Evaluating ecotourism sustainability from the integrated perspective of resource, community and tourism. Tour. Manag. 2006, 27, 640–653. [Google Scholar] [CrossRef]
- Eagles, P.F.; McCool, S.F.; Haynes, C.D. Sustainable Tourism in Protected Areas: Guidelines for Planning and Management; IUCN: Gland, Switzerland, 2002. [Google Scholar]
- Font, X.; Garay, L.; Jones, S. Sustainability motivations and practices in small tourism enterprises in European protected areas. J. Clean. Prod. 2016, 137, 1439–1448. [Google Scholar] [CrossRef]
- Thompson, A.; Massyn, P.J.; Pendry, J.; Pastorelli, J. Tourism Concessions in Protected Natural Areas: Guidelines for Managers; United Nations Development Programme (UNDP): New York, NY, USA, 2014. [Google Scholar]
- Hopkins, L.D. Methods for generating land suitability maps: A comparative evaluation. J. Am. Inst. Plan. 1977, 43, 386–400. [Google Scholar] [CrossRef]
- Steiner, F. Resource suitability: Methods for analyses. Environ. Manag. 1983, 7, 401–420. [Google Scholar] [CrossRef]
- Ayhan, Ç.K.; Taşlı, T.C.; Özkök, F.; Tatlı, H. Land use suitability analysis of rural tourism activities: Yenice, Turkey. Tour. Manag. 2020, 76, 103949. [Google Scholar] [CrossRef]
- Dhami, I.; Deng, J.; Burns, R.C.; Pierskalla, C. Identifying and mapping forest-based ecotourism areas in West Virginia–Incorporating visitors’ preferences. Tour. Manag. 2014, 42, 165–176. [Google Scholar] [CrossRef]
- Gigović, L.; Pamučar, D.; Lukić, D.; Marković, S. GIS-Fuzzy DEMATEL MCDA model for the evaluation of the sites for ecotourism development: A case study of “Dunavski ključ” region, Serbia. Land Use Policy 2016, 58, 348–365. [Google Scholar] [CrossRef]
- Islam, N.; Sarkar, B.; Basak, A.; Das, P.; Paul, I.; Debnath, M.; Roy, R. A novel GIS-based MCDM approach to identify the potential eco-tourism sites in the Eastern Dooars region (Himalayan foothill) of West Bengal, India. Geocarto Int. 2022, 1–30. [Google Scholar] [CrossRef]
- Jeong, J.S.; García-Moruno, L.; Hernández-Blanco, J.; Jaraíz-Cabanillas, F.J. An operational method to supporting siting decisions for sustainable rural second home planning in ecotourism sites. Land Use Policy 2014, 41, 550–560. [Google Scholar] [CrossRef]
- Mobaraki, O.; Abdollahzadeh, M.; Kamelifar, Z. Site suitability evaluation for ecotourism using GIS and AHP: A case study of Isfahan Townships, Iran. Manag. Sci. Lett. 2014, 4, 1893–1898. [Google Scholar] [CrossRef]
- Zabihi, H.; Alizadeh, M.; Wolf, I.D.; Karami, M.; Ahmad, A.; Salamian, H. A GIS-based fuzzy-analytic hierarchy process (F-AHP) for ecotourism suitability decision making: A case study of Babol in Iran. Tour. Manag. Perspect. 2020, 36, 100726. [Google Scholar] [CrossRef]
- Zhang, Z.; Sherman, R.; Yang, Z.; Wu, R.; Wang, W.; Yin, M.; Yang, G.; Ou, X. Integrating a participatory process with a GIS-based multi-criteria decision analysis for protected area zoning in China. J. Nat. Conserv. 2013, 21, 225–240. [Google Scholar] [CrossRef]
- Crouch, G.I.; Ritchie, J.B. Tourism, competitiveness, and societal prosperity. J. Bus. Res. 1999, 44, 137–152. [Google Scholar] [CrossRef]
- Dwyer, L.; Kim, C. Destination competitiveness: Determinants and indicators. Curr. Issues Tour. 2003, 6, 369–414. [Google Scholar] [CrossRef]
- Gooroochurn, N.; Sugiyarto, G. Competitiveness indicators in the travel and tourism industry. Tour. Econ. 2005, 11, 25–43. [Google Scholar] [CrossRef]
- Heath, E. Towards a model to enhance Africa’s sustainable tourism competitiveness. J. Public Adm. 2002, 37, 327–353. [Google Scholar]
- Hong, W. Global competitiveness measurement for the tourism sector. Curr. Issues Tour. 2009, 12, 105–132. [Google Scholar] [CrossRef]
- Kim, C. A Model Development for Measuring Global Competitiveness of the Tourism Industry in the Asia-Pacific Region; Korea Institute for International Economic Policy: Seoul, Republic of Korea, 2000. [Google Scholar]
- Knežević Cvelbar, L.; Dwyer, L.; Koman, M.; Mihalič, T. Drivers of destination competitiveness in tourism: A global investigation. J. Travel Res. 2016, 55, 1041–1050. [Google Scholar] [CrossRef]
- Navickas, V.; Malakauskaite, A. The possibilities for the identification and evaluation of tourism sector competitiveness factors. Eng. Econ. 2009, 61, 37–44. [Google Scholar]
- Ritchie, J.B.; Crouch, G.I. The Competitive Destination: A Sustainable Tourism Perspective; Cabi: Wallingford, UK, 2003. [Google Scholar]
- Chen, C.; Chen, S.; Lee, H.; Tsai, T. Exploring destination resources and competitiveness–A comparative analysis of tourists’ perceptions and satisfaction toward an island of Taiwan. Ocean Coast. Manag. 2016, 119, 58–67. [Google Scholar] [CrossRef]
- Deng, J.; King, B.; Bauer, T. Evaluating natural attractions for tourism. Ann. Tour. Res. 2002, 29, 422–438. [Google Scholar] [CrossRef]
- Melian-Gonzalez, A.; García-Falcón, J.M. Competitive potential of tourism in destinations. Ann. Tour. Res. 2003, 30, 720–740. [Google Scholar] [CrossRef]
- Priskin, J. Assessment of natural resources for nature-based tourism: The case of the Central Coast Region of Western Australia. Tour. Manag. 2001, 22, 637–648. [Google Scholar] [CrossRef]
- Assaker, G.; Hallak, R.; Vinzi, V.E.; O’Connor, P. An empirical operationalization of countries’ destination competitiveness using partial least squares modeling. J. Travel Res. 2014, 53, 26–43. [Google Scholar] [CrossRef]
- Bazargani, R.H.Z.; Kiliç, H. Tourism competitiveness and tourism sector performance: Empirical insights from new data. J. Hosp. Tour. Manag. 2021, 46, 73–82. [Google Scholar] [CrossRef]
- Goffi, G.; Cucculelli, M. Explaining tourism competitiveness in small and medium destinations: The Italian case. Curr. Issues Tour. 2019, 22, 2109–2139. [Google Scholar] [CrossRef]
- Goffi, G.; Cucculelli, M.; Masiero, L. Fostering tourism destination competitiveness in developing countries: The role of sustainability. J. Clean. Prod. 2019, 209, 101–115. [Google Scholar] [CrossRef]
- Michael, N.; Reisinger, Y.; Hayes, J.P. The UAE’s tourism competitiveness: A business perspective. Tour. Manag. Perspect. 2019, 30, 53–64. [Google Scholar] [CrossRef]
- Ren, C.; Blichfeldt, B.S. One clear image? Challenging simplicity in place branding. Scand. J. Hosp. Tour. 2011, 11, 416–434. [Google Scholar] [CrossRef]
- Abreu-Novais, M.; Ruhanen, L.; Arcodia, C. Destination competitiveness: What we know, what we know but shouldn’t and what we don’t know but should. Curr. Issues Tour. 2016, 19, 492–512. [Google Scholar] [CrossRef]
- Gomezelj, D.O.; Mihalič, T. Destination competitiveness—Applying different models, the case of Slovenia. Tour. Manag. 2008, 29, 294–307. [Google Scholar] [CrossRef]
- Claver-Cortés, E.; Molina-Azorı, J.F.; Pereira-Moliner, J. Competitiveness in mass tourism. Ann. Tour. Res. 2007, 34, 727–745. [Google Scholar] [CrossRef]
- Rodríguez-Díaz, M.; Espino-Rodríguez, T.F. A model of strategic evaluation of a tourism destination based on internal and relational capabilities. J. Travel Res. 2008, 46, 368–380. [Google Scholar] [CrossRef]
- Dwyer, L.; Forsyth, P.; Rao, P. The price competitiveness of travel and tourism: A comparison of 19 destinations. Tour. Manag. 2000, 21, 9–22. [Google Scholar] [CrossRef]
- Crouch, G.I.; Ritchie, J.R. Destination competitiveness and its implications for host-community QOL. In Handbook of Tourism and Quality-of-Life Research; Springer: Dordrecht, The Netherlands, 2012; pp. 491–513. [Google Scholar]
- Li, G.; Song, H.; Cao, Z.; Wu, D.C. How competitive is Hong Kong against its competitors? An econometric study. Tour. Manag. 2013, 36, 247–256. [Google Scholar]
- Reinius, S.W.; Fredman, P. Protected areas as attractions. Ann. Tour. Res. 2007, 34, 839–854. [Google Scholar] [CrossRef]
- Arnberger, A.; Eder, R.; Allex, B.; Sterl, P.; Burns, R.C. Relationships between national-park affinity and attitudes towards protected area management of visitors to the Gesaeuse National Park, Austria. For. Policy Econ. 2012, 19, 48–55. [Google Scholar] [CrossRef]
- Cordente-Rodríguez, M.; Mondéjar-Jiménez, J.; Villanueva-Álvaro, J. Sustainability of nature: The power of the type of visitors. Environ. Eng. Manag. J. 2014, 13, 2437–2447. [Google Scholar] [CrossRef]
- Kruger, M.; Viljoen, A.; Saayman, M. Who visits the Kruger National Park, and why? Identifying target markets. J. Travel Tour. Mark. 2017, 34, 312–340. [Google Scholar] [CrossRef]
- Croes, R.; Kubickova, M. From potential to ability to compete: Towards a performance-based tourism competitiveness index. J. Destin. Mark. Manag. 2013, 2, 146–154. [Google Scholar] [CrossRef]
- Hanafiah, M.H.; Hemdi, M.A.; Ahmad, I. Tourism destination competitiveness: Towards a performance-based approach. Tour. Econ. 2016, 22, 629–636. [Google Scholar] [CrossRef]
- Luo, W. Evaluating tourist destination performance: Expanding the sustainability concept. Sustainability 2018, 10, 516. [Google Scholar] [CrossRef]
- Botti, L. Destination Performance. In Encyclopedia of Tourism Management and Marketing; Edward Elgar Publishing: Northampton, MA, USA, 2022. [Google Scholar]
- Uysal, M.; Perdue, R.R.; Sirgy, M.J. Handbook of Tourism and Quality-of-Life Research: Enhancing the Lives of Tourists and Residents of Host Communities; Springer: Dordrecht, The Netherlands, 2012. [Google Scholar]
- Pırnar, I.; Günlü, E. Destination management and quality-of-life. In Handbook of Tourism and Quality-of-Life Research; Springer: Dordrecht, The Netherlands, 2012; pp. 529–545. [Google Scholar]
- Uysal, M.; Sirgy, M.J.; Woo, E.; Kim, H.L. Quality of life (QOL) and well-being research in tourism. Tour. Manag. 2016, 53, 244–261. [Google Scholar] [CrossRef]
- Andereck, K.L.; Nyaupane, G.P. Exploring the nature of tourism and quality of life perceptions among residents. J. Travel Res. 2011, 50, 248–260. [Google Scholar] [CrossRef]
- Carmichael, B.A. Linking quality tourism experiences, residents’ quality of life, and quality experiences for tourists. In Quality Tourism Experiences; Elsevier Butterworth-Heinemann: Burlington, VT, USA, 2006; pp. 115–135. [Google Scholar]
- Ridderstaat, J.; Croes, R.; Nijkamp, P. The tourism development–quality of life nexus in a small island destination. J. Travel Res. 2016, 55, 79–94. [Google Scholar] [CrossRef]
- Olya, H.G.; Gavilyan, Y. Configurational models to predict residents’ support for tourism development. J. Travel Res. 2017, 56, 893–912. [Google Scholar] [CrossRef]
- Ramkissoon, H.; Mavondo, F.; Uysal, M. Social involvement and park citizenship as moderators for quality-of-life in a national park. J. Sustain. Tour. 2018, 26, 341–361. [Google Scholar] [CrossRef]
- Perdue, R.R.; Long, P.T.; Allen, L. Resident support for tourism development. Ann. Tour. Res. 1990, 17, 586–599. [Google Scholar] [CrossRef]
- Zhang, J. Weighing and realizing the environmental, economic and social goals of tourism development using an analytic network process-goal programming approach. J. Clean. Prod. 2016, 127, 262–273. [Google Scholar] [CrossRef]
- Barney, J. Firm resources and sustained competitive advantage. J. Manag. 1991, 17, 99–120. [Google Scholar] [CrossRef]
- Hoopes, D.G.; Madsen, T.L.; Walker, G. Guest editors’ introduction to the special issue: Why is there a resource-based view? Toward a theory of competitive heterogeneity. Strateg. Manag. J. 2003, 24, 889–902. [Google Scholar]
- Chahal, H.; Gupta, M.; Bhan, N.; Cheng, T. Operations management research grounded in the resource-based view: A meta-analysis. Int. J. Prod. Econ. 2020, 230, 107805. [Google Scholar] [CrossRef]
- Savino, M.M.; Shafiq, M. An extensive study to assess the sustainability drivers of production performances using a resource-based view and contingency analysis. J. Clean. Prod. 2018, 204, 744–752. [Google Scholar] [CrossRef]
- Peteraf, M.A.; Barney, J.B. Unraveling the resource-based tangle. Manag. Decis. Econ. 2003, 24, 309–323. [Google Scholar] [CrossRef]
- Wernerfelt, B. A resource view based of the firm. Strateg. Manag. J. 1984, 5, 171–180. [Google Scholar] [CrossRef]
- Zhou, Y.; Maumbe, K.; Deng, J.; Selin, S.W. Resource-based destination competitiveness evaluation using a hybrid analytic hierarchy process (AHP): The case study of West Virginia. Tour. Manag. Perspect. 2015, 15, 72–80. [Google Scholar] [CrossRef]
- Hooley, G.; Broderick, A.; Möller, K. Competitive positioning and the resource-based view of the firm. J. Strateg. Mark. 1998, 6, 97–116. [Google Scholar] [CrossRef]
- Cucculelli, M.; Goffi, G. Does sustainability enhance tourism destination competitiveness? Evidence from Italian Destinations of Excellence. J. Clean. Prod. 2016, 111, 370–382. [Google Scholar]
- Fossgard, K.; Fredman, P. Dimensions in the nature-based tourism experiencescape: An explorative analysis. J. Outdoor Recreat. Tour. 2019, 28, 100219. [Google Scholar] [CrossRef]
- Europarc-Spain Anuario 2020 del Estado de las Áreas Protegidas en España. Ed. Fundación Fernando González Bernáldez. 2021. Available online: https://redeuroparc.org/wp-content/uploads/2022/01/anuario2020finalweb.pdf (accessed on 1 September 2022).
- UNESCO Statutory Framework of the World Network of Biosphere Reserves. Ed. UNESCO’s Man and the Biosphere Programme. 2020. Available online: https://unesdoc.unesco.org/ark:/48223/pf0000373378 (accessed on 1 September 2022).
- Beunen, R.; Regnerus, H.D.; Jaarsma, C.F. Gateways as a means of visitor management in national parks and protected areas. Tour. Manag. 2008, 29, 138–145. [Google Scholar] [CrossRef]
- Boyd, S. Tourism and National Parks: Wilderness and Culture. In Companion of Tourism; John Wiley & Sons, Inc.: Hoboken, NJ, USA, 2004; pp. 473–483. [Google Scholar]
- Puhakka, R.; Sarkki, S.; Cottrell, S.P.; Siikamäki, P. Local discourses and international initiatives: Sociocultural sustainability of tourism in Oulanka National Park, Finland. J. Sustain. Tour. 2009, 17, 529–549. [Google Scholar] [CrossRef]
- Tillé, Y. Sampling and Estimation from Finite Populations; John Wiley & Sons: Hoboken, NJ, USA, 2020. [Google Scholar]
- Enright, M.J.; Newton, J. Tourism destination competitiveness: A quantitative approach. Tour. Manag. 2004, 25, 777–788. [Google Scholar] [CrossRef]
- Kozak, M. Destination competitiveness measurement: Analysis of effective factors and indicators. In Proceedings of the 39th Congress of the European Regional Science Association: “Regional Cohesion and Competitiveness in 21st Century Europe”, Dublin, Ireland, 23–27 August 1999. [Google Scholar]
- Liburd, J.J.; Benckendorff, P.; Carlsen, J. Tourism and quality-of-life: How does tourism measure up? In Handbook of Tourism and Quality-of-Life Research; Springer: Dordrecht, The Netherlands, 2012; pp. 105–132. [Google Scholar] [CrossRef]
- Sirgy, M.J.; Cornwell, T. Further validation of the Sirgy et al.’s measure of community quality of life. Soc. Indic. Res. 2001, 56, 125–143. [Google Scholar] [CrossRef]
- Flores Ruiz, D. Competitividad Sostenible de los Espacios Naturales Protegidos como Destinos Turísticos: Un Análisis Comparativo de los Parques Naturales Sierra de Aracena y Picos de Aroche y Sierras de Cazorla, Segura y Las Villas; Universidad de Huelva: Huelva, Spain, 2008. [Google Scholar]
- Hadi, A.S.; Chatterjee, S. Regression Analysis by Example; John Wiley & Sons: Hoboken, NJ, USA, 2015. [Google Scholar]
- Crouch, G.I. Destination competitiveness: An analysis of determinant attributes. J. Travel Res. 2011, 50, 27–45. [Google Scholar] [CrossRef]
- Spencer, D.M.; Nsiah, C. The economic consequences of community support for tourism: A case study of a heritage fish hatchery. Tour. Manag. 2013, 34, 221–230. [Google Scholar] [CrossRef]
- Ribes, J.F.P.; Rodríguez, A.R.; Jiménez, M.S. Determinants of the competitive advantage of residential tourism destinations in Spain. Tour. Econ. 2011, 17, 373–403. [Google Scholar] [CrossRef]


Publisher’s Note: MDPI stays neutral with regard to jurisdictional claims in published maps and institutional affiliations. |
© 2022 by the authors. Licensee MDPI, Basel, Switzerland. This article is an open access article distributed under the terms and conditions of the Creative Commons Attribution (CC BY) license (https://creativecommons.org/licenses/by/4.0/).