
Air Quality and the Spatial-Temporal Differentiation of Mechanisms Underlying Chinese Urban Human Settlements


Abstract
:1. Introduction
2. Data Sources and Research Methods
2.1. Data Sources
2.2. Research Methods
2.2.1. Weight Assignment
2.2.2. Spatial-Temporal Differentiation Measurement Model
2.2.3. Calculation Method of Influencing Factors
3. Results
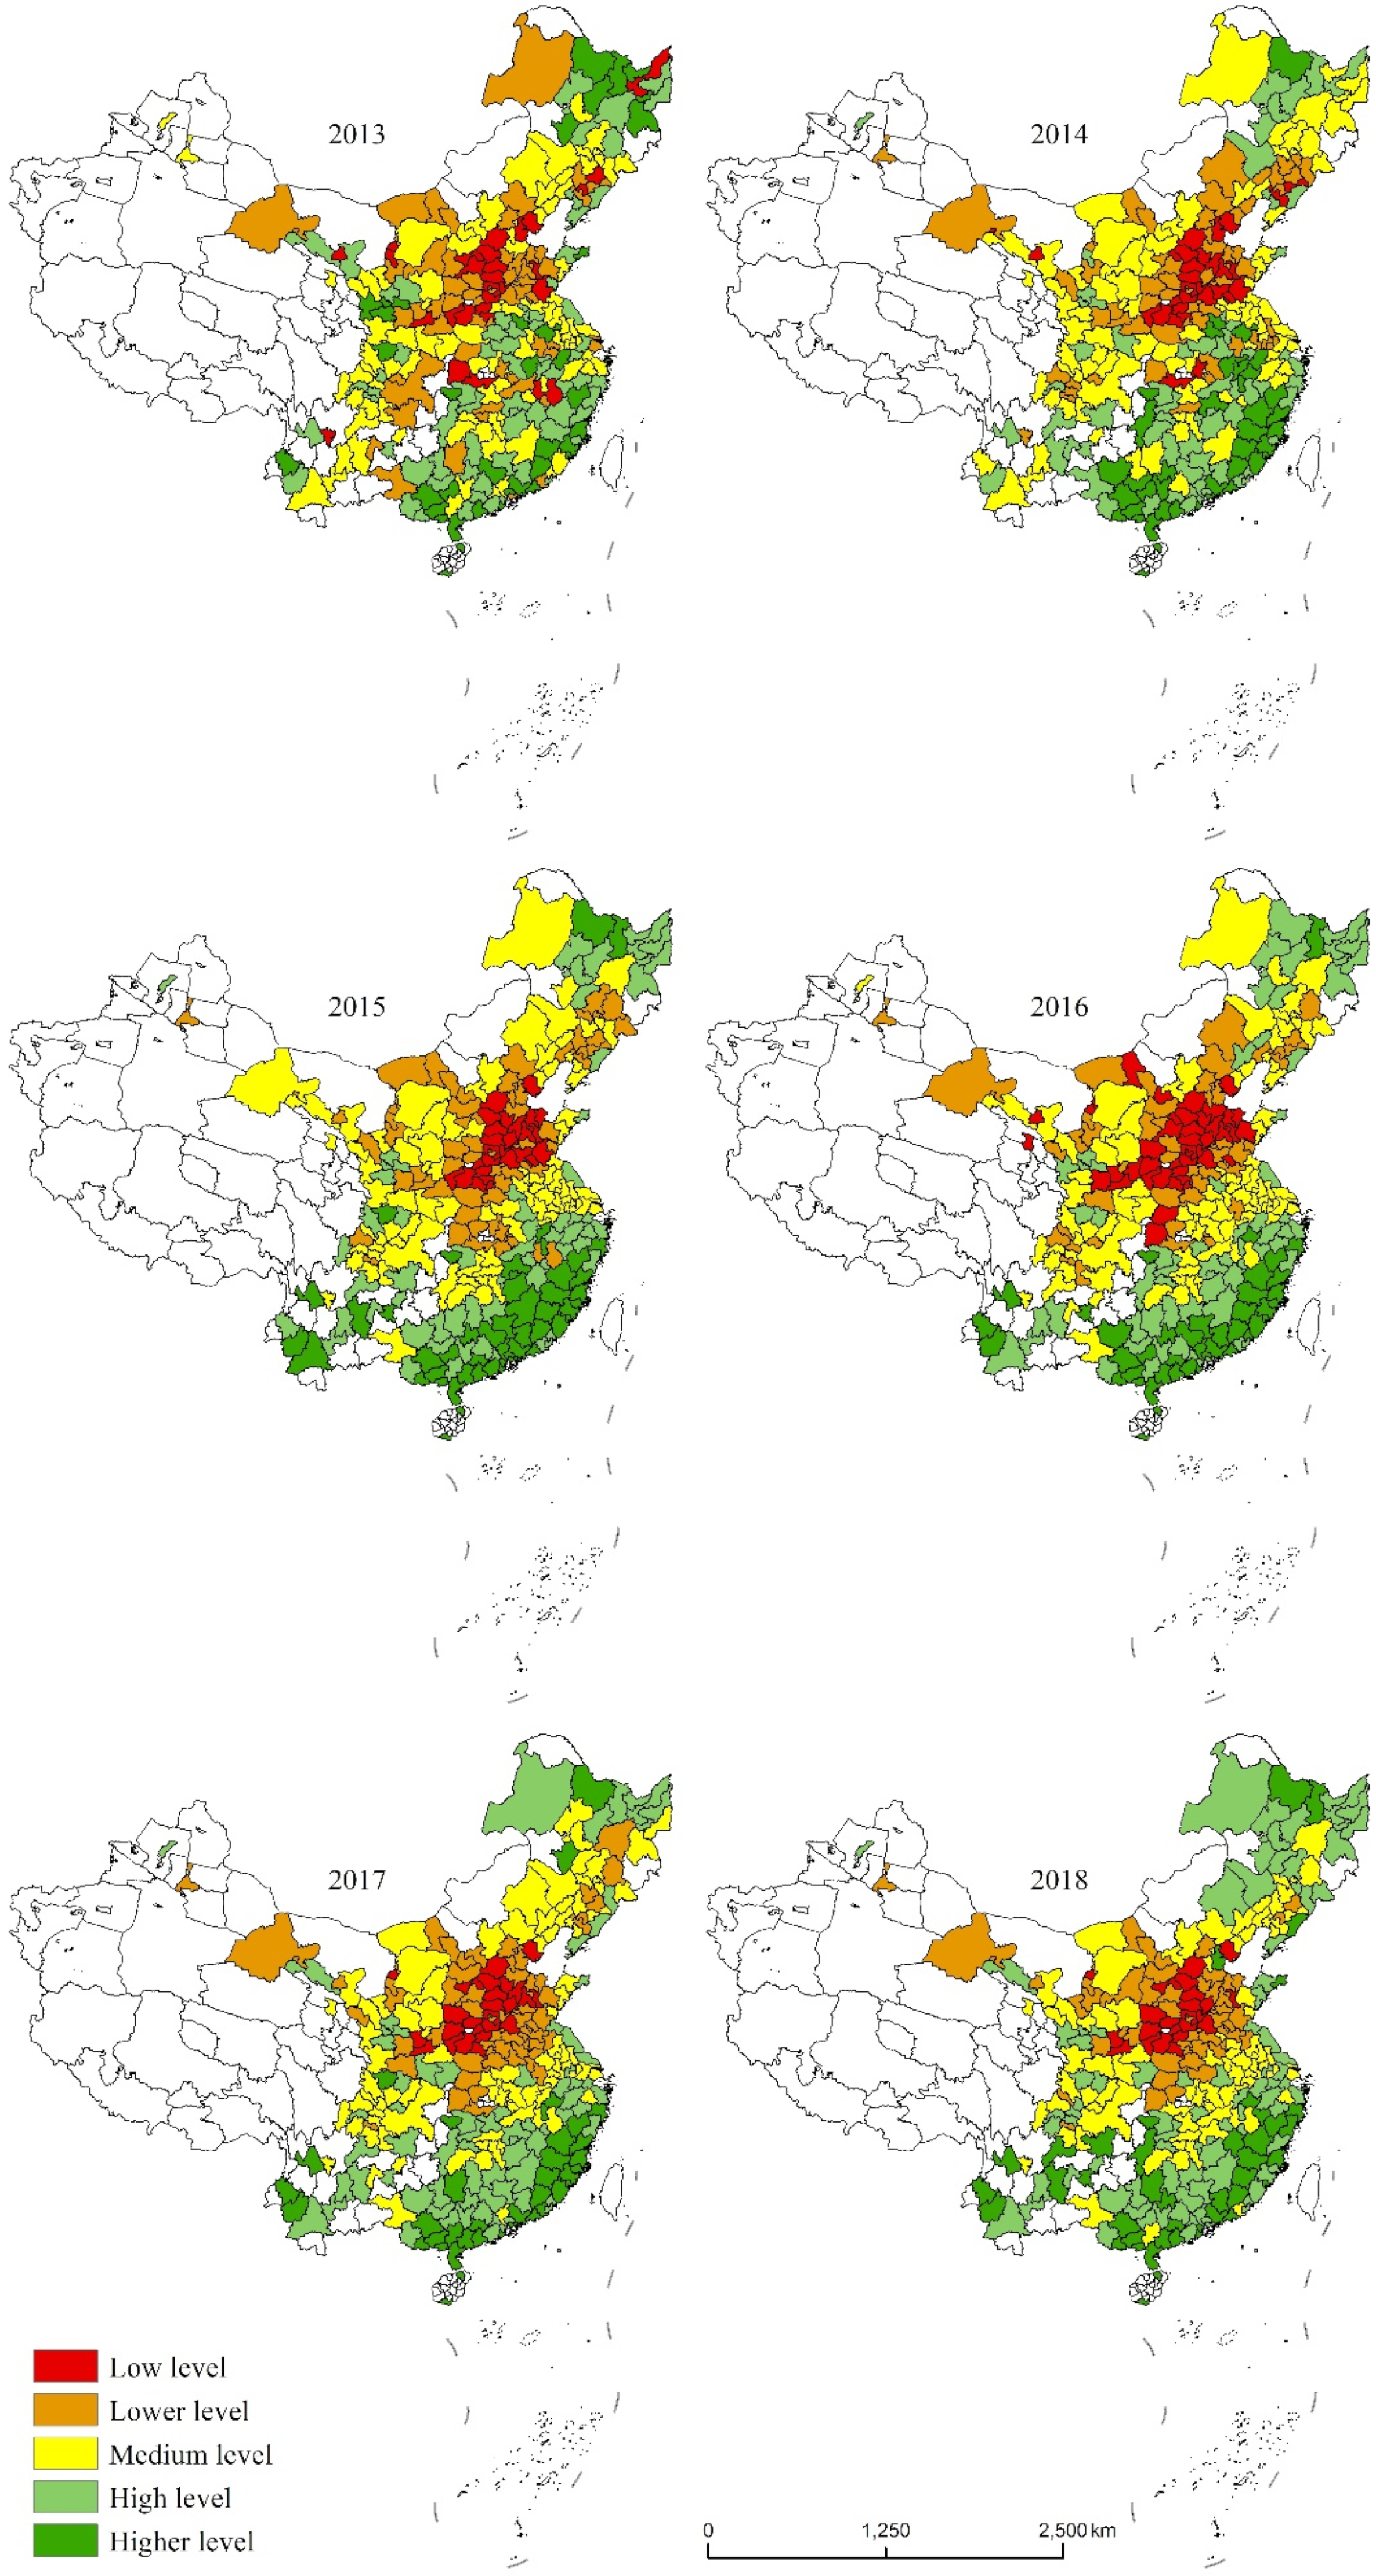
3.1. Spatial-Temporal Distribution Characteristics of Human Settlements
3.1.1. Weight Calculation
3.1.2. Spatial State Mode
3.1.3. Pattern Evolution
3.2. Factors Affecting the Distribution Difference of Human Settlements
4. Discussion
4.1. Analysis of Spatial-Temporal Variation and Influence Factors
4.2. Limitations
5. Conclusions
Author Contributions
Funding
Data Availability Statement
Conflicts of Interest
References
- Song, C.; He, J.; Wu, L.; Jin, T.; Chen, X.; Li, R.; Ren, P.; Zhang, L.; Mao, H. Health burden attributable to ambient PM2.5 in China. Environ. Pollut. 2017, 223, 575–586. [Google Scholar] [CrossRef] [PubMed]
- Liu, Z.; Yu, L. Stay or Leave? The Role of Air Pollution in Urban Migration Choices. Ecol. Econ. 2020, 177, 106780. [Google Scholar] [CrossRef]
- Wu, L. Introduction to Science of Human Settlement; China Architecture & Building Press: Beijing, China, 2001; ISBN 978-7-112-04506-8. [Google Scholar]
- Grecu, S.P.; Mihailescu, B.C.; Sluser, B.M. Statistical approach of environmental quality management and political decision—Making at local levels: Case study IASI city, Romania. Environ. Eng. Manag. J. 2020, 19, 517–530. [Google Scholar] [CrossRef]
- Sodiq, A.; Baloch, A.A.B.; Khan, S.A.; Sezer, N.; Mahmoud, S.; Jama, M.; Abdelaal, A. Towards modern sustainable cities: Review of sustainability principles and trends. J. Clean. Prod. 2019, 227, 972–1001. [Google Scholar] [CrossRef]
- Tanguay, G.A.; Rajaonson, J.; Lefebvre, J.; Lanoie, P. Measuring the sustainability of cities: An analysis of the use of local indicators. Ecol. Indic. 2010, 10, 407–418. [Google Scholar] [CrossRef]
- Bigio, A.G.; Dahiya, B. Urban Environment and Infrastructure: Toward Livable Cities; World Bank Publications: Washington, DC, USA, 2004; ISBN 0821357964. [Google Scholar]
- Zhang, W.; Zhan, L.; Tang, Y.; Zhan, D. Theory and Practice of Harmonious and Livable City Construction; Science Press: Beijing, China, 2016; ISBN 978-7-03-048403-1. [Google Scholar]
- Dahiya, B.; Das, A. New Urban Agenda in Asia-Pacific: Governance for Sustainable and Inclusive Cities; Springer Singapore Pte. Limited: Singapore, 2019; ISBN 9789811367083. [Google Scholar]
- Shaparev, N.; Tokarev, A.; Yakubailik, O. The state of the atmosphere in the city of Krasnoyarsk (Russia) in indicators of sustainable development. Int. J. Sust. Dev. World 2020, 27, 349–357. [Google Scholar] [CrossRef]
- Corbane, C.; Martino, P.; Panagiotis, P.; Aneta, F.J.; Michele, M.; Sergio, F.; Marcello, S.; Daniele, E.; Gustavo, N.; Thomas, K. The grey-green divide: Multi-temporal analysis of greenness across 10,000 urban centres derived from the Global Human Settlement Layer (GHSL). Int. J. Digit. Earth 2020, 13, 101–118. [Google Scholar] [CrossRef]
- Chai, F.; Gao, J.; Chen, Z.; Wang, S.; Zhang, Y.; Zhang, J.; Zhang, H.; Yun, Y.; Ren, C. Spatial and temporal variation of particulate matter and gaseous pollutants in 26 cities in China. J. Environ. Sci.-China 2014, 26, 75–82. [Google Scholar] [CrossRef]
- Yang, J.; Ren, J.; Sun, D.; Xiao, X.; Xia, J.C.; Jin, C.; Li, X. Understanding land surface temperature impact factors based on local climate zones. Sustain. Cities Soc. 2021, 69, 102818. [Google Scholar] [CrossRef]
- Ackermann, K.; Angus, S.D. A Resource Efficient Big Data Analysis Method for the Social Sciences: The Case of Global IP Activity. Procedia Comput. Sci. 2014, 29, 2360–2369. [Google Scholar] [CrossRef] [Green Version]
- Meerow, S.; Newell, J.P. Spatial planning for multifunctional green infrastructure: Growing resilience in Detroit. Landscape Urban Plan. 2017, 159, 62–75. [Google Scholar] [CrossRef]
- Otto, I.M.; Donges, J.F.; Cremades, R.; Bhowmik, A.; Hewitte, R.J.; Lucht, W.; Rockstroem, J.; Allerberger, F.; Mccaffrey, M.; Doe, S.S.P.; et al. Social tipping dynamics for stabilizing Earth’s climate by 2050. Proc. Natl. Acad. Sci. USA 2020, 117, 2354–2365. [Google Scholar] [CrossRef] [Green Version]
- Achakulwisut, P.; Brauer, M.; Hystad, P.; Anenberg, S.C. Global, national, and urban burdens of paediatric asthma incidence attributable to ambient NO2 pollution: Estimates from global datasets. Lancet Planet. Health 2019, 3, E166–E178. [Google Scholar] [CrossRef] [Green Version]
- Chay, K.; Dobkin, C.; Greenstone, M. The Clean Air Act of 1970 and Adult Mortality. J. Risk Uncertain. 2003, 27, 279–300. [Google Scholar] [CrossRef]
- Solecki, W.; Seto, K.C.; Balk, D.; Bigio, A.; Boone, C.G.; Creutzig, F.; Fragkias, M.; Lwasa, S.; Marcotullio, P.; Romero-Lankao, P.; et al. A conceptual framework for an urban areas typology to integrate climate change mitigation and adaptation. Urban Climate 2015, 14, 116–137. [Google Scholar] [CrossRef]
- Aliyu, A.A.; Amadu, L. Urbanization, Cities, and Health: The Challenges to Nigeria—A Review. Ann. Afr. Med. 2017, 16, 149–158. [Google Scholar] [CrossRef] [PubMed]
- Baiocchi, G.; Creutzig, F.; Minx, J.; Pichler, P. A spatial typology of human settlements and their CO2 emissions in England. Global Environ. Chang. 2015, 34, 13–21. [Google Scholar] [CrossRef]
- Cole, M.A.; Neumayer, E. Examining the Impact of Demographic Factors on Air Pollution. Popul. Environ. 2004, 26, 5–21. [Google Scholar] [CrossRef] [Green Version]
- Zhang, W.; Guan, Z.; Li, J.; Su, Z.; Deng, W.; Li, W. Chinese cities’ air quality pattern and correlation. J. Stat. Mech.-Theory E 2020, 2020, 43403. [Google Scholar] [CrossRef]
- Wu, F.; Yang, X.; Shen, Z.; Yi, Z. Long-term trends and spatiotemporal variations of climate comfort in China during 1966–2016. Therm. Sci. 2020, 24, 2445–2453. [Google Scholar] [CrossRef]
- Yang, J.; Zhan, Y.; Xiao, X.; Xia, J.C.; Sun, W.; Li, X. Investigating the diversity of land surface temperature characteristics in different scale cities based on local climate zones. Urban Clim. 2020, 34, 100700. [Google Scholar] [CrossRef]
- Guo, A.; Yang, J.; Sun, W.; Xiao, X.; Xia Cecilia, J.; Jin, C.; Li, X. Impact of urban morphology and landscape characteristics on spatiotemporal heterogeneity of land surface temperature. Sustain. Cities Soc. 2020, 63, 102443. [Google Scholar] [CrossRef]
- Tang, L.; Ruth, M.; He, Q.; Mirzaee, S. Comprehensive evaluation of trends in human settlements quality changes and spatial differentiation characteristics of 35 Chinese major cities. Habitat Int. 2017, 70, 81–90. [Google Scholar] [CrossRef]
- Sykes, O.; Demaziere, C.; Nurse, A. Introduction ‘Green cities’ as urban models: Contributing to new urban agendas, but how? Town Plan. Rev. 2020, 91, 349–355. [Google Scholar] [CrossRef]
- Wang, F.; An, L.; Dang, A.; Han, J.; Miao, C.; Wang, J.; Zhang, G.; Zhao, Y. Human-land coupling and sustainable human settlements in the Yellow River Basin. Geogr. Res. 2020, 39, 1707–1724. [Google Scholar] [CrossRef]
- Qu, L.; Li, Y.; Feng, W. Spatial-temporal differentiation of ecologically-sustainable land across selected settlements in China: An urban-rural perspective. Ecol. Indic. 2020, 112, 105783. [Google Scholar] [CrossRef]
- Li, G.; Jiang, C.; Du, J.; Jia, Y.; Bai, J. Spatial differentiation characteristics of internal ecological land structure in rural settlements and its response to natural and socio-economic conditions in the Central Plains, China. Sci. Total Environ. 2020, 709, 135932. [Google Scholar] [CrossRef] [PubMed]
- Yang, J.; Wang, Y.; Xue, B.; Li, Y.; Xiao, X.; Xia, J.C.; He, B. Contribution of urban ventilation to the thermal environment and urban energy demand: Different climate background perspectives. Sci. Total. Environ. 2021, 795, 148791. [Google Scholar] [CrossRef] [PubMed]
- Sofeska, E. Understanding the Livability in a City through Smart Solutions and Urban Planning Toward Developing Sustainable Livable Future of the City of Skopje. Procedia Environ. Sci. 2017, 37, 442–453. [Google Scholar] [CrossRef]
- Shamsuddin, S.; Hassan, N.R.A.; Bilyamin, S.F.I. Walkable Environment in Increasing the Liveability of a City. Procedia-Soc. Behav. Sci. 2012, 50, 167–178. [Google Scholar] [CrossRef] [Green Version]
- Luo, X.; Yang, J.; Sun, W.; He, B. Suitability of human settlements in mountainous areas from the perspective of ventilation: A case study of the main urban area of Chongqing. J. Clean. Prod. 2021, 310, 127467. [Google Scholar] [CrossRef]
- Zhang, W. The core framework of the livable city construction. Geogr. Res. 2016, 35, 205–213. [Google Scholar] [CrossRef]
- Yang, J.; You, H.; Zhang, Y.; Jin, C. Research progress on human settlements: From traditional data to big data+. Prog. Geogr. 2020, 39, 166–176. [Google Scholar] [CrossRef]
- Liu, J.; Zhang, W. Review of habitat environment assessment method. Urban Dev. Studies 2014, 21, 46–52. [Google Scholar] [CrossRef]
- Wang, Y.; Jung, K.; Yeo, G.; Chou, C. Selecting a cruise port of call location using the fuzzy-AHP method: A case study in East Asia. Tour. Manag. 2014, 42, 262–270. [Google Scholar] [CrossRef]
- Mccarty, J.; Kaza, N. Urban form and air quality in the United States. Landsc. Urban Plan. 2015, 139, 168–179. [Google Scholar] [CrossRef]
- Wang, Z.; Fang, C.; Xu, G.; Pan, Y. Spatial-temporal characteristics of the PM2.5 in China in 2014. Acta Geogr. Sin. 2015, 70, 1720–1734. [Google Scholar] [CrossRef]
- Wang, Y.; Lu, Y.; Zhu, M.; Ding, Z. General Characteristics and Knowledge Maps Visualization Analysis of Human Settlement Research in China. Trop. Geogr. 2020, 40, 498–514. [Google Scholar] [CrossRef]
- Melchiorri, M.; Florczyk, A.J.; Freire, S.; Schiavina, M.; Pesaresi, M.; Kemper, T. Unveiling 25 Years of Planetary Urbanization with Remote Sensing: Perspectives from the Global Human Settlement Layer. Remote. Sens. 2018, 10, 768. [Google Scholar] [CrossRef] [Green Version]
- Hutyra, L.R.; Duren, R.; Gurney, K.R.; Grimm, N.; Kort, E.A.; Larson, E.; Shrestha, G. Urbanization and the carbon cycle: Current capabilities and research outlook from the natural sciences perspective. Earths Future 2014, 2, 473–495. [Google Scholar] [CrossRef] [Green Version]
- Shen, Y.; Sun, F.; Che, Y. Public green spaces and human wellbeing: Mapping the spatial inequity and mismatching status of public green space in the Central City of Shanghai. Urban For. Urban Green. 2017, 27, 59–68. [Google Scholar] [CrossRef]
- Yang, J.; Yang, Y.; Sun, D.; Jin, C.; Xiao, X. Influence of urban morphological characteristics on thermal environment. Sustain. Cities Soc. 2021, 72, 103045. [Google Scholar] [CrossRef]
- Krishnan, A.R.; Kasim, M.M.; Hamid, R.; Ghazali, M.F. A Modified CRITIC Method to Estimate the Objective Weights of Decision Criteria. Symmetry 2021, 13, 973. [Google Scholar] [CrossRef]
- Dadhich, A.P.; Goyal, R.; Dadhich, P.N. Assessment of spatio-temporal variations in air quality of Jaipur city, Rajasthan, India. Egypt. J. Remote. Sens. Space Sci. 2018, 21, 173–181. [Google Scholar] [CrossRef]
- Wang, W.; Samat, A.; Abuduwaili, J.; Ge, Y. Spatio-Temporal Variations of Satellite-Based PM2.5 Concentrations and Its Determinants in Xinjiang, Northwest of China. Int. J. Env. Res. Pub. Health 2020, 17, 2157. [Google Scholar] [CrossRef] [Green Version]
- Zhao, L.; Zhang, X.; Zhao, F. Evaluating the impact of high-speed rail on county-level air quality in China. Transp. Res. D-Tr. E. 2020, 86, 102485. [Google Scholar] [CrossRef]
- Zhang, Z.; Xiao, R.; Shortridge, A.; Wu, J. Spatial point pattern analysis of human settlements and geographical associations in eastern coastal China—A case study. Int. J. Environ. Res. Pub. Health 2014, 11, 2818–2833. [Google Scholar] [CrossRef]
- Yang, X.; Geng, L.; Zhou, K. The construction and examination of social vulnerability and its effects on PM2.5 globally: Combining spatial econometric modeling and geographically weighted regression. Environ. Sci. Pollut. Res. Int. 2021, 28, 26732–26746. [Google Scholar] [CrossRef] [PubMed]
- Diao, B.; Ding, L.; Su, P.; Cheng, J. The Spatial-Temporal Characteristics and Influential Factors of NOx Emissions in China: A Spatial Econometric Analysis. Int. J. Env. Res. Pub. Health 2018, 15, 1405. [Google Scholar] [CrossRef] [Green Version]
- Su, Y.; Lu, C.; Lin, X.; Zhong, L.; Gao, Y.; Lei, Y. Analysis of Spatio-temporal Characteristics and Driving Forces of Air Quality in the Northern Coastal Comprehensive Economic Zone, China. Sustainability 2020, 12, 536. [Google Scholar] [CrossRef] [Green Version]
- He, H.; Peng, C. The spatial-temporal evolution and the interactive effect between urban industrial structure transformation and land use efficiency. Geogr. Res. 2017, 36, 1271–1282. [Google Scholar] [CrossRef]
- Xue, Q.; Yang, X. Evaluation of the suitability of human settlement environment in Shanghai city based o fuzzy cluster analysis. Therm. Sci. 2020, 24, 2543–2551. [Google Scholar] [CrossRef]
- Xue, Q.; Yang, X.; Wu, F. A two-stage system analysis of real and pseudo urban human settlements in China. J. Clean. Prod. 2021, 293, 126272. [Google Scholar] [CrossRef]
- Luo, J.; Zhou, T.; Du, P.; Xu, Z. Spatial-temporal variations of natural suitability of human settlement environment in the Three Gorges Reservoir Area—A case study in Fengjie County, China. Front. Earth Sci.-Prc 2019, 13, 1–17. [Google Scholar] [CrossRef]
- He, B.; Zhao, D.; Xiong, K.; Qi, J.; Ulpiani, G.; Pignatta, G.; Prasad, D.; Jones, P. A framework for addressing urban heat challenges and associated adaptive behavior by the public and the issue of willingness to pay for heat resilient infrastructure in Chongqing, China. Sustain. Cities Soc. 2021, 75, 103361. [Google Scholar] [CrossRef]
- Jin, P.; Li, X. Characteristics and Spatial-temporal Differences of Urban Human Settlement Environment in China. Sci. Geogr. Sin. 2012, 32, 521–529. [Google Scholar] [CrossRef]
- Li, C. Comprehensive evaluation of human settlements in 36 central cities of China. J. Arid. Land Resour. Environ. 2017, 31, 1–6. [Google Scholar] [CrossRef]
- Zhang, W. The Basic Pattern and Optimization Countermeasures of Human Settlement in China. Think Tank Theory Pract. 2019, 4, 67–74. [Google Scholar] [CrossRef]
- Li, C. The spatial and temporal characteristics of the livable degree of cities in China. J. Arid. Land Resour. Environ. 2014, 28, 1–7. [Google Scholar] [CrossRef]
- Sun, J.; Zhou, T. Health risk assessment of China’s main air pollutants. BMC Public Health 2017, 17, 212. [Google Scholar] [CrossRef] [Green Version]
- Wang, Y.; Duan, X.; Wang, L. Spatial-Temporal Evolution of PM2.5 Concentration and its Socioeconomic Influence Factors in Chinese Cities in 2014–2017. Int. J. Env. Res. Pub. Health 2019, 16, 985. [Google Scholar] [CrossRef] [PubMed] [Green Version]
- Yang, W. The Study on Urban Development Quality and Spatial Differentiation—Based on Data Analysis for Cities at the Prefecture and above Levels; China Agricultural University: Beijing, China, 2017. [Google Scholar]
- Xiao, Y.; Tian, Y.; Xu, W.; Liu, J.; Wan, Z.; Zhang, X.; Liu, X. Study on the Spatiotemporal Characteristics and Socioeconomic Driving Factors of Air Pollution in China. Ecol. Environ. Sci. 2018, 27, 518–526. [Google Scholar] [CrossRef]
- Bao, H.; Shan, L.; Wang, Y.; Jiang, Y.; Lee, C.; Cui, X. How Does Local Real Estate Investment Influence Neighborhood PM2.5 Concentrations? A Spatial Econometric Analysis. Land 2021, 10, 518. [Google Scholar] [CrossRef]


| Data Type | Specific Variables | Data Sources |
|---|---|---|
| Administrative map | Urban planning | Standard map service system (http://bzdt.ch.mnr.gov.cn/) |
| Air quality monitoring data | AQI, SO2, NO2, PM2.5, PM10, CO, O3 | 1. Air quality online monitoring and analysis platform (https://www.aqistudy.cn/); 2. Air quality history data (https://aqicn.org/city/dalian/cn/) 3. Atmospheric Composition Analysis Group: Surface PM2.5 (http://fizz.phys.dal.ca/~atmos/martin/?page_id=140) 4. Earth Observing System Data and Information System (https://sedac.ciesin.columbia.edu/data/set/sdei-global-annual-gwr-pm2-5-modis-misr-seawifs-aod/data-download) |
| Meteorological data | Temperature, rainfall, wind speed, and humidity | National Meteorological Science Data Center (https://data.cma.cn/data/cdcindex/cid/0b9164954813c573.html) |
| Urban social and economic development index data | Evaluation index: highway freight volume, green coverage rate, second output value, etc. Driving mechanism: urbanization rate, industrial structure, education expenditure, etc. | Urban Statistical Yearbook, Water Resources Bulletin, Environmental Quality Report, China Environmental Statistics Yearbook, China Energy Statistical Yearbook, Bulletin on National Economic and Social Development (https://data.stats.gov.cn/; https://navi.cnki.net/knavi/yearbooks/index) |
| Topographic relief | Average urban elevation | Geospatial data cloud (http://www.gscloud.cn/sources/index?pid=302&ptitle=DEM%20%E6%95%B0%E5%AD%97%E9%AB%98%E7%A8%8B%E6%95%B0%E6%8D%AE&rootid=1) DEM digital elevation data, with a resolution of 30 m |
| Residential activity data | Population density and resident activity intensity | 1. Fifth and sixth census data (https://navi.cnki.net/knavi/yearbooks/index) 2. Night light value (https://www.ngdc.noaa.gov/eog/dmsp.html) 3. Urban Statistical Yearbook |
| Comprehensive Evaluation | Data Fluctuation | Correlation between Data | Figure Size |
|---|---|---|---|
| AHP | No | No | Yes |
| CRITIC | Yes | Yes | No |
| Target Layer | Criterion Layer | Index Level | Criterion Attribute |
|---|---|---|---|
| Natural environment | Meteorologic condition | Annual average temperature (°C) | * |
| Average annual relative humidity (%) | * | ||
| Average annual rainfall (mm) | + | ||
| Mean wind speed (m/s) | * | ||
| Air pollutants | AQI | − | |
| PM2.5 (μg/m3) | − | ||
| PM10 (μg/m3) | − | ||
| NO2 (μg/m3) | − | ||
| SO2 (μg/m3) | − | ||
| CO (μg/m3) | − | ||
| O3 (μg/m3) | − | ||
| Cultural environment | Air control | Green and cover rate in the built-up area (%) | + |
| Per capita park green area (m2) | + | ||
| Number of days with good or above Grade 2 air quality (days) | + | ||
| Industrial smoke (powder) dust treatment rate (%) | + | ||
| Economic development | Highway passenger Volume (10,000 persons) | − | |
| Highway freight volume (10,000 tons) | − | ||
| Number of operating vehicles (vehicles) with bus (electric) vehicles | + | ||
| Construction of urban housing (10,000 square meters) | − | ||
| The second output value accounted for the GDP proportion (%) | − | ||
| Urban population density (people/km2) | − | ||
| Energy consumption | Total gas supply (artificial and natural gas) (ten thousand cubic meters) | − | |
| Total LPG gas supply (ton) | − | ||
| Dust industrial dust emission per capita (ton) | − | ||
| Per capita industrial sulfur dioxide emissions (ton) | − |
| Index Level | 2013 Comprehensive Weight | 2014 Comprehensive Weight | 2015 Comprehensive Weight | 2016 Comprehensive Weight | 2017 Comprehensive Weight | 2018 Comprehensive Weight |
|---|---|---|---|---|---|---|
| Annual average temperature (°C) | 0.019186 | 0.015905 | 0.015588 | 0.016971 | 0.015306 | 0.017485 |
| Average annual relative humidity (%) | 0.028799 | 0.024098 | 0.023433 | 0.025708 | 0.024022 | 0.026126 |
| Average annual rainfall (mm) | 0.061549 | 0.061281 | 0.057241 | 0.065213 | 0.054655 | 0.022764 |
| Mean wind speed (m/s) | 0.048002 | 0.049271 | 0.049399 | 0.049417 | 0.046642 | 0.049372 |
| AQI | 0.042333 | 0.055785 | 0.066665 | 0.075073 | 0.069676 | 0.062174 |
| PM2.5 (μg/m3) | 0.054970 | 0.042038 | 0.047260 | 0.051424 | 0.050467 | 0.048745 |
| PM10 (μg/m3) | 0.046133 | 0.038082 | 0.048433 | 0.053159 | 0.047379 | 0.050701 |
| NO2 (μg/m3) | 0.016445 | 0.012690 | 0.017277 | 0.016062 | 0.012890 | 0.015858 |
| SO2 (μg/m3) | 0.017858 | 0.015636 | 0.017651 | 0.019439 | 0.018522 | 0.017570 |
| CO (μg/m3) | 0.015268 | 0.016656 | 0.013529 | 0.016141 | 0.015839 | 0.014444 |
| O3 (μg/m3) | 0.029677 | 0.025952 | 0.033510 | 0.034874 | 0.033105 | 0.019983 |
| Green and cover rate in the built-up area (%) | 0.038226 | 0.030201 | 0.040336 | 0.037270 | 0.028553 | 0.024926 |
| Per capita park green area (m2) | 0.026577 | 0.026536 | 0.024790 | 0.024517 | 0.028778 | 0.032346 |
| Number of days with good or above Grade 2 air quality (days) | 0.125913 | 0.157345 | 0.178139 | 0.126340 | 0.175582 | 0.203186 |
| Industrial smoke (powder) dust treatment rate (%) | 0.119979 | 0.118696 | 0.108977 | 0.110473 | 0.114188 | 0.118164 |
| Highway passenger Volume (10,000 persons) | 0.014979 | 0.016717 | 0.012565 | 0.013426 | 0.015028 | 0.013418 |
| Highway freight volume (10,000 tons) | 0.010766 | 0.016967 | 0.009485 | 0.010096 | 0.016781 | 0.015835 |
| Number of operating vehicles (vehicles) with bus (electric) vehicles | 0.011740 | 0.011242 | 0.013353 | 0.012783 | 0.011584 | 0.012609 |
| Construction of urban housing (10,000 square meters) | 0.022987 | 0.021975 | 0.015328 | 0.015610 | 0.024970 | 0.016155 |
| The second output value accounted for the GDP proportion (%) | 0.076449 | 0.083266 | 0.074329 | 0.078510 | 0.054512 | 0.075008 |
| Urban population density (people/km2) | 0.102396 | 0.092155 | 0.076169 | 0.075524 | 0.086972 | 0.077324 |
| Total gas supply (artificial and natural gas) (ten thousand cubic meters) | 0.006516 | 0.006760 | 0.006070 | 0.006361 | 0.006031 | 0.006240 |
| Total LPG gas supply (ton) | 0.008423 | 0.008166 | 0.009590 | 0.009891 | 0.008388 | 0.011817 |
| Dust industrial dust emission per capita (ton) | 0.017259 | 0.021747 | 0.021214 | 0.024329 | 0.018918 | 0.020891 |
| Per capita industrial sulfur dioxide emissions (ton) | 0.037569 | 0.030831 | 0.019666 | 0.031389 | 0.021214 | 0.026860 |
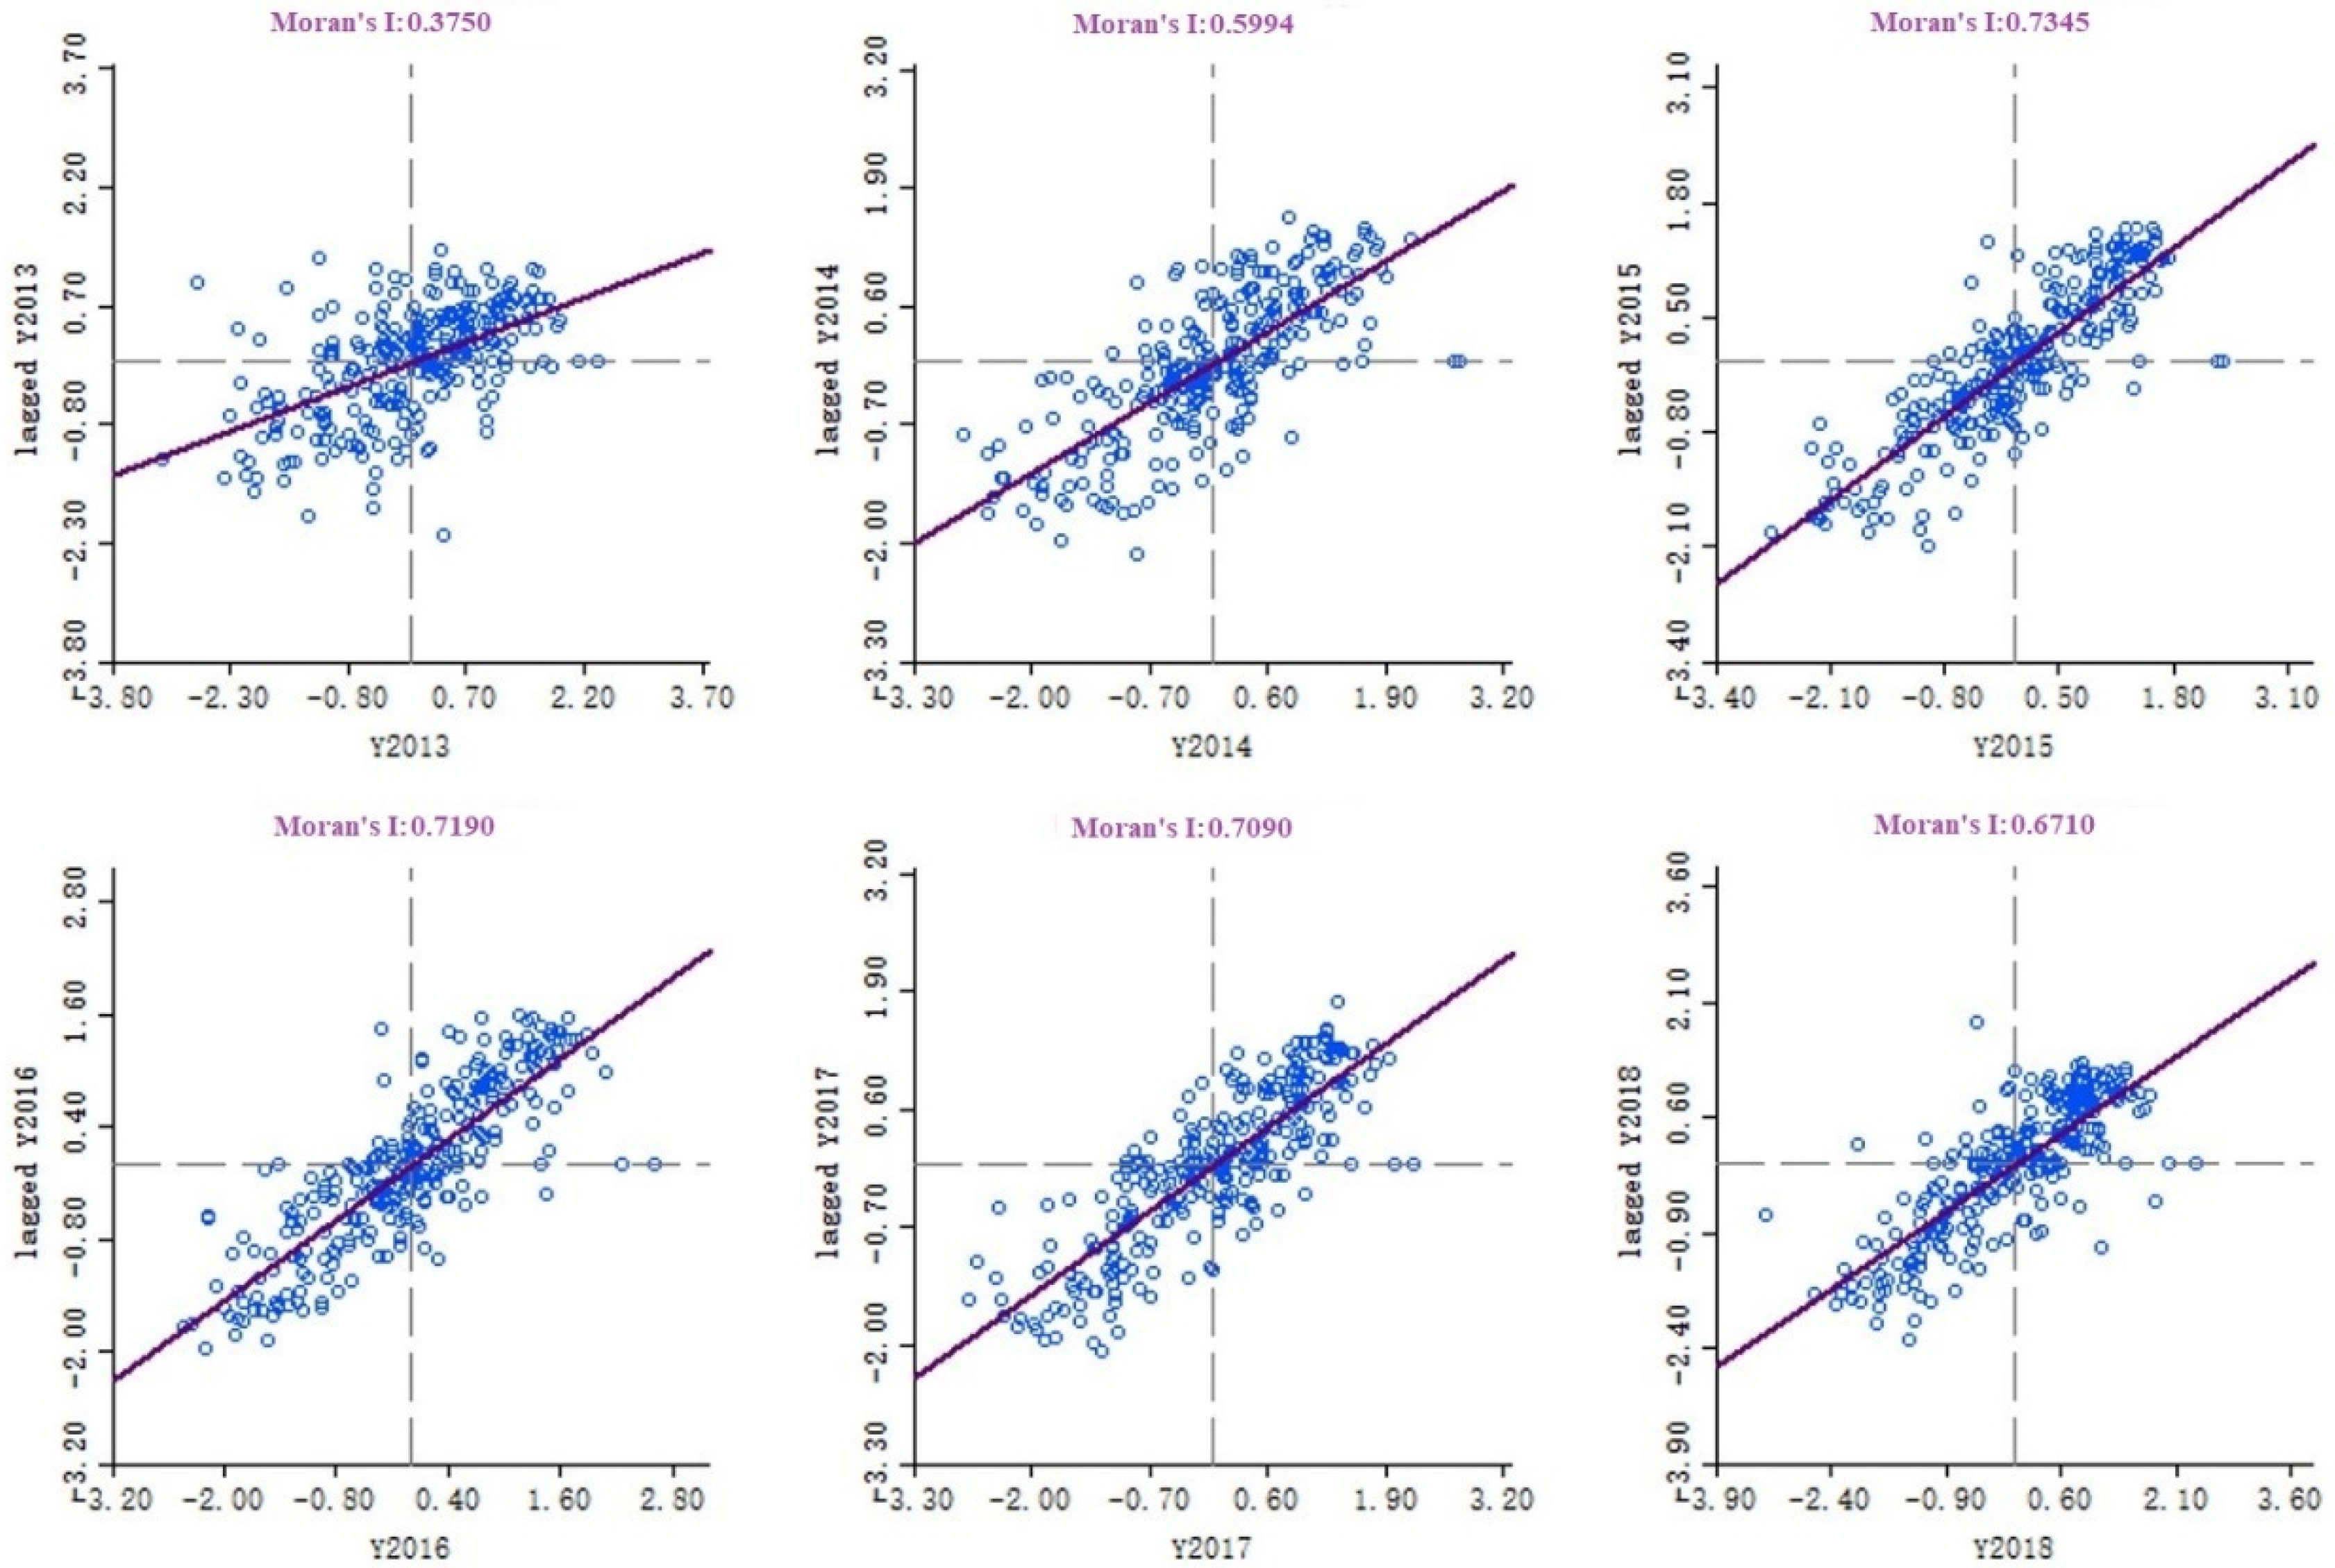
| Year | Moran’s I | E(I) | p-Value | z-Value |
|---|---|---|---|---|
| 2013 | 0.3750 | −0.0035 | 0.0010 | 9.6651 |
| 2014 | 0.5994 | −0.0035 | 0.0010 | 15.0378 |
| 2015 | 0.7345 | −0.0035 | 0.0010 | 19.8175 |
| 2016 | 0.7190 | −0.0035 | 0.0010 | 18.2767 |
| 2017 | 0.7090 | −0.0041 | 0.0010 | 18.5267 |
| 2018 | 0.6710 | −0.0044 | 0.0010 | 16.2060 |
| Variables | Fixed Effect | Random Effect | ||||
|---|---|---|---|---|---|---|
| Coefficient | t-Stat | Probability | Coefficient | t-Stat | Probability | |
| lnX1 | 0.001165 | 1.223659 | 0.221081 | 3145.404 | −0.243600 | 0.807541 |
| lnX2 | 0 | −0.143361 | 0.886005 | −0.000215 | 0.197614 | 0.843347 |
| lnX3 | −0.000059 | −0.994290 | 0.320082 | 0 | 1.180926 | 0.237632 |
| lnX4 | −0.000031 | −5.252817 | 0 | 0.000046 | −1.138767 | 0.2548 |
| lnX5 | −0.015320 | −7.157567 | 0 | −0.000009 | −1.037222 | 0.299633 |
| lnX6 | 0 | 0.01399 | 0.988838 | −0.002590 | 3.320827 | 0.000898 |
| lnX7 | 0.001305 | 1.725711 | 0.084399 | 0.000013 | 1.781365 | 0.074853 |
| W*dep.var. | 0.998985 | 3945.387 | 0 | 0.002114 | 304.5005 | 0 |
| teta | - | - | - | 0.265423 | 17.24327 | 0 |
| R2 | 0.6728 | 0.8886 | ||||
| Sigma2 | 0.0025 | 0.0009 | ||||
| log-likelihood | 2585.6269 | 3145.4038 | ||||
| LMlag | 1781.3148 | 40,034.6297 | ||||
| R-LMlag | 8029.8153 | 71,8143.7069 | ||||
| LMerror | 71.323 | 4.0723 | ||||
| R-LMerror | 6319.8235 | 678,113.1495 | ||||
| Variables | Fixed Effect | Random Effect | ||||
|---|---|---|---|---|---|---|
| Coefficient | t-Stat | Probability | Coefficient | t-Stat | Probability | |
| lnX1 | −0.002480 | −2.334380 | 0.019576 | −0.001050 | −1.078920 | 0.280624 |
| lnX2 | 0 | −0.375060 | 0.707617 | 0 | −0.190200 | 0.849149 |
| lnX3 | −0.000016 | −0.269210 | 0.787766 | 0.000049 | 1.173063 | 0.24077 |
| lnX4 | −0.000020 | −3.519320 | 0.000433 | −0.000003 | −0.312250 | 0.75485 |
| lnX5 | −0.017970 | −8.161420 | 0 | −0.002380 | −0.417340 | 0.676432 |
| lnX6 | 0.000011 | 2.862237 | 0.004207 | 0.00029 | 16.3351 | 0 |
| lnX7 | −0.002130 | −2.390450 | 0.016828 | 0.00605 | 2.044096 | 0.040944 |
| spat.aut. | 0.988972 | 334.0992 | 0 | 0.996368 | 23658.92 | 0 |
| teta | - | - | - | 88.19199 | 13.41322 | 0 |
| R2 | −0.011800 | 0.8881 | ||||
| Sigma2 | 0.0025 | 0.0009 | ||||
| log-likelihood | 2604.1892 | 2620.315 | ||||
| LMlag | 3702.4477 | 1191.641 | ||||
| R-LMlag | 347.4313 | 1250.0513 | ||||
| LMerror | 4933.6623 | 0.0002 | ||||
| R-LMerror | 1578.6458 | 58.4105 | ||||
| Variables | Fixed Effect | Random Effect | ||||
|---|---|---|---|---|---|---|
| Coefficient | t-Stat | Probability | Coefficient | t-Stat | Probability | |
| lnX1 | −0.002466 | −2.361442 | 0.018204 | −0.001563 | −1.698671 | 0.089381 |
| lnX2 | 0.000000 | 0.420666 | 0.673999 | 0.000000 | 0.016323 | 0.986977 |
| lnX3 | −0.000029 | −0.496513 | 0.619532 | −0.000008 | −0.181877 | 0.855680 |
| lnX4 | −0.000024 | −4.116232 | 0.000039 | −0.000013 | −1.636228 | 0.101792 |
| lnX5 | −0.020358 | −9.184800 | 0.000000 | −0.017493 | −4.818972 | 0.000001 |
| lnX6 | 0.000028 | 5.333164 | 0.000000 | 0.000017 | 1.615204 | 0.106266 |
| lnX7 | −0.001899 | −2.066503 | 0.038781 | −0.002697 | −1.738743 | 0.082080 |
| W*lnX1 | 0.013040 | 4.546095 | 0.000005 | 0.002786 | 0.983582 | 0.325321 |
| W*lnX2 | 0.000000 | 2.654114 | 0.007952 | 0.000000 | 2.240181 | 0.025079 |
| W*lnX3 | −0.000462 | −2.641054 | 0.008265 | −0.000162 | −1.505127 | 0.132291 |
| W*lnX4 | −0.000078 | −2.628386 | 0.008579 | 0.000055 | 1.822676 | 0.068352 |
| W*lnX5 | −0.016386 | −2.115604 | 0.034379 | 0.027305 | 4.767539 | 0.000002 |
| W*lnX6 | −0.000046 | −4.802428 | 0.000002 | −0.000016 | −0.927091 | 0.353879 |
| W*lnX7 | 0.013126 | 5.716435 | 0.000000 | 0.008057 | 2.475201 | 0.013316 |
| W*dep.var. | 0.993996 | 657.950793 | 0.000000 | 0.967977 | 129.876552 | 0.000000 |
| teta | 0.285798 | 17.304632 | 0.000000 | |||
| R2 | 0.699600 | 0.888400 | ||||
| Sigma2 | 0.002300 | 0.000900 | ||||
| log-likelihood | 2650.950500 | 3164.152300 | ||||
| Wald_spatial_lag | 157.679600 | 57.688700 | ||||
| Wald_spatial_error | 107.286800 | 31.766700 | ||||
| LR_spatial_ | 130.124000 | 888.309000 | ||||
| lag | ||||||
| LR_spatial_error | 83.633500 | 1938.500000 | ||||
| Hanuman | 58.286900 | |||||
| Effect Evaluation | Variables | Fixed Effect | Random Effect | ||||
|---|---|---|---|---|---|---|---|
| Coefficient | t-Stat | t-Prob | Coefficient | t-Stat | t-Prob | ||
| Direct effects | lnX1 | 0.000388 | 0.306805 | 0.759217 | −0.001340 | −1.173813 | 0.241453 |
| lnX2 | 0.000000 | 2.085903 | 0.037880 | 0.000000 | 1.194471 | 0.233290 | |
| lnX3 | −0.000163 | −2.135358 | 0.033587 | −0.000040 | −0.796255 | 0.426549 | |
| lnX4 | −0.000051 | −4.325309 | 0.000021 | −0.000005 | −0.481062 | 0.630843 | |
| lnX5 | −0.030116 | −9.598687 | 0.000000 | −0.015463 | −4.234122 | 0.000031 | |
| lnX6 | 0.000023 | 4.938440 | 0.000001 | 0.000017 | 1.842039 | 0.066512 | |
| lnX7 | 0.001129 | 1.074293 | 0.283603 | −0.001550 | −1.000729 | 0.317810 | |
| Indirect effects | lnX1 | 0.800067 | 3.862730 | 0.000139 | 0.041324 | 0.450830 | 0.652456 |
| lnX2 | 0.000007 | 2.622878 | 0.009190 | 0.000001 | 1.924636 | 0.055274 | |
| lnX3 | −0.037285 | −2.762278 | 0.006114 | −0.005359 | −1.290572 | 0.197902 | |
| lnX4 | −0.007724 | −3.092455 | 0.002183 | 0.001243 | 1.326532 | 0.185729 | |
| lnX5 | −2.779643 | −4.522011 | 0.000009 | 0.311432 | 2.093364 | 0.037204 | |
| lnX6 | −0.001384 | −3.365275 | 0.000870 | −0.000007 | −0.024911 | 0.980143 | |
| lnX7 | 0.861756 | 5.040209 | 0.000001 | 0.170666 | 1.906720 | 0.057566 | |
| Total effects | lnX1 | 0.800455 | 3.851552 | 0.000145 | 0.039984 | 0.433206 | 0.665194 |
| lnX2 | 0.000007 | 2.622373 | 0.009203 | 0.000001 | 1.922912 | 0.055491 | |
| lnX3 | −0.037448 | −2.764135 | 0.006081 | −0.005399 | −1.290961 | 0.197767 | |
| lnX4 | −0.007774 | −3.099903 | 0.002130 | 0.001237 | 1.310436 | 0.191107 | |
| lnX5 | −2.809759 | −4.554184 | 0.000008 | 0.295968 | 1.977671 | 0.048932 | |
| lnX6 | −0.001361 | −3.325550 | 0.000998 | 0.000009 | 0.030815 | 0.975439 | |
| lnX7 | 0.862885 | 5.032566 | 0.000001 | 0.169116 | 1.882057 | 0.060851 | |
Publisher’s Note: MDPI stays neutral with regard to jurisdictional claims in published maps and institutional affiliations. |
© 2021 by the authors. Licensee MDPI, Basel, Switzerland. This article is an open access article distributed under the terms and conditions of the Creative Commons Attribution (CC BY) license (https://creativecommons.org/licenses/by/4.0/).
Share and Cite
Li, X.; Li, S.; Tian, S.; Guan, Y.; Liu, H. Air Quality and the Spatial-Temporal Differentiation of Mechanisms Underlying Chinese Urban Human Settlements. Land 2021, 10, 1207. https://doi.org/10.3390/land10111207
Li X, Li S, Tian S, Guan Y, Liu H. Air Quality and the Spatial-Temporal Differentiation of Mechanisms Underlying Chinese Urban Human Settlements. Land. 2021; 10(11):1207. https://doi.org/10.3390/land10111207
Chicago/Turabian StyleLi, Xueming, Songbo Li, Shenzhen Tian, Yingying Guan, and He Liu. 2021. "Air Quality and the Spatial-Temporal Differentiation of Mechanisms Underlying Chinese Urban Human Settlements" Land 10, no. 11: 1207. https://doi.org/10.3390/land10111207
APA StyleLi, X., Li, S., Tian, S., Guan, Y., & Liu, H. (2021). Air Quality and the Spatial-Temporal Differentiation of Mechanisms Underlying Chinese Urban Human Settlements. Land, 10(11), 1207. https://doi.org/10.3390/land10111207