Abstract
To establish a reliable and accurate solid-phase extraction (SPE) pretreatment method for multi-class antibiotics in water and achieve simultaneous determination of 20 antibiotics, including tetracyclines, quinolones, and sulfonamides, key pretreatment parameters were optimized via single-factor experiments in this study. The optimized parameters included pH of acidified water samples, Na2EDTA dosage, SPE cartridge type, operational conditions, and the type and volume of elution solvent. The validated method was further applied to analyze surface water samples collected from 16 sampling sites in Poyang Lake and its three typical tributaries (Ganjiang River, Jinjiang River, and Yuanhe River) to verify its practicability, reliability, and applicability. Results showed that the optimal pretreatment conditions were as follows: water samples were acidified to pH 3.0, added with 0.2 g Na2EDTA for metal ion chelation, enriched using Oasis® HLB cartridges at a loading flow rate of 8–10 mL/min, and dried for 5–30 min until no obvious liquid dripped from the cartridge tip, followed by elution with 12 mL of 0.1% (V:V) formic acid in methanol. Under these conditions, the spiked recoveries of 20 antibiotics in ultrapure water were generally above 80%, and most antibiotics exhibited recoveries exceeding 90%. In addition, the spatial distribution of antibiotic concentrations in the Poyang Lake watershed followed the following order: Jinjiang River > Yuanhe River > Ganjiang River > Poyang Lake. Sulfonamides, especially sulfamethoxazole with a maximum concentration of 250.08 ng·L−1, were identified as the predominant pollutants in this basin.
1. Introduction
As a class of synthetic antibacterial agents, antibiotics are widely used in various fields such as medical treatment, livestock and poultry breeding, aquaculture, and agricultural production, playing a crucial role in safeguarding human health and promoting the development of agriculture and animal husbandry [1,2,3]. However, the irrational use and abuse of antibiotics have led to the discharge of large amounts of their unmetabolized fractions into the aquatic environment through medical wastewater, aquaculture wastewater, agricultural non-point source runoff, and other pathways. Due to their characteristics of poor degradability, easy mobility, and long-term persistence, antibiotics have become emerging micro-organic pollutants of global concern [4,5,6]. Residual antibiotics in water not only disrupt the balance of aquatic ecosystems and induce the production of antibiotic resistance genes (ARGs) in aquatic microorganisms but also may accumulate and transfer through the food chain, posing potential threats to human health [7,8].
The residual concentrations of antibiotics in water are usually at the ng·L−1 level, and the aquatic environment has a complex matrix, containing a large number of interfering substances such as metal ions, suspended particles, and dissolved organic matter. Direct instrumental detection is therefore difficult, making the pretreatment process (enrichment and purification) a key step for the accurate determination of antibiotics [9,10]. As a mainstream pretreatment technique for antibiotics in environmental water, solid-phase extraction (SPE) has the advantages of high enrichment efficiency, simple operation, low organic solvent consumption, and satisfactory purification performance. It has been widely used in the determination of various classes of antibiotics, including tetracyclines, quinolones, and sulfonamides [11,12,13].
Poyang Lake is the largest freshwater lake in China and serves as an important water storage and flood regulation hub in the Yangtze River Basin, playing an irreplaceable role. Poyang Lake receives inflow from numerous tributaries, including the Gan River, Jin River, and Yuan River. The basin is densely populated with developed agriculture and aquaculture, leading to a high risk of antibiotics entering the water body through various wastewater sources. Its water quality is directly related to the regional ecological security and human health. In 2017, scholars first detected the occurrence and distribution of antibiotics in Poyang Lake [14]. Subsequently, several studies have investigated antibiotic resistance genes (ARGs) in this region [15,16,17]. However, research on antibiotics in the Poyang Lake area remains relatively limited.
In view of the current research status of antibiotics in the Poyang Lake watershed, this study focused on 20 target antibiotics, including tetracyclines, quinolones, and sulfonamides. Combined with the matrix characteristics of surface water in the Poyang Lake watershed, key parameters of SPE pretreatment were optimized via single-factor experiments, including the pH of acidified water samples, Na2EDTA dosage, SPE cartridge type, sample loading flow rate, drying degree of SPE cartridge, and the type and volume of elution solvent, aiming to establish an accurate and reliable method for the simultaneous detection of multi-class antibiotics. Subsequently, the optimized method was applied to the detection of actual surface water samples collected from 16 sampling sites in Poyang Lake and its three typical tributaries (Ganjiang River, Jinjiang River, and Yuanhe River) to verify its practicability, reliability, and adaptability, aiming to supplement the monitoring data of antibiotic residues in the water of the Poyang Lake watershed, further improve the basic data on antibiotic pollution in this region, and provide a more comprehensive scientific reference for the water environment management of the watershed.
2. Materials and Methods
2.1. Instruments and Equipment
Agilent 1290 Ultra-High Performance Liquid Chromatograph (UHPLC) coupled with a 6460 Triple Quadrupole Liquid Chromatography–Mass Spectrometry (LC-MS/MS) system (Agilent Technologies, Inc., Santa Clara, CA, USA); Heffic S6 Automatic Large-Volume Solid-Phase Extraction Instrument (Beijing Youxing Keyi Technology Co., Ltd., Beijing, China); SBEQ-CG1012 Solid-Phase Extraction Instrument (Shanghai Anpel Scientific Instrument Co., Ltd., Shanghai, China); Direct-Q® 5UV Ultrapure Water System (Merck Millipore GmbH, Darmstadt, Germany).
2.2. Drugs and Reagents
Methanol (HPLC grade), formic acid (HPLC grade), ammonia water (HPLC grade), and ammonium acetate (guaranteed reagent, GR) were purchased from Shanghai Anpel Scientific Instrument Co., Ltd. (Shanghai, China); disodium ethylenediaminetetraacetate (Na2EDTA, guaranteed reagent, GR) was obtained from Tianjin Damao Chemical Reagent Factory (Tianjin, China); sulfuric acid, sodium chloride, calcium chloride anhydrous, magnesium chloride hexahydrate, potassium chloride, iron chloride hexahydrate, manganese(II) chloride tetrahydrate, zinc chloride, and copric chloride dihydrate were supplied by Shanghai Aladdin Biochemical Technology Co., Ltd. (Shanghai, China); 0.7 μm GF/F filter membranes were purchased from Whatman Inc. (Maidstone, Kent, UK); 6 mL 500 mg OASIS solid-phase extraction cartridges were obtained from Waters Corporation (Milford, MA, USA); 13 mm 0.22 μm organic phase syringe filters were provided by Shanghai Anpel Scientific Instrument Co., Ltd. (Shanghai, China). All experimental water was ultrapure water. Twenty antibiotic standards and three recovery indicators were imported from Dr. Ehrenstorfer GmbH (Augsburg, Germany), as shown in Table 1.

Table 1.
Antibiotic standard and recovery indicator information table.
2.3. Pretreatment Procedure
Water samples collected from each sampling site were stored in 1 L amber glass bottles. Immediately after collection, 50 mL of methanol was added to inhibit microbial activity and prevent the degradation of antibiotics by microorganisms in the water samples. Appropriate dilute sulfuric acid was added to adjust the pH of the water samples to approximately 3.0 to improve the extraction efficiency of the target antibiotics. The samples were then sealed, stored at 4 °C, and transported back to the laboratory to avoid antibiotic degradation, ensuring that pretreatment and analysis were completed within 24 h. The detailed laboratory procedures are illustrated in Figure 1a–f.
- Filtration: Connect the filtration apparatus and filter water samples using a 1 L suction flask with a 70 mm GF/F filter membrane. Ensure the apparatus is rinsed thoroughly before processing each sample to avoid cross-contamination. After filtration, transfer the filtrate to a cleaned brown sample bottle, add 0.2 g Na2EDTA to suppress metal ion interference, and vortex for later use.
- Quality Control: For each batch of samples, set up two blanks and two quality control (QC) samples. All samples (including blanks and QCs) were spiked with three recovery indicators. Specifically, 0.1 mL of 1 ppm mixed recovery indicators was added to 1 L of sample solution, resulting in a final indicator concentration of 100 ng·L−1. For blanks, 0.1 mL of 1 ppm mixed recovery indicators was added to 1 L of ultrapure water. For QCs, 0.1 mL of 1 ppm mixed antibiotic standard (containing the three recovery indicators) was added to 1 L of ultrapure water.
- Activation and Loading: Activate the HLB OASIS solid-phase extraction (SPE) cartridge by sequentially adding 10 mL of methanol and 10 mL of ultrapure water. Adjust the sample loading flow rate to 8–10 mL/min. After loading, rinse the brown sample bottle twice with 50 mL of 5% methanol solution each time, and transfer all rinsates onto the SPE cartridge to ensure complete residue recovery. Dry the cartridge until no visible liquid drips from the tip.
- Elution: Elute the analytes from the dried cartridge with 12 mL of 0.1% formic acid in methanol, collecting the eluate into a graduated test tube. Thoroughly clean the elution tube before each use to prevent cross-contamination.
- Nitrogen Evaporation and Reconstitution: Concentrate the eluate under a gentle nitrogen stream until approximately 0.2 mL remains. Bring the volume to 1 mL with methanol and vortex for 5 s to minimize sample loss. Transfer the solution using a 1 mL syringe (0.45 × 16 mm needle) fitted with a 13 mm × 0.22 μm organic syringe filter into a 2 mL autosampler vial. Transfer 100 μL of this solution to another 2 mL autosampler vial equipped with an insert. Evaporate the solvent again; then, reconstitute with 100 μL of mobile phase (0.2% formic acid + 2 mM ammonium acetate). Add 1 μL of 10 ppm simeton as an internal standard to correct for instrumental errors, and vortex to mix.
- Determination: Prepare a series of standard solutions covering the concentration range 0.1–500 μg·L−1 using the mobile phase (0.2% formic acid + 2 mM ammonium acetate). For each 1 mL standard sample, add 10 μL of 10 ppm simeton internal standard. All standards and prepared samples were then injected into the instrument for analysis.

Figure 1.
Pre-processing flow chart.
Figure 1.
Pre-processing flow chart.

2.4. Detection Method
The analysis was performed using ultra-high performance liquid chromatography–tandem mass spectrometry (UPLC-MS/MS). The chromatographic and mass spectrometric parameters were referenced to our previously established and validated method [18,19]. The typical chromatogram of the 20 antibiotics is shown in Figure 2. The detailed parameters are as follows:
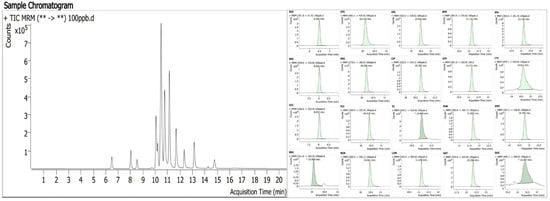
Figure 2.
Chromatogram of 20 antibiotics.((**->**) = (Precursor ion->Product ion)).
Chromatographic conditions: ZORBAX Eclipse Plus C18 (RRHD) column (1.8 μm); the temperature of the column oven was maintained at 25 °C; the sample injection volume was 10 μL; mobile phase A was an aqueous solution containing 0.2% formic acid and 2 mM ammonium acetate; mobile phase B was LC-MS grade acetonitrile; the flow rate was 0.2 mL/min.
Elution program: 0–5 min, 95% mobile phase A decreased to 90%; 5–10 min, 90% mobile phase A decreased to 80%; 10–18 min, 80% mobile phase A decreased to 75%; 18–19 min, 75% mobile phase A increased to 95%; 19–20 min, maintained at 95% mobile phase A.
Mass spectrometric conditions: Electrospray ionization (ESI) source in positive ion mode; capillary voltage was set at 3500 V; corona current was 4 μA; multiple reaction monitoring (MRM) detection mode was adopted (see Table 2). Both the drying gas temperature and the nebulizer temperature were set at 325 °C; the drying gas flow rate was 6 L/min; the nebulizer pressure was 40 psi.
Table 2.
Mass spectrometry parameters.
3. Results
3.1. pH Optimization
Most literature experiments have shown that the recovery rate of antibiotics under acidic conditions is higher than that under neutral and weakly alkaline conditions [20]. This is because under neutral conditions, acidic compounds are deprotonated and can interact with (protonated) matrix amino functional groups, while basic compounds can interact with deprotonated matrix acidic functional groups, thereby reducing extraction efficiency [21]. Under alkaline conditions, antibiotics may undergo hydrolytic degradation, or the degree of H+ dissociation on the amino groups of antibiotics will increase, leading to lower recovery rates [22]. Under acidic conditions, antibiotics do not bind to matrix functional groups, and the antibiotics free in the water samples can be better adsorbed by the HLB solid-phase extraction cartridge, resulting in higher recovery efficiency. Quinolones, tetracyclines, and sulfonamides all have acidic or basic functional groups, and the pH value of the solution determines their ionization state. Therefore, acidification before sample loading can effectively improve the recovery rate of target analytes. By reviewing the literature [23,24,25], we found that the acidic range is more conducive to improving the recovery efficiency of antibiotics. Hu [26] studied 13 antibiotics of three classes (SAs, TCs, and FQs) and found that the recovery rate was 65~124% at pH = 3. Gao [27] compared the recovery rates of 15 antibiotics of three classes (SAs, FQs, and TCs) at pH values of 2, 3, and 4, and found that the highest recovery rate (84.2~118.6%) was achieved at pH = 3. To make the experimental pH more accurate, we adjusted the pH to one decimal place and selected pH values of 2, 2.5, 3, 3.5, and 4 for the experiments (Figure 3).
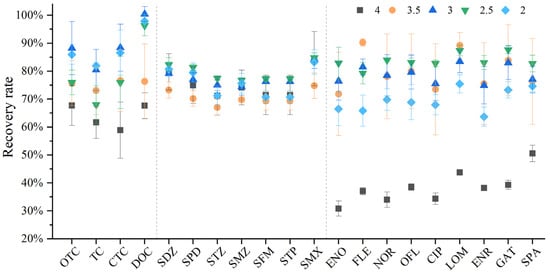
Figure 3.
Different recovery rates of 20 antibiotics under the comparison of four pH parameters.
Studies have shown that, when the water sample is acidified to pH 4, the recovery rates of tetracyclines and quinolones are significantly lower than those under other acidity conditions, especially for quinolones. Therefore, pH 4 was first excluded after comprehensive consideration. In addition, it can be seen that the overall performance of these three classes of antibiotics varies significantly under different pH conditions. The recovery rate was the highest when the pH was adjusted to 3. The recovery rate of sulfonamides showed no obvious change, with the highest recovery rates at pH 2.5 and 3. The recovery rates of quinolones were not high at pH 2 and 4. If only quinolones are tested, pH 2.5 can be selected; however, considering that this study aims to establish a method for the simultaneous determination of 20 antibiotics, the use of pH 2.5 would lead to low recovery rates of tetracyclines. Therefore, after comprehensive consideration, pH 3 was selected, which can ensure that the recovery efficiency of all antibiotics reaches 80% or above.
3.2. Optimization of EDTA Dosage
Water samples generally contain metal ions, whether they are pure water, surface water, groundwater, or wastewater. It can be known from the literature review that when metal ions coexist with antibiotics in natural water bodies, they may form complexes or exist in free forms [28]. Antibiotics existing in free forms will not complex with metal ions and will not interfere with each other. However, some antibiotics will complex with metal ions to form antibiotic–metal complexes, which will reduce the free metal ions and antibiotics in the water body, thereby decreasing the recovery rate of target analytes [29]. This phenomenon was confirmed by our experiments. Three types of water samples were set up in the experiment: Sample A (ultrapure water), Sample B (low-concentration metal ion water sample, simulating environmental water samples), and Sample C (high-concentration metal ion water sample, simulating metal-contaminated wastewater samples). The parameters of the water samples were set as follows: Sample A (1 L ultrapure water); Sample B (1 L ultrapure water spiked with 10 mg/L Ca2+, 10 mg/L K+, 10 mg/L Na+, 10 mg/L Mg2+, 0.05 mg/L Fe3+, 0.05 mg/L Mn2+, 0.05 mg/L Zn2+, and 0.05 mg/L Cu2+ to prepare the simulated water sample); Sample C (1 L ultrapure water spiked with 100 mg/L Ca2+, 100 mg/L K+, 100 mg/L Na+, 100 mg/L Mg2+, 5 mg/L Fe3+, 5 mg/L Mn2+, 5 mg/L Zn2+, 5 mg/L Cu2+, 0.05 mg/L Cr3+, 0.05 mg/L Cd2+, 0.05 mg/L Pb2+, and 0.05 mg/L Ni2+ to prepare the simulated water sample).
Comparative experiments showed that metal cations have a very strong complexation effect with antibiotics, especially high-concentration metal ions (Figure 4a). The complexation ability of the three classes of antibiotics with metal ions followed the order: TCs > FQs > SAs. Literature research revealed that the underlying mechanism is that antibiotics with more electron-rich groups containing N and O may form stronger complexes with metal ions. Tetracyclines have the largest variety and quantity of functional groups, providing the most coordination sites for metal ions; they contain functional groups such as hydroxyl (-OH) and carbonyl (-C=O), all of which can coordinate with metal ions [30]. Therefore, tetracyclines were the most affected among the three classes. Quinolones contain carboxyl (-COOH), -C=O, and piperazine groups [31], while the N-containing functional groups of sulfonamides can also participate in coordination [20]. However, sulfonamides have fewer N-containing functional groups and weak coordination reactions, so they were the least affected; even an increase in the concentration of metal cations had a limited impact on SAs. Notably, at the experimental pH of 3.0, EDTA exhibits strong chelation toward trivalent metal ions such as Fe3+ and Cr3+, which can still form stable complexes with antibiotics even under acidic conditions. Therefore, adding Na2EDTA to water samples can effectively chelate these trivalent metal ions, thereby reducing the formation of antibiotic–metal complexes and maintaining antibiotics in their free states. In this way, the target compounds can be more efficiently adsorbed by the HLB solid-phase extraction cartridge, thus improving the overall recovery of antibiotics. According to the literature, Li [32], Batt [33], and Zhang Hui [34] added 0.2 g of Na2EDTA during the pretreatment of antibiotics (SAs, FQs, TCs, MLs, and NDs) in environmental water samples to inhibit the complexation between metal ions and antibiotics. Liu [35] and Zhang [36] added 0.1 g of Na2EDTA when detecting SAs, FQs, TCs, and MLs in water samples, while Ren [37] and Sue [38] added 0.25 g of Na2EDTA for the detection of SAs, FQs, TCs, and MLs in water samples. Comparative experiments were conducted with Na2EDTA dosages of 0.2 g, 0.5 g, and 1 g to explore the effect of different concentrations of Na2EDTA on antibiotic recovery rates. It can be seen that the appropriate addition of Na2EDTA had a significant effect on inhibiting the complexation between metal ions and antibiotics. When the water sample was not contaminated by metals or the metal cation concentration was within the normal range, adding 0.2 g of Na2EDTA was sufficient, and excessive addition would not achieve a better effect (Figure 4b). For water samples with high metal cation content, the antibiotic recovery rates were relatively close among the three dosages, indicating that the dosage had little impact on them (Figure 4c). Overall, 0.2 g of Na2EDTA is selected for the subsequent experiments.
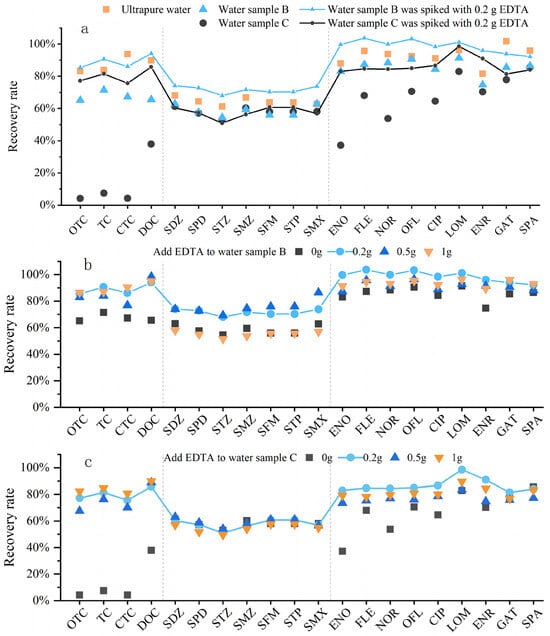
Figure 4.
Effect of metal cations on antibiotic recovery. (a) Complexation of metal cations with antibiotics; (b) antibiotic recovery in water samples with low-concentration metal ions at different Na2EDTA additions; (c) antibiotic recovery in water samples with high-concentration metal ions at different Na2EDTA additions.
3.3. Optimization of Parameters Related to Solid-Phase Extraction Cartridges
Solid-phase extraction is a critical step for the enrichment and recovery of antibiotics from water samples. The choice of extraction cartridge directly determines the effective adsorption of target antibiotics by the filler, the adsorption capacity, and the completeness of adsorption—all of which are key factors requiring careful consideration. Two types of SPE cartridges were selected for comparison: conventional C18 (6 mL, 500 mg) and Oasis® HLB (6 mL, 500 mg). Both C18 and HLB cartridges are commonly used in the pretreatment of organic compounds in environmental water samples and are suitable for the enrichment of compounds that can dissociate into charged ions and hydrophilic compounds. The C18 SPE cartridge uses octadecylsilane (ODS) as the packing material, which retains non-polar compounds through strong hydrophobic interaction. The Oasis® HLB SPE cartridge is prepared by copolymerization of two monomers, lipophilic divinylbenzene (DVB) and hydrophilic N-vinylpyrrolidone (NVP), at a certain ratio, and has good adsorption capacity for both polar and non-polar compounds. Both types of SPE cartridges belong to reversed-phase adsorbents and are commonly used for the detection of residual organic pollutants in the environment, such as antibiotics in natural waters (e.g., surface water and groundwater) and wastewater. The results showed that the HLB solid-phase extraction cartridge achieved excellent enrichment effects for tetracyclines, sulfonamides, and quinolones (Figure 5). The combination of the two materials in the Oasis® HLB cartridge enables it to extract and retain acidic, basic, and neutral compounds over a wide polarity range (from polar to non-polar) [39]. In contrast, the adsorption material of C18 is octadecylsilane, which mainly adsorbs non-polar compounds and has poor (weak to moderate) adsorption performance for polar compounds [20]; therefore, it is more suitable for adsorbing macrolide antibiotics [19].
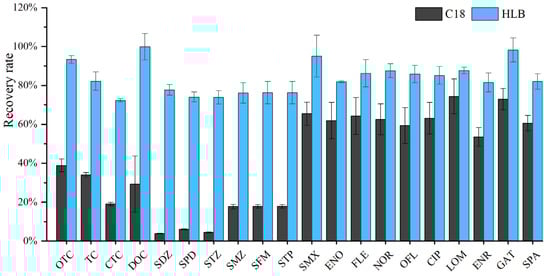
Figure 5.
Comparison between C18 and HLB SPE cartridges.
Extraction parameters are related not only to the selection of the solid-phase extraction (SPE) cartridge, but also to the flow rate of water samples entering the cartridge and the drying degree of the cartridge after adsorption. The sample loading flow rate is closely related to the adsorption capacity of the SPE cartridge for target compounds, thereby directly affecting the recovery efficiency. If the flow rate is too fast, target compounds will flow through the SPE cartridge without being adsorbed, which easily leads to low recovery rates. Theoretically, during sample loading, a slower flow rate of water samples is more conducive to the enrichment of target antibiotics by the SPE cartridge filler [40]. However, an excessively slow sample loading flow rate will result in an overly long pretreatment time. Considering the analytical efficiency during batch experimental treatment, an overly slow flow rate obviously cannot meet the analytical requirements. The purpose of this experiment was to screen out efficient and rapid pretreatment conditions by comparing the recovery rates under different sample loading flow rates. The sample loading flow rates were set to 4 mL/min, 6 mL/min, 8 mL/min, and 10 mL/min, respectively, to compare the effects of different flow rates on the recovery rate (Figure 6a). Overall, the reason why the recovery rate at 4 mL/min was lower than that at other flow rates may be related to the fact that the excessively slow water flow rate is likely to cause the packing to dry out excessively, resulting in the collapse of pores between packing particles and the entry of air [41]. In addition, regarding the flow rate, Wang Yunxin [42] also found that low flow rates tend to increase the air content in the SPE cartridge, causing air suction, reducing the efficiency of the SPE cartridge, and consuming a long time. Therefore, the recovery rate gradually increased in the range of 1~8 mL/min and began to decrease when the flow rate reached 10 mL/min and above. Rossmann and Hong [31,43] conducted experiments on SAs, FQs, TCs, MLs, and FQs and found that a flow rate of 5~10 mL/min was better; Yuan and Batt [33,44] developed methods for SAs, FQs, TCs, MLs, and SAs, setting the sample loading flow rate to 10 mL/min. Considering both time cost and recovery efficiency comprehensively, the optimal sample loading flow rate was 8~10 mL/min.
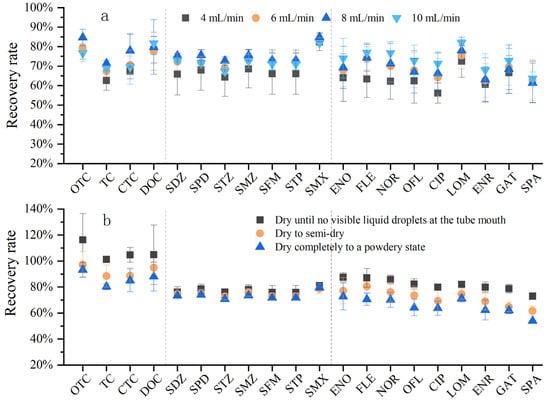
Figure 6.
Comparison of flow rate through the SPE cartridge and drying degree of the SPE cartridge (a) Effect of four flow rates on antibiotic recovery; (b) effect of drying degree of the SPE cartridge on antibiotic recovery.
After sample loading, residual water remains in the SPE cartridge. If the cartridge is not dried, the remaining water will dilute the formic acid–methanol eluent, reduce its elution strength, and prevent full contact between the eluent and the adsorbed analytes, thus decreasing the recovery of target antibiotics. Through consulting the SPE cartridge manufacturer and reviewing the literature, it was found that there is no specific information on the drying time and degree of the SPE cartridge, and the experimental methods of different scholars vary. In this experiment, three different drying degrees of the SPE cartridge were set to compare the differences in the three classes of antibiotics under three different vacuum drying degrees (Figure 6b). With the increase in drying time, the antibiotic recovery rate decreased, and this trend was most obvious for tetracyclines and quinolones. The recovery rate was higher when the cartridge was vacuum-dried until no obvious liquid was observed at the tube tip; as the drying time increased, the recovery rate began to decrease, and the recovery rate was the lowest when the cartridge was dried to a completely powdery state. This may also be related to the “air suction” phenomenon of antibiotics. Therefore, it is sufficient to dry the cartridge until no obvious liquid drips from the tube tip. This degree may take 5–30 min, but it should not exceed 30 min, as this would lead to more air inside the SPE cartridge and reduce the recovery efficiency.
3.4. Optimization of Elution Solvent Type and Volume
For the extraction and separation of non-polar and medium-polar target compounds from polar matrices, the required eluent is generally a solvent with non-polar properties. Only when the elution strength of the eluent is sufficient to break the van der Waals forces between the target compounds and the non-polar functional groups of the adsorbent can the target compounds be successfully eluted from the SPE cartridge. Although methanol has strong polarity, it also has sufficient non-polar interactions to elute many compounds. In general, the eluent should be added in small amounts and multiple times to achieve a better elution effect. To obtain a better elution effect, formic acid or ammonia water is also added to methanol to improve extraction efficiency.
Three different elution solvents with the same volume were compared to evaluate their elution effects on the three classes of antibiotics: pure methanol, 0.1% (V:V) formic acid (CH2O2)–methanol, and 5% (V:V) ammonia water (NH3·H2O)–methanol (Figure 7a). It was found that 0.1% (V:V) formic acid–methanol exhibited the best elution effect, especially for tetracyclines (TCs), followed by sulfonamides (SAs). The elution effects of the three solvents on SAs were similar, indicating that SAs could be easily desorbed from the solid-phase extraction (SPE) cartridge and dissolved in the solvent. In contrast, TCs were more easily adsorbed by the SPE cartridge and more difficult to elute. Considering the requirements of subsequent nitrogen blowing equipment, test tube capacity, liquid overflow during the experiment, and experimental time consumption, the recovery rates of 0.1% formic acid–methanol at different elution volumes (8 mL, 10 mL, and 12 mL) were compared (Figure 7b). The results showed that the recovery rate increased with the increase in elution volume, and the recovery rate of 12 mL 0.1% formic acid–methanol was mostly above 80%.
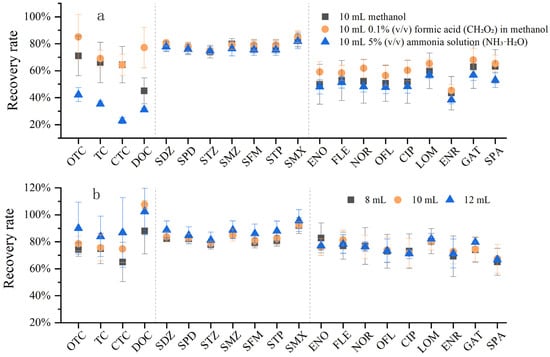
Figure 7.
Effect of elution step on antibiotic recovery. (a) Comparison of three elution solvents on antibiotic recovery; (b) effect of elution solvent volume on antibiotic recovery.
3.5. Linear Range, Limit of Detection (LOD), and Limit of Quantification (LOQ)
The limit of detection (LOD) and limit of quantification (LOQ) were determined by the signal-to-noise (S/N) ratio method, an instrumental analysis method that intuitively displays the level (intensity) of the signal and baseline noise, such as high-performance liquid chromatography (HPLC). They were calculated based on the S/N ratio between the signal (S) and baseline noise (N) in the HPLC chromatogram. The concentration corresponding to S/N = 3 is the LOD, which means the peak height is approximately three times the height of the baseline noise; the concentration corresponding to S/N = 10 is the LOQ, which means the peak height is approximately ten times the height of the baseline noise.
The concentration gradient of the standard curve was set to 0.1, 0.2, 0.5, 1, 2, 5, 10, 20, 50, 100, 200, and 500 μg·L−1. This standard curve can basically cover the concentration range of antibiotics in environmental water bodies. If wastewater sample detection is not performed, the high-concentration segment of the standard curve can be omitted. The standard solution contained 20 standard substances and three deuterated internal standards. Simeton was added as an on-machine internal standard to each standard solution and pretreated sample, so that the internal standard concentration for on-machine detection was 100 μg·L−1. The standard curve showed a good linear relationship (R2 > 0.995) as shown in Table 3. The LOD of the method was 0.01~0.44 ng·L−1, and the LOQ was 0.03~1.36 ng·L−1.
Table 3.
LOD, LOQ, and standard curve of antibiotics.
3.6. Spiked Recovery Rate and Relative Standard Deviation (RSD)
According to the literature, spiked recovery tests are generally conducted at 1 to 3 concentration levels [20,31]. In this study, three spiked concentrations were set. Antibiotic standard solutions were added into ultrapure water and field-collected surface water to reach final concentrations of 10 ng·L−1, 50 ng·L−1, and 100 ng·L−1, respectively. Meanwhile, parallel experiments were conducted to verify the accuracy and stability of the method [27,45,46,47]. The spiked recoveries and relative standard deviations (RSDs) of the 20 antibiotics were calculated based on three parallel measurements, and the results are shown in the following Figure 8. The antibiotic recovery rates at spiked concentrations of 10, 50, and 100 ng·L−1 ranged from 52.23% to 104.28%, with a relative standard deviation not exceeding 9% (n = 3). At a spiked concentration of 10 ng·L−1, the spiked recovery rate of ultrapure water ranged from 52.23% to 96.92%. At a spiked concentration of 50 ng·L−1, the spiked recovery rate ranged from 68.65% to 103.8%. At a spiked concentration of 100 ng·L−1, the spiked recovery rate ranged from 78.53% to 104.28%. The recovery rate at a spiked concentration of 100 ng·L−1 was significantly higher than that at the other two low concentrations, indicating that the method has good enrichment performance for high-concentration antibiotics; meanwhile, the spiked concentration of antibiotics in other single-factor experiments was also 100 ng·L−1. For surface water samples spiked at 10, 50, and 100 ng·L−1, the antibiotic recoveries ranged from 48.15% to 182.17%. Both the maximum and minimum values occurred at the spiked concentration of 10 ng·L−1. At this concentration, four quinolone antibiotics (ENO, NOR, OFL, and ENR) showed relatively high RSD values, while the RSDs were below 12% at the other spiked levels. At 50 ng·L−1, the recoveries ranged from 56.67% to 139.2%. At 100 ng·L−1, the recoveries ranged from 61.8% to 161.36%. Clearly, due to the complex matrix of surface water, the recoveries were much less stable than those in ultrapure water, especially at low concentrations. In addition, SMX exhibited abnormally high recoveries at the low spiked level of 10 ng·L−1, whereas this phenomenon was not observed at 50 and 100 ng·L−1. ENR showed gradually increased abnormal recoveries with increasing spiked concentrations, and the effect was most significant at 100 ng·L−1. These phenomena could be ascribed to matrix-induced ionization enhancement or suppression in ESI.
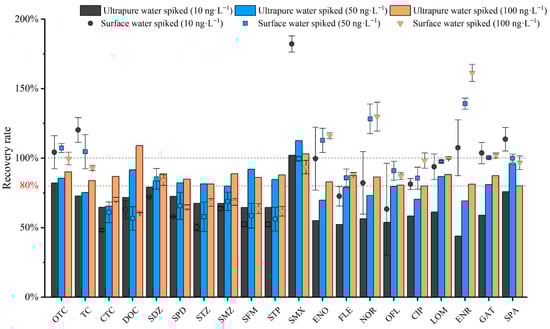
Figure 8.
Antibiotic recovery rates at spiked concentrations of 10, 50, and 100 ng·L−1.
3.7. Method Comparison
By comparing the optimized method steps with the relevant parameters in other studies, it was found that, in the solid-phase extraction methods, the settings of various parameters are not significantly different, especially the pH value and SPE cartridge (Table 4). There are some differences in the elution step: most studies use pure methanol solution for elution, but our study found that the elution effect is better when the elution solution is under acidic conditions. Overall, this method can simultaneously detect 20 antibiotics with generally high recovery rates. Especially when the concentration of antibiotics is high, the enrichment effect is better, and the recovery rate of 20 antibiotics can reach more than 80%.
3.8. Practical Application
3.8.1. Sampling Site Layout
According to the experimental method, Poyang Lake and its three typical tributaries (Ganjiang River, Jinjiang River, and Yuanhe River) were selected as the sampling areas. Four sampling sites were set up in each tributary. The sites were laid out according to the characteristics of the tributary basin (river flow direction, upstream and downstream), covering different pollution gradients, to ensure that the sampling sites are representative and can reflect the overall characteristics of the surface water of the Poyang Lake tributaries, which is used to verify the applicability of the optimized method.
3.8.2. Detection Results and Analysis of Actual Samples
The detection results are shown in Table 5. All 20 target antibiotics were detected at different levels in the 16 sampling sites. Among them, 17 antibiotics were detected, and only SPA, STP, and SFM were not detected; the concentrations of the undetected antibiotics were all lower than the limit of detection (LOD) of the optimized method. The relative standard deviation (RSD) of parallel samples of surface water was ≤10%, and the spiked recovery rate ranged from 56.16% to 139.2%. These results indicate that the optimized solid-phase extraction process can achieve good enrichment efficiency of target antibiotics, meet the demand for accurate detection of low-concentration antibiotics in actual surface water bodies, and fully verify the detection capability of the optimized method.
In the 16 sampling sites, the overall concentration of antibiotics showed a distribution characteristic of “tributary downstream > tributary midstream > tributary upstream, Jinjiang River > Yuanhe River > Ganjiang River > Poyang Lake area”. The detection rates of SMX, SMZ, SDZ, and GAT were higher than 80%. From the perspective of antibiotic categories, the detection rate and concentration of sulfonamide antibiotics (especially sulfamethoxazole, SMX) were significantly higher than those of tetracyclines and quinolones, making them the main type of antibiotic pollution in the Poyang Lake watershed (Figure 9). The highest concentration of sulfamethoxazole reached 250.08 ng·L−1, which was detected in most sampling sites of Poyang Lake and its three tributaries, followed by chlortetracycline (CTC), with the highest concentration of 124.52 ng·L−1, mainly occurring in the Ganjiang River. In addition, the overall concentration of quinolone antibiotics was low, and the concentration in some sampling sites was close to the LOD of the optimized method, but the optimized method could still achieve effective detection. This further verifies the adaptability of the optimized method to different types of antibiotics, especially its ability to efficiently enrich high-concentration sulfonamide antibiotics and accurately capture the signals of low-concentration quinolone antibiotics, which meets the actual detection needs of multi-category and multi-concentration gradient antibiotics.
Table 4.
Summary table of solid-phase extraction method parameters.
Table 4.
Summary table of solid-phase extraction method parameters.
| Types | Sample Volume (mL) | pH | Filter Membrane (μm) | Na2EDTA (g) | SPE Cartridge | Enrichment (mL/min) | Elution | Recovery Indicator | LOD (ng/L) | Refs. |
|---|---|---|---|---|---|---|---|---|---|---|
| FQs, SAs, TCs | 1000 | 3 | 0.7 | 0.2 | HLB | 8~10 | 12 mL 0.1% (v/v) FA in MeOH | 78.5%~104.2% | 0.01–0.44 | This paper |
| FQs, SAs, TCs | 1000 | 3 | 0.45 | - | HLB | - | MeOH | 65~124% | 0.2–1.3 | [26] |
| FQs, SAs, TCs | 500 | 3 | 0.45 | 0.25 | HLB | 3 | 4 mL MeOH | 79.1~123.8% | 0.15–1.04 | [27] |
| FQs, SAs, TCs | 1000 | 4 | 0.45 | 0.2 | HLB | 5 | MeOH | 62.8~106.6% | 0.07–1.78 | [48] |
| FQs, SAs, TCs, MLs | 1000 | 3 | - | 0.2 | HLB | 5~10 | 12 mL MeOH | 70~130% | 0.18–2.8 | [14] |
| FQs, SAs, TCs, MLs | 1000 | 4 | 0.45 | - | HLB | - | 12 mL MeOH | 60~132% | 0.01–4.91 | [49] |
| FQs, SAs, TCs, MLs | 1000 | 3 | 0.7 | 0.4 | HLB | 5 | 10 mL MeOH | 71.5~107% | 0.1–1.8 | [50] |
| FQs, SAs, TCs, MLs | 500 | 3 | 0.45 | 0.25 | HLB | 3–5 | 6 mL MeOH | 70.2~120.1% | 0.05–1.66 | [51] |
| FQs, SAs, TCs, MLs | 1000 | 6–8 | 0.22 | 0.025 | HLB | 0.4 | - | 80.1~125% | 0.015–3.56 | [52] |
| FQs, SAs, TCs, MLs | 200–400 | 4–4.2 | 0.7 | - | HLB | 3 | 5 mL MeOH | 43~112% | 0.5 | [53] |
| FQs, SAs, TCs, MLs | 1000 | 4 | 0.45 | - | HLB | 10 | 3 mL MeOH | 68~112% | 0.1–1.2 | [40] |
| FQs, SAs, TCs, MLs | 1000 | 3 | 0.22 | 0.5 | HLB | 5~10 | 5 mL MeOH 4 mL Ethyl acetate 3 mL Dichloromethane | 30~243% | 0.7–5.23 | [54] |
| FQs, SAs, TCs, MLs, β-LCs | 2000 | 3 | 0.7 | 0.5 | HLB | 3 | 10 mL MeOH | 56~125% | 0.01–0.3 | [55] |
| FQs, SAs, TCs, MLs, NDs | 500 | 2.5 | 0.45 | 0.2 | HLB | 10 | 6 mL MeOH | 68~125% | 0.3–1.7 | [34] |
| FQs, SAs, MLs | 200 | 3 | 0.45 | 0.2 | HLB | 3~5 | 8 mL MeOH | 72.1~123.7% | 0.01–0.08 | [24] |
| FQs, SAs, MLs, CFs | 800 | 3 | 0.45 | 0.25 | HLB | 5~10 | 14 mL MeOH | 77.7~98.8% | 0.01–1.32 | [23] |
| FQs | 1000 | 3 | 0.22 | - | HLB | 1~2 | 6 mL MeOH | 94.8~123.9% | 0.2–1.2 | [25] |
| FQs | 500 | 2 | 0.45 | 0.5 | HLB | 5–10 | 12 mL MeOH | 56.7~101.9% | 0.25–2.5 | [56] |
| FQs | 1000 | 2 | 0.45 | - | HLB | 8–12 | 5 mL MeOH | 58.6~104.2% | 0.08–0.3 | [57] |
| SAs | 500 | 6 | 0.45 | 0.5 | HLB | 3 | 5.5 mL MeOH | 77.9~104.9% | 0.12–0.84 | [46] |
| SAs, MLs | 1000 | 2.5–7 | 0.45 | - | HLB | 5 | 12 mL MeOH | 50~127% | 0.005–3.96 | [45] |
| TCs | 200 | 3 | 0.45 | 0.2 | MAX, HLB | 3 | 10 mL 0.1% (v/v) FA in MeOH | 58.3~88.0% | 0.01–0.03 | [58] |
Note: Macrolides (MLs), quinolones (FQs), sulfonamides (Sas), tetracyclines (TCs), nitroimidazole (NDs), cephalosporins (CFs), 3β-lactams (β-LCs).

Figure 9.
Concentration distribution of 20 antibiotics in Poyang Lake and its three typical tributaries.
Figure 9.
Concentration distribution of 20 antibiotics in Poyang Lake and its three typical tributaries.

Table 5.
Concentrations of 20 antibiotics in Poyang Lake and its three typical tributaries (ng·L−1).
Table 5.
Concentrations of 20 antibiotics in Poyang Lake and its three typical tributaries (ng·L−1).
| Types | Poyang Lake | Ganjiang River | Jinjiang River | Yuanhe River | ||||||||||||
|---|---|---|---|---|---|---|---|---|---|---|---|---|---|---|---|---|
| P1 | P2 | P3 | P4 | G1 | G2 | G3 | G4 | J1 | J2 | J3 | J4 | Y1 | Y2 | Y3 | Y4 | |
| DOC | ND | 4.17 | 0.88 | 3.23 | 25.68 | 1.16 | 82.35 | 7.96 | 0.18 | ND | 0.36 | ND | 0.57 | 0.18 | ND | 58.23 |
| CTC | 1.06 | 10.28 | 0.65 | ND | 7.51 | 124.52 | 20.09 | 15.69 | 11.81 | ND | 13.03 | ND | ND | ND | ND | ND |
| TC | 3.84 | 4.11 | ND | ND | 16.23 | 13.66 | 2.89 | ND | 10.34 | ND | 2.68 | 4.71 | ND | ND | 3.63 | ND |
| OTC | 0.46 | 3.34 | 1.80 | ND | 1.49 | 4.03 | 17.66 | 31.04 | 7.70 | 30.43 | 3.92 | 3.50 | ND | ND | ND | ND |
| ENO | 2.13 | ND | 7.62 | ND | ND | 1.81 | ND | ND | 9.16 | 1.20 | 1.64 | 3.94 | 10.95 | 6.53 | 4.25 | 5.62 |
| FLE | 0.61 | ND | 1.11 | ND | 0.24 | ND | ND | ND | ND | 0.37 | 0.35 | 2.75 | ND | ND | ND | ND |
| NOR | 1.19 | ND | 7.38 | ND | ND | ND | ND | ND | ND | 1.04 | 1.30 | 8.27 | ND | ND | 1.30 | ND |
| OFL | 0.53 | ND | 0.29 | ND | 0.27 | 0.52 | 1.91 | 0.79 | 0.82 | 5.37 | 1.95 | 9.31 | 0.71 | 4.46 | 1.51 | ND |
| CIP | ND | 1.30 | ND | ND | 4.01 | ND | ND | ND | ND | 0.33 | 0.38 | 1.17 | ND | ND | ND | ND |
| LOM | 0.45 | ND | ND | ND | ND | 0.21 | ND | ND | ND | 0.23 | ND | 2.47 | ND | ND | ND | ND |
| ENR | ND | 0.87 | 3.33 | ND | 0.44 | 1.25 | 2.44 | 1.31 | 0.15 | 0.25 | 3.46 | 19.96 | ND | ND | ND | ND |
| GAT | 4.39 | 3.13 | 10.41 | 10.59 | 14.47 | 23.85 | 41.07 | 2.60 | 0.51 | ND | ND | 4.81 | 0.79 | 0.75 | 1.11 | ND |
| SPA | ND | ND | ND | ND | ND | ND | ND | ND | ND | ND | ND | ND | ND | ND | ND | ND |
| SDZ | ND | 0.18 | 1.44 | ND | 0.29 | 0.41 | 0.39 | 0.43 | 1.43 | 2.08 | 7.90 | 24.74 | 1.73 | 1.63 | 3.76 | ND |
| SPD | 0.13 | 0.14 | ND | ND | ND | ND | ND | 0.80 | ND | 0.22 | 0.16 | 1.45 | ND | 0.77 | 0.56 | ND |
| STZ | ND | ND | 0.10 | ND | ND | ND | ND | ND | ND | ND | ND | ND | ND | ND | ND | ND |
| SMZ | 0.19 | 0.72 | 0.14 | ND | 0.44 | 0.55 | 0.51 | 0.42 | 12.75 | 6.11 | 1.07 | 1.78 | 0.47 | 0.27 | 0.64 | 1.22 |
| SFM | ND | ND | ND | ND | ND | ND | ND | ND | ND | ND | ND | ND | ND | ND | ND | ND |
| STP | ND | ND | ND | ND | ND | ND | ND | ND | ND | ND | ND | ND | ND | ND | ND | ND |
| SMX | 72.69 | 51.56 | 0.25 | ND | 35.35 | 60.59 | 64.55 | 27.88 | 184.35 | 101.46 | 117.46 | 250.08 | 87.67 | 158.76 | 29.08 | 89.76 |
Note: ND = not detected.
4. Conclusions
This study carried out comparative optimization research on the solid-phase extraction (SPE) pretreatment process for 20 antibiotics, including tetracyclines, quinolones, and sulfonamides, in water bodies. Key conditions such as the pH of acidified water samples, Na2EDTA dosage, SPE cartridge and related operating parameters, and the type and volume of elution solvent were sequentially optimized through single-factor experiments. The optimized method was then applied to the detection of actual surface water samples collected from 16 sampling sites in Poyang Lake and its three typical tributaries (Ganjiang River, Jinjiang River, and Yuanhe River) to verify the practicability, reliability, and adaptability of the method. The results of practical application showed that this method successfully detected 17 antibiotics in the water bodies of the Poyang Lake watershed; SPA, STP, and SFM were not detected. The relative standard deviation (RSD) of parallel samples was ≤10%, and the spiked recovery rate ranged from 56.16% to 139.2%, which can meet the demand for accurate detection of low-concentration antibiotics in actual surface water bodies. Meanwhile, it was clarified that the antibiotic concentration in the Poyang Lake watershed showed a distribution characteristic of “Jinjiang River > Yuanhe River > Ganjiang River > Poyang Lake area”. Sulfonamide antibiotics (especially sulfamethoxazole, with a maximum concentration of 250.08 ng·L−1) were the main type of pollution in the watershed. Although the overall concentration of quinolone antibiotics was low and some were close to the limit of detection (LOD), the optimized method could still achieve effective detection, which fully verified the wide adaptability of this method to antibiotics of different categories and concentration gradients.
Author Contributions
Conceptualization, M.W. and P.L.; methodology, M.W.; validation, M.W. and H.K.; formal analysis, M.W.; investigation, M.W. and H.K.; resources, P.L.; data curation, M.W.; writing—original draft preparation, M.W.; writing—review and editing, P.L. and H.K.; visualization, M.W.; supervision, P.L.; project administration, P.L.; funding acquisition, P.L. All authors have read and agreed to the published version of the manuscript.
Funding
This research was funded by the 2025 Langfang Science and Technology Research and Development Program, grant number 2025013130.
Data Availability Statement
The original contributions presented in this study are included in the article. Further inquiries can be directed to the corresponding authors.
Acknowledgments
Here, we express our heartfelt thanks to all the individuals who have contributed to this study. Special thanks to Li Ping for the financial support and technical guidance of the project research, and thanks to Kong Huimin for his opinions and suggestions on the writing of the paper. We are also grateful for the support provided by the Institute of Disaster Prevention, School of Disaster Prevention and Mitigation Engineering, which has been instrumental in our work.
Conflicts of Interest
The authors declare no conflicts of interest.
References
- Rosato, R.; Castellani, F.; Ricci, M.; Manucci, A.; Di Simone, V.; Scortichini, G.; Saluti, G. Antibiotics in the aquatic environment. A deep voyage across chemical occurrence data, socio-economic relationships and international policies on antimicrobial consumption and resistance within 2014–2024. Sci. Total Environ. 2025, 1002, 180543. [Google Scholar] [CrossRef]
- Chen, Y.; Li, Y.; Sidikjan, N.; Jiang, Y.; Yao, Y.; Yang, J.; Li, Y.; Du, W.; Shen, H.; Liu, M.; et al. Evaluation of the environmental fate and risks of antibiotics in the Yangtze River Basin using a dynamic gridded multimedia fugacity model. Emerg. Contam. 2026, 100630. [Google Scholar] [CrossRef]
- Medne, R.; Kokorite, I.; Bartkevics, V.; Kublina, A.; Niemi, A.; Plostinš, H.; Vehi, M.; Mingarelli, S. Linking aquaculture practices to antibiotic occurrence, accumulation, and environmental risk in freshwater systems. Aquat. Toxicol. 2026, 292, 107744. [Google Scholar] [CrossRef] [PubMed]
- Dolu, T.; Nas, B. Fate evaluation of antibiotics and metabolites in an advanced biological wastewater treatment plant in the wastewater-sewage sludge-side-stream continuum: A holistic approach. J. Water Process Eng. 2026, 83, 109652. [Google Scholar] [CrossRef]
- Xu, B.; Zhu, H.; Dai, Y.; Zhang, H.; Qian, Z.; Pu, M.; Tadayuki, F.; Qiu, W.; Sun, R.; Zhao, M.; et al. Occurrence, fate and correlation analysis of antibiotics and antibiotic resistance genes (ARGs) in rural domestic wastewater treatment facilities. Environ. Res. 2026, 294, 123830. [Google Scholar] [CrossRef] [PubMed]
- Astrologo, E.M.; Espino, M.P. Antibiotics in pig and chicken farm soils in Asia: Environmental impacts and perspectives. Sci. Total Environ. 2025, 1002, 180618. [Google Scholar] [CrossRef]
- Su, H.; Yi, N.; Zhang, X.; Hu, X.; Xu, W.; Xu, Y.; Wen, G.; Cao, Y. Tracing antibiotic fate in Chinese sea bass aquaculture: Implications for food safety and sustainability. J. Environ. Chem. Eng. 2026, 14, 121237. [Google Scholar] [CrossRef]
- Mallick, C.; Sreedevi, A.; Mukherjee, T.K.; Pal, D.; Das, R.; Mondal, S.; Gautam, M. Accessibility, detection, bioaccumulation, concentration and toxicity studies of antibiotics in fish. Aquat. Toxicol. 2025, 287, 107525. [Google Scholar] [CrossRef]
- Qin, Y.; Zhang, S.; Shi, J.; Gong, H. An improved pretreatment method for efficient detection of antibiotic residues in aquatic products by LC-MS/MS. J. Pharm. Biomed. Anal. 2025, 266, 117114. [Google Scholar] [CrossRef]
- Stoian, I.-A.; Iacob, B.-C.; Bodoki, E. Electrochemical sensors for the detection of macrolide antibiotics: A review. Microchem. J. 2025, 218, 115373. [Google Scholar] [CrossRef]
- Hassan, Z.; Dinh, T.Q.; Vo Duy, S.; Frigon, D.; Goeury, K.; Sauvé, S. Quantification of fluoroquinolones, triclosan and triclocarban in wastewater and biosolids by on-line solid-phase extraction LC-MS/MS. Heliyon 2025, 11, e44075. [Google Scholar] [CrossRef]
- Brunelle, L.D.; Stebel, E.K.; Batt, A.L.; Chao, A.; Ferland, T.M. Examining chemical space coverage of solid phase extraction methods in environmental water for use with LC-MS non-targeted analysis methods. Sci. Total Environ. 2025, 1002, 180606. [Google Scholar] [CrossRef] [PubMed]
- Wei, X.O.; Zhao, Y.; Ling, Y.; Chen, X.; Liang, B.; Ben, Y.; Andrews, C.B.; Sun, Z.; Zheng, C. Advancing antibiotic detection in environmental waters: Standardization of solid phase extraction procedures and development of certified reference materials. Sustain. Horiz. 2025, 15, 100153. [Google Scholar] [CrossRef]
- Ding, H.; Wu, Y.; Zhang, W.; Zhong, J.; Lou, Q.; Yang, P.; Fang, Y. Occurrence, distribution, and risk assessment of antibiotics in the surface water of Poyang Lake, the largest freshwater lake in China. Chemosphere 2017, 184, 137–147. [Google Scholar] [CrossRef] [PubMed]
- Liang, X.; Guan, F.; Chen, B.; Luo, P.; Guo, C.; Wu, G.; Ye, Y.; Zhou, Q.; Fang, H. Spatial and seasonal variations of antibiotic resistance genes and antibiotics in the surface waters of Poyang Lake in China. Ecotoxicol. Environ. Saf. 2020, 196, 110543. [Google Scholar] [CrossRef]
- Qiu, X.; Pu, M.; Zhang, H.; Xu, B.; Wang, J.; Xuan, R. Occurrence, distribution, and correlation of antibiotics in the aquatic ecosystem of Poyang Lake Basin, China. J. Hazard. Mater. 2024, 479, 135656. [Google Scholar] [CrossRef]
- Dai, H.; Liu, Y.; Li, D.; Li, M.; Xiang, S.; Chen, S. Spatiotemporal dynamics and drivers of antibiotic resistance genes at the sediment-water interface in Poyang Lake: Responses to hydrological seasons. J. Environ. Chem. Eng. 2026, 14, 121764. [Google Scholar] [CrossRef]
- Hu, F.W. Distribution and Adsorption Behavior of Typical Antibiotics in Poyang Lake Basin; East China University of Technology: Nanchang, China, 2020. [Google Scholar]
- Wang, M. Detection, Distribution and Ecological Risk Assessment of Typical Antibiotics in Water Around Poyang Lake; East China University of Technology: Nanchang, China, 2023. [Google Scholar]
- Zheng, M.; Tang, S.; Bao, Y.; Daniels, K.D.; How, Z.T.; El-Din, M.G.; Wang, J.; Tang, L. Fully-automated SPE coupled to UHPLC-MS/MS method for multiresidue analysis of 26 trace antibiotics in environmental waters: SPE optimization and method validation. Environ. Sci. Pollut. Res. 2021, 29, 16973–16987. [Google Scholar] [CrossRef]
- Mol, H.G.; Plaza-Bolaños, P.; Zomer, P.; de Rijk, T.C.; Stolker, A.A.; Mulder, P.P. Toward a Generic Extraction Method for Simultaneous Determination of Pesticides, Mycotoxins, Plant Toxins, and Veterinary Drugs in Feed and Food Matrixes. Anal. Chem. 2008, 80, 9450–9459. [Google Scholar] [CrossRef] [PubMed]
- Kim, C.; Ryu, H.D.; Chung, E.G.; Kim, Y.; Lee, J.K. A review of analytical procedures for the simultaneous determination of medically important veterinary antibiotics in environmental water: Sample preparation, liquid chromatography, and mass spectrometry. J. Environ. Manag. 2018, 217, 629–645. [Google Scholar] [CrossRef]
- Fu, C.; Xu, B.; Chen, H.; Zhao, X.; Li, G.; Zheng, Y.; Qiu, W.; Zheng, C.; Duan, L.; Wang, W. Occurrence and distribution of antibiotics in groundwater, surface water, and sediment in Xiong’an New Area, China, and their relationship with antibiotic resistance genes. Sci. Total Environ. 2022, 807, 151011. [Google Scholar] [CrossRef] [PubMed]
- Gu, D.; Feng, Q.; Guo, C.; Hou, S.; Lv, J.; Zhang, Y.; Yuan, S.; Zhao, X. Occurrence and Risk Assessment of Antibiotics in Manure, Soil, Wastewater, Groundwater from Livestock and Poultry Farms in Xuzhou, China. Bull. Environ. Contam. Toxicol. 2019, 103, 590–596. [Google Scholar] [CrossRef] [PubMed]
- Ding, G.; Chen, G.; Liu, Y.; Li, M.; Liu, X. Occurrence and risk assessment of fluoroquinolone antibiotics in reclaimed water and receiving groundwater with different replenishment pathways. Sci. Total Environ. 2020, 738, 139802. [Google Scholar] [CrossRef]
- Hu, Y.; Yan, X.; Shen, Y.; Di, M.; Wang, J. Antibiotics in surface water and sediments from Hanjiang River, Central China: Occurrence, behavior and risk assessment. Ecotoxicol. Environ. Saf. 2018, 157, 150–158. [Google Scholar] [CrossRef] [PubMed]
- Gao, Z.G.; Liang, Y.P.; Zeng, H.H.; Qin, L.T. Determination of 15 antibiotic residues in water by solid phase extraction-ultra high performance liquid chromatography-triple quadrupole mass spectrometry. Chin. J. Anal. Lab. 2021, 40, 875–880. [Google Scholar]
- Wang, C. Complexation Behavior of Typical Pharmaceuticals and Heavy Metals in Water; Southeast University: Nanjing, China, 2016. [Google Scholar]
- Huang, X.F.; Xiong, Y.J.; Peng, K.M.; Lu, L.J.; Liu, J. Research progress on the effect of metal ion complexation on the removal characteristics of antibiotics. Environ. Chem. 2016, 35, 133–140. [Google Scholar]
- Guerra, W.; Silva-Caldeira, P.P.; Terenzi, H.; Pereira-Maia, E.C. Impact of metal coordination on the antibiotic and non-antibiotic activities of tetracycline-based drugs. Coord. Chem. Rev. 2016, 327–328, 188–199. [Google Scholar] [CrossRef]
- Hong, B.; Yu, S.; Zhou, M.; Li, J.; Ding, J.; Niu, Y. Development of a pH-paralleling approach of quantifying six-category pharmaceuticals in surface water using SPE-HPLC-MS/MS. Watershed Ecol. Environ. 2021, 3, 1–16. [Google Scholar] [CrossRef]
- Li, W.; Shi, Y.; Gao, L.; Liu, J.; Cai, Y. Occurrence of antibiotics in water, sediments, aquatic plants, and animals from Baiyangdian Lake in North China. Chemosphere 2012, 89, 1307–1315. [Google Scholar] [CrossRef]
- Batt, A.L.; Aga, D.S. Simultaneous Analysis of Multiple Classes of Antibiotics by Ion Trap LC/MS/MS for Assessing Surface Water and Groundwater Contamination. Anal. Chem. 2005, 77, 2940–2947. [Google Scholar] [CrossRef]
- Zhang, H.; Guo, W.J.; Liu, S.L.; Li, H.L.; Yue, T.X. Pollution characteristics and risk assessment of antibiotics in surface water of Nansi Lake and Dongping Lake. Environ. Chem. 2020, 39, 3279–3287. [Google Scholar]
- Liu, F.; Chen, L.; Huang, F.; Zou, S. The occurrence and distribution of antibiotics in the Karst river system in Kaiyang, Southwest China. Water Supply 2018, 18, 2044–2052. [Google Scholar] [CrossRef]
- Zhang, R.; Zhang, R.; Zou, S.; Yang, Y.; Li, J.; Wang, Y.; Yu, K.; Zhang, G. Occurrence, Distribution and Ecological Risks of Fluoroquinolone Antibiotics in the Dongjiang River and the Beijiang River, Pearl River Delta, South China. Bull. Environ. Contam. Toxicol. 2017, 99, 46–53. [Google Scholar] [CrossRef] [PubMed]
- Ren, J.Y. Antibiotic Pollution Distribution and Risk Assessment in Chaobai River Basin of Beijing; Beijing Jiaotong University: Beijing, China, 2021. [Google Scholar]
- Xue, Q.; Qi, Y.; Liu, F. Ultra-high performance liquid chromatography-electrospray tandem mass spectrometry for the analysis of antibiotic residues in environmental waters. Environ. Sci. Pollut. Res. Int. 2015, 22, 16857–16867. [Google Scholar] [CrossRef] [PubMed]
- Mokh, S.; El Khatib, M.; Koubar, M.; Daher, Z.; Al Iskandarani, M. Innovative SPE-LC-MS/MS technique for the assessment of 63 pharmaceuticals and the detection of antibiotic-resistant-bacteria: A case study natural water sources in Lebanon. Sci. Total Environ. 2017, 609, 830–841. [Google Scholar] [CrossRef]
- Di, X.; Cui, X.C.; Sun, K.; Zhang, K.; Huang, T.Y. Determination of 7 antibiotic residues in drinking water by solid phase extraction/liquid chromatography tandem mass spectrometry. Mod. Chem. Ind. 2019, 39, 243–247. [Google Scholar]
- Chen, Y.S.; Luo, Y.M.; Zhang, H.B.; Song, J.; Huang, Y.J. Effects of flow rate and water removal method on solid phase extraction of phthalate esters in environmental water samples. Environ. Chem. 2010, 29, 954–959. [Google Scholar]
- Wang, Y.X.; Liu, S.J.; Li, Q.; Wang, B. Determination of 10 antibiotics in water by automatic solid phase extraction-ultra performance liquid chromatography-tandem mass spectrometry. J. Environ. Health 2018, 35, 75–77. [Google Scholar]
- Rossmann, J.; Schubert, S.; Gurke, R.; Oertel, R.; Kirch, W. Simultaneous determination of most prescribed antibiotics in multiple urban wastewater by SPE-LC-MS/MS. J. Chromatogr. B Analyt. Technol. Biomed. Life Sci. 2014, 969, 162–170. [Google Scholar] [CrossRef]
- Yuan, S.F.; Liu, Z.H.; Yin, H.; Dang, Z.; Wu, P.X.; Zhu, N.W.; Lin, Z. Trace determination of sulfonamide antibiotics and their acetylated metabolites via SPE-LC-MS/MS in wastewater and insights from their occurrence in a municipal wastewater treatment plant. Sci. Total Environ. 2019, 653, 815–821. [Google Scholar] [CrossRef]
- Shi, X.; Bu, Q.W.; Wu, D.K.; Yun, M.Q.; He, X.F.; Li, W.C.; Yu, G. Development of SPE-HPLC-MS/MS method for the determination of 10 antibiotics in surface water. Environ. Chem. 2020, 39, 1075–1083. [Google Scholar]
- Pang, X.R.; Zeng, H.H.; Liang, Y.P.; Qin, L.T.; Mo, L.Y. Determination of 10 sulfonamide antibiotic residues in surface water by solid phase extraction-ultra performance liquid chromatography-tandem mass spectrometry. J. Anal. Sci. 2019, 35, 461–466. [Google Scholar]
- Song, H.J.; Xie, W.M.; Wang, J.; Chen, X.F.; Yan, C.M.; Sha, X.N.; Liu, H.; Li, B.L. Simultaneous determination of 15 antibiotics in 4 categories in water environment by SPE-UPLC-MS/MS. Chin. J. Anal. Lab. 2022, 41, 50–54. [Google Scholar]
- Jiang, M.H.; Wang, J.P.; Zhao, Y.G. Simultaneous determination of 12 antibiotics in seawater by solid phase extraction-high performance liquid chromatography-tandem mass spectrometry. J. Ocean Univ. China 2021, 51, 107–114. [Google Scholar]
- Yao, L.; Wang, Y.; Tong, L.; Deng, Y.; Li, Y.; Gan, Y.; Guo, W.; Dong, C.; Duan, Y.; Zhao, K. Occurrence and risk assessment of antibiotics in surface water and groundwater from different depths of aquifers: A case study at Jianghan Plain, central China. Ecotoxicol. Environ. Saf. 2017, 135, 236–242. [Google Scholar] [CrossRef] [PubMed]
- Jiang, Y.; Li, M.; Guo, C.; An, D.; Xu, J.; Zhang, Y.; Xi, B. Distribution and ecological risk of antibiotics in a typical effluent-receiving river (Wangyang River) in north China. Chemosphere 2014, 112, 267–274. [Google Scholar] [CrossRef]
- Liao, J.; Li, Q.S. Optimization and application of solid phase extraction-high performance liquid chromatography-tandem mass spectrometry for the determination of 13 antibiotics. Environ. Chem. 2022, 41, 1538–1547. [Google Scholar]
- Sun, H.J.; Li, P.W.; Zhang, B.B.; Chen, H.M. Determination of 42 antibiotic residues in 7 categories in water by large volume direct injection-ultra performance liquid chromatography-triple quadrupole mass spectrometry. Chin. J. Chromatogr. 2022, 40, 333–342. [Google Scholar] [CrossRef]
- Huang, Q.X.; Chen, Q.; Lei, M.; Wei, G.L.; Chou, T.S. Simultaneous determination of multiple trace antibiotics in water by high performance liquid chromatography-mass spectrometry using isotope internal standard dilution. Environ. Chem. 2016, 35, 1493–1499. [Google Scholar]
- Chen, Y.; Xie, Q.; Wan, J.; Yang, S.; Wang, Y.; Fan, H. Occurrence and risk assessment of antibiotics in multifunctional reservoirs in Dongguan, China. Environ. Sci. Pollut. Res. 2020, 27, 13565–13574. [Google Scholar] [CrossRef]
- Zainab, S.M.; Junaid, M.; Rehman, M.Y.A.; Lv, M.; Yue, L.; Xu, N.; Malik, R.N. First insight into the occurrence, spatial distribution, sources, and risks assessment of antibiotics in groundwater from major urban-rural settings of Pakistan. Sci. Total Environ. 2021, 791, 148298. [Google Scholar] [CrossRef]
- Yao, Q.Y.; He, D.C.; Gong, D.X.; Ding, Z.R.; Zhao, B.; Zhang, M.W.; Li, Y.Q. Determination of 5 quinolone antibiotics in wastewater by high performance liquid chromatography-tandem mass spectrometry. Chin. J. Environ. Monit. 2017, 33, 139–146. [Google Scholar]
- Ding, Z.R.; Li, Y.Q.; Wang, X.; Yan, Y.N.; Li, Y.X.; Xu, W.J.; Li, X.X.; Chen, M.J.; Jin, M. Determination of 17 fluoroquinolone antibiotics in aquaculture wastewater by solid phase extraction-liquid chromatography-triple quadrupole tandem mass spectrometry. Chin. J. Environ. Eng. 2021, 16, 674–683. [Google Scholar]
- Huang, X.; Chen, C.; Zeng, Q.; Ding, D.; Gu, J.; Mo, J. Field study on loss of tetracycline antibiotics from manure-applied soil and their risk assessment in regional water environment of Guangzhou, China. Sci. Total Environ. 2022, 827, 154273. [Google Scholar] [CrossRef]


Disclaimer/Publisher’s Note: The statements, opinions and data contained in all publications are solely those of the individual author(s) and contributor(s) and not of MDPI and/or the editor(s). MDPI and/or the editor(s) disclaim responsibility for any injury to people or property resulting from any ideas, methods, instructions or products referred to in the content. |
© 2026 by the authors. Licensee MDPI, Basel, Switzerland. This article is an open access article distributed under the terms and conditions of the Creative Commons Attribution (CC BY) license.