Abstract
Atmospheric moisture availability plays a central role in regulating the occurrence and persistence of extreme precipitation, but its temporal linkage with large-scale moisture transport remains insufficiently quantified at the global scale. This study examines the lagged relationship between moisture transport across the land–ocean interface and extreme precipitation using ERA5 reanalysis data for the period 1979–2020. Extreme precipitation is characterized using the R95pTOT index, which measures the total precipitation accumulated during very wet periods. Vertically integrated moisture fluxes are projected onto coastal boundaries to quantify inflow, outflow, and netflow components of moisture transport. Lagged Pearson correlations as well as the p-value between these components and R95pTOT are evaluated globally and for four representative regions: the Asian Monsoon, the Amazon Basin, the Gulf of Mexico and North America, and West Africa. The results show that moisture inflow is positively associated with extreme precipitation across most regions, indicating that enhanced ocean-to-land moisture transport supports increased atmospheric moisture availability during extreme events. The strongest and most persistent relationships are found in tropical regions, where significant inflow–precipitation correlations persist for approximately 5–10 days. In contrast, mid-latitude coastal regions exhibit weaker and more transient relationships, consistent with the influence of rapidly evolving synoptic systems. Netflow correlations generally display weaker and more regionally dependent associations with extreme precipitation, with outflow showing weak or negative relationships in some regions, particularly in West Africa. Overall, the findings demonstrate that both the direction and temporal persistence of moisture transport play an important role in shaping regional differences in extreme precipitation.
1. Introduction
Extreme precipitation events pose major hydrological and societal risks, including flooding, landslides, and damage to infrastructure [1,2]. The occurrence and intensity of such events depend strongly on atmospheric moisture availability, which governs how much water vapor can be converted into precipitation over a given period [3]. Because most atmospheric moisture originates from the oceans, the delivery of oceanic water vapor to land plays a central role in shaping where and when extreme precipitation occurs [4,5].
From an atmospheric perspective, land regions often function as net sinks of atmospheric moisture, where advected (imported) vapor is removed mainly through precipitation [6,7]. The efficiency and persistence of this moisture delivery influence not only mean rainfall but also the clustering and duration of extreme events [8,9]. Understanding how large-scale moisture transport modulates atmospheric moisture availability is therefore essential for explaining regional differences in extreme precipitation behavior [10].
Extreme precipitation also has important implications for water availability in agricultural systems, particularly in water-scarce and semi-arid regions [11,12]. Irrigated agriculture accounts for a large fraction of global consumptive freshwater use, making crop production sensitive not only to total precipitation but also to the timing and persistence of rainfall [13,14,15,16]. Rainfall delivered over short periods can exceed soil infiltration capacity and enhance runoff, while extended dry intervals between events increase irrigation demand and pressure on surface and groundwater resources [17,18]. As a result, the hydrological relevance of extreme precipitation depends not only on rainfall magnitude but also on how atmospheric moisture is supplied and maintained through time.
Effective agricultural water management therefore operates within a broader hydroclimatic context controlled by atmospheric processes [12,19]. While advances in irrigation technology, soil management, and crop selection can improve water use efficiency at the field scale, their effectiveness ultimately depends on the variability and predictability of precipitation [20,21]. In this sense, large-scale moisture transport from ocean to land represents an upstream control on atmospheric moisture availability that shapes the conditions under which water resources are generated and utilized [7,22].
A warming atmosphere can hold substantially more water vapor, with an approximate increase of 6–7% per degree of warming [23,24]. This thermodynamic relationship has been linked to widespread intensification of extreme precipitation [2,7]. However, many studies focus on changes in precipitation statistics or large-scale moisture convergence without explicitly examining how moisture physically enters or exits land regions [22,25]. Eulerian measures such as vertically integrated moisture flux divergence capture volumetric convergence but do not isolate directional moisture exchange [26,27]. Lagrangian trajectory methods can resolve moisture pathways but are computationally demanding and sensitive to model assumptions [28,29,30].
An intermediate and physically consistent perspective is provided by moisture transport across the land–ocean interface [22]. Coastal moisture transport (CMT) represents the component of vertically integrated moisture flux projected onto the coastal boundary and quantifies the net import or export of water vapor between ocean and land [7,27]. By resolving inflow, outflow, and their balance, CMT offers a direct measure of how atmospheric moisture availability over land is modulated by boundary fluxes.
Another limitation of existing studies concerns the treatment of precipitation extremes. Many analyses emphasize the frequency of extreme precipitation days, which does not capture the total amount of water delivered during such events [3]. For hydrological impacts, the accumulated precipitation associated with very wet days is often more relevant. The R95pTOT index, defined as the total precipitation from days exceeding the 95th percentile threshold [31,32], provides an integrated measure of extreme rainfall that is closely linked to flood risk and water availability.
Despite growing interest in moisture pathways, the temporal relationship between moisture transport and extreme precipitation remains poorly characterized at the global scale. Few studies have examined whether anomalies in moisture inflow occur several days before extreme precipitation, how long such linkages persist, or how inflow and outflow interact across different climatic regimes. In some regions, such as monsoon-dominated areas, persistent moisture supply may support multi-day extreme events [33]. In others, including parts of mid-latitude North America, extreme precipitation is often driven by transient synoptic systems, leading to weaker and less persistent connections with moisture transport [34]. The Amazon Basin and West Africa present additional complexity due to strong oceanic inflow, internal recycling, and competing moisture pathways [7].
To address these gaps, this study investigates the lagged relationship between moisture transport and extreme precipitation using ERA5 reanalysis data from 1979 to 2020. Vertically integrated moisture fluxes are projected onto the global coastline to derive inflow, outflow, and netflow components, which are correlated with R95pTOT across a range of positive lags to examine potential lead–lag relationships. The specific lag range is described in Section 2.4. A global analysis is followed by detailed regional assessments in four contrasting domains: the Amazon Basin, the Asian Monsoon region, the Gulf of Mexico and North America, and West Africa. These analyses clarify how moisture transport governs atmospheric moisture availability and shapes the timing and intensity of extreme precipitation across diverse hydroclimatic settings.
2. Data, Methods, and Global Background
2.1. Data
The analysis is based on ERA5 reanalysis data produced by European Centre for Medium-Range Weather Forecasts [35]. ERA5 provides global atmospheric fields from 1979 to 2020 on a native horizontal resolution of 0.25° × 0.25°. The atmospheric variables used include specific humidity, zonal and meridional wind components, and surface pressure, which are required to compute vertically integrated moisture fluxes. These variables are available at four synoptic times per day (00:00, 06:00, 12:00, and 18:00 UTC) on 18 standard pressure levels spanning from 1000 to 150 hPa.
In addition, ERA5 total column water vapor (TCWV; hereafter W) is used to represent column moisture storage and to support the calculation of the turnover time (TUT) metric. Total precipitation from ERA5 is used to construct the extreme precipitation index, as well as TUT. Precipitation is first aggregated from the native sub-daily resolution to daily totals prior to the identification of extreme events. ERA5 precipitation is known to have limitations, particularly in representing convective rainfall due to model parameterization. Previous studies have reported biases in the diurnal cycle and localized intensity of convective events [36]. In this study, the focus is on large-scale spatial variability and lagged relationships rather than point-scale rainfall intensity. The correlation analysis focuses on relative variability and temporal co-variability between moisture transport and extreme precipitation. As a result, while convective biases may influence local magnitudes, they are unlikely to affect the large-scale temporal relationships examined here. All moisture flux calculations are performed on the native ERA5 grid without spatial interpolation in order to preserve consistency between atmospheric fluxes and coastal grid geometry.
To identify land–ocean interfaces, a global coastline dataset is employed. Coastal boundaries are derived from the Natural Earth global coastline database at 10 m resolution, which provides a high-quality representation of continental outlines. This coastline dataset is used to delineate coastal grid cells and to define the land–ocean interface along which moisture transport is evaluated.
2.2. Coastal Moisture Transport
CMT is calculated from the vertically integrated moisture flux by extracting the component that crosses the land–ocean boundary. First, a land–sea mask is used to identify coastal grid cells. For each coastal cell, an outward pointing unit normal vector nk is defined. The zonal and meridional components of the vertically integrated moisture flux, Qu and Qv, form the flux vector Qk= (Qu, Qv) at that location. The transport normal to the coastline is then
where dk is the length of the coastline segment represented by the grid cell. Positive Tk indicates moisture transport from the ocean toward the land, and negative Tk indicates transport from land toward the ocean.
For each coastal region, the total inflow and outflow are obtained by summing Tk over all coastal segments with positive and negative values, respectively. The difference between inflow and outflow defines the netflow. These three components, inflow, outflow and netflow, form the CMT time series used in the correlation analysis with extreme precipitation.
2.3. Extreme Precipitation Index
Extreme precipitation is represented by the R95pTOT index. This index measures the total rainfall amount contributed by very wet days. Let Pi be the daily precipitation and P95 be the ninety-fifth percentile of the daily precipitation distribution at a given grid cell. The index is defined as
To better represent multi-day events, ERA5 daily precipitation is first aggregated into five day totals. The seasonal cycle and a linear trend are removed from this series, and the percentile threshold P95 is then estimated from the adjusted values. The R95pTOT index is computed by summing all five day totals that exceed this threshold. The result is a time series that reflects the accumulated water volume associated with very wet periods and is used as the extreme precipitation metric throughout this study.
Among the commonly used Climate Change Detection and Indices (ETCCDI) precipitation indices, we chose R95pTOT because it measures the total rainfall amount associated with very wet periods. This study focuses on how changes in moisture transport relate to changes in extreme rainfall volume. Since CMT represents moisture transport intensity, an amount-based index is more directly comparable to it. Indices that count event frequency or duration are useful in other contexts, but they do not reflect the accumulated water amount linked to transport variability.
2.4. Lagged Correlation Between CMT and R95pTOT
The main objective of this work is to quantify how variations in CMT relate to variations in extreme precipitation through time. To do this, lagged Pearson correlation coefficients are calculated between the CMT components and the R95pTOT index. R95pTOT is defined as the total precipitation amount from days exceeding the 95th percentile threshold. For the lag analysis, a five-day running accumulation is applied to the daily R95pTOT series, and the accumulated value is recorded on the final day of each five-day window (i.e., representing the sum over days t − 4 to t). Let X(t) denote a CMT time series (inflow, outflow or netflow) at a coastal grid point, and Y(t) denote the corresponding R95pTOT time series. The lagged correlation at lag τ is defined as
A positive lag τ means that changes in CMT precede changes in R95pTOT by τ days. Correlations are computed for lags from zero to twenty-four days. The upper limit of 24 days is selected based on the diagnosed range of atmospheric moisture TUT, described in Section 2.7. This range is chosen to cover the typical global spread of atmospheric moisture turnover time, which is short in tropical convection zones and longer in subtropical dry regions.
Statistical significance is evaluated using a two-tailed Student t test. The p values are retained together with the correlation coefficients so that both effect size and statistical confidence can be assessed. In the main text, only the netflow correlations at zero lag are shown for each region. The complete set of inflow, outflow, netflow and p value maps for all lags is provided in the Supplementary Information (SI).
2.5. Study Regions
To examine regional differences in the CMT–extreme precipitation relationship, four coastal domains are selected. These are the Amazon Basin (AB), the Asian Monsoon region (AM), the Gulf of Mexico and North America (GMNA) and West Africa (WA). They represent deep tropical rainforest, monsoonal circulation, subtropical and mid-latitude coastal systems and a monsoon–desert transition [37,38]. The geographical boundaries of these domains are shown in Table 1. The same masks are used consistently in all later analyses so that results for CMT and R95pTOT are directly comparable across regions.

Table 1.
Study regions.
2.6. Moisture Divergence and Precipitation Background
Moisture divergence provides a large-scale view of how water vapor is supplied and removed by the circulation. Using the vertically integrated flux components from the CMT calculation, horizontal divergence on a spherical surface is written as
where α is the Earth’s radius, ϕ is the latitude, λ is the longitude, and Q = (Qu, Qv) is the vertically integrated moisture flux. Negative values correspond to convergence and positive values to divergence. Annual and seasonal mean divergence fields are computed for 1979–2020 and compared with corresponding precipitation fields.
The resulting patterns are consistent with well-established features of the atmospheric hydrological cycle (Figure 1). Strong convergence is found along the Intertropical Convergence Zone and in other convective regions, and these areas coincide with bands of heavy precipitation. Divergence dominates in subtropical dry zones and aligns with regions of scarce rainfall. At higher latitudes, alternating bands of convergence and divergence trace storm tracks. The close spatial correspondence between moisture convergence and precipitation is evident across both annual and seasonal means, particularly in tropical and monsoon regions. This correspondence reflects regions where atmospheric moisture availability is persistently enhanced by large-scale circulation. These climatological patterns provide a large-scale and physically consistent background for examining the temporal linkages between moisture transport and extreme precipitation in the subsequent CMT-R95pTOT analysis.
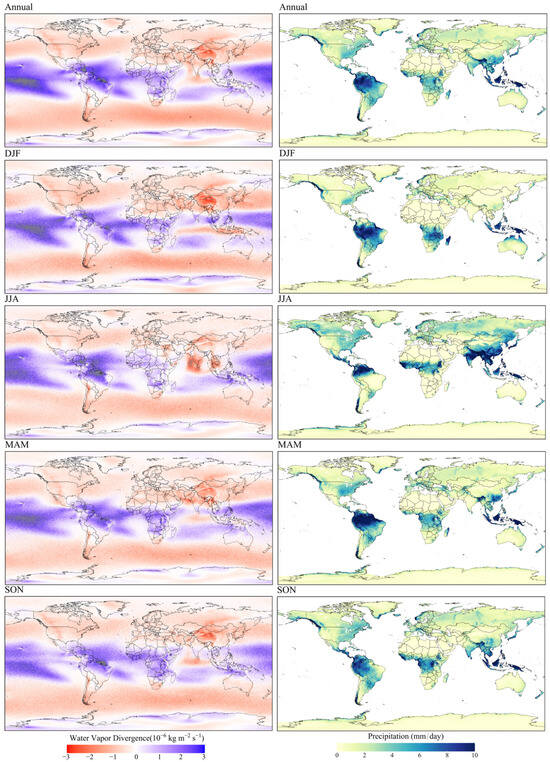
Figure 1.
Climatological mean of vertically integrated moisture divergence (left panels) and total precipitation (right panels) for the annual and four seasons (DJF, MAM, JJA, SON) during 1979–2020.
2.7. Atmospheric Moisture Turnover Time
The atmospheric moisture turnover time is used here as a physical reference for interpreting the time scale over which moisture anomalies can influence precipitation extremes. It is defined as the ratio between total column water vapor W and precipitation rate P [39]:
Both W and P are derived from ERA5. The turnover time is expressed in days. The results of TUT are shown in Figure 2. The seasonal distributions of TUT are also presented in Figure 2 for DJF, MAM, JJA, and SON in order to illustrate the seasonal variability of atmospheric moisture cycling. The overall spatial structure remains broadly consistent throughout the year. Short turnover times are concentrated in the deep tropical belt where intense convection and frequent precipitation rapidly convert atmospheric moisture into rainfall. In contrast, longer turnover times are observed in subtropical dry regions where precipitation is relatively weak and atmospheric moisture can persist in the atmosphere for longer periods. A clear seasonal migration of the short-turnover-time band can be observed following the meridional displacement of the Intertropical Convergence Zone (ITCZ) and associated monsoon systems. As the ITCZ shifts northward during boreal summer and southward during boreal winter, the regions of rapid moisture cycling shift accordingly.
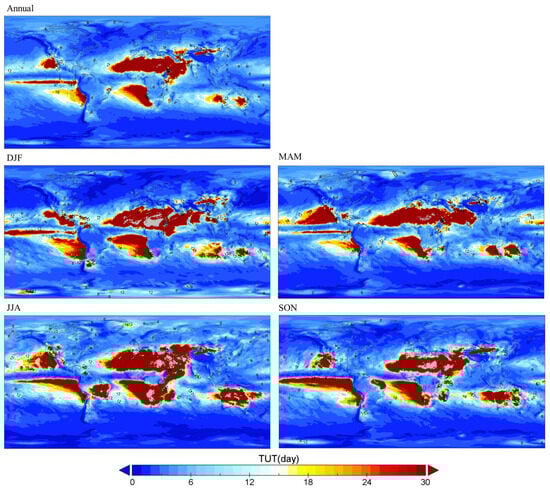
Figure 2.
Climatological distribution of atmospheric moisture turnover time (TUT) for 1979–2020. Panels show the annual mean and seasonal means for DJF, MAM, JJA, and SON. Shading indicates TUT (days), and contours denote corresponding values.
Across the globe, TUT values derived from ERA5 typically range from approximately 6 to 24 days. This range provides a physical reference for examining lagged relationships between moisture transport and precipitation extremes on time scales of several days to a few weeks. Based on this physical constraint, a lag window of 0–24 days is examined in Section 2.4. Short values are found in the deep tropics where moisture is quickly converted to rainfall, while long values appear in subtropical dry regions and at high latitudes. The global distribution of turnover time provides a physically grounded reference for interpreting the lagged CMT-R95pTOT relationships. Regions with short turnover times are characterized by rapid moisture cycling and a limited memory of atmospheric water vapor, whereas longer turnover times indicate greater persistence of atmospheric moisture availability, allowing transport anomalies to influence extreme precipitation over multi-day periods. In this study, atmospheric water availability is therefore interpreted from a transport perspective, focusing on the supply and persistence of water vapor in the atmosphere rather than terrestrial or surface water storage.
2.8. Global CMT-R95pTOT Correlation Background
Before focusing on the four selected regions, a global lag-zero correlation analysis is conducted along the entire coastline to provide a baseline view of CMT–extreme precipitation coupling. Correlations between each CMT component (inflow, netflow, and outflow) and R95pTOT are calculated at each coastal grid point for the period 1979–2020 (Figure 3). At the global scale, the most prominent positive correlations are concentrated along low-latitude coastlines, particularly across South and Southeast Asia, portions of tropical South America, and several tropical African coastal sectors. Inflow exhibits the clearest and strongest positive relationships in these regions, while outflow shows broadly similar spatial organization but with slightly weaker magnitudes. Netflow correlations are noticeably weaker and more spatially fragmented, indicating that the net exchange signal is less coherent at the global coastal-point scale. Negative correlations are present but are generally more localized, appearing intermittently along parts of the subtropical and mid-latitude coastlines and in a few coastal sectors adjacent to major dry regions. Overall, the global maps serve as a broad background for the regional analyses presented in the following sections.
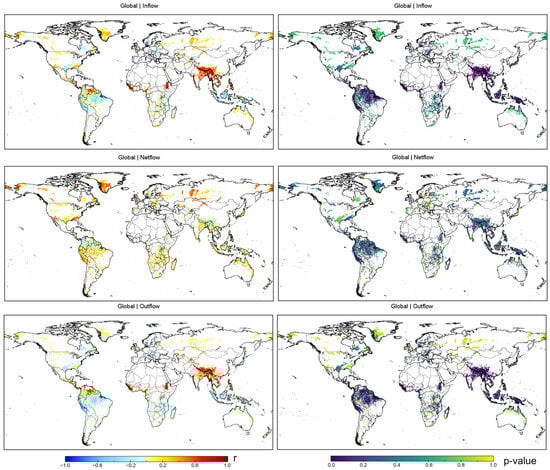
Figure 3.
Global correlation between coastal moisture transport (CMT) and R95pTOT for 1979–2020. Left column: Pearson correlation coefficients r. Right column: two-tailed p values from the t test. Rows: inflow (top), netflow (middle), outflow (bottom). R95pTOT is computed as 5-day totals above the 95th percentile after deseasonalization and detrending. CMT is evaluated on coastline grids.
3. Results and Discussion
The global analysis shows that CMT exhibits a consistent relationship with extreme precipitation, but the spatial structure and strength of this coupling vary markedly across climate regimes. To explore these differences in greater depth, four representative coastal domains are examined: AB, AM, GMNA, and WA. These regions span a wide range of circulation settings, including tropical convergence zones, monsoonal inflow, and midlatitude synoptic systems. This helps explain why the relationship between CMT and precipitation varies across regions.
Because lagged correlations produce a large number of figures, only the netflow correlation and p value is shown in the main text (Figure 4, Figure 5, Figure 6, Figure 7, Figure 8, Figure 9, Figure 10 and Figure 11). The complete set of inflow, outflow, and p-value maps for all lags from 0–24 days is included in the SI (Figures S1–S16). These SI results are referenced where they help clarify the regional behavior but are not individually interpreted.
3.1. Amazon Basin (AB)
The AB region shows a spatially coherent and predominantly positive relationship between moisture transport and extreme precipitation. Netflow–R95pTOT correlations (Figure 4) are positive across most of the basin, with moderate to locally strong values commonly exceeding 0.4 over the central and western Amazon. This spatial pattern indicates that enhanced net moisture inflow is associated with increased five-day precipitation totals during extreme precipitation events.

Figure 4.
Lagged correlation coefficients (r) between moisture netflow and R95pTOT in the Amazon Basin (AB). Each panel corresponds to a lag of 0–24 days.
Figure 4.
Lagged correlation coefficients (r) between moisture netflow and R95pTOT in the Amazon Basin (AB). Each panel corresponds to a lag of 0–24 days.

The persistence of positive correlations across multiple lag days suggests that Amazonian precipitation extremes are linked to continued large-scale moisture supply rather than short-lived synoptic variability. Extreme rainfall in this region therefore appears to depend on the maintenance of favorable atmospheric moisture conditions over several days. This behavior is consistent with previous studies identifying the tropical Atlantic as the dominant moisture source for Amazon rainfall, delivered through persistent low-level flow into the basin [40,41].
Lagged correlation maps for netflow (Figure 4) further illustrate this behavior, with significant correlations extending up to approximately 5 days. The corresponding p-value fields (Figure 5) confirm that these signals are statistically robust over large portions of the basin. The SI inflow maps (Figures S1 and S2) reveal an even stronger signal. Many coastal points and adjacent lowlands maintain significant positive correlations over several lag days. These patterns reflects the influence of the northeast trade winds and the South American low-level jet, both of which transport Atlantic moisture deep into the basin [42,43]. Earlier studies have highlighted the importance of persistent low-level advection in sustaining convection and multi-day rainfall events in this region, and the SI results align with this behavior. Outflow correlations (Figures S3 and S4) are weaker and show mixed signs. This suggests that outward moisture transport plays a less direct role in determining the timing of extreme precipitation events in the Amazon. Rainfall in this region tends to be moisture-limited only during certain phases of the seasonal cycle, while inflow remains the dominant control during extreme events.

Figure 5.
Corresponding p-values for the inflow correlations in Figure 4.
Figure 5.
Corresponding p-values for the inflow correlations in Figure 4.

Overall, the AB domain illustrates that extreme precipitation is closely linked to persistent moisture transport that enhances atmospheric moisture availability on multi-day timescales. The observed lag structure aligns with the short atmospheric TUT characteristic of the deep tropics and highlights the importance of continued moisture inflow for the development of prolonged heavy rainfall.
3.2. Asian Monsoon (AM)
The AM region exhibits the strongest coupling between moisture transport and extreme precipitation among the four domains. Netflow correlations are consistently positive across nearly the entire region (Figure 6), indicating that enhanced ocean-to-land moisture inflow is systematically associated with increased R95pTOT.

Figure 6.
Same as Figure 4 but for Asian Monsoon.
Figure 6.
Same as Figure 4 but for Asian Monsoon.

The highest correlation coefficients, frequently exceeding 0.6 and locally approaching 0.8, are concentrated over South Asia. Particularly strong signals appear along the Bay of Bengal, eastern India, Bangladesh, and the western Indochina Peninsula. These areas also coincide with regions where the correlations are statistically significant (p < 0.05) across most lag times, highlighting a robust and persistent relationship between moisture transport and extreme rainfall (Figure 7).

Figure 7.
Same as Figure 5 but for Asian Monsoon.
Figure 7.
Same as Figure 5 but for Asian Monsoon.

Supplementary inflow correlations (Figures S5 and S6) are even stronger and more spatially continuous than those based on netflow. Significant positive correlations persist across much of South Asia and the Bay of Bengal sector over many lag days, indicating a prolonged influence of moisture inflow on extreme precipitation. Outflow correlations (Figures S7 and S8), by contrast, are weaker and less spatially organized. Although positive values occur near parts of the coastline, they lack persistence across lags, suggesting that outward moisture transport does not exert a primary control on monsoon-related extremes.
In summary, the AM region is characterized by a dominance of inflow-driven moisture supply. Sustained oceanic moisture transport plays a central role in shaping atmospheric moisture availability and governs both the timing and intensity of extreme precipitation events.
3.3. Gulf of Mexico and North America (GMNA)
The GMNA region exhibits a more fragmented and spatially confined relationship between moisture transport and extreme precipitation. Netflow correlations (Figure 8) are predominantly positive along the Gulf-facing coastal zone, with typical values between 0.2 and 0.4. These signals weaken rapidly inland and become sparse away from the coast. Corresponding p-value maps (Figure 9) indicate that statistically significant correlations are largely restricted to coastal areas and vary substantially across lag days.

Figure 8.
Same as Figure 4 but for Gulf of Mexico and North America.
Figure 8.
Same as Figure 4 but for Gulf of Mexico and North America.


Figure 9.
Same as Figure 5 but for Gulf of Mexico and North America.
Figure 9.
Same as Figure 5 but for Gulf of Mexico and North America.

This spatial pattern reflects a circulation regime in which extreme precipitation is primarily controlled by transient synoptic-scale systems. Frontal disturbances, extratropical cyclones, mesoscale convective systems, and tropical cyclones play a dominant role in shaping rainfall extremes in this region [44,45]. Under such conditions, moisture transport from the Gulf can enhance rainfall locally but does not impose sustained control over inland extreme events.
Supplementary inflow correlations (Figures S9 and S10) are weaker and less spatially coherent than in tropical regions, with correlation signs that vary across lag days in parts of the Gulf and Caribbean sector. Outflow correlations (Figures S11 and S12) show similarly mixed behavior and limited persistence. The short duration of significant correlations is consistent with the relatively long atmospheric moisture turnover time in GMNA and the episodic nature of extreme rainfall in this region.
Overall, extreme precipitation in GMNA appears to be governed by rapidly evolving circulation features rather than by prolonged moisture accumulation. Moisture transport influences are therefore localized and short-lived, resulting in weaker temporal coupling with extreme precipitation.
3.4. West Africa (WA)
West Africa displays a clear and physically interpretable contrast between moisture inflow and outflow in relation to extreme precipitation. Netflow correlations (Figure 10) are consistently positive along the Guinea Coast and extend northward into parts of the southern Sahel. Correlation coefficients frequently exceed 0.4 and remain statistically significant across multiple lag days (Figure 11), indicating that net moisture gain across the coastal boundary is closely associated with enhanced R95pTOT.
Supplementary inflow correlations (Figures S13 and S14) reveal that this netflow signal is primarily driven by inflow variability. Positive correlations are spatially continuous along much of the coastal belt and persist across a wide range of lag days. This behavior reflects the sustained contribution of low-level southwesterly monsoon flow from the tropical Atlantic, which serves as the main moisture source for deep convection during extreme rainfall episodes.

Figure 10.
Same as Figure 4 but for West Africa.
Figure 10.
Same as Figure 4 but for West Africa.


Figure 11.
Same as Figure 5 but for West Africa.
Figure 11.
Same as Figure 5 but for West Africa.

In contrast, outflow correlations (Figures S15 and S16) exhibit a predominantly negative relationship with R95pTOT. Significant negative correlations extend over broad areas and persist across many lag days. Enhanced outward moisture transport therefore tends to coincide with suppressed extreme rainfall. This pattern is consistent with periods of dry northeasterly intrusions, often associated with the Saharan Air Layer or monsoon breaks, which weaken moist inflow and inhibit convective development [37,46].
Extreme precipitation in West Africa is thus controlled by the balance between competing moisture pathways. Strengthened inflow favors moisture accumulation and convective intensification, while enhanced outflow promotes drying and atmospheric stabilization. This two-sided response highlights the sensitivity of the West African monsoon system to changes in low-level moisture transport rather than to moisture supply alone.
3.5. Synthesis of Regional Differences
Despite pronounced differences in climate and circulation, several common features emerge across the four regions. Inflow-related correlations are consistently stronger and more persistent than those associated with netflow or outflow, indicating that sustained moisture transport is a key prerequisite for extreme precipitation. This behavior is especially evident in tropical regions, where correlations persist for approximately 5–10 days, consistent with rapid but continuous atmospheric moisture cycling and a short effective moisture turnover time.
By contrast, mid-latitude regions such as GMNA show weaker and shorter-lived correlations, reflecting the dominant influence of fast-moving synoptic systems and a reduced persistence of atmospheric moisture anomalies. The behavior of outflow also varies substantially by region. West Africa exhibits a clear negative relationship between outward moisture transport and extreme precipitation, while other regions show weaker or less consistent responses [37,47,48].
Overall, these results indicate that the influence of moisture transport on extreme precipitation depends not only on transport magnitude but also on its direction and persistence. Regions characterized by sustained inflow exhibit the strongest temporal coupling, whereas regions dominated by transient circulation features show weaker and more variable relationships. It is also worth noting that global lag-zero correlations can appear weaker or less coherent than regional results, particularly for netflow, because aggregation across diverse coastal regimes can partially offset opposing signals. As a result, these contrasts characterize the atmospheric moisture availability that governs the timing and intensity of extreme precipitation.
3.6. Implications for Agricultural Water Availability and Management
Beyond their climatological relevance, the identified linkages between moisture transport and extreme precipitation provide useful context for understanding agricultural water availability. In many irrigated and rain-fed systems, water stress is shaped not only by total rainfall but also by the timing and persistence of wet and dry periods. The strong and sustained inflow–precipitation relationships observed in tropical regions such as the Asian Monsoon, the Amazon Basin, and West Africa indicate that extreme rainfall is often tied to prolonged episodes of enhanced atmospheric moisture availability.
Although such events can deliver large rainfall totals, their concentration over short time windows may limit effective soil moisture storage and increase runoff losses. As a result, the fraction of precipitation available for crop water use can be reduced despite high rainfall amounts. The lagged structure of the moisture transport–extreme precipitation relationship further suggests that anomalies in large-scale moisture transport precede extreme rainfall by several days. This temporal structure defines a potential window of predictability for hydroclimatic conditions relevant to agriculture.
In contrast, the weaker and less persistent relationships observed in GMNA reflect the dominance of episodic synoptic systems and greater uncertainty in rainfall timing. In these settings, agricultural water systems are less directly influenced by sustained moisture transport and more sensitive to storm-scale variability. These regional contrasts indicate that the relevance of atmospheric moisture transport for agricultural water availability is strongly context-dependent, with greater implications in monsoon-dominated and tropical regions than in mid-latitude systems characterized by episodic rainfall.
4. Conclusions
This analysis clarifies the temporal linkage between large-scale moisture transport and extreme precipitation based on ERA5 reanalysis data for the period 1979–2020. By relating coastal moisture inflow, outflow, and netflow to the R95pTOT index across multiple lag times, the results provide a global view of how variations in atmospheric moisture supply influence the timing and persistence of heavy rainfall.
Across the regions examined, moisture inflow emerges as the most robust component linking transport variability to extreme precipitation. Strong and spatially coherent inflow–precipitation relationships are found in tropical regions, particularly in the Asian Monsoon, Amazon Basin, and West Africa. In these regions, significant associations persist for approximately 5–10 days, indicating that extreme precipitation is closely tied to sustained moisture transport and enhanced atmospheric moisture availability over multi-day periods. In contrast, mid-latitude regions such as the Gulf of Mexico and North America exhibit weaker and more fragmented relationships, consistent with the dominant role of transient synoptic systems and limited atmospheric moisture persistence.
The influence of moisture transport direction also varies by region. While inflow consistently shows the clearest association with extreme precipitation, netflow and outflow display weaker and more regionally dependent relationships. This contrast is most evident in West Africa, where enhanced outward transport coincides with suppressed extreme rainfall, reflecting the competing effects of moist monsoon inflow and dry continental air intrusions.
In conclusion, these findings demonstrate that regional differences in extreme precipitation are governed not only by the magnitude of moisture transport but also by its direction and temporal persistence. Rather than responding solely to instantaneous moisture convergence, extreme rainfall reflects the sustained availability of atmospheric moisture. By elucidating these temporal linkages, this study provides a physically consistent basis for interpreting precipitation extremes within a broader hydroclimatic context. Although the analysis focuses on atmospheric processes, the results also offer useful context for future work examining how variability in moisture transport relates to water availability and climate-related risks under continued warming.
Supplementary Materials
The following supporting information can be downloaded at: https://www.mdpi.com/article/10.3390/w18060698/s1, Figure S1: Lagged correlation coefficients (r) between moisture inflow and R95pTOT in the Amazon Basin (AB). Each panel corresponds to a lag of 0–24 days; Figure S2: Corresponding p-values for the inflow correlations in Figure S1; Figure S3: Same as Figure S1 but for moisture outflow; Figure S4: Same as Figure S2 but for moisture outflow; Figure S5: Same as Figure S1 but for Asian Monsoon; Figure S6: Same as Figure S2 but for Asian Monsoon; Figure S7: Same as Figure S3 but for Asian Monsoon; Figure S8: Same as Figure S4 but for Asian Monsoon; Figure S9: Same as Figure S1 but for Gulf of Mexico and North America; Figure S10: Same as Figure S2 but for Gulf of Mexico and North America; Figure S11: Same as Figure S3 but for Gulf of Mexico and North America; Figure S12: Same as Figure S4 but for Gulf of Mexico and North America; Figure S13: Same as Figure S1 but for West Africa; Figure S14: Same as Figure S2 but for West Africa; Figure S15: Same as Figure S3 but for West Africa; Figure S16: Same as Figure S4 but for West Africa.
Author Contributions
C.Z., Conceptualization, methodology, software, validation, formal analysis, resources, data curation, writing—original draft preparation, writing—review and editing, visualization; Y.Y., Conceptualization, validation, data curation, visualization; S.Z., data curation, writing—review and editing. All authors have read and agreed to the published version of the manuscript.
Funding
This research received no external funding.
Data Availability Statement
ERA5 reanalysis data are available from the European Centre for Medium-Range Weather Forecasts (ECMWF) at https://cds.climate.copernicus.eu/datasets/reanalysis-era5-pressure-levels?tab=overview (accessed on 13 March 2026) [35]. The coastline shapefile used for identifying coastal boundaries is provided by Natural Earth and can be accessed at https://www.naturalearthdata.com/downloads/10m-physical-vectors/10m-coastline/ (accessed on 13 March 2026).
Acknowledgments
Generative AI tools (ChatGPT 5.2) were used solely to assist with language editing and sentence refinement in parts of the manuscript. The use of these tools was limited to improving clarity, grammar, and readability. All scientific content, data analysis, interpretation of results, and conclusions were conceived, performed, and verified by the authors. The authors take full responsibility for the integrity and accuracy of the work.
Conflicts of Interest
The authors declare no conflicts of interest.
Abbreviations
The following abbreviations are used in this manuscript:
| CMT | Coastal moisture transport |
| TUT | turnover time |
| ETCCDI | Climate change detection and indices |
| AB | Amazon Basin |
| AM | Asian Monsoon region |
| GMNA | Gulf of Mexico and North America |
| WA | West Africa |
| DJF | December January February |
| MAM | March April May |
| JJA | June July August |
| SON | September October November |
| SI | Supplementary Information |
References
- Extremes, P. Atmospheric Warming and the Amplification of. Nature 2008, 454, 204. [Google Scholar]
- O’Gorman, P.A. Precipitation extremes under climate change. Curr. Clim. Change Rep. 2015, 1, 49–59. [Google Scholar] [CrossRef]
- Donat, M.G.; Lowry, A.L.; Alexander, L.V.; O’Gorman, P.A.; Maher, N. More extreme precipitation in the world’s dry and wet regions. Nat. Clim. Change 2016, 6, 508–513. [Google Scholar] [CrossRef]
- Trenberth, K.E. The impact of climate change and variability on heavy precipitation, floods, and droughts. In Encyclopedia of Hydrological Sciences; John Wiley & Sons, Ltd.: Hoboken, NJ, USA, 2005; Volume 17, pp. 1–11. [Google Scholar]
- Trenberth, K.E. Changes in precipitation with climate change. Clim. Res. 2011, 47, 123–138. [Google Scholar] [CrossRef]
- Fernández-Alvarez, J.C.; Vázquez, M.; Pérez-Alarcón, A.; Nieto, R.; Gimeno, L. Comparison of moisture sources and sinks estimated with different versions of FLEXPART and FLEXPART-WRF models forced with ECMWF reanalysis data. J. Hydrometeorol. 2023, 24, 221–239. [Google Scholar] [CrossRef]
- Gimeno, L.; Stohl, A.; Trigo, R.M.; Dominguez, F.; Yoshimura, K.; Yu, L.; Drumond, A.; Durán-Quesada, A.M.; Nieto, R. Oceanic and terrestrial sources of continental precipitation. Rev. Geophys. 2012, 50, RG4003. [Google Scholar] [CrossRef]
- Tuel, A.; Martius, O. Subseasonal temporal clustering of extreme precipitation in the Northern Hemisphere: Regionalization and physical drivers. J. Clim. 2022, 35, 3537–3555. [Google Scholar] [CrossRef]
- Yang, Z.; DeFlorio, M.J.; Sengupta, A.; Wang, J.; Castellano, C.M.; Gershunov, A.; Guirguis, K.; Slinskey, E.; Guan, B.; Delle Monache, L. Seasonality and climate modes influence the temporal clustering of unique atmospheric rivers in the Western US. Commun. Earth Environ. 2024, 5, 734. [Google Scholar] [CrossRef]
- Zhou, T.J.; Yu, R.C. Atmospheric water vapor transport associated with typical anomalous summer rainfall patterns in China. J. Geophys. Res. Atmos. 2005, 110, D08104. [Google Scholar] [CrossRef]
- Parmesan, C.; Morecroft, M.D.; Trisurat, Y. Climate Change 2022: Impacts, Adaptation and Vulnerability; GIEC: Shenzhen, China, 2022. [Google Scholar]
- Rockström, J.; Karlberg, L.; Wani, S.P.; Barron, J.; Hatibu, N.; Oweis, T.; Bruggeman, A.; Farahani, J.; Qiang, Z. Managing water in rainfed agriculture—The need for a paradigm shift. Agric. Water Manag. 2010, 97, 543–550. [Google Scholar] [CrossRef]
- Claro, A.M.; Fonseca, A.; Fraga, H.; Santos, J.A. Susceptibility of Iberia to extreme precipitation and aridity: A new high-resolution analysis over an extended historical period. Water 2023, 15, 3840. [Google Scholar] [CrossRef]
- Feng, P.; Wang, B.; Liu, D.L.; Xing, H.; Ji, F.; Macadam, I.; Ruan, H.; Yu, Q. Impacts of rainfall extremes on wheat yield in semi-arid cropping systems in eastern Australia. Clim. Change 2018, 147, 555–569. [Google Scholar] [CrossRef]
- Mekonnen, M.; Hoekstra, A. National Water Footprint Accounts: The Green, Blue and Grey Water Footprint of Production and Consumption; UNESCO-IHE: Delft, The Netherlands, 2011; Volume 1. [Google Scholar]
- Vogel, E.; Donat, M.G.; Alexander, L.V.; Meinshausen, M.; Ray, D.K.; Karoly, D.; Meinshausen, N.; Frieler, K. The effects of climate extremes on global agricultural yields. Environ. Res. Lett. 2019, 14, 054010. [Google Scholar] [CrossRef]
- Dahal, D.; Bhattarai, N.; Silwal, A.; Shrestha, S.; Shrestha, B.; Poudel, B.; Kalra, A. A Review on Climate Change Impacts on Freshwater Systems and Ecosystem Resilience. Water 2025, 17, 3052. [Google Scholar] [CrossRef]
- Scanlon, B.R.; Faunt, C.C.; Longuevergne, L.; Reedy, R.C.; Alley, W.M.; McGuire, V.L.; McMahon, P.B. Groundwater depletion and sustainability of irrigation in the US High Plains and Central Valley. Proc. Natl. Acad. Sci. USA 2012, 109, 9320–9325. [Google Scholar] [PubMed]
- Bian, L.; Qin, X.; Zhang, C.; Guo, P.; Wu, H. Application, interpretability and prediction of machine learning method combined with LSTM and LightGBM-a case study for runoff simulation in an arid area. J. Hydrol. 2023, 625, 130091. [Google Scholar] [CrossRef]
- Rosenzweig, C.; Elliott, J.; Deryng, D.; Ruane, A.C.; Müller, C.; Arneth, A.; Boote, K.J.; Folberth, C.; Glotter, M.; Khabarov, N. Assessing agricultural risks of climate change in the 21st century in a global gridded crop model intercomparison. Proc. Natl. Acad. Sci. USA 2014, 111, 3268–3273. [Google Scholar] [CrossRef] [PubMed]
- Schlenker, W.; Lobell, D.B. Robust negative impacts of climate change on African agriculture. Environ. Res. Lett. 2010, 5, 014010. [Google Scholar] [CrossRef]
- Trenberth, K.E.; Fasullo, J.T.; Mackaro, J. Atmospheric moisture transports from ocean to land and global energy flows in reanalyses. J. Clim. 2011, 24, 4907–4924. [Google Scholar] [CrossRef]
- Arias, P.; Bellouin, N.; Coppola, E.; Jones, R.; Krinner, G.; Marotzke, J.; Naik, V.; Palmer, M.; Plattner, G.-K.; Rogelj, J. Climate Change 2021: The Physical Science Basis. Contribution of Working Group I to the Sixth Assessment Report of the Intergovernmental Panel on Climate Change; Technical Summary; Intergovernmental Panel on Climate Change: Geneva, Switzerland, 2021. [Google Scholar]
- Held, I.M.; Soden, B.J. Robust responses of the hydrological cycle to global warming. J. Clim. 2006, 19, 5686–5699. [Google Scholar] [CrossRef]
- Seager, R.; Henderson, N. Diagnostic computation of moisture budgets in the ERA-Interim reanalysis with reference to analysis of CMIP-archived atmospheric model data. J. Clim. 2013, 26, 7876–7901. [Google Scholar] [CrossRef]
- Seager, R.; Naik, N.; Vecchi, G.A. Thermodynamic and dynamic mechanisms for large-scale changes in the hydrological cycle in response to global warming. J. Clim. 2010, 23, 4651–4668. [Google Scholar] [CrossRef]
- Trenberth, K.E.; Guillemot, C.J. Evaluation of the atmospheric moisture and hydrological cycle in the NCEP/NCAR reanalyses. Clim. Dyn. 1998, 14, 213–231. [Google Scholar] [CrossRef]
- Bonell, M.; Purandara, B.; Venkatesh, B.; Krishnaswamy, J.; Acharya, H.; Singh, U.; Jayakumar, R.; Chappell, N. The impact of forest use and reforestation on soil hydraulic conductivity in the Western Ghats of India: Implications for surface and sub-surface hydrology. J. Hydrol. 2010, 391, 47–62. [Google Scholar] [CrossRef]
- Sodemann, H.; Schwierz, C.; Wernli, H. Interannual variability of Greenland winter precipitation sources: Lagrangian moisture diagnostic and North Atlantic Oscillation influence. J. Geophys. Res. Atmos. 2008, 113, D03107. [Google Scholar] [CrossRef]
- Stohl, A.; James, P. A Lagrangian analysis of the atmospheric branch of the global water cycle. Part I: Method description, validation, and demonstration for the August 2002 flooding in central Europe. J. Hydrometeorol. 2004, 5, 656–678. [Google Scholar] [CrossRef]
- Donat, M.; Alexander, L.V.; Yang, H.; Durre, I.; Vose, R.; Dunn, R.J.; Willett, K.M.; Aguilar, E.; Brunet, M.; Caesar, J. Updated analyses of temperature and precipitation extreme indices since the beginning of the twentieth century: The HadEX2 dataset. J. Geophys. Res. Atmos. 2013, 118, 2098–2118. [Google Scholar] [CrossRef]
- Zhang, X.; Alexander, L.; Hegerl, G.C.; Jones, P.; Tank, A.K.; Peterson, T.C.; Trewin, B.; Zwiers, F.W. Indices for monitoring changes in extremes based on daily temperature and precipitation data. Wiley Interdiscip. Rev. Clim. Change 2011, 2, 851–870. [Google Scholar] [CrossRef]
- De Vries, A.J. A global climatological perspective on the importance of Rossby wave breaking and intense moisture transport for extreme precipitation events. Weather Clim. Dyn. Discuss. 2021, 2, 129–161. [Google Scholar] [CrossRef]
- Trenberth, K.E.; Dai, A.; Rasmussen, R.M.; Parsons, D.B. The changing character of precipitation. Bull. Am. Meteorol. Soc. 2003, 84, 1205–1218. [Google Scholar] [CrossRef]
- Hersbach, H.; Bell, B.; Berrisford, P.; Hirahara, S.; Horányi, A.; Muñoz-Sabater, J.; Nicolas, J.; Peubey, C.; Radu, R.; Schepers, D. The ERA5 global reanalysis. Q. J. R. Meteorol. Soc. 2020, 146, 1999–2049. [Google Scholar] [CrossRef]
- Chen, X.; Cao, D.; Liu, Y.; Xu, X.; Ma, Y. An observational view of rainfall characteristics and evaluation of ERA5 diurnal cycle in the Yarlung Tsangbo Grand Canyon, China. Q. J. R. Meteorol. Soc. 2023, 149, 1459–1472. [Google Scholar] [CrossRef]
- Nicholson, S.E. The West African Sahel: A review of recent studies on the rainfall regime and its interannual variability. Int. Sch. Res. Not. 2013, 2013, 453521. [Google Scholar] [CrossRef]
- Zhisheng, A.; Guoxiong, W.; Jianping, L.; Youbin, S.; Yimin, L.; Weijian, Z.; Yanjun, C.; Anmin, D.; Li, L.; Jiangyu, M. Global monsoon dynamics and climate change. Annu. Rev. Earth Planet. Sci. 2015, 43, 29–77. [Google Scholar] [CrossRef]
- Gimeno, L.; Eiras-Barca, J.; Durán-Quesada, A.M.; Dominguez, F.; van der Ent, R.; Sodemann, H.; Sánchez-Murillo, R.; Nieto, R.; Kirchner, J.W. The residence time of water vapour in the atmosphere. Nat. Rev. Earth Environ. 2021, 2, 558–569. [Google Scholar] [CrossRef]
- Trenberth, K.E. Atmospheric moisture recycling: Role of advection and local evaporation. J. Clim. 1999, 12, 1368–1381. [Google Scholar] [CrossRef]
- Van der Ent, R.J.; Savenije, H.H.; Schaefli, B.; Steele-Dunne, S.C. Origin and fate of atmospheric moisture over continents. Water Resour. Res. 2010, 46, W09525. [Google Scholar] [CrossRef]
- Marengo, J.A.; Soares, W.R.; Saulo, C.; Nicolini, M. Climatology of the low-level jet east of the Andes as derived from the NCEP–NCAR reanalyses: Characteristics and temporal variability. J. Clim. 2004, 17, 2261–2280. [Google Scholar] [CrossRef]
- Poveda, G.; Álvarez, D.M.; Rueda, Ó.A. Hydro-climatic variability over the Andes of Colombia associated with ENSO: A review of climatic processes and their impact on one of the Earth’s most important biodiversity hotspots. Clim. Dyn. 2011, 36, 2233–2249. [Google Scholar] [CrossRef]
- Kunkel, K.E.; Easterling, D.R.; Kristovich, D.A.; Gleason, B.; Stoecker, L.; Smith, R. Meteorological causes of the secular variations in observed extreme precipitation events for the conterminous United States. J. Hydrometeorol. 2012, 13, 1131–1141. [Google Scholar] [CrossRef]
- Villarini, G.; Smith, J.A.; Baeck, M.L.; Marchok, T.; Vecchi, G.A. Characterization of rainfall distribution and flooding associated with US landfalling tropical cyclones: Analyses of Hurricanes Frances, Ivan, and Jeanne (2004). J. Geophys. Res. Atmos. 2011, 116, D23116. [Google Scholar] [CrossRef]
- Cardinali, C. Monitoring the observation impact on the short-range forecast. Q. J. R. Meteorol. Soc. A J. Atmos. Sci. Appl. Meteorol. Phys. Oceanogr. 2009, 135, 239–250. [Google Scholar] [CrossRef]
- Knippertz, P.; Wernli, H. A Lagrangian climatology of tropical moisture exports to the Northern Hemispheric extratropics. J. Clim. 2010, 23, 987–1003. [Google Scholar] [CrossRef]
- Pfahl, S.; Wernli, H. Quantifying the relevance of cyclones for precipitation extremes. J. Clim. 2012, 25, 6770–6780. [Google Scholar] [CrossRef]


Disclaimer/Publisher’s Note: The statements, opinions and data contained in all publications are solely those of the individual author(s) and contributor(s) and not of MDPI and/or the editor(s). MDPI and/or the editor(s) disclaim responsibility for any injury to people or property resulting from any ideas, methods, instructions or products referred to in the content. |
© 2026 by the authors. Licensee MDPI, Basel, Switzerland. This article is an open access article distributed under the terms and conditions of the Creative Commons Attribution (CC BY) license.