Abstract
Canada is a top producer and exporter of crude oil but also has many in-land freshwater ecosystems that need protection using non-invasive remediation methods that are effective in sensitive environments. To assess the efficacy of enhanced monitored natural recovery (eMNR) as a secondary remediation strategy for freshwater oil spills, we conducted controlled spills of conventional heavy crude oil (CHV) in a freshwater lake at the IISD-Experimental Lakes Area in northwestern Ontario, Canada, in 2021. Three shoreline enclosures (5 × 10 m) were deployed on a wetland shoreline and treated with ~1.5 kg of weathered CHV. Four days later primary recovery of oil was conducted using shoreline washing followed by secondary remediation of residual oil using eMNR. Three unoiled, reference enclosures were also treated with shoreline washing but not secondary remediation. Polycyclic aromatic compounds (PAC) in water and sediment, and general water quality were monitored in the enclosures for 412 days after oiling. Total PACs in the water, mostly of 2- and 3-ring alkylated compounds, peaked three days after oiling (1188 ± 251 ng/L), declined to half of initial concentrations 8.26–11.75 days later and to near background levels by day 73. Total PACs were elevated in sediment of the oiled enclosures until day 70 likely due to sorption or settling oil but were heterogenous and influenced by pyrogenic compounds. Results from this study suggest that eMNR may be an effective remediation method following primary recovery efforts at sensitive aquatic sites where mechanical recovery is contraindicated.
1. Introduction
The impacts of crude oil spills can be significant to ecosystems, biota, and are viewed as serious incidents by the public due to potential toxicity and physical impacts of oiling. One of the lesser-known impacts results from oil spill recovery efforts. Specifically, when oil reaches shorelines, spill responders may use physical methods, such as excavation, to remove oiled material from the shore. This can result in the loss of sediment, soil, and vegetation causing long term damage to these habitats [1,2]. There is a need for improved and effective methods to remediate impacted aquatic habitats, a research priority that was highlighted in an expert panel report by the Royal Society of Canada reviewing crude oil behaviour and toxicity in aquatic ecosystems [3].
The Freshwater Oil Spill Remediation Study (FOReSt) was initiated at International Institute for Sustainable Development Experimental Lakes Area (IISD-ELA) field research station in northwestern Ontario, Canada, to assess the efficacy of minimally invasive, secondary remediation methods for responding to oil spills in freshwater shoreline environments. The research program proceeded in stages: in 2018, minimally invasive recovery of diluted bitumen (dilbit) and conventional heavy crude oil (CHV) were compared in shoreline environments of a boreal freshwater lake [4]. Then, in 2019 the potential of a shoreline cleaner (COREXIT EC9580A™) and enhanced Monitored Natural Recovery (eMNR) were evaluated as secondary remediation methods for treating residual dilbit remaining on shorelines after primary recovery efforts [5]. In that study, total polycyclic aromatic compound (PAC) concentrations in water peaked six days after oil addition and again on day 20 following a large precipitation event, then declined to near background concentrations ~70 days after oil application with both treatments [5]. We also concluded that the surface washing agent was not effective for removing oil from organic shorelines and may pose additional impacts to aquatic biota, such as surface-dwelling water striders [6], epibenthic amphipod, Hyalella azteca [7], and fish [8].
Here we describe follow up studies, conducted in 2021, in which we evaluated the efficacy of eMNR as a secondary remediation method for responding to freshwater spills of CHV, a common oil produced and transported in Canada [9,10]. There was uncertainty regarding the environmental fate and behaviour of diluted bitumen relative to convention crude oils [3] and these two unique ecosystem scale studies were designed to examine potential risks of residual oil in freshwater shoreline environments after primary oil spill cleanups were completed. Using the same approach of containing model spills in shoreline enclosures that we utilized for the 2019 dilbit experiments, PAC concentrations were measured in the water and sediment over a period of 411 days post oiling. Results from the current study provide important comparative data for assessing the efficacy of eMNR for responding to spills of CHV, relative to dilbit, in freshwater environments.
2. Materials and Methods
2.1. Study Location
Contained oil spills of CHV were conducted in wetland shoreline enclosures on Lake 260 (49°41′46″ N, 93°46′03″ W; volume: 1,975,968 m3, surface area: 332,460 m2, mean depth: 5.94 m, max depth: 15.64 m), a freshwater lake at the IISD-ELA, in northwestern Ontario, Canada, previously described by Kidd et al. [11]. The shoreline enclosures (Curry Industries Ltd., Winnipeg, MB, Canada), described in Ankley et al. [12], enclosed regions of the lake and adjacent shore allowing manipulation and monitoring of the enclosed environment. Each one of six enclosures (5 m wide and 10 m long) consisted of a floating collar that suspended an impermeable, polypropylene curtain that was sealed to the lake bottom and up onto shore for 5 m with two rows of sandbags. Detailed water depth measurements at enclosure widths of 0, 1.25, 2.5, 3.75, and ~5 m were used to calculate initial enclosure volumes which ranged from 14,632 to 26,998 L (EDI Repo.). Enclosure volume and hydraulic connectivity with the outside lake environment were also estimated by applying tritium as described by Palace et al. [5]. Enclosure volumes based on tritium activity in water were estimated to range from 26,542 to 46,604 L, which was higher than estimates based on physical water depth measurements. Differences between the enclosure volume estimates may be the result of a significant volume of water within interstitial spaces of the shoreline material (e.g., pore water) that would not have been captured by physical measurements.
Each enclosures was randomly assigned to either CHV + eMNR treatment (n = 3, E1, E3, E4) or unoiled reference (n = 3, E2, E5, E6) (Figure 1). Enclosure 6, an unoiled reference enclosure, included a 1.22 m2 engineered floating wetland of Typha and Carex species [13] to assess floating wetlands as a non-invasive, secondary remediation strategy. For purposes of statistical analyses, this enclosure has been included in the current study. This enclosure was shortened to 6.84 m and to maintain similar total enclosed water volume. A lake reference site, at a similar depth, was located in the vicinity of the enclosures, north of E1.
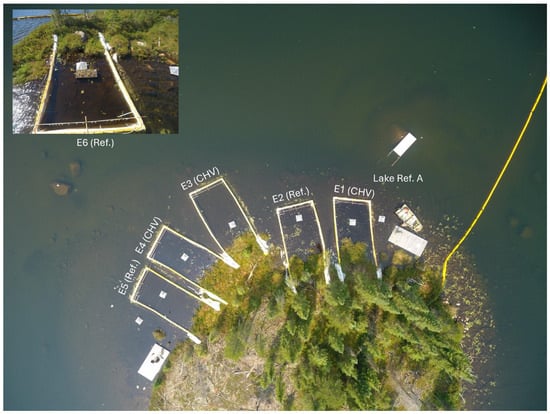
Figure 1.
Drone image of the 2021 FOReSt enclosures. Enclosure E6 is located on a separate section of shoreline, southwest of enclosures E1–E5. Source: IISD-ELA.
Polytetrafluoroethylene (PTFE) tubing installed on the edge of the floating collar of each enclosure allowed water to be collected remotely from mid-water column approximately 0.5 m from the offshore end of the enclosures. We previously reported that dissolved phase PAC concentrations were similar between near shore and far shore locations [5], and so only far shore sampling was conducted during the current study. Additional equipment was deployed in the enclosures and lake reference locations to sample biota over the duration of the study (e.g., periphyton, phytoplankton, zooplankton, invertebrates and fish) with results from those studies described elsewhere [7,8,14,15].
2.2. Oil Application and Recovery
Prior to CHV application and recovery from shorelines, four levels of oil containment were deployed (i.e., enclosures, two containment booms, and an underflow dam) as contingency to protect Lake 260 and downstream lakes as previously described [5,16]. No unintended oil releases to the lake outside the primary enclosures occurred during the project.
Methods of CHV weathering, application, and primary recovery of shoreline washing are described in detail in Ankley et al. [12] and Palace et al. [4,5]. Briefly, ~1.5 kg of weathered CHV, provided by the Canadian Association of Petroleum Producers from pipeline stocks, was applied on the surface of the water within 50 cm of the shore in selected enclosures on 25 June 2021 (day 0). Immediately after application, we simulated wave activity by oscillating the offshore end of the enclosure for <5 min to allow the spilled oil to interact and adhere to the shoreline soil and vegetation. In our previous study [5,12] we allowed oil to interact with the shoreline for 4 d prior to primary recovery. However, due to a local forest fire that limited our access to the site, primary CHV recovery in the current study occurred on two separate days (day 4 and 5 post oiling: 29–30 June 2021), with enclosure 2, 5, and 6 treated after 4 d and enclosures 3 and 4 treated on day 5 post oiling. Primary oil recovery was accomplished by flushing each enclosed shoreline for 12 min with a total of 1600 L of water pumped from inside the enclosure and delivered over the surface of the oiled shoreline using a low-pressure manifold [5]. Oil liberated onto the surface of the water was collected with pre-weighed and numbered polypropylene sorbent pads (Spill Ninja, MEP Brothers, Winnipeg, MB, Canada). One day after primary recovery (1 July 2021; day 6), CHV + eMNR enclosures received secondary remediation treatments consisting of a slow-release, aquatic grade fertilizer (Osmocote Classic Slow Release Fertilizer 19-6-12, Scotts Company, Marysville, OH, USA). The weight of fertilizer applied was calculated based on estimates of N and P required to augment nutrient addition according to the Redfield Ratio (106:16:1 C:N:P), assuming that 87% of the weight of residual oil in each enclosure consisted of carbon [17,18]. Because washing of the shoreline could potentially redistribute terrestrial materials and nutrients into the aquatic environment, the unoiled reference enclosures also received shoreline washing on day 4 (29 June 2021).
2.3. Water Quality
Basic water quality (temperature, dissolved oxygen, conductivity, and pH) was monitored weekly in 2021, and three times in 2022 (days 362, 390, and 412), in surface waters of the enclosures and lake reference sites using a Yellow Springs Instrument Professional Series Plus multimeter probe (YSI QUATRO, 18C100206, Xylem, Yellow Springs, OH, USA). Water was collected from the far shore environment of each enclosure, and from the epilimnion and metalimnion at the deepest point of the lake biweekly and analyzed for a suite of nutrients at the IISD-ELA chemistry laboratory using methods described by Havens et al. [19] and at the University of Alberta Biogeochemical Analytical Services Laboratory. Trends in total nitrogen (TN) and total phosphorus (TP) results are briefly discussed here, and other nutrient chemistry results are included in an open access repository (EDI repo.).
2.4. Polycyclic Aromatic Compound Chemistry
2.4.1. Water
Water was collected from the offshore environment of each enclosure and corresponding depth locations at the lake reference site on days −3, 1, 3, 4, 8, 9, 10, 14, 22, 37, 73, 275, 355, and 411 after oiling, for the quantification of 44 polycyclic aromatic compounds (PACs; Table S1), including the sixteen parent PAHs from the United States Environmental Protection Agency [20] priority pollutant list and 28 PACs classified as alkylated PACs and heterocyclic PACs [e.g., dibenzothiophene], hereafter referred to as alkylated PACs.
For our previous dilbit experiment in 2019, water was transported within 24 h from the IISD-ELA field station to the Center for Oil and Gas Research and Development laboratory (COGRAD, Winnipeg, MB, Canada) for extraction [8,21]. However, due to the COVID-19 pandemic and travel restrictions between provinces, all water samples were extracted on site at the IISD-ELA field station in Ontario for the current study. One litre of water was collected from the far shore environment in each enclosure using a peristaltic pump and PTFE tubing into an amber glass bottle, leaving minimal head space, and sealing with a PTFE cap. During the winter, water was collected by cutting a hole in the ice at the far end of the enclosures with an electric auger and submersing an amber bottle into the water column to fill completely before sealing with a PTFE cap. Samples were transported within 2 h to the IISD-ELA laboratory in a cooler for extraction following methods described by Stanley et al. [21].
PACs were identified and quantified using an Agilent 7890 Gas Chromatograph (Agilent Technologies, Santa Clara, CA, USA) coupled to a 7000C Triple-Quadrupole Mass Spectrophotometer (Agilent Technologies, USA) (GC-MS/MS) fitted with an electron ionization source. Helium was the carrier gas, set at a flow rate of 1.2 mL/min with an Agilent J&W HP-5 ms ultra inert column (30 m × 0.25 mm, 0.25 µm film thickness). One (1) µL of each sample was injected using a PAL RSI 85 autosampler (CTC Analytics AG, Zwingen, Switzerland) at a temperature of 60 °C. GC-MS/MS conditions as described by Idowu et al. [22].
During each sample period, a field blank was included to measure any potential introduction of PACs into the sample bottle during collection. The field blank comprised 200 mL of Optima ™ water (ThermoFisher Scientific, Nepean, ON, Canada) in an amber bottle that was opened at the start of sampling and closed upon collection of the final water sample [13]. The field blank was processed as described in Stanley et al. [13,21], using 40 mL dichloromethane for extraction and included instrument performance internal standards and recovery internal standards. For all sample periods (day −3 to 411), total PACs measured in the field blank ranged from 2 to 97 ng/L (mean ± standard deviation [SD]: 22 ± 28 ng/L, n = 14). All samples were corrected by subtracting concentrations from the field blank for the corresponding sample period, and their individual instrument performance internal standard and recovery internal standard.
2.4.2. Sediment
Three sediment samples (top 5 cm) from various locations in the near shore environment of each site were collected with a polycarbonate corer (~5 cm diameter) on days −2/−1, 12, 38, and 70 and 411 after oiling. Samples were transported in a cooler to the lab and the flocculent sediment was allowed to settle in the dark at 4 °C overnight. The overlying water was decanted prior to freezing at −20 °C [13]. At the COGRAD laboratory, Sediment was freeze dried and extracted using dichloromethane for accelerated solvent extraction as described by Xia et al. [23], followed by PACs quantification using GC-MS/MS [22].
2.5. Data Analyses
Mean (±standard deviation [SD]) trends in water and sediment chemistry were analyzed and visualized using R (v. 4.3.2) in R Studio (v. 2024.09.0 + 375) [24,25] with the tidyverse package (v. 2.0.0) [26]. Significant differences (p-value ≤ 0.05) in water quality and chemistry parameters between enclosure treatments on each study day were analyzed with a t-test or a Wilcoxon rank sum test using the stats package (v.4.3.2) [25] in R Studio, based on dataset normality and homogeneity of variance. One-sided tests were performed for PAC chemistry data to assess whether oil treated enclosures were greater in concentration than the unoiled enclosures. All other water quality parameters were tested with a two-sided test. The limit of detection (LOD) for all dissolved-phase PACs was 0.1 ng/L but was compound specific for sediment PACs [23]. Compounds below the LOD were given a value of ½ LOD prior to data analyses.
The rate of total dissolved-phase PAC loss was analyzed using a mixed effect, first order exponential decay model [27] using the SSasymp function in the stats package [25] to identify starting values for exponential decay model (Equation 1; Ct = C0 e−kt; C0 = starting concentrations at time 0/y-intercept; Ct = concentration at time t; k = decay rate/alpha; t = time; [27]) using the nlme package (v. 3.1-163) [28,29], as described [5]. The y-intercept (C0) for each enclosure replicate served as the model random effect, and the y-intercept (C0) and the rate (k) were fixed. Two models were predicted daily over 100 days, using measured concentrations recorded from days 1 to 73 and days 3 to 73 to develop the model, as total dissolved-phase PAC concentrations peaked three days after oiling. The estimated DT50 (time to reach half of C0) was prepared for each predicted model using Equation 2 (DT50 = natural log(2)/k [27]. Ratios of dissolved-phase PACs were analyzed to determine primary weathering processes as summarized in Stoyanovich et al. [30]. Total sediment PACs were analyzed for significant differences between enclosure treatments as described above and for pyrogenic and petrogenic indices.
3. Results and Discussion
3.1. Oil Application and Recovery
A mean (±SD) of 1477 ± 125 g weathered CHV was applied to the CHV + eMNR enclosures on day 0 (Table 1). Primary recovery using shoreline washing and absorbent capture successfully removed 14.4 to 37.1% of CHV, leaving 1122 ± 186 g of residual CHV in the enclosures. The success of primary mechanical recovery was higher than observed in our previous 2019 dilbit experiment, which ranged from 3.6 to 10.9% [5]. Despite differences in removal success, the weight of residual oil was similar between the two studies (i.e., 2019 dilbit study residual oil = 1209 ± 43 g). Differences in percent recovery may be attributed to differences in the oil products and/or prevailing environmental conditions during the years that the studies were conducted.

Table 1.
Summary of CHV application, primary recovery employing shoreline washing, and secondary remediation treatment in CHV + eMNR shoreline enclosures.
During recovery, CHV in E1 was described as dry and crispy on the surface water and beginning to fracture. We noted that the CHV did not readily adhere to the sorbent pads. Successful recovery of CHV did occur near the shore after shoreline washing. The lower recovery in E1 may have resulted from an intricate shoreline, seen in Figure 1, where oil had greater surface area with which to interact. Recovery in E3 occurred over two days and oil was noted to be fibrous with vegetation in the CHV slick on day 4. Recovery in E3 on day 5 was similarly described with some fractured CHV and sheen across the surface, and some oil attached to vegetation. We noted that oil globules with brown surface crust adhered more easily to the sorbent pads. CHV in E4 was described as thick and crusty from the near shore to far shore environment, respectively. During washing, we noted visible oil globules moving away from the shore into the aquatic environment, and some neutrally buoyant globules with signs of weathering (e.g., lighter brown). We acknowledged that E4 was likely the most effective cleanup of the three oiled enclosures, which is supported by the percent recovery (Table 1).
Physical changes were anticipated as weathering of oil continued after application to the aquatic ecosystem. Weathering is a result of changes to oil from physical, chemical, and biological environmental conditions, influencing oil fate, behaviour, and chemistry [3,31,32]. When CHV was initially applied to the enclosures, it quickly spread across the water surface developing an iridescent sheen. This then exposed oil at the water surface to evaporation, where lighter molecular or volatile compounds are lost to the atmosphere, thus further altering chemical composition and physical properties, such as increasing oil density and viscosity [3]. In low wind or wave scenarios, evaporation may be reduced due to the formation of resins and asphaltenes on the oil surface [3]. However, in our study, we simulated wave activity during oil application to spread the oil along the shoreline, encouraging further evaporation.
Photooxidation is an important weathering process early after an oil spill, whereby sunlight and oxygen can form oxygenated PACs that are more difficult to degrade and pose greater toxicity risks [33]. Stoyanovich et al. [34] noted changes to oil colour were due to sunlight exposure [35] and emulsification (i.e., incorporation of water into the oil. They similarly observed colour changes from black to light brown, six days after application of dilbit in a freshwater limnocorral study [34]. Other initial weathering processes may have included dissolution, dispersion, sinking, sedimentation, and later biodegradation [3]. Changes to the oil physical and chemical properties may affect water quality conditions from reduced aeration caused by a slick and/or consumption of oxygen and nutrients.
3.2. Water Quality
Water quality conditions can have a strong influence on weathering and biodegradation of PACs in the aqueous environment [3]. As expected, water temperatures varied seasonally over the experimental period, ranging from 13.5 to 23.8 °C between day −2 to 88 in 2021 (Figure 2). The optimal temperature for biodegradation in freshwater environments ranges from 20 to 30 °C [36], with temperature influencing oil weathering, compound bioavailability, and microbial community composition and activity [3,37]. Temperatures were often lower in the enclosure sites compared to the lake reference, possibly due to an enclosure effect causing reducing mixing or variability in site characteristics (e.g., depth, shading). Kharey et al. [14] observed differences in the aquatic prokaryotic community between the enclosures and lake reference and suggested this may have resulted from the enclosures impacting lake processes, such as nutrient cycling. Similarly, dissolved oxygen concentrations varied over the season and were lower in the enclosure sites, potentially a result of reduced mixing. Dissolved oxygen is an important metric for survival of freshwater biota and can often decline in the water column after an oil spill due to reduced aeration from surface oil and consumption by oil degrading bacteria [38]. Aerobic degradation is typically the fastest pathway for microbial metabolism of PACs but anaerobic degradation can also occur, especially in anoxic environments, like wetlands [39,40].
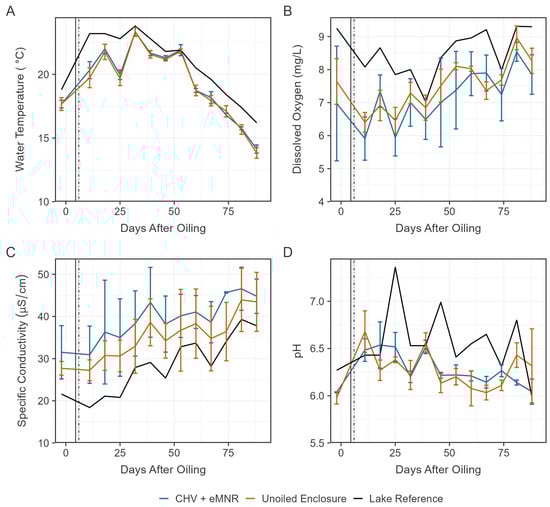
Figure 2.
Mean water temperature (A), dissolved oxygen (B), specific conductivity (C) and pH (D) in the CHV + eMNR enclosures (n = 3), unoiled enclosures (n = 3), and lake reference (n = 1) from day −2 to 88 post CHV addition. Statistics for days 362, 390, and 412 are summarized in Table S2. Error bars represent the absolute standard deviation of treatment replicates. Vertical lines represent primary recovery (solid) and secondary remediation (dotted) efforts.
Conductivity was generally higher in the enclosures and steadily increased over the 2021 season among all sites (Figure 2). Increasing conductivity may be a result of weather/climatic conditions [21]. The current experiment occurred during a low precipitation year, and greater evaporative loss compared to precipitation recharge may have caused conductivity to increase in the lake and the enclosures [41,42]. pH was variable over the experimental period and was generally lower in the enclosures (Figure 2), which may be caused by the organic/wetland shoreline, which often have acidic soils [43] and plants that may release acidic exudates and respire [44]. Biodegradation occurs at a wide range of pH values but are optimal between 6.5 and 8 [45]. Lee et al. [3] reviewed this subject and noted dominance of hydrocarbon degraders is influenced by pH tolerance, where bacteria and fungi may be more important in aquatic and acid-stressed ecosystems, respectively. Among all water quality metrics described here, there were no clearly different trends among oiled and unoiled sites. There were also no statistically significant differences in water quality parameters between CHV + eMNR and unoiled enclosures during each monitored study day (Table S2).
After an oil spill nitrogen (N) and phosphorus (P) may become a limitation for biodegradation due to the large influx of carbon that alters the optimal Redfield Ratio of C:N:P [46]. To enhance biodegradation, we applied a slow-release fertilizer to increase P availability based on the residual oil following primary recovery, assuming oil is 87% carbon [17,47]. Total nitrogen (TN) remained relatively stable over the exposure period but was higher in the enclosures than in the lake epilimnion or metalimnion, likely due to nutrient input from precipitation runoff from the adjacent shore (Figure 3A). Total phosphorus (TP) declined in enclosures and was generally higher than the lake epilimnion and metalimnion, mostly during the early sampling periods (Figure 3B). Despite the addition of N and P to CHV + eMNR enclosures, concentrations were not significantly different than the unoiled enclosures (Table S3).
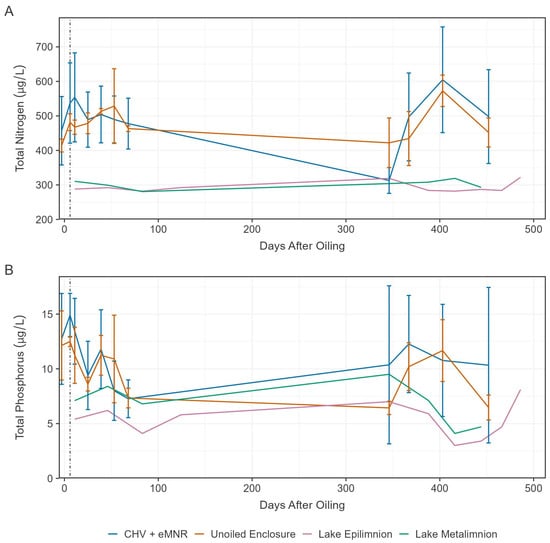
Figure 3.
Mean total nitrogen (A) and total phosphorous (B) in water from the CHV + eMNR enclosures (n = 3), unoiled enclosures (n = 3), lake epilimnion (n = 1), and lake metalimnion (n = 1) from day −3 to 486. Error bars represent the absolute standard deviation of treatment replicates, and vertical dotted line represents application of secondary remediation.
3.3. Polycyclic Aromatic Compound Chemistry
3.3.1. Water
Prior to CHV addition, total PAC concentrations on day −3 ranged from 8 to 21 ng/L among all sites (Figure 4). Total PACs peaked on day 3 of exposure in the CHV + eMNR enclosures (n = 3) at 1188 ± 251 ng/L (mean ± SD), while concentrations were 26 ± 11 ng/L and 7 ng/L in the unoiled enclosures (n = 3) and lake reference site (n = 1), respectively. Peak concentrations were slightly below 96 h sublethal (EC50) and lethal (LC50) total PAHs thresholds known to cause chronic embryotoxicity, physiological effects, and mortality among freshwater fish (~2–80 ug/L) as reviewed by Lee et al. [3]. Concentration of total PACs declined to near background conditions by day 73, but increased among all sites on day 275, mostly attributed to alkylated naphthalenes and phenanthrenes. These samples were collected during the winter through the ice, and due to the shallow nature of the enclosures, concentrations may have been influenced by sediment resuspension because an auger was used to drill a 20 cm diameter access hole for water sampling. Increases in total PAC concentrations were also evident among unoiled sites during the winter [21]. Total PAC concentrations declined to 141 ± 61 ng/L, 115 ± 84 ng/L, and 72 ng/L on day 411 in CHV + eMNR enclosures, unoiled enclosures, and lake reference, respectively. Dissolved PAC concentrations were not different before oil addition in enclosures assigned to CHV + eMNR relative to unoiled enclosures, were higher in oil treated enclosures from days 1–73, but were again not significantly different after 275 days, (Table S4) when concentrations returned to pre-oil conditions. A first order exponential decay model for the CHV + eMNR treatment estimated it took 8.26 to 11.75 days for total PACs to decline to half of the initial concentration (DT50), depending on what data was included in the model (Figure 5; Table S5). It is during this ~10-day period that weathering processes such as evaporation, spreading, dispersion, etc., are most important [5,30]. Exponential decay models for 2–4 ring PACs are available in Figure S1 and Table S5.
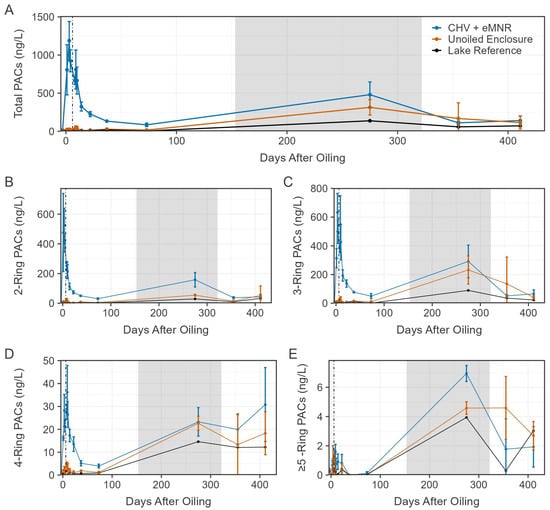
Figure 4.
Mean total dissolved-phase PACs ((A); N = 44), total 2-ring ((B); N = 6), total 3-ring ((C); N = 23), total 4-ring ((D); N = 8), and total ≥5-ring ((E); N = 7) in the CHV + eMNR enclosures (n = 3), unoiled enclosures (n = 3), and lake reference (n = 1) from pre-oil addition to day 411. Day 0 represents CHV addition to the CHV + eMNR enclosures. Error bars represent the absolute standard deviation of treatment replicates. Vertical line and grey box represent secondary remediation effort and ice-on periods at the IISD-ELA, respectively.
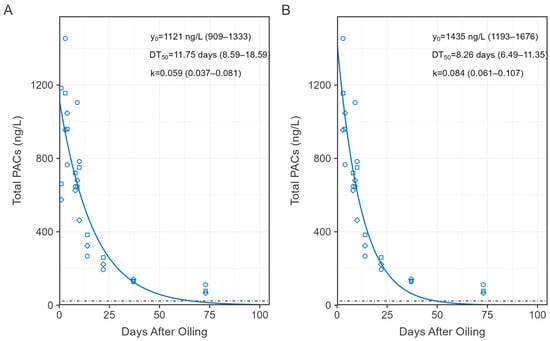
Figure 5.
First order exponential decay models (solid line) of total dissolved phase PACs over the first 100 days of the study using concentration data (points) from days 1 to73 (A) and 3 to73 (B). Values represent model estimates (Table S5) and range in brackets are the 95% confidence interval. Horizontal dotted line represents the mean concentration of total PACs in unoiled enclosures and lake reference.
The CHV + eMNR sites were dominated by 2-ring (25–66% of total PACs; n = 39) and 3-ring (33–71% of total PACs; n = 39) PACs, mostly of C2, C3 and C4 naphthalenes, C2 dibenzothiophene, and C2 and C3 phenanthrene. Total 4-ring PACs followed similar trends to the 2-ring and 3-ring PACs but at much lower concentrations (1–25% of total PACs; n = 39). The majority of total PACs were alkylated compounds ranging from 85 to 97% (n = 39), 80 to97% (n = 39), and 61 to97% (n = 13) in CHV + eMNR, unoiled enclosures, and the lake reference following CHV addition, respectively. This is important to note as alkylated PACs pose greater risk for chronic toxicity to interacting organisms [48]. Proportions of PACs fluctuate following a spill and recovery efforts as the oil continues to weather and degrade [5,30,49]. Immediately following oil addition, total PACs were dominated (≥10% of total PACs) by C2 and C3 naphthalenes and remained dominant with C2 dibenzothiophene by the peak, three days after oil addition. After 10 days of exposure, C2 dibenzothiophene was no longer dominant, but C2 and C3 naphthalenes remained the major contributors until day 275, when C2 and C3 phenanthrenes and C3 and C4 naphthalenes were dominant. We reported similar temporal patterns in another similar study where controlled spills of diluted bitumen were performed in shoreline enclosures in the same lake [5]. Naphthalene, a 2-ring PAC, poses risk for acute toxicity due to its solubility [31]; however, dissolved concentrations of alkylated naphthalenes declined in the current after peaking on day 3, and non-alkylated naphthalene was well below the Canadian Council of Ministers of the Environment [50] water quality guidelines for the protection of aquatic life (1100 ng/L).
To gain additional insight into the specific weathering processes that contributed to PAC removal, primary recovery, and remediation efforts, we assessed a series of PAC ratios as summarized in Stoyanovich et al. [30]. During the first nine days of oil exposure, the C2-naphthalene/C2-fluorene ratio declined (Figure S2), suggesting CHV was undergoing a combination of dissolution, biodegradation, and evaporation [30,51]. There was similarly a decrease in C2-dibenzothiophene/C2-phenanthrene and the C3-dibenzothiophene/C3-phenanthrene ratios between the peak oil concentrations on day 3 until day 10 and 14, respectively (Figures S3 and S4), which also suggests biodegradation processes [32]. Olson et al. [32] explains any increase or decrease in these ratios can indicate biodegradation, while stable ratios can still be present during physical degradation. However, Garrett et al. [52] notes a stable ratio of these C3 compounds may still indicate biodegradation if the two compounds degrade at similar rates. Twenty days after oiling, trends of the mean C2-dibenzothiophene/C2-phenanthrene ratio slowly increased, while the mean C3-dibenzothiophene/C3-phenanthrene ratios fluctuated, suggesting biodegradation processes were occurring (Figures S3 and S4). Initial declines in C3-phenanthrene/C3-chrysene ratio during the first 8 days of the study could indicate biodegradation, as phenanthrene declined at a greater rate than chrysene [52] but these ratios were variable on days 9 and 10 (Figure S5) and increases after day 14, potentially a result of photooxidation [30]. In a previous study of controlled dilbit spills that was conducted on the same lake we observed an increase in the C3-phenanthrene/C3-chrysene ratio over time, and suggested that it may have been attributed to photooxidation [30].
The C3-chrysene/C0-chrysene ratio was variable and mean trends slowly increased over time (Figure S6). Decreases in this ratio would indicate photooxidation, as parent compounds tend to be biodegraded faster than alkylated [53], while photooxidation increases with alkylation [54]. For all ratios analyzed, most indicate biodegradation was occurring during the early exposure period, and as previously discussed, weathering processes are most important during the first 10 days following a spill [3].
At all sample times, total PAC concentrations were below toxicity threshold effects levels (LC50 and EC50) for chronic freshwater exposure to fish [55,56]. However, more recently effects of low concentrations of PACs have been identified in aquatic organisms. Specifically, Black et al. [6] showed that water striders (Metrobates sp.) were rendered complete immobile after 48 h exposures to cold lake winter blend dilbit and was related to the disruption of water surface tension. The effective sheen thickness causing 50% immobility was 2.77 ± 0.91 × 10⁻³ µm. In the current study, we noted the presence of water striders in unoiled enclosures, but not the CHV + eMNR enclosures immediately after oil addition. Water striders were again noted in the oil treated enclosures E3 and E4 on day 37 after oiling. These visual observations were not part of a formal sampling effort but support prior observations made by Black et al. [6] and suggest disruption to surface tension was no longer present after 37 d.
Total PACs during our previous 2019 dilbit experiment [5] were higher than those observed in this current study and other similar oil spill studies conducted in mesocosms [16,57]. Differences among the studies may be attributed to the oil product and chemistry, environmental conditions (e.g., precipitation, temperature, light, wind sheer, water circulation, forest fire activity and other prevailing ambient conditions), and/or methods for extracting PACs from water. In another one of our previous studies, we implemented only natural attenuation (e.g., MNR) to treat model spills of dilbit and CHV. Peak PAC concentrations reached only ~500 ng/L in an enclosure (2.5 m × 10 m) treated with dilbit and ~73 ng/L in an enclosure that received CHV [4]. While total dissolved PAC concentrations were lower in that study, some 2-ring and 4-ring PACs remained elevated even 80 d after oil addition, whereas adding nutrients with the intent of stimulating microbial degradation of PACs in the current study resulted in near baseline concentrations by day 73. Shoreline washing used in the current study, but not in the previous MNR study [4], may have released more PACs into the aqueous environment in this current study, making them more available for secondary remediation via photooxidation or microbial degradation. In terms of the microbial community, Kharey et al. [58] did not observe major shifts in the prokaryotic community in the water, sediment, or soil with or without CHV within the current study and suggested the community may be tolerant to concentrations of crude oil. However, they acknowledged that the community in the lake had hydrocarbon biodegradation potential based on the presence of putative hydrocarbon degrading prokaryotes and expression of alkane and aromatic degrading genes. While this is speculative, we did observe that the trend of total PACs declined in the aqueous environment after ~70 days and the DT50 was estimated between 8.26 and 11.75 days (Figure 5; Table S5), potentially a result of weathering or sediment sorption, and some PAC ratios were indicative of biodegradation processes during the first 10 days following oil exposure (Figures S2–S6). These biodegradative processes may have been facilitated by the addition of nutrients with the application of eMNR. Finally, in a companion study we observed greater changes to eukaryotic microbial community on the roots of engineered floating wetlands exposed to a controlled CHV spill compared to the prokaryotic community [21]. Future research could explore the contribution of additional microbial community members (e.g., algae, fungi, etc.) for degrading crude oil constituents, including aromatic compounds like PACs.
3.3.2. Sediment
Because concentrations of PACs declined in water of the CHV + eMNR sites, we sought to understand if residual oil was bound to sediment, remaining sequestered in the enclosures. Similarly to our previous studies, mean total PACs in sediments displayed high heterogeneity among all samples obtained from both oiled and unoiled sites [5,13]. This was related to high background concentrations of PACs, specifically retene, which is a 3-ring PAC, that likely emanated from local forest fires or diagenic processes [13]. Incomplete combustion is the most prominent source of PACs in the natural environment [53]. During the current CHV study there was a forest fire in a nearby watershed, and we observed ash falling onto the surface of the study lake and smoke in the area over multiple days. Among all sediment samples, retene made up 50 ± 28% (n = 27), 78 ± 14% (n = 27), and 83 ± 6% (n = 9) of total PACs in the CHV + eMNR, unoiled enclosure, and lake reference site, respectively. The proportional contribution of retene was higher at unoiled sites, indicating petrogenic compounds contributed more to total PACs in the CHV + eMNR sites relative to reference sites. Due to retene’s large contribution to total PAC and its non-petrogenic origin, Figure 6 presents total PACs, by numbers of rings, in sediment excluding retene (N = 43).
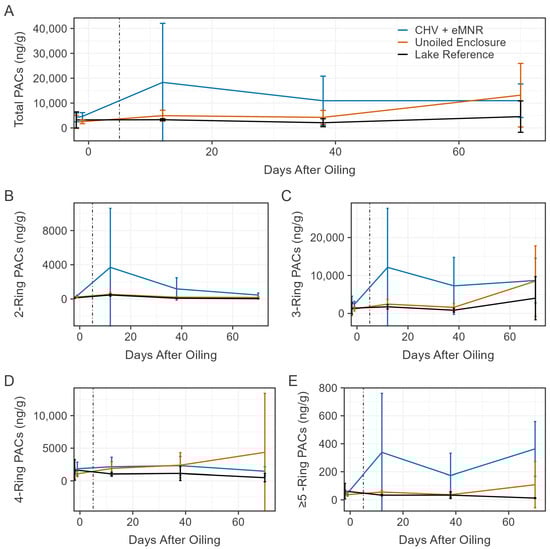
Figure 6.
Mean total sediment PACs excluding retene ((A); N = 43), total 2-ring ((B); n = 6), total 3-ring excluding retene ((C); n = 22), total 4-ring ((D); n = 8), and total ≥5-ring ((E); n = 7) in the CHV + eMNR enclosures (n = 3), unoiled enclosures (n = 3), and lake reference (n = 1) from pre-oil addition to day 70. Day 0 represents CHV addition to the CHV + eMNR enclosures. Error bars represent the absolute standard deviation of treatment and site replicates, and the vertical line represents secondary remediation effort.
Prior to oil application to the CHV + eMNR enclosure, mean (±SD) total sediment PACs excluding retene (N = 43) were 4376 ± 1595 ng/g (n = 9), 2474 ± 2106 ng/g (n = 9), and 3225 ± 3229 ng/g (n = 3) in the CHV + eMNR, unoiled enclosure, and lake reference sites, respectively (Figure 6). These totals were mostly contributed (≥10% of total PACs excluding retene) by C1 chrysene, C1 pyrene, and C2 and C3 phenanthrene. After oil addition, concentrations increased but were highly variable in the CHV + eMNR sediment on day 12, at 18,326 ± 23,741 ng/g, with greatest contributions maintained from C2 and C3 phenanthrene. Mean concentrations later declined by day 38 (10,934 ± 9889 ng/g) and remained stable until day 70 (10,957 ± 6739 ng/g). During these sample rounds, dominant PACs shifted to C1 chrysene and C2 dibenzothiophene by day 38, and to C3 phenanthrene, and C2 and C3 dibenzothiophene by day 70, which may be a result of oil sorption to sediment. C2 dibenzothiophene was a dominant compound in water samples, peaking on day 3, however, was no longer dominant by day 10, indicating the compound may have sorbed to the sediment or underwent weathering processes. Sediment PAC concentrations remained relatively stable in the unoiled enclosure and lake reference sites over the duration of the study, excluding samples made on day 70 in the unoiled enclosure, which reached a mean concentration of 13,164 ± 12,783 ng/g. Over the duration of the study, PACs were mostly dominated by C1 chrysene, C1 pyrene, C2 phenanthrene, and C3 phenanthrene in the unoiled sites. The final composite sediment samples on day 411 had a mean total PAC concentration of 8868 ± 4103 ng/g (n = 3), 4249 ± 835 ng/g (n = 3), and 2448 ng/g (n = 1) in the CHV + eMNR, unoiled enclosure, and lake reference, respectively. Dominant compounds were C1 chrysene and C2 fluorene in the CHV + eMNR enclosures, C1 chrysene, C2 fluorene, and C4 phenanthrene in the unoiled enclosures, and C1 chrysene and C4 phenanthrene in the lake reference. Similarly to our previous dilbit experiment [5], it is likely that there are large background contributors to total PACs in sediments as a result of forest fires [59,60].
Total PAC (excluding retene; N = 43) concentrations in sediment were significantly different between CHV + eMNR and unoiled enclosures on days −2/−1, 12, 38, and 411, but not significantly different on day 70 (Table S6). Significant differences were observed in 2-ring and ≥5-ring PACs for all sample periods following CHV addition and on days −2/−1, 12, 38 and 411 for 3-ring PAC excluding retene, but no differences were observed in 4-ring PACs during any sample period (Table S6). Differences may have been the result of CHV sorbing to sediment and/or heterogenous distribution of other pyrogenic PACs to sediment. To further identify whether PACs in the sediment were contributed from pyrogenic or petrogenic sources, we assessed PAC ratios (Table S7). The retene/(retene + chrysene) ratio is typically used to identify PAC combustion sources from softwood (i.e., fires), or petroleum and coal (0.15–0.50) [61]. Every sediment sample collected in oiled and unoiled sites from day 1 to 70 indicated softwood combustion sources (>0.93). To assess whether sediment PACs arose from combustion (>0.4) versus a petrogenic source (<0.4), we assessed the fluoranthene/(fluoranthene + pyrene) ratio [62]. All sediment samples collected from the CHV + eMNR enclosures from day −2 to 70 had a mean ratio ranging from 0.23 to 0.25, including samples collected prior to oil addition. Similarly, mean ratios of triplicate sediment samples collected on day 12, 38, and 70 from the unoiled enclosures and lake reference sites also indicated a petrogenic source, which is unlikely. As described in our previous dilbit experiment [5], it is possible that these diagnostic ratios may not be informative for sediments with low concentrations of PACs or for situations with changing environmental fate (e.g., weathering) [63].
As we have previously reported, PACs were highly variable in lake sediments [5,13,64]. However, unlike our previous oil spill studies, higher total PACs were clearly evident in sediments of the oil treated enclosures relative to reference sites on days 12 and 38 (Table S6). Most total PACs were 2-ring, 3-ring, and 4-ring PACs and while concentrations of ≥5-ring compounds were comparatively lower, we also observed higher concentrations of these compounds in oil treated enclosures. Weathered CHV was probably sequestered in sediment but heterogenous distribution and significant background PACs make it difficult to discern oil spill impacts to sediment. We continue to recommend high spatial sampling of sediment following spill events to determine impacts [5].
4. Conclusions
Spills of opportunity do not provide adequate means to study the impacts of oil spills and recovery trajectories because baseline data and suitable reference areas are often lacking. The IISD-Experimental Lakes Area has decades of baseline chemical, physical, and biological data for many of its 58 lakes. Moreover, by virtue of specific provincial and federal legislation the facility has globally unique ability to conduct controlled whole ecosystem studies that include contaminant additions, as long as no long-term impacts are incurred. In this study, controlled spills of conventional heavy crude oil were conducted in shoreline enclosures in a freshwater, boreal lake at the IISD-ELA to assess the efficacy of eMNR as a secondary remediation method for reducing exposure to dissolved PACs. Dissolved-phase total PACs peaked shortly after oil was added to the enclosures and declining to half of initial concentrations between 8.26 and 11.75 days and to near background conditions by ~70 days. Declining concentrations were likely the result of weathering processes (e.g., biodegradation, photooxidation, or sorption to sediment. We observed lower concentrations of total PACs in water in this CHV study relative to our previous diluted bitumen work [4], but trends in the relative removal rates of 2-,3-, 4- and >4-ring PACs were similar between the two studies. Similarly to our previous dilbit study, sediment PACs were heterogeneous and there were large contributions from pyrogenic compounds, making it difficult to confidently discern the impact of oil on PAC concentrations in sediments. However, significant differences in total PACs, excluding retene, indicated that the sediment in the CHV + eMNR enclosures were impacted by PAC sorption and/or CHV settling. Similarly to our previous research, we concluded that triplicate samples may be insufficient to capture spatial variability of PAC concentrations in sediment. High spatial resolution sampling to examine heterogeneity of PACs in sediment, at both unimpacted and oil spill-impacted sites, would be useful for developing guidance for sampling strategies that can enhance statistical comparisons and determine cleanup targets after an oil spill.
Using large-scale freshwater enclosures and in situ oil exposures we have demonstrated that treating residual oil that remains in the environment after primary spill cleanup using eMNR may be a viable option, especially in sensitive freshwater ecosystems, like marshes and wetlands. While we report evidence that oil may have become heterogeneously sequestered in sediments, concentrations of total PACs in the water column, dominated with 2-ring and 3-ring alkylated compounds, were below the lethal and sublethal total PAH threshold range for freshwater chronic toxicity, physiological effects, and mortality for fish.
Supplementary Materials
The following supporting information can be downloaded at: https://www.mdpi.com/article/10.3390/w18030363/s1, Figure S1: First order exponential decay models (solid line) of dissolved phase PACs by ring structure over the first 100 days of the study using concentration data (points) from days 1 to 73 (A,C,E) and 3 to 73 (B,D,F). Horizontal dotted line represents the mean concentration of total PACs in unoiled enclosures and lake reference. See Table S5 for model outputs., Figure S2: Trend in mean ratio of c2-naphthalene/c2-fluorene in water of the CHV + eMNR enclosures (n = 3) from day 1 to 73 after oiling. Error bars represent the standard deviation of enclosure replicates, and vertical dotted line represents secondary remediation., Figure S3: Trend in mean ratio of c2-dibenzothiophene/c2-phenanthrene in water of the CHV + eMNR enclosures (n = 3) from day 1 to 73 after oiling. Error bars represent the standard deviation of enclosure replicates, and vertical dotted line represents secondary remediation., Figure S4: Trend in mean ratio of c3-dibenzothiophene/c3-phenanthrene in water of the CHV + eMNR enclosures (n = 3) from day 1 to 73 after oiling. Error bars represent the standard deviation of enclosure replicates, and vertical dotted line represents secondary remediation. One sample on day 9 was removed due to a high ratio of 71.99 that skewed trend visualization., Figure S5: Trend in mean ratio of c3-phenanthrene/c3-chrysene in water of the CHV + eMNR enclosures (n = 3) from day 1 to 73 after oiling. Error bars represent the standard deviation of enclosure replicates, and vertical dotted line represents secondary remediation., Figure S6: Trend in mean ratio of c3-chrysene/c0-chrysene in water of the CHV + eMNR enclosures (n = 3) from day 1 to 73 after oiling. Error bars represent the standard deviation of enclosure replicates, and vertical dotted line represents secondary remediation. Table S1: List of polycyclic aromatic compounds quantified in water and sediment. Modified from Stanley et al. [13], Table S2: Statistical results of t-test and Wilcoxon rank sum test to assess significant difference (p > 0.05) between basic water quality parameters of the CHV + eMNR (n = 3) and unoiled enclosures (n = 3)., Table S3: Statistical results of two sided t-tests and Wilcoxon rank sum tests to assess significant difference (p > 0.05) between TN and TP concentrations of the CHV + eMNR (n = 3) and unoiled enclosures (n = 3)., Table S4: Statistical results of t-test and Wilcoxon rank sum test to assess significant difference (p > 0.05) between total dissolved phase PACs of the CHV + eMNR (n = 3) and unoiled enclosures (n = 3) by ring group., Table S5: First order exponential decay model summary for total dissolved phase PAC concentrations and by ring group over the first 100 days of the study using concentration data from days 1 to 73 and days 3 to 73. Upper and lower values represent the 95% confidence interval of the parameter estimates (y0 = intercept; alpha (k) = decay rate; DT50 = time [days] to reach half of y0). Table S6: Statistical results of t-test and Wilcoxon rank sum test to assess significant difference (p > 0.05) between total PACs excluding retene in sediment of the CHV + eMNR (n = 3) and unoiled enclosures (n = 3), and by ring group. Table S7: Summary results of triplicate sediment PAC indices from CHV + eMNR enclosures (n = 3), unoiled enclosures (n = 3), and lake reference (n = 1) from -1/2 days pre oiling to 70 days after oil addition.
Author Contributions
M.J.S.: Data curation, Formal analysis, Investigation, Visualization, Writing—original draft. L.T.: Data curation, Investigation, Project administration, Writing—review and editing. L.E.P.: Data curation, Formal analysis, Investigation, Methodology, Writing—review and editing. J.L.R.G.: Investigation, Formal Analysis, Writing—review and editing. G.T.: Conceptualization, Formal analysis, Funding acquisition, Investigation, Resources, Writing—review and editing. E.T.: Methodology, Writing—review and editing. S.H.: Formal analysis, Investigation, Resources, Data curation, Writing—review and editing. V.P.P.: Conceptualization, Funding acquisition, Investigation, Project administration, Resources, Supervision, Writing— review and editing. All authors have read and agreed to the published version of the manuscript.
Funding
This research was funded by Genome Canada [GAPP R13-6336]; an NSERC Collaborative Research and Development grant awarded to G. Tomy [NSERC File CRDPJ 532225-18] with Industrial partner support from the Canadian Association of Petroleum Producers, the Canadian Energy Pipeline Association [defunct], and the Myera Group, and in-kind contributions from the National Energy Board (now Canada Energy Regulator), TransCanada Pipelines, TransMountain Pipelines, and Enbridge; a Mitacs Accelerate Grant [#IT15202] that provided stipends for M.J.S. and L.E.P., and contributions from the International Institute for Sustainable Development Experimental Lakes Area. These funders were not involved in the collection, analysis, interpretation of data, the writing of this article, or the decision to submit it for publication.
Data Availability Statement
The original contributions presented in this study are available in an Environmental Data Initiative (EDI) repository entitled “The 2021 Freshwater Oil Spill Remediation Study (FOReSt), assessing the use of enhanced Monitored Natural Recovery (eMNR) of conventional heavy crude oil spills conducted in freshwater shoreline enclosures at the IISD Experimental Lakes Area, ON, Canada from 2021 to 2022”, available at https://portal.edirepository.org/nis/mapbrowse?packageid=edi.2258.1 (accessed on 11 December 2025) [65].
Acknowledgments
The authors wish to acknowledge that the IISD’s headquarters in Winnipeg are situated on Treaty 1 Territory—the ancestral lands of the Anishinaabe (Ojibwe), Ininiw (Cree), Anisininew (Ojibwe Cree), Dene, and Dakota Nations, and the homeland of the Red River Métis Nation and the IISD Experimental Lakes Area field station is situated on the traditional land of the Anishinaabe Nation in Treaty 3 Territory and the homeland of the Métis Nation. The authors express gratitude to all IISD-ELA researchers, staff, and students who supported the undertaking of this research.
Conflicts of Interest
Author Elliott Taylor was employed by the company Polaris Applied Sciences. The remaining authors declare that the research was conducted in the absence of any commercial or financial relationships that could be construed as a potential conflict of interest. The authors declare that this study received funding from Canadian Association of Petroleum Producers, the Canadian Energy Pipeline Association [defunct], and the Myera Group, and in kind contributions from National Energy Board (now Canada Energy Regulator), TransCanada Pipelines, TransMountain Pipelines, and Enbridge. These funders were not involved in the study design, collection, analysis, interpretation of data, the writing of this article or the decision to submit it for publication.
References
- Gilfillan, E.; Suchanek, T.; Boehm, P.; Harner, E.; Page, D.; Sloan, N. Shoreline Impacts in the Gulf of Alaska Region Following the Exxon Valdez Oil Spill. In Exxon Valdez Oil Spill: Fate and Effects in Alaskan Waters; Wells, P., Butler, J., Hughes, J., Eds.; ASTM International: West Conshohocken, PA, USA, 1995; Volume STP1219-EB, pp. 444–484. [Google Scholar] [CrossRef]
- Zhu, X.; Venosa, A.D.; Suidan, M.T.; Lee, K. Guidelines for the Bioremediation of Marine Shorelines and Freshwater Wetlands; US Environmental Protection Agency: Cincinnati, OH, USA, 2001. [Google Scholar]
- Lee, K.; Chen, B.; Boufadel, M.; Swanson, S.M.; Hodson, P.V.; Foght, J.; Venosa, A.D. Expert Panel Report on the Behaviour and Environmental Impacts of Crude Oil Released into Aqueous Environments; Royal Society of Canada: Ottawa, ON, Canada, 2015; ISBN 978-1- 928140-02-3. [Google Scholar]
- Palace, V.; Peters, L.; Berard-Brown, N.; Smyth, P.; Shanoff, T.; Wiseman, G.; Tomy, T.; Havens, S.; Dettman, H.; Greer, C.; et al. Assessing Monitored Natural Recovery (MNR) for remediating crude oil spills in freshwater environments: The Freshwater Oil Spill Remediation Study (FOReSt) at the Experimental Lakes Area, Canada. In Proceedings of the International Oil Spill Conference Proceedings, Online, 10–13 May 2021. [Google Scholar] [CrossRef]
- Palace, V.; Stanley, M.; Peters, L.E.; Timlick, L.; Tomy, G.T.; Havens, S.; Rodriguez-Gil, J.L.; Taylor, E. Polycyclic aromatic compounds in freshwater ecosystems following non-invasive remediation of controlled diluted bitumen spills: The Freshwater Oil Spill Remediation Study (FOReSt) at the Experimental Lakes Area, Canada. J. Great Lakes Res. 2025, 102730. [Google Scholar] [CrossRef]
- Black, T.A.; Hanson, M.L.; Palace, V.P.; Rodriguez-Gil, J.L. Surface-Dwelling Aquatic Insects in Low-Energy Freshwater Environments Are Highly Impacted by Oil Spills and the Surface Washing Agent Corexit EC9580A Used in Oil Spill Response. Environ. Toxicol. Chem. 2021, 40, 1298–1307. [Google Scholar] [CrossRef]
- Michaleski, S. Evaluating the Photo-Enhanced Toxicity of Diluted Bitumen and Conventional Heavy Crude Spills to Freshwater Organisms. Master’s Thesis, University of Manitoba, Winnipeg, MB, Canada, 2023. [Google Scholar]
- Dearnley, J. Assessing Exposure of Small-Bodied Fish to Experimental Crude Oil Spills in Contained Shoreline Environments Using Biliary Polycyclic Aromatic Compound Metabolites. Master’s Thesis, University of Manitoba, Winnipeg, MB, Canada, 2022. [Google Scholar]
- Canada Energy Regulator. Annual Canadian Crude Oil Production by Type. Data from Canadian Crude Oil Exports: A 30 Year Review; Data Report; Canada Energy Regulator: Calgary, AB, Canada, 2021. [Google Scholar] [CrossRef]
- American Petroleum Institute. Sunken Oil Detection and Recovery. API Technical Report 1154-1. American Petroleum Institute: Washington, DC, USA, 2016. Available online: https://www.oilspillprevention.org/~/media/Oil-Spill-Prevention/spillprevention/r-and-d/inland/sunken-oil-technical-report-pp2.pdf (accessed on 30 October 2025).
- Kidd, K.A.; Blanchfield, P.J.; Mills, K.H.; Palace, V.P.; Evans, R.E.; Lazorchak, J.M.; Flick, R.W. Collapse of a fish population after exposure to a synthetic estrogen. Proc. Natl. Acad. Sci. USA 2007, 104, 8897–8901. [Google Scholar] [CrossRef] [PubMed]
- Ankley, P.J.; Xie, Y.; Black, T.A.; DeBofsky, A.; Perry, M.; Paterson, M.J.; Hanson, M.; Higgins, S.; Giesy, J.P.; Palace, V. Using zooplankton metabarcoding to assess the efficacy of different techniques to clean-up an oil-spill in a boreal lake. Aquat. Toxicol. 2021, 236, 105847. [Google Scholar] [CrossRef] [PubMed]
- Stanley, M.J.; Peters, L.; Guttormson, A.; Tremblay, J.; Wasserscheid, J.; Timlick, L.; Greer, C.W.; Rodríguez Gil, J.L.; Halldorson, T.; Havens, S.; et al. Assessing changes to the root biofilm microbial community on an engineered floating wetland upon exposure to a controlled diluted bitumen spill. Front. Synth. Biol. 2025, 3, 1517337. [Google Scholar] [CrossRef]
- Kharey, G.S.; Palace, V.; Whyte, L.; Greer, C.W. Native freshwater lake microbial community response to an in situ experimental dilbit spill. FEMS Microbiol. Ecol. 2024, 100, fiae055. [Google Scholar] [CrossRef]
- Omilowo, H.O. Effects of Enhanced Monitored Natural Recovery of Conventional Heavy Crude on Biofilm and Phytoplankton at the IISD-Experimental Lakes Area, Northwestern Ontario. Master’s Thesis, University of Manitoba, Winnipeg, MB, Canada, 2024. [Google Scholar]
- Rodriguez-Gil, J.L.; Stoyanovich, S.; Hanson, M.L.; Hollebone, B.; Orihel, D.M.; Palace, V.; Faragher, R.; Mirnaghi, F.S.; Shah, K.; Yang, Z.; et al. Simulating diluted bitumen spills in boreal lake limnocorrals—Part 1: Experimental design and responses of hydrocarbons, metals, and water quality parameters. Sci. Total Environ. 2021, 790, 148537. [Google Scholar] [CrossRef]
- Fingas, M. Introduction to Oil Chemistry and Properties Related to Oil Spills. In Hydrocarbons, Oils and Lipids: Diversity, Origin, Chemistry and Fate; Wilkes, H., Ed.; Springer: Cham, Switzerland, 2020; pp. 49–79. [Google Scholar] [CrossRef]
- Hsu, C.S.; Robinson, P.R. Chemical Composition. In Petroleum Science and Technology; Hsu, C.S., Robinson, P.R., Eds.; Springer International Publishing: Cham, Switzerland, 2019; pp. 39–56. [Google Scholar] [CrossRef]
- Havens, S.; Cooney, B.; Stainton, M. The Chemical Analysis of Fresh Water, 3rd ed.; International Institute for Sustainable Development: Winnipeg, MB, Canada, 2024; p. 274. [Google Scholar] [CrossRef]
- United States Environmental Protection Agency. Priority Pollutant List. 2014. Available online: https://www.epa.gov/sites/default/files/2015-09/documents/priority-pollutant-list-epa.pdf (accessed on 15 April 2022).
- Stanley, M. Engineered Floating Wetlands as a Secondary Oil Spill Remediation Strategy for Freshwater Shorelines. Ph.D. Thesis, University of Manitoba, Winnipeg, MB, Canada, 2024. [Google Scholar]
- Idowu, I.G.; Francisco, O.; Thomas, P.; Johnson, W.; Marvin, C.; Stetefeld, J.; Tomy, T. Validation of a Simultaneous Method for Determining Polycyclic Aromatic Compounds and Alkylated Isomers in Biota. Rapid Commun. Mass Spectrom. 2017, 32, 277–287. [Google Scholar] [CrossRef]
- Xia, Z.; Idowu, I.; Kerr, E.; Klaassen, N.; Assi, H.; Bray, H.; Marvin, C.; Thomas, P.J.; Stetefeld, J.; Tomy, G.T. New approaches to reduce sample processing times for the determination of polycyclic aromatic compounds in environmental samples. Chemosphere 2021, 274, 129738. [Google Scholar] [CrossRef]
- Posit Team. RStudio: Integrated Development Environment for R, Computer Software; Posit Team, PBC: Boston, MA, USA, 2024. Available online: http://www.posit.co/ (accessed on 11 December 2025).
- R Core Team. R: A Language and Environment for Statistical Computing; Computer Software; R Foundation for Statistical Computing: Vienna, Austria, 2023; Available online: https://www.R-project.org/ (accessed on 11 December 2025).
- Wickham, H.; Averick, M.; Bryan, J.; Chang, W.; McGowan, L.; François, R.; Grolemund, G.; Hayes, A.; Henry, L.; Hester, J.; et al. Welcome to the Tidyverse. J. Open Source Softw. 2019, 4, 1686. [Google Scholar] [CrossRef]
- United States Environmental Protection Agency. Degradation Kinetics Equations. 2025. Available online: https://www.epa.gov/pesticide-science-and-assessing-pesticide-risks/degradation-kinetics-equations (accessed on 11 April 2023).
- Pinheiro, J.; Bates, D.; R Core Team. Nlme: Linear and Nonlinear Mixed Effects Models, R Package Version 3.1-160; R Core Team: Vienna, Austria, 2022. Available online: https://cran.r-project.org/package=nlme (accessed on 11 December 2025).
- Pinheiro, J.; Bates, D. Mixed-Effects Models in S and S-PLUS; Springer: New York, NY, USA, 2000. [Google Scholar] [CrossRef]
- Stoyanovich, S.S.; Saunders, L.J.; Yang, Z.; Hanson, M.L.; Hollebone, B.P.; Orihel, D.M.; Palace, V.; Rodriguez-Gil, J.L.; Mirnaghi, F.S.; Shah, K.; et al. Chemical Weathering Patterns of Diluted Bitumen Spilled into Freshwater Limnocorrals. Environ. Sci. Technol. 2023, 57, 9266–9276. [Google Scholar] [CrossRef]
- Ucan-Marin, F.; Dupuis, A. A Literature Review on the Aquatic Toxicology of Petroleum Oil: An Overview of Oil Properties and Effects to Aquatic Biota; DFO Canadian Science Advisory Secretariat (CSAS): Ottawa, ON, Canada, 2015; p. 52. [Google Scholar]
- Olson, G.; Gao, H.; Meyer, B.; Overton, E. Effect of Corexit 9500A on Mississippi Canyon crude oil weathering patterns using artificial and natural seawater. Heliyon 2017, 3, e00269. [Google Scholar] [CrossRef]
- Ortmann, A.C.; Robinson, B.; Poon, H.-Y.; King, T.L. Photodegradation Driven by Visible Light Exceeds Biodegradation across a Range of Environmental Conditions during the Initial Hours after an Oil Spill. Environ. Sci. Technol. 2025, 59, 21312–21323. [Google Scholar] [CrossRef]
- Stoyanovich, S.; Rodríguez-Gil, J.R.; Hanson, M.L.; Hollebone, B.P.; Orihel, D.M.; Palace, V.P.; Faragher, R.; Mirnaghi, F.S.; Shah, K.; Yang, Z.; et al. Simulating diluted bitumen spills in boreal lake limnocorrals—Part 2: Factors affecting the physical characteristics and submergence of diluted bitumen. Sci. Total Environ. 2021, 790, 148580. [Google Scholar] [CrossRef] [PubMed]
- Bobra, M.; Tennyson, E. Photooxidation of Petroleum. In Proceedings of the Twelfth AMOP Technical Seminar, Calgary, AB, Canada, 7–9 June 1989; pp. 129–147. [Google Scholar]
- Das, N.; Chandran, P. Microbial Degradation of Petroleum Hydrocarbon Contaminants: An Overview. Biotechnol. Res. Int. 2011, 2011, 941810. [Google Scholar] [CrossRef] [PubMed]
- Ghosal, D.; Ghosh, S.; Dutta, T.K.; Ahn, Y. Current State of Knowledge in Microbial Degradation of Polycyclic Aromatic Hydrocarbons (PAHs): A Review. Front. Microbiol. 2016, 7, 1369. [Google Scholar] [CrossRef] [PubMed]
- Bacosa, H.P.; Ancla, S.M.B.; Arcadio, C.G.L.A.; Dalogdog, J.R.A.; Ellos, D.M.C.; Hayag, H.D.A.; Jarabe, J.G.P.; Karim, A.J.T.; Navarro, C.K.P.; Palma, M.P.I.; et al. From Surface Water to the Deep Sea: A Review on Factors Affecting the Biodegradation of Spilled Oil in Marine Environment. J. Mar. Sci. Eng. 2022, 10, 426. [Google Scholar] [CrossRef]
- Hepditch, S.L.J.; Ahad, J.M.E.; Martel, R.; To, T.A.; Gutierrez-Villagomez, J.-M.; Larocque, È.; Vander Meullen, I.J.; Headley, J.V.; Xin, Q.; Langlois, V.S. Behavior and toxicological impact of spilled diluted bitumen and conventional heavy crude oil in the unsaturated zone. Environ. Pollut. 2024, 362, 124875. [Google Scholar] [CrossRef]
- Xin, Q.; Saborimanesh, N.; Ridenour, C.; Farooqi, H. Fate, behaviour and microbial response of diluted bitumen and conventional crude spills in a simulated warm freshwater environment. Environ. Pollut. 2024, 343, 123224. [Google Scholar] [CrossRef]
- Bennett, D.M.; Fritz, S.C.; Holz, J.C.; Holz, A.A.; Zlotnik, V.A. Evaluating climatic and non-climatic influences on ion chemistry in natural and man-made lakes of Nebraska, USA. Hydrobiologia 2007, 591, 103–115. [Google Scholar] [CrossRef]
- DataStream Initiative. A Monitor’s Guide to Water Quality. 2021. Available online: https://datastream.org/en-ca/guidebook (accessed on 11 December 2025).
- Zubov, I.N.; Orlov, A.S.; Selyanina, S.B.; Zabelina, S.A.; Ponomareva, T.I. Redox potential and acidity of peat are key diagnostic physicochemical properties for the stratigraphic zones of a boreal raised bog. Mires Peat 2022, 28, 05. [Google Scholar] [CrossRef]
- Hinsinger, P.; Plassard, C.; Tang, C.; Jaillard, B. Origins of root-mediated pH changes in the rhizosphere and their responses to environmental constraints: A review. Plant Soil 2003, 248, 43–59. [Google Scholar] [CrossRef]
- Kebede, G.; Tafese, T.; Abda, E.M.; Kamaraj, M.; Assefa, F. Factors influencing the bacterial bioremediation of hydrocarbon contaminants in the soil: Mechanisms and impacts. J. Chem. 2021, 2021, 9823362. [Google Scholar] [CrossRef]
- Mirsaeidi, A. The effects of nitrogen and phosphorus nutrients on the bioremediation of oil-contaminated waters by Gracilariopsis persica in the coastal areas of Bandar Abbas. Mar. Pollut. Bull. 2023, 188, 114660. [Google Scholar] [CrossRef] [PubMed]
- Schobert, H. Composition, classification, and properties of petroleum. In Chemistry of Fossil Fuels and Biofuels; Schobert, H., Ed.; Cambridge University Press: Cambridge, UK, 2013; pp. 174–191. [Google Scholar]
- Wassenaar, P.N.H.; Verbruggen, E.M.J. Persistence, bioaccumulation and toxicity-assessment of petroleum UVCBs: A case study on alkylated three-ring PAHs. Chemosphere 2021, 276, 130113. [Google Scholar] [CrossRef]
- Xin, Q.; Saborimanesh, N.; Greer, C.W.; Farooqi, H.; Dettman, H.D. The effect of temperature on hydrocarbon profiles and the microbial community composition in North Saskatchewan River water during mesoscale tank tests of diluted bitumen spills. Sci. Total Environ. 2023, 859, 160161. [Google Scholar] [CrossRef]
- CCME. Canadian Water Quality Guidelines for the Protection of Aquatic Life; Canadian Council of Ministers of the Environment: Winnipeg, MB, Canada, 1999; pp. 1–5. [Google Scholar]
- Vergeynst, L.; Greer, C.W.; Mosbech, A.; Gustavson, K.; Meire, L.; Poulsen, K.G.; Christensen, J.H. Biodegradation, photo-oxidation, and dissolution of petroleum compounds in an Arctic Fjord during summer. Environ. Sci. Technol. 2019, 53, 12197–12206. [Google Scholar] [CrossRef]
- Garrett, R.M.; Pickering, I.J.; Haith, C.E.; Prince, R.C. Photooxidation of crude oils. Environ. Sci. Technol. 1998, 32, 3719–3723. [Google Scholar] [CrossRef]
- Lima, A.L.C.; Farrington, J.W.; Reddy, C.M. Combustion-derived polycyclic aromatic hydrocarbons in the environment—A review. Environ. Forensics 2005, 6, 109–131. [Google Scholar] [CrossRef]
- Prince, R.C.; Garrett, R.M.; Bare, R.E.; Grossman, M.J.; Townsend, T.; Suflita, J.M.; Lee, K.; Owens, E.H.; Sergy, G.A.; Braddock, J.F. The roles of photooxidation and biodegradation in long-term weathering of crude and heavy fuel oils. Spill Sci. Technol. Bull. 2003, 8, 145–156. [Google Scholar] [CrossRef]
- Doering, J.A.; Dubiel, J.; Stock, E.; Collins, C.H.; Frick, I.; Johnson, H.M.; Lowrey-Dufour, C.M.; Miller, J.G.P.; Xia, Z.; Tomy, G.T.; et al. A Quantitative Adverse Outcome Pathway for Embryonic Activation of the Aryl Hydrocarbon Receptor of Fishes by Polycyclic Aromatic Hydrocarbons Leading to Decreased Fecundity at Adulthood. Environ. Toxicol. Chem. 2024, 43, 2145–2156. [Google Scholar] [CrossRef]
- McGrath, J.; Getzinger, G.; Redman, A.D.; Edwards, M.; Martin Aparicio, A.; Vaiopoulou, E. Application of the Target Lipid Model to Assess Toxicity of Heterocyclic Aromatic Compounds to Aquatic Organisms. Environ. Toxicol. Chem. 2021, 40, 3000–3009. [Google Scholar] [CrossRef] [PubMed]
- Stoyanovich, S.S.; Yang, Z.; Hanson, M.; Hollebone, B.P.; Orihel, D.M.; Palace, V.; Rodriguez-Gil, J.L.; Faragher, R.; Mirnaghi, F.S.; Shah, K. Simulating a spill of diluted bitumen: Environmental weathering and submergence in a model freshwater system. Environ. Toxicol. Chem. 2019, 38, 2621–2628. [Google Scholar] [CrossRef] [PubMed]
- Kharey, G.S.; Palace, V.; Whyte, L.; Greer, C.W. Influence of heavy Canadian crude oil on pristine freshwater boreal lake ecosystems in an experimental oil spill. FEMS Microbiol. Ecol. 2024, 100, fiae054. [Google Scholar] [CrossRef] [PubMed]
- Kieta, K.A.; Owens, P.N.; Petticrew, E.L. Determination of sediment sources following a major wildfire and evaluation of the use of color properties and polycyclic aromatic hydrocarbons (PAHs) as tracers. J. Soils Sediments 2023, 23, 4187–4207. [Google Scholar] [CrossRef]
- Vergnoux, A.; Malleret, L.; Asia, L.; Doumenq, P.; Theraulaz, F. Impact of forest fires on PAH level and distribution in soils. Environ. Res. 2011, 111, 193–198. [Google Scholar] [CrossRef]
- Yan, B.; Abrajano, T.A.; Bopp, R.F.; Chaky, D.A.; Benedict, L.A.; Chillrud, S.N. Molecular Tracers of Saturated and Polycyclic Aromatic Hydrocarbon Inputs into Central Park Lake, New York City. Environ. Sci. Technol. 2005, 39, 7012–7019. [Google Scholar] [CrossRef]
- Yunker, M.B.; Macdonald, R.W.; Vingarzan, R.; Mitchell, R.H.; Goyette, D.; Sylvestre, S. PAHs in the Fraser River basin: A critical appraisal of PAH ratios as indicators of PAH source and composition. Org. Geochem. 2002, 33, 489–515. [Google Scholar] [CrossRef]
- Tobiszewski, M.; Namieśnik, J. PAH diagnostic ratios for the identification of pollution emission sources. Environ. Pollut. 2012, 162, 110–119. [Google Scholar] [CrossRef]
- Stoyanovich, S.; Yang, Z.; Hanson, M.; Hollebone, B.P.; Orihel, D.M.; Palace, V.; Rodriguez-Gil, J.R.; Mirnaghi, F.; Shah, K.; Blais, J.M. Fate of polycyclic aromatic compounds from diluted bitumen spilled into freshwater limnocorrals. Sci. Total Environ. 2022, 819, 151993. [Google Scholar] [CrossRef]
- Stanley, M.J.; Timlick, L.; Peters, L.E.; Rodríguez Gil, J.L.; Tomy, G.; Taylor, E.; Havens, S.; Palace, V.P. The 2021 Freshwater Oil Spill Remediation Study (FOReSt), assessing the use of enhanced Monitored Natural Recovery (eMNR) of conventional heavy crude oil spills conducted in freshwater shoreline enclosures at the IISD Experimental Lakes Area, ON, Canada from 2021 to 2022. ver 1. Environmental Data Initiative. 2026. Available online: https://portal.edirepository.org/nis/mapbrowse?packageid=edi.2258.1 (accessed on 11 December 2025).


Disclaimer/Publisher’s Note: The statements, opinions and data contained in all publications are solely those of the individual author(s) and contributor(s) and not of MDPI and/or the editor(s). MDPI and/or the editor(s) disclaim responsibility for any injury to people or property resulting from any ideas, methods, instructions or products referred to in the content. |
© 2026 by the authors. Licensee MDPI, Basel, Switzerland. This article is an open access article distributed under the terms and conditions of the Creative Commons Attribution (CC BY) license.