Abstract
Water vulnerability in Piura, northern Peru, is shaped by structural, climatic and governance factors. Surface water from the Chira, Huancabamba and Piura basins is stored and conveyed through major reservoirs (Poechos and San Lorenzo) and canals (Daniel Escobar, Miguel Checa), while service and storage infrastructure is denser on the coast than in the highlands. This study adapts and operationalizes Escribano’s multidimensional scarcity framework—originally developed for the Gulf of Guinea—into a provincial-scale water-vulnerability index for Piura. Structural, climatic-exposure and institutional-capacity indicators from official statistics are min–max normalized to 0–1, aggregated into dimension indices as arithmetic means, and combined with equal weights. All indicators, normalization procedures and aggregation rules are documented, and the resulting indices are mapped with GIS to reveal intra-regional disparities. Findings show that highland provinces such as Ayabaca and Morropón exhibit higher composite vulnerability than coastal provinces, due to persistent poverty, predominantly rural settlement patterns and weaker governance capacity. Some coastal provinces, notably Paita and Sechura, also display elevated vulnerability, whereas Piura and Sullana score lower despite higher demand. Overall, vulnerability appears to be driven more by socio-institutional asymmetries than by physical availability, providing a transparent screening tool for adaptive, territorial water governance.
1. Introduction
Water scarcity has evolved into a complex, multidimensional issue that challenges both scientific understanding and public policy. As traditional approaches focused on physical availability prove insufficient, there is growing recognition of the need for context-sensitive frameworks that integrate infrastructural, environmental, and institutional variables. In this study, water scarcity is approached through an index-based assessment of territorial water vulnerability. However, few studies have applied territorial vulnerability frameworks to sub-national water challenges in Peru, particularly in semi-arid regions. In Peru’s administrative system, “Piura” denotes both the region and its eponymous province; the Piura region comprises eight provinces—Piura, Sullana, Talara, Paita, Sechura, Morropón, Ayabaca, and Huancabamba. To address this gap, we apply and adapt an established territorial framework to assess water vulnerability in the Piura region of northern Peru as a critical case study.
1.1. Global Context and Conceptual Background
Water scarcity is one of the most critical challenges facing humanity in the 21st century. It refers not only to the physical shortage of water, but also to the imbalance between supply and demand, institutional weaknesses, and socio-economic barriers that limit equitable access to water resources [1,2]. According to global assessments, nearly one-third of the world’s population (~2.7 billion people) is currently facing or will imminently face water stress due to climate change, population growth, and inefficient water governance systems [3,4].
Driven by these challenges, the paradigm of Integrated Water Resources Management (IWRM) has gained increasing relevance as a conceptual and institutional framework to promote coordinated development and management of water, land, and related resources [5,6,7].
In response, recent academic advances and governance experiences converge in highlighting the need for territorially adapted frameworks that integrate structural inequality, climatic variability, and governance capacity—thus moving beyond static supply–demand models and towards more context-sensitive forms of Water Resources Management (WRM) [2,8]. These perspectives are grounded in the idea that water risk is not merely a hydrological issue, but a territorially differentiated socio-environmental condition. Accordingly, an expanding body of literature supports the application of territorialized WRM methodologies, particularly in regions marked by climatic extremes and institutional fragmentation [9,10]. This global challenge manifests in particularly complex ways in arid and semi-arid regions such as northern Peru, where territorial inequalities exacerbate water-related vulnerability. Specifically, demand tends to concentrate along the coastal corridor, while climatic exposure—captured here through the Climatic Exposure Index—varies across provinces (e.g., Piura and Sullana). The quantified provincial results are reported in Section 3.
1.2. Case of Piura and Regional Challenges
In the Piura region (northern Peru), water security is shaped by semi-arid coastal conditions, Andean foothills, and strong inter-annual variability linked to El Niño-Southern Oscillation (ENSO) events. Although three main rivers—Chira, Huancabamba, and Piura—and major irrigation schemes suggest abundant supply, availability is highly variable spatially and temporally [11,12]. Demand is concentrated to coastal urban districts and agro-industrial valleys, while upland districts face higher climatic exposure and lower service reliability.
Water governance involves regional and municipal utilities, basin authorities, and irrigation boards, creating multi-level coordination challenges [8]. Together, these environmental and institutional features generate the socio-institutional asymmetries that our territorial framework captures. This coastal–highland contrast reflects a marked west–east gradient in Piura’s physical setting. Coastal provinces form a low-elevation plain with predominantly arid conditions, while the Andean foothills and highland provinces rise rapidly in elevation and present more humid and heterogeneous environments. These physical differences are mirrored by settlement patterns: the coastal corridor consists of the regional urban hub (Piura city) and higher population densities, whereas highland provinces are predominantly rural and more dispersed.
Beyond these coordination issues, underinvestment in adaptive infrastructure and the absence of integrated planning tools further constrain effective water governance. These conditions are typical of semi-arid, hydro-climatic settings where physical abundance does not necessarily translate into equitable and reliable access [13,14]. Figure 1a locates the Piura region within Peru. Figure 1b therefore serves as a provincial reference frame for interpreting the spatial contrasts reported in the structural, climatic, institutional, and composite maps reported later in the paper.
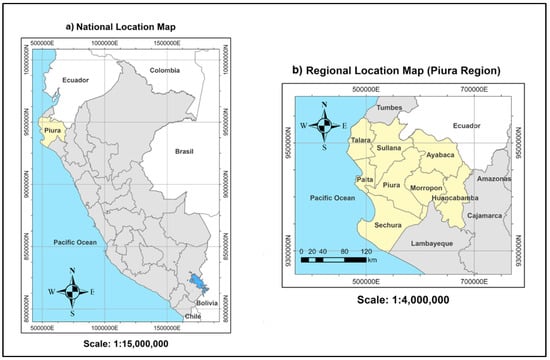
Figure 1.
(a) National location of the Piura region, northern Peru. (b) Regional map showing the eight provinces. This map provides the spatial reference used in the subsequent provincial-level analysis. Maps generated in ArcGIS Pro 3.0.2.
1.3. Objective and Contribution of the Study
This study aims to develop and apply a territorial methodology for assessing territorial water vulnerability in the Piura region through a provincial-scale water-vulnerability index that operationalizes an existing multidimensional framework originally developed to assess water scarcity. Building on Escribano’s conceptualization of water scarcity as the interaction between supply–demand dynamics and socio-economic drivers [15], we adapt this perspective to a static, subnational index that integrates three dimensions: structural vulnerability, climatic exposure, and institutional capacity. Beyond conventional assessments focused on water volumes or isolated infrastructure gaps, the proposed index highlights how infrastructural deficits, environmental exposure and governance asymmetries converge to shape territorial water risk [2]. The selection of indicators and the overall structure of the index were informed by a systematic review of 34 peer-reviewed studies conducted by the author and tailored to the Piura case to identify critical zones of stress, planning deficits, and institutional gaps. Methodologically, the contribution lies in providing a transparent and replicable screening tool for subnational water-vulnerability assessment in data-limited, semi-arid regions and in deriving from it a governance-driven versus demand-driven vulnerability typology and a basic transfer protocol for similar multi-level governance settings [7,16].
Consistent with this emerging literature, recent subnational studies have increasingly formalized indicator-based workflows to screen water- and hazard-related vulnerabilities across administrative units, often combining multi-dimensional indicators with explicit normalization, aggregation, and mapping steps. Several contributions compare alternative weighting and aggregation choices and discuss their implications for spatial rankings and interpretability [17,18,19]. Related frameworks designed for data-scarce contexts emphasize transparent documentation of normalization/classification rules and uncertainty considerations to improve transfer and re-use across regions [20,21]. Provincial-scale applications further illustrate the value of standardized, replicable diagnostics for spatial prioritization [22]. Building on this line of work, our protocol operationalizes a three-dimensional screening index at provincial scale with explicit rules and robustness checks, supporting cautious interpretation and practical planning use. This aligns with the broader call to territorialize water management.
More broadly, several studies have emphasized the importance of territorializing water management strategies, especially in socio-environmentally fragile regions [9,10,23]. In Latin America, growing attention has been paid to the role of subnational institutions, climate-sensitive planning, and community-based governance models as complements to national frameworks. Peru faces critical governance challenges due to overlapping jurisdictions, under-resourced local entities, and limited data availability, which hinder effective implementation of water-related policies at the regional level [24,25,26]. Within this complex institutional landscape, Piura emerges as a representative case for applying context-sensitive methodologies that account for both physical and social drivers of water-related vulnerability. This study contributes to this line of inquiry by operationalizing a dynamic, territorially grounded model that informs both academic debate and practical water-planning decisions.
Considering the proposed objective, this study is guided by the following research question: To what extent do structural, climatic, and institutional variables determine territorial water vulnerability in Piura, and how does this vulnerability vary spatially across its provinces?
Based on prior evidence and methodological assumptions, we hypothesize that territorial water vulnerability in Piura is not primarily driven by physical availability, but rather by the combined effects of socio-structural vulnerabilities, climatic exposure, and institutional weaknesses, which vary significantly across provinces.
2. Methodology and Analytical Framework
This section details the methodological framework developed to assess territorial water vulnerability in the Piura region and its application through geospatial and institutional indicators. It introduces the core model, explains its adaptation to the socio-environmental and institutional realities of northern Peru, and details the workflow employed for spatial analysis. The section is structured in three parts: (i) the theoretical basis and key dimensions of the model, (ii) its application to the Piura context, and (iii) the data sources and procedures used to construct the composite indexes.
2.1. Conceptual Model and Application to Piura
This study draws on the conceptual framework proposed by Escribano [15]—originally developed to assess freshwater scarcity dynamics over time based on supply–demand dynamics in the Gulf of Guinea region—and operationalizes it as a territorial vulnerability index for the Piura region. While Escribano’s doctoral thesis at the Universitat Politècnica de Catalunya (UPC), within the UNESCO Chair on Sustainability, provides the underlying multidimensional structure (linking supply–demand dynamics with socio-economic drivers), the present work develops a distinct, province-level index that is fully specified in this article. All indicators, normalization procedures and aggregation rules are described step by step below, allowing replication and critical assessment without direct access to the original Spanish-language dissertation.
The conceptual structure used here is organized around three key dimensions: (i) structural vulnerability, (ii) climatic exposure, and (iii) institutional capacity. Together, these dimensions form a multidimensional framework to assess water vulnerability, grounded in territorial intelligence and hydrosocial analysis. This approach moves beyond purely hydrological indicators, highlighting how spatial inequalities, social–environmental pressures and governance asymmetries shape water-related vulnerability at the territorial level.
Each dimension captures a critical facet of vulnerability:
- Structural: deficits in infrastructure, socio-economic inequality, and urban–rural divides.
- Climatic: frequency and severity of droughts, floods, and other extreme events.
- Institutional: weaknesses in governance, lack of policy coordination, and limited local implementation capacity.
Given the limited availability of consistent provincial data on water resources, infrastructure and sectoral demand, the index is explicitly framed as a territorial water-vulnerability index rather than a direct measure of physical water availability. Structural indicators such as population density and the share of rural population are used as proxies for exposure and service-delivery challenges and are interpreted jointly with climatic-exposure and institutional indicators. We employ min–max normalization within the eight provinces to emphasize relative territorial inequalities and we adopt equal weighting as a pragmatic starting point consistent with many composite indicator exercises under data and knowledge constraints. A simple sensitivity check of alternative weighting combinations is reported in Section 4.5, while future applications could further refine these choices through participatory weighting schemes and the inclusion of more detailed hydrological and infrastructure variables.
We target territorial vulnerability drivers—structural, climatic-exposure, and institutional—rather than absolute hydrologic availability (runoff, recharge, stored volumes). At the provincial scale, comparable supply series are lacking and would mix stocks/flows with access/governance measures; climatic proxies (drought frequency, ENSO sensitivity, precipitation anomaly) capture supply variability, while the structural dimension reflects service and storage infrastructure. These three dimensions are treated as interdependent forces that define the territorial risk profile and the capacity to manage water-related stress.
To apply the model to the Piura region, adaptations to the local context were made. First, the structural dimension was expanded using geospatial information on infrastructure and service access gaps, which are particularly relevant in Piura. Second, hydrological variables with limited regional data (e.g., aquifer recharge) were replaced with climatic proxies such as drought exposure and rainfall variability. Finally, institutional indicators were redefined to reflect the presence and performance of local water governance entities. These adaptations aim to preserve the model’s analytical logic while enhancing its operational relevance in a fragmented, coastal setting with high socio-environmental asymmetries.
This conceptual differentiation is consistent with recent global frameworks, such as the Human Development Report 2025 [27], which emphasizes the need to address structural inequalities and governance asymmetries to advance water and resource justice in vulnerable regions.
2.2. Adaptation to the Piura Region
This study focuses on the Piura region, located in northwestern Peru, with more than 1.8 million inhabitants and a territorial extension of about 35,800 km2. Despite its access to the Pacific Ocean and three major rivers—Chira, Piura, and Huancabamba—the region faces persistent challenges related to water availability, infrastructure inequality, and institutional fragmentation. Its combination of coastal, Andean, and transitional zones offers diverse conditions for evaluating spatial water stress, making it an ideal setting for applying a differentiated territorial methodology.
The eight provinces that comprise Piura—Piura, Sullana, Talara, Paita, Sechura, Morropón, Ayabaca, and Huancabamba—reflect a broad spectrum of environmental, socio-economic, and institutional contexts. By disaggregating the analysis at the provincial level, the methodology captures intra-regional disparities and provides a more comprehensive basis for strategic water resources management.
To reflect the multidimensional nature of territorial water vulnerability in this context, a structured selection of indicators was carried out based on three main criteria:
- (i)
- relevance to Piura’s regional dynamics as identified in public policy reports and the academic literature;
- (ii)
- availability and spatial reliability of data at the provincial scale;
- (iii)
- alignment with the conceptual dimensions already defined in the previous section.
Given Piura’s hydroclimatic instability and fragmented governance structures, the final set of indicators was selected to capture (i) exposure to droughts and rainfall variability, (ii) deficits in water-service infrastructure and access, and (iii) the presence and performance of local water-governance entities. Based on a systematic review of 34 scientific studies and national planning documents, the following indicators were identified and spatially assessed:
- Structural indicators: population density (I1), poverty levels (I2), access to water infrastructure (I3), rurality index (I4).
- Climatic exposure indicators: historical drought frequency (I5), El Niño sensitivity (I6), precipitation anomalies (I7).
- Institutional indicators: presence of local water management bodies (I8), execution rate of public investment (I9), multisectoral coordination mechanisms (I10).
The corresponding raw values by province and sources are provided in Supplementary File together with variable definitions.
Other potential variables, such as aquifer recharge rates or household-level consumption data, were excluded owing to the limited availability of reliable and consistent provincial datasets. This exclusion criterion ensured comparability across provinces and prevented distortions derived from incomplete or inconsistent sources.
Each indicator was then normalized and grouped to calculate composite indexes for the structural, climatic, and institutional dimensions. These final indexes—representing a single value per province for each dimension—were then visualized using a Geographic Information System (GIS).
The data sources for the selected indicators included official institutions such as the Instituto Nacional de Estadística e Informática (INEI, National Institute of Statistics and Informatics), the Autoridad Nacional del Agua (ANA, National Water Authority), the Ministerio de Desarrollo Agrario y Riego (MIDAGRI, Ministry of Agrarian Development and Irrigation), the Servicio Nacional de Meteorología e Hidrología (SENAMHI, National Meteorology and Hydrology Service), and the Ministerio de Economía y Finanzas (MEF, Ministry of Economy and Finance). Once introduced, these institutions are referred to by their acronyms throughout the text and tables.
Table 1 summarizes the complete list of indicators, including their type, data source and year, and measurement units, which were calculated for each of Piura’s eight provinces. No imputation of missing values was carried out; indicators or years with incomplete provincial coverage were excluded at the selection stage to preserve comparability across provinces.

Table 1.
Summary of indicators used to construct the Composite Water Vulnerability Index (provincial level, Piura region).
2.3. Indicator Normalization and Index Construction
To integrate the selected indicators into a composite index, indicators were standardized to a common scale. Given the heterogeneity in units and directions, a min–max normalization with directional inversion was applied. Two transformations were used depending on whether higher raw values indicate greater vulnerability or more favorable conditions. The equations used are expressed as follows:
- For indicators where higher values represent greater vulnerability—such as drought frequency or rurality index—the following formula was used (Equation (1)):where X is the original value, and Xmin, Xmax are the minimum and maximum observed across the eight provinces, and Xnorm is the normalized value. This transformation preserves the indicator’s direction—higher normalized values indicate greater vulnerability. Both transformations rescale indicator to the [0,1] range. Accordingly, the resulting 0–1 values are primarily intended for within-sample (within-region) comparison and screening across provinces; the corresponding tables report the absolute normalized values for numeric interpretation.
- For indicators where higher values indicate more favorable conditions—such as access to piped water or the presence of local water governance entities—the scale was inverted using the following transformation (Equation (2)):
This inversion ensures comparability across indicators for which higher raw values reflect more favorable conditions. For ordinal variables (I6, I8 and I10), the ordered qualitative classes were first converted into numerical scores on a 0–10 scale before normalization. In all cases, the lowest category (e.g., very low ENSO sensitivity or absence of local water governance arrangements) was assigned a value of 0 and the highest category with a value of 10 (e.g., very high sensitivity or consolidated arrangements), with intermediate classes receiving increasing scores between these two extremes. This monotonic recoding preserves the ranking of the original ordinal scale and places the variables on a common 0–10 range. The resulting scores were then normalized using the same min–max transformations as the other indicators (Equations (1) and (2)), treating I6 as a direct vulnerability indicator and applying the inverted transformation to I8 and I10 because higher values indicate more favorable institutional conditions. A scoring rubric (0–10), the raw provincial scores for I6, I8 and I10, and the supporting documentary evidence used for coding are reported in the Supplementary File.
After normalization, indicators were grouped into three conceptual dimensions—structural vulnerability, climatic exposure, and institutional capacity. For each province , the dimension indices were computed as the arithmetic mean of their constituent normalized indicators. The composite index was then obtained as the unweighted average of the three-dimension indices (Equation (3)):
Higher values denote greater vulnerability/exposure.
A weighted overlay technique was applied in the GIS environment to generate the Composite Water Vulnerability Index. Equal weights were assigned to the three dimensions—structural, climatic, and institutional—reflecting the conceptual parity proposed in the original framework and avoiding artificial prioritization in the absence of stakeholder input or expert consensus. This decision reflects a reasonable methodological judgment by the author, given the exploratory nature of this territorial diagnosis. Future studies could refine the weighting process through participatory methods or analytic techniques such as the Analytic Hierarchy Process (AHP), if time, data, and expert availability allow.
The integration of geospatial tools, using ArcGIS Pro 3.0.2, enhanced the model’s analytical capacity by enabling the spatial representation of results. These visualizations supported the identification of intra-regional disparities and helped communicate findings in a policy-relevant format.
This spatialized approach aligns with recent efforts in Latin America to territorialize Integrated Water Resources Management (IWRM) by integrating social vulnerability and governance capacity into subnational diagnostics [7,8,10,24].
2.4. AI Assistance
During manuscript preparation, the authors used ChatGPT (OpenAI; model: GPT-5 Thinking; web interface; accessed June–November 2025) for limited, non-analytical editorial tasks, specifically terminology/abbreviation consistency checks and minor sentence-level polishing in non-substantive passages. All AI outputs were reviewed, verified against the cited sources, and thoroughly edited by the authors. No AI tools were used for data analysis, statistical calculations, methodological design, figure generation, or interpretation of results.
3. Territorial Assessment of Water Vulnerability
This section presents the quantitative results of the territorial analysis of water vulnerability in the Piura region. The assessment focuses on three key dimensions—structural, climatic, and institutional—previously defined in the methodological framework. Each dimension integrates normalized indicators for the region’s eight provinces, allowing cross-provincial comparison and the identification of spatial risk patterns.
A composite water vulnerability index was then derived by linearly aggregating the three dimensions. The resulting values are presented in comparative tables and maps to facilitate spatial interpretation and highlight zones of concentrated risk. This approach provides a balanced and replicable method widely used in water governance studies for its clarity and cross-regional comparability, especially when empirical weighting is not feasible.
These results offer a basis for interpreting spatial disparities in water vulnerability across Piura and for informing evidence-based adaptation strategies. The following subsections examine each dimension in detail before presenting an integrated territorial synthesis based on the composite index.
Indicators are normalized to 0–1; higher values indicate higher stress/exposure. Province-to-province contrasts mainly reflect (i) demand concentration and infrastructure/service capacity (structural/institutional) versus (ii) hydro-climatic exposure. We discuss how these drivers combine to produce the observed asymmetries.
3.1. Structural Vulnerability
The structural dimension of water vulnerability captures the territorial and socio-demographic conditions that shape the population’s capacity to access and manage water resources. Four indicators were considered: population density (I1), poverty level (I2), access to piped water services (I3), and rurality index (I4). These variables jointly reflect the pressure exerted on existing water infrastructure and the structural disadvantages that limit equitable and sustained access.
The normalized scores for these indicators (I1–I4) were obtained from official datasets: population and poverty data from INEI, piped water access from ANA and MIDAGRI, and rurality index from INEI (ratio of rural to urban households). All indicators were standardized using min–max rescaling prior to aggregation.
Table 2 summarizes the normalized results for structural indicators across the eight provinces of Piura, highlighting intra-regional disparities.
Table 2.
Normalized values of structural vulnerability indicators (I1–I4) and the Composite Structural Vulnerability Index for the Piura region.
Ayabaca and Huancabamba exhibit the highest levels of structural vulnerability (0.614 and 0.612, respectively), mainly driven by high poverty levels and the predominance of rural population. Paita (0.606) and Morropón (0.598) also shows high structural vulnerability. Conversely, Piura (0.470) and Sullana (0.481) display lower structural vulnerability, associated with comparatively lower poverty levels and a smaller share of rural population.
A spatial representation of structural vulnerability was developed using ArcGIS Pro 3.0.2. Figure 2 highlights the territorial disparities observed in Table 2, visually identifying provinces with greater socio-demographic and infrastructure-related constraints. The spatial layer identifies structurally constrained provinces—e.g., Ayabaca, Huancabamba, Morropón and Paita —with high exposure scores, guiding monitoring and early-warning priorities.
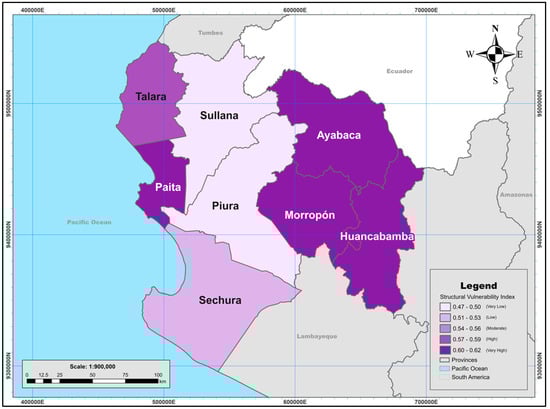
Figure 2.
Spatial distribution of the Structural Vulnerability Index (provincial level, Piura region). The map highlights intra-regional disparities in socio-demographic and infrastructure-related conditions affecting water access. Map generated using ArcGIS Pro 3.0.2. Coordinate system: UTM Zone 17S, WGS 1984. Classification: five equal-interval classes based on Structural Vulnerability Index values.
3.2. Climatic Exposure to Water Risk
The climatic exposure dimension of water vulnerability captures the influence of hydro-meteorological variability on water availability and distribution. It considers how recurrent droughts, floods, and precipitation anomalies affect the reliability of water supply systems across the Piura region. Three indicators were selected: historical drought frequency (I5), El Niño sensitivity (I6), and precipitation anomalies (I7). These variables jointly represent the exposure of provincial territories to climate-related water risks.
The normalized scores for these indicators (I5–I7) were obtained from official and scientific sources: drought frequency and precipitation anomalies from SENAMHI and ANA datasets, while El Niño was derived from recent academic studies. All indicators were standardized using the min–max rescaling method to ensure comparability across provinces.
Table 3 summarizes the normalized climatic indicators and the resulting Climatic Exposure Index, highlighting the spatial heterogeneity of hydro-climatic stress across the Piura region.
Table 3.
Normalized values of climatic exposure indicators (I5–I7) and the Climatic Exposure Index for the Piura region.
The results show that Piura (0.833) and Sullana (0.655) exhibit the highest climatic exposure, mainly due to their recurrent droughts and strong sensitivity to El Niño events. In contrast, Talara (0.399) and Huancabamba (0.292) register lower exposure, reflecting their relative climatic stability and orographic protection from coastal variability. Intermediate levels are observed in Sechura and Morropón, where rainfall anomalies and prolonged dry seasons periodically affect agricultural activities and water supply.
A spatial representation of climatic exposure was developed using ArcGIS Pro 3.0.2. Figure 3 displays the spatial distribution of the Climatic Exposure Index across Piura’s eight provinces. Based on the provincial ranking, Piura, Sullana, and Paita occupy the highest positions, whereas Huancabamba and Talara occupy the lowest positions; Sechura, Morropón, and Ayabaca are located in intermediate positions. This spatial evidence helps prioritize provinces for climate-risk monitoring and for targeting resilience-oriented investments in water-related infrastructure.
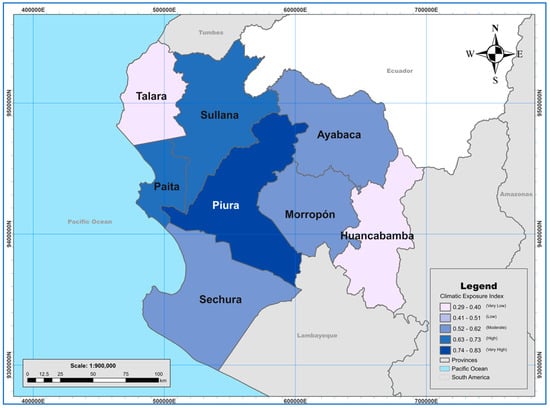
Figure 3.
Spatial distribution of the Climatic Exposure Index (provincial level, Piura region). The map illustrates the spatial variability of hydro-climatic risk and the differentiated exposure to droughts and El Niño-related events. Map generated using ArcGIS Pro 3.0.2. Coordinate system: UTM Zone 17S, WGS 1984. Classification: five equal-interval classes based on Climatic Exposure Index values.
3.3. Institutional Capacity
The institutional capacity dimension of water vulnerability reflects the strength and performance of local governance systems responsible for managing water resources. It considers the ability of provincial and municipal institutions to coordinate, plan, and execute actions related to water management. Three indicators were included: presence of local water management bodies (I8), execution rate of public investment (I9), and multisectoral coordination mechanisms (I10). These variables jointly capture the governance dimension of water security and its role in mitigating structural and climatic vulnerabilities.
The data for these indicators were compiled from official national sources: the presence of local water management bodies (I8) was obtained from the National Water Authority (ANA), the execution rate of public investment (I9) from the Transparency Portal of the Ministry of Economy and Finance (MEF), and multisectoral coordination mechanisms (I10) from national policy documents and institutional reports. All indicators were standardized using the min–max rescaling method to ensure comparability across provinces.
Table 4 presents the normalized results for the institutional indicators (I8–I10) and the resulting Institutional Vulnerability Index, which summarizes disparities in governance capacity across Piura’s eight provinces.
Table 4.
Normalized values of institutional vulnerability indicators (I8–I10) and the Institutional Vulnerability Index for the Piura region.
The results indicate significant contrasts in institutional vulnerability across the region. Ayabaca (1.000) and Huancabamba (0.729) exhibit the highest institutional vulnerability, reflecting limited presence of formal water governance bodies and low levels of investment execution. Sechura (0.600) and Morropón (0.598) also record elevated vulnerability, mainly due to weak multisectoral coordination. In contrast, Piura (0.000) and Sullana (0.198) demonstrate stronger institutional performance and more consolidated local governance frameworks, resulting in lower institutional vulnerability.
A spatial representation of institutional vulnerability was developed using ArcGIS Pro 3.0.2. Figure 4 displays the geographic distribution of the Institutional Vulnerability Index across Piura’s eight provinces, highlighting the institutional fragmentation between coastal and highland territories. The map pinpoints priority areas for infrastructure upgrading (e.g., Morropón and Ayabaca) and demand management (e.g., Piura and Sullana).
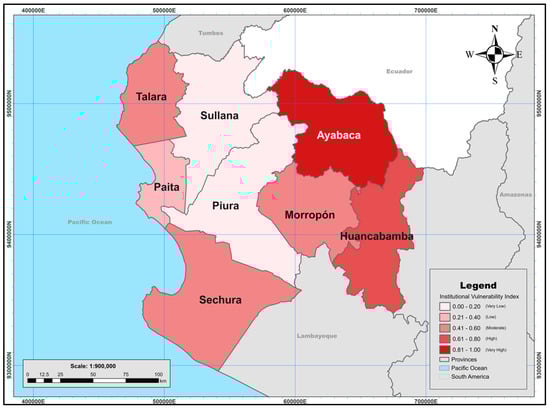
Figure 4.
Spatial distribution of the Institutional Vulnerability Index (provincial level, Piura region). The map shows governance asymmetries between coastal and highland provinces, emphasizing areas where institutional weaknesses exacerbate water vulnerability. Map generated using ArcGIS Pro 3.0.2. Coordinate system: UTM Zone 17S, WGS 1984. Classification: five equal-interval classes based on Institutional Vulnerability Index values.
3.4. Territorial Synthesis of Composite Vulnerability
The composite index of water vulnerability was constructed by aggregating the scores from the three analytical dimensions—structural, climatic, and institutional—using a linear averaging method. Equal weights were assigned to each dimension to preserve methodological neutrality, given the absence of stakeholder-defined priorities or validated weighting schemes. This integrated approach enables a comparative assessment of overall vulnerability across Piura’s eight provinces.
The synthesis integrates the three partial indexes described in Section 3.1, Section 3.2 and Section 3.3 into a single composite value, providing a coherent basis for the territorial comparison that follows. Table 5 summarizes the normalized values across all three dimensions, offering an integrated overview of water vulnerability in the Piura region. Scores closer to 1 indicate higher levels of vulnerability, while lower scores reflect relatively more favorable conditions.
Table 5.
Composite Water Vulnerability Index by province (Piura region).
The results show that Ayabaca (0.713) exhibits the highest level of composite water vulnerability, reflecting the combined effect of structural deficits, high climatic exposure and institutional weaknesses. A second group of provinces—Morropón (0.590), Paita and Sechura—also display high composite index values, signaling significant multidimensional vulnerability both in inland and coastal areas. By contrast, Piura (0.434) and Sullana (0.445) register lower composite vulnerability levels, consistent with comparatively stronger institutional capacity and better infrastructure and service coverage.
These findings highlight pronounced territorial disparities in water vulnerability and emphasize the need for context-sensitive strategies that combine infrastructure development, climate adaptation, and institutional strengthening. This multidimensional approach is essential to promote resilience and ensure equitable water access across Piura’s contrasting coastal and highland territories.
Consistent with national governance frameworks [1,5,27], our results show that provinces with greater institutional capacity and infrastructure coverage—Piura (0.434) and Sullana (0.445)—exhibit lower composite vulnerability, whereas provinces with weaker coordination and service reliability—Ayabaca (0.713) and Morropón (0.590)—score highest. To support prioritization, we mapped the Composite Water Vulnerability Index in ArcGIS Pro 3.0.2; Figure 5 highlights a high-vulnerability cluster in the highlands (Ayabaca–Huancabamba–Morropón) and lower levels along the coastal corridor, providing a screening layer for institutional strengthening and demand-management actions.
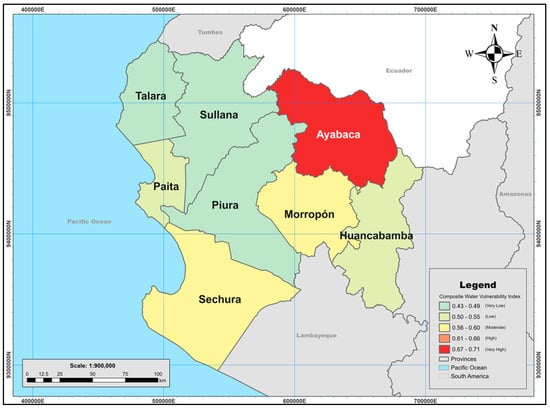
Figure 5.
Spatial distribution of the Composite Water Vulnerability Index (provincial level, Piura region). The map highlights cumulative water vulnerability resulting from the intersection of structural, climatic, and institutional stressors. Map generated using ArcGIS Pro 3.0.2. Coordinate system: UTM Zone 17S, WGS 1984. Classification: five equal-interval classes based on Composite Water Vulnerability Index values.
Overall, the territorial assessment reveals marked intra-regional disparities in water vulnerability across Piura. The integration of structural, climatic, and institutional dimensions provides a multidimensional perspective that underpins the discussion of governance challenges and adaptation priorities in the following section.
4. Discussion
This section examines the territorial dynamics of water vulnerability in Piura, as quantified by the composite index developed in this study. By integrating structural, climatic, and institutional dimensions, the index reveals how vulnerability varies across provinces, highlighting spatial asymmetries and systemic inequalities in water access. The discussion is organized around five analytical aspects: spatial patterns, contrasting cases, planning and governance implications, broader transferability, and methodological reflections. Beyond the specifics of Piura, the results yield lessons and a simple transfer protocol applicable to data-limited, semi-arid regions with multi-level water governance. This positioning is consistent with recent subnational diagnostic and screening approaches that formalize indicator-based workflows and emphasize transparent normalization, aggregation, and mapping for policy-oriented prioritization [17,21].
4.1. General Overview of Territorial Water Vulnerability Patterns
The Composite Water Vulnerability Index reveals a marked spatial gradient of water vulnerability across Piura’s eight provinces. Coastal areas such as Piura (0.434) and Sullana (0.445) exhibit lower vulnerability, mainly due to better infrastructure coverage and institutional presence, while highland provinces such as Ayabaca (0.713) and Morropón (0.590) show significantly higher levels, reflecting structural deficits, high poverty, a predominantly rural population, and weaker institutional capacity, together with climatic exposure.
This spatial differentiation is evident by the composite values—e.g., Ayabaca (0.713) and Morropón (0.590) versus Piura (0.434) and Sullana (0.445)—highlighting structural deficits and climatic exposure in highland provinces and stronger infrastructure and institutional presence in coastal provinces. Coupling structural, climatic, and institutional indicators explains the observed provincial gradient (0.434–0.713) better than any single dimension and directly informs territorially tailored water governance priorities.
GIS-based visualizations enhanced the interpretability of results, providing spatial insights that are both analytically robust and actionable for policy design. These maps support the identification of priority areas for investment and governance strengthening, aligning with regional adaptation frameworks and recent academic advances on territorialized water governance [8,15,40,41].
Ultimately, these findings contribute to a renewed understanding of territorial water vulnerability in Piura—one that transcends purely physical determinants and embraces the socio-institutional complexity of the territory. The results call for place-specific actions—institutional strengthening in the highlands and demand-side measures along the coast—consistent with regional water-security frameworks [9,11].
4.2. Comparative Analysis: Governance-Driven vs. Demand-Driven Vulnerability
A marked contrast emerges between the provinces located at the two extremes of the composite water vulnerability index: Ayabaca (0.713) and Piura (0.434). This divergence reflects not only climatic and hydrological conditions but, more fundamentally, distinct socio-institutional realities. Ayabaca is thus a governance-driven vulnerability case, whereas Piura is demand-driven, given the dominance of institutional/structural vs. demand factors in their indicator profiles.
In the highlands, Ayabaca faces pronounced structural deficits, limited water infrastructure, and institutional fragility. Despite its moderate climatic exposure, its elevated vulnerability stems mainly from weak governance capacity, fragmented coordination, and scarce investment in water management mechanisms, thereby constraining its adaptive potential.
Conversely, Piura—the regional capital and economic hub—experiences strong demographic and agricultural water demand. However, greater institutional capacity, broader infrastructure coverage, and active stakeholder engagement mitigate its overall vulnerability, even as structural tensions persist.
This comparison illustrates that territorial water vulnerability in Piura is multidimensional and territorially differentiated. Consistent with prior evidence in Peru [9,11], our results quantify the rural–urban asymmetry: highland provinces such as Ayabaca (0.713) and Morropón (0.590) register higher vulnerability due to service and institutional deficits, whereas coastal provinces such as Piura (0.434) and Sullana (0.445) show lower levels associated with stronger infrastructure and utilities. These disparities are often aggravated by centralized planning [5,9,11,41] and limited inter-institutional coordination [7,40]. The contrast between Ayabaca and Piura underscores that territory-specific governance capacity is as critical as hydrological availability in explaining observed vulnerability patterns, reinforcing the need for equitable, context-sensitive interventions. Ultimately, recognizing such territorial asymmetries is essential for designing equitable and effective policy interventions.
4.3. Integrating Territorial Planning and Governance for Adaptive Water Management
At the regional level, the Plan de Desarrollo Regional Concertado de Piura 2016–2021 (Piura Regional Concerted Development Plan 2016–2021) [42] outlines broad sustainability and infrastructure priorities but overlooks marked inter-provincial differences in vulnerability, limiting its capacity to guide territorially differentiated responses. Incorporating territorial indicators into future planning instruments could help prioritize infrastructure investment, institutional strengthening, and demand management based on localized needs.
At the national level, frameworks such as ANA’s Plan Nacional de Recursos Hídricos (National Water Resources Plan) [12] and CEPLAN’s Plan Estratégico de Desarrollo Nacional al 2050 (National Strategic Development Plan to 2050) [43] promote integrated water management and territorial equity. However, these instruments often lack the sub-regional granularity needed to inform adaptive planning, as shown by the findings of this study.
At the international level, complementary frameworks further reinforce the need for territorialized approaches. The OECD [5] highlights coordination gaps between national and subnational levels in Peru’s water governance, while UN Water [1,42] emphasizes adaptive planning and territorial justice to address unequal water access amid increasing climate variability.
Comparable frameworks in Latin America (e.g., Mexico, Chile, Brazil) demonstrate that integrating structural and institutional asymmetries into WRM assessments enhances policy relevance. The Piura case contributes to these debates, offering empirical evidence to operationalize SDG 6 through subnational, context-sensitive, and equity-oriented methodologies.
Territorial water vulnerability in Piura cannot be explained by hydrology or infrastructure alone; it is strongly conditioned by governance asymmetries and institutional capacity gaps [9,11]. Participatory planning and decentralization are critical to resilience, since infrastructure without local authority and representation rarely delivers lasting impact [43]. Incorporating these territorial indicators into planning would prioritize (i) investment in service reliability and institutional capacity in Ayabaca and Morropón and (ii) demand-side measures in Piura and Sullana, reflecting their distinct drivers of vulnerability.
4.4. Broader Implications and Transferability
The value of our approach lies less in proposing a new conceptual model of water vulnerability and more in providing a transparent and replicable screening protocol for subnational water-vulnerability assessment.
This study’s insights extend beyond the Piura region. The territorial framework is transferable to contexts that exhibit: (i) marked spatial inequality in demand and infrastructure, (ii) multi-level or fragmented water governance, and (iii) high inter-annual hydro-climatic variability. Three cross-regional lessons follow. First, perceived vulnerability often reflects structural and institutional mismatches (service reliability, coordination, transaction costs) as much as physical availability; addressing these bottlenecks can yield near-term gains. Second, normalized subnational indicators (0–1) provide comparability and screening power before detailed basin modeling—useful where empirical weights are unavailable. Third, coupling structural, climatic, and institutional dimensions operationalizes integrated water-governance principles, supporting the prioritization of adaptation investments and social targeting. For transfer, practitioners can select locally available analog indicators, apply equal weights when empirical ones are not feasible, and report uncertainty; the indicator definitions used here provide a template for replication.
4.5. Methodological Limitations and Directions for Future Territorial Research
While the composite index developed in this study provides valuable insights into territorial water vulnerability, several methodological limitations should be acknowledged.
The analysis relies exclusively on secondary data sources which, although official and peer-reviewed, may not capture real-time variability or localized perceptions of water availability, governance performance, and climatic exposure. In particular, the institutional-capacity dimension is complex and context-dependent, with potential under- or over-estimation depending on the quality, consistency, and spatial relevance of the proxies employed.
Another limitation is the absence of direct, province-level indicators of water resources, water-supply infrastructure performance, and sectoral demand. As a result, the structural dimension relies on proxies such as population density and the share of rural population, which capture pressure and service-delivery constraints rather than physical water availability itself. These proxies should therefore be interpreted jointly with climatic-exposure and institutional indicators when assessing territorial water vulnerability.
In addition, although normalization and weighting procedures followed established methodologies [15,40], the resulting composite index values are relatively close across provinces (0.434–0.713). This narrow range may limit the discriminatory power of the index and highlights the need for sensitivity analyses or complementary qualitative validation, especially when results are used to prioritize interventions in contexts where small differences may not be policy-relevant.
Two additional methodological caveats deserve emphasis:
- Min–max normalization sensitivity: the min–max normalization applied here is sensitive to the observed value range and to extreme values: when provincial ranges are narrow or when outliers are present, rescaling may amplify small differences or, conversely, compress meaningful contrasts. For selected indicators, future applications could therefore consider defining normalization thresholds using empirical or expert-based benchmarks (e.g., policy targets or literature-based critical values) rather than relying exclusively on the sample minimum and maximum, to strengthen interpretability and comparability across contexts.
- Implications of equal weighting: In the baseline specification, indicators are equally weighted within each dimension, and the structural, climatic, and institutional dimension scores are combined using equal weights (1/3 each). Although seven indicators describe the socio-institutional system (structural + institutional) and three capture climatic exposure, indicator counts do not mechanically increase the contribution of socio-institutional factors under dimension-level aggregation; they provide finer within-dimension resolution. Since weighting remains a normative choice in the absence of stakeholder-derived or data-driven weights, we tested robustness by recomputing the index under three alternative dimension-level schemes (0.50/0.25/0.25, doubling each dimension in turn). Across all schemes, Ayabaca and Morropón remained in the high-vulnerability group, Piura and Sullana consistently fell in the lower-vulnerability group, and the remaining provinces showed only minor shifts in their relative ordering, suggesting that the main spatial pattern is robust to the tested weighting schemes.
Finally, the index does not incorporate participatory or field-based perspectives. Integrating local stakeholders—particularly from rural and highland areas—could strengthen the explanatory depth of the assessment, improve the legitimacy of indicator selection and scoring, and support context-sensitive weighting exercises. Future research could extend this framework to other Peruvian regions to enable comparative assessments and broader policy recommendations; longitudinal application could also support monitoring of governance performance and the evaluation of policy interventions over time. Moreover, incorporating qualitative dimensions such as perceived justice, governance trust, and institutional responsiveness would align with international calls for innovation in adaptive and equitable water management [1,16].
A further limitation is that the original multidimensional framework adapted in this study was initially formulated in a doctoral thesis [15] with limited diffusion in the peer-reviewed literature; continued application and refinement through comparative studies and participatory weighting exercises would help further validate the approach.
5. Conclusions and Contributions to Water Resources Management (WRM)
This study contributes to the evolving field of Water Resources Management (WRM) by applying a territorial methodology that integrates structural, climatic, and institutional dimensions of territorial water vulnerability. Focused on the Piura region, the analysis confirms that vulnerability emerges from the combined effect of multi-dimensional vulnerabilities that vary significantly across provinces. The results validate the initial hypothesis that water vulnerability in Piura is driven less by physical availability than by territorial and institutional asymmetries.
The findings reveal that coastal provinces such as Piura and Sullana—despite facing greater water demand and exposure to climate extremes—benefit from stronger infrastructure and institutional presence, which help mitigate overall vulnerability. In contrast, highland provinces such as Ayabaca and Morropón experience heightened water vulnerability due to persistent poverty, limited access to basic services, and weak governance frameworks. These contrasts highlight the need to move beyond uniform planning and to adopt place-based strategies that reflect local realities.
Methodologically, this study offers a replicable and adaptable framework for territorial water governance, grounded in spatial analysis and supported by geospatial tools. Building on Escribano’s original application, which focuses on national-level scenario analysis and future demand standards, the present work adapts and operationalizes this multidimensional framework perspective as a static, subnational index that explicitly links water vulnerability to territorial governance asymmetries. By integrating normalized indicators into a composite index, it supports the identification of critical zones and the prioritization of investments, and, if periodically updated, can inform the monitoring of change over time. To our knowledge, this is the first application of Escribano’s multidimensional model in a Peruvian context—adapted to a region characterized by hydro-climatic variability and institutional fragmentation. The main contribution of this work lies in applying the model to Piura and in extending its analytical scope by explicitly linking territorial disparities with governance asymmetries. This methodological contribution enhances the transferability of the framework to other semi-arid and institutionally fragmented regions, opening new avenues for comparative territorial research.
The results underscore the need for stronger integration between territorial diagnostics and cross-sector governance frameworks. Strengthening local institutions, improving coordination mechanisms, and promoting equitable investment are essential to reducing water vulnerability in semi-arid regions like Piura. These priorities align with international agendas that advocate decentralization, territorial justice, and climate-adaptive governance under Sustainable Development Goal 6 (SDG 6).
In this sense, the territorial approach developed here functions not only as a diagnostic tool but also as a practical extension of IWRM adapted to local governance systems. By revealing intra-regional disparities and structural asymmetries, this model provides actionable insights for planning and investment. It contributes to a more equitable, climate-resilient, and context-sensitive implementation of WRM strategies in Peru and similar settings.
In conclusion, addressing territorial water vulnerability requires more than expanding infrastructure or increasing supply; it demands a rethinking of governance, planning, and institutional design through a territorial lens. While grounded in Piura, the approach and lessons provide a practical screening tool for policy and planning in other data-limited, semi-arid regions characterized by multi-level governance asymmetries.
Supplementary Materials
The following supporting information can be downloaded at: https://www.mdpi.com/article/10.3390/w18030362/s1. Supplementary Material consists of an Excel spreadsheet containing: Normalized indicators (0–1), the three di-mension indices (Sp, Cp, Ip), and the composite index (CIp).
Author Contributions
Conceptualization, E.A.S.R. Methodology, E.A.S.R.; Formal analysis, E.A.S.R.; Data curation, E.A.S.R. and S.V.B.; Writing—original draft preparation, E.A.S.R.; Writing—review and editing, S.V.B.; Formatting and reference management, S.V.B.; Supervision, L.V.C.; Visualization, E.A.S.R. and S.V.B. All authors have read and agreed to the published version of the manuscript.
Funding
This research received no external funding.
Data Availability Statement
The input datasets used to construct the indicators are openly available from the official portals of the cited institutions: OECD (https://www.oecd.org/), UNOPS (https://www.unops.org/), ANA—Autoridad Nacional del Agua (https://www.gob.pe/ana), UNDP (HDR)—United Nations Development Programme (Human Development Reports) (https://hdr.undp.org/), INEI—Instituto Nacional de Estadística e Informática (https://www.inei.gob.pe/), and SENAMHI—Servicio Nacional de Meteorología e Hidrología del Perú (https://www.senamhi.gob.pe/). The processed data generated in this study—normalized indicators (0–1), the three dimension indices (Sp, Cp, Ip), and the composite index (CIp)—are provided in the Supplementary Material. Further information is available from the corresponding author upon reasonable request.
Acknowledgments
The research was carried out within the framework of the PhD Program in Sustainability at the Universitat Politècnica de Catalunya (UPC). The authors express their gratitude to Brayan Eli Guerrero Huamán (CIP 357651), Civil Engineer, for his technical support in the generation of geospatial maps using ArcGIS Pro version 3.0.2. During the preparation of this manuscript/study, the authors used ChatGPT (OpenAI; model: GPT-5 Thinking; web interface; accessed June–November 2025) for limited, non-analytical editorial assistance (consistency checks and minor sentence-level polishing in non-substantive passages). The authors have reviewed and edited the output and take full responsibility for the content of this publication.
Conflicts of Interest
The authors declare no conflicts of interest.
References
- UNESCO World Water Assessment. The United Nations World Water Development Report 2024: Water for Prosperity and Peace; UNESCO World Water Assessment: Perugia, Italy, 2024; 153p, Available online: https://unesdoc.unesco.org/ark:/48223/pf0000388948 (accessed on 17 July 2025).
- Morante-Carballo, F.; Montalván-Burbano, N.; Quiñonez-Barzola, X.; Jaya-Montalvo, M.; Carrión-Mero, P. What Do We Know About Water Scarcity in Semi-Arid Zones? A Global Analysis and Research Trends. Water 2022, 14, 2685. [Google Scholar] [CrossRef]
- UNESCO World Water Assessment. The United Nations World Water Development Report 2021: Valuing Water; Water Politics; UNESCO World Water Assessment: Perugia, Italy, 2021; 206p, Available online: https://unesdoc.unesco.org/ark:/48223/pf0000375724 (accessed on 17 July 2025).
- Garrick, D.; Iseman, T.; Gilson, G.; Brozovic, N.; O’Donnell, E.; Matthews, N.; Miralles-Wilhelm, F.; Wight, C.; Young, W. Scalable Solutions to Freshwater Scarcity: Advancing Theories of Change to Incentivise Sustainable Water Use. Water Secur. 2020, 9, 100055. [Google Scholar] [CrossRef]
- OECD. Water Governance in Peru; OECD Studies on Water; OECD: Paris, France, 2021. [Google Scholar]
- Bezerra, M.O.; Vollmer, D.; Acero, N.; Marques, M.C.; Restrepo, D.; Mendoza, E.; Coutinho, B.; Encomenderos, I.; Zuluaga, L.; Rodríguez, O.; et al. Operationalizing Integrated Water Resource Management in Latin America: Insights from Application of the Freshwater Health Index. Environ. Manag. 2022, 69, 815–834. [Google Scholar] [CrossRef] [PubMed]
- Tinoco, C.; Julio, N.; Meirelles, B.; Pineda, R.; Figueroa, R.; Urrutia, R.; Parra, Ó. Water Resources Management in Mexico, Chile and Brazil: Comparative Analysis of Their Progress on SDG 6.5.1 and the Role of Governance. Sustainability 2022, 14, 5814. [Google Scholar] [CrossRef]
- Angulo, E.C.; Pereira Filho, A.J. Extreme Droughts and Their Relationship with the Interdecadal Pacific Oscillation in the Peruvian Altiplano Region over the Last 100 Years. Atmosphere 2023, 14, 1233. [Google Scholar] [CrossRef]
- Paerregaard, K.; Ullberg, S.B.; Brandshaug, M. Smooth Flows? Hydrosocial Communities, Water Governance and Infrastructural Discord in Peru’s Southern Highlands. Water Int. 2020, 45, 169–188. [Google Scholar] [CrossRef]
- OECD Toolkit for Water Policies and Governance. Toolkit for Water Policies and Governance; OECD Publishing: Paris, France, 2021. [Google Scholar] [CrossRef]
- Urteaga-Crovetto, P. Between Water Abundance and Scarcity: Discourses, Biofuels, and Power in Piura, Peru. Antipode 2016, 48, 1059–1079. [Google Scholar] [CrossRef]
- Autoridad Nacional del Agua (ANA). Plan Nacional de Recursos Hídricos Del Perú Memoria 2013. Available online: https://es.scribd.com/document/383682662/Plan-Nacional-de-Recursos-Hidricos (accessed on 17 July 2025).
- PUCP La Gestión Responsable Del Agua En Perú: Un Desafío Urgente Ante La Crisis Hídrica|Instituto de La Naturaleza, Tierra y Energía (INTE-PUCP). Available online: https://inte.pucp.edu.pe/noticias-y-eventos/noticias/la-gestion-responsable-del-agua-en-peru-un-desafio-urgente-ante-la-crisis-hidrica/ (accessed on 17 July 2025).
- Ochoa, R.F.L.; Maurtua, D.M.P.; Velarde, E.A.C. Modelación de La Disponibilidad Hídrica Del Río Piura, Perú, Considerando La Incidencia Del Cambio Climático. Rev. Investig. Altoandinas—J. High Andean Res. 2019, 21, 182–193. [Google Scholar] [CrossRef]
- Escribano Rodriguez De Robles, B. Metodología de Análisis En El Tiempo Para Evaluar La Escasez de Agua Dulce En Función de La Oferta y de La Demanda. Caso de Estudio: Los Países de La Región Del Golfo de Guinea; Universitat Politècnica de Catalunya, Cátedra UNESCO de Sostenibilidad: Barcelona, Spain, 2010. [Google Scholar] [CrossRef]
- UNESCO. IHP-IX: Strategic Plan of the Intergovernmental Hydrological Programme: Science for a Water Secure World in a Changing Environment. 2022–2029. Available online: https://unesdoc.unesco.org/ark:/48223/pf0000381318.locale=es (accessed on 26 July 2025).
- Sahana, V.; Mondal, A.; Sreekumar, P. Drought Vulnerability and Risk Assessment in India: Sensitivity Analysis and Comparison of Aggregation Techniques. J. Environ. Manag. 2021, 299, 113689. [Google Scholar] [CrossRef] [PubMed]
- Khan, A.; Gong, Z.; Shah, A.A.; Haq, M. A Multi-Criteria Decision-Making Approach to Vulnerability Assessment of Rural Flooding in Khyber Pakhtunkhwa Province, Pakistan. Environ. Sci. Pollut. Res. 2023, 30, 56786–56801. [Google Scholar] [CrossRef] [PubMed]
- Thirumurthy, S.; Jayanthi, M.; Samynathan, M.; Duraisamy, M.; Kabiraj, S.; Anbazhahan, N. Multi-Criteria Coastal Environmental Vulnerability Assessment Using Analytic Hierarchy Process Based Uncertainty Analysis Integrated into GIS. J. Environ. Manag. 2022, 313, 114941. [Google Scholar] [CrossRef] [PubMed]
- Nauditt, A.; Stahl, K.; Rodríguez, E.; Birkel, C.; Formiga-Johnsson, R.M.; Kallio, M.; Ribbe, L.; Baez-Villanueva, O.M.; Thurner, J.; Hann, H. Evaluating Tropical Drought Risk by Combining Open Access Gridded Vulnerability and Hazard Data Products. Sci. Total Environ. 2022, 822, 153493. [Google Scholar] [CrossRef] [PubMed]
- Malgwi, M.B.; Fuchs, S.; Keiler, M. A Generic Physical Vulnerability Model for Floods: Review and Concept for Data-Scarce Regions. Nat. Hazards Earth Syst. Sci. 2020, 20, 2067–2090. [Google Scholar] [CrossRef]
- Zhao, C.; Feng, Y.; Liu, W.; Wang, H.; Wang, T.; Liu, Y.; Sun, F. Provincial-Scale Assessment of Vulnerability and Resilience to Drought in China. Sci. Total Environ. 2024, 934, 173199. [Google Scholar] [CrossRef] [PubMed]
- Pattinson, N.B.; Taylor, J.; Dickens, C.W.S.; Graham, P.M. Digital Innovation in Citizen Science to Enhance Water Quality Monitoring in Developing Countries; IWMI: Colombo, Sri Lanka, 2023. [Google Scholar] [CrossRef]
- OECD. The Circular Water Economy in Latin America. Available online: https://www.oecd.org/en/publications/the-circular-water-economy-in-latin-america_a0508572-en/full-report.html (accessed on 26 July 2025).
- UNOPS. Combating Water Scarcity in Peru|UNOPS. Available online: https://www.unops.org/news-and-stories/stories/combating-water-scarcity-in-peru (accessed on 29 July 2025).
- Llanos, M.d.P.S.; Higuera, M.J.P. Planificación y Gestión Integral Del Recurso Hídrico En La Región de Ancash. Zenodo 2025, 5, 1–10. [Google Scholar] [CrossRef]
- United Nations Development Programme Human Development Report. 2025. Available online: https://hdr.undp.org/content/human-development-report-2025 (accessed on 29 July 2025).
- INEI. Producto Bruto Interno Por Departamentos 2007–2020; INEI: Lima, Peru, 2021.
- INEI. Perú: Evolución de La Pobreza Monetaria, 2014–2023—Informes y Publicaciones; INEI: Lima, Peru, 2024.
- INEI. Mapa de Pobreza Monetaria Provincial y Distrital 2018; INEI: Lima, Peru, 2020.
- INEI. Resultados Definitivos 2017; INEI: Lima, Peru, 2018.
- INEI. Perú: Enfermedades No Transmisibles y Transmisibles, 2019; INEI: Lima, Peru, 2020.
- SENAMHI. Clima—Eventos Extremos. Available online: https://www.senamhi.gob.pe/?p=eventos-extremos&utm (accessed on 6 September 2025).
- SENAMHI. Descarga de Datos. Available online: https://www.senamhi.gob.pe/site/descarga-datos/?utm (accessed on 6 October 2025).
- IPCC. Climate Change 2022: Impacts, Adaptation and Vulnerability. Available online: https://www.ipcc.ch/report/ar6/wg2/ (accessed on 6 September 2025).
- Drought.gov Global Precipitation Climatology Centre (GPCC) Standardized Precipitation Index (SPI). Available online: https://www.drought.gov/data-maps-tools/global-precipitation-climatology-centre-gpcc-standardized-precipitation-index-spi?utm (accessed on 6 September 2025).
- GOB. PE Solicitar Acceso a la Información Pública. Proyecto Especial Chiura Piura (PECHP). Available online: https://www.gob.pe/20399-solicitar-acceso-a-la-informacion-publica?child=83162 (accessed on 6 September 2025).
- IPE. Piura: Continuidad En El Acceso a Agua Potable Llega a Nueve Horas al Día. Available online: https://ipe.org.pe/piura-continuidad-en-el-acceso-a-agua-potable-llega-a-nueve-horas-al-dia/?utm (accessed on 6 October 2025).
- ANA Avance. Logros y Actualización Del Plan de Gestión de Los Recursos Hídricos de La Cuenca Chira Piura; ANA Avance: San Antonio, TX, USA, 2024. [Google Scholar]
- Salmoral, G.; Zegarra, E.; Vázquez-Rowe, I.; González, F.; del Castillo, L.; Saravia, G.R.; Graves, A.; Rey, D.; Knox, J.W. Water-Related Challenges in Nexus Governance for Sustainable Development: Insights from the City of Arequipa, Peru. Sci. Total Environ. 2020, 747, 141114. [Google Scholar] [CrossRef] [PubMed]
- Fagundes, T.S.; Marques, R.C.; Malheiros, T.F. A Comprehensive Framework for Water Affordability Analysis. Water Resour. Manag. 2025, 39, 2527–2549. [Google Scholar] [CrossRef]
- UNESCO. World Water Assessment the United Nations World Water Development Report 2023: Partnerships and Cooperation for Water. Available online: https://unesdoc.unesco.org/ark:/48223/pf0000384655 (accessed on 14 August 2025).
- El Gobierno Regional de Piura. Plan de Desarrollo Regional Concertado Piura 2016–2021; El Gobierno Regional de Piura: Piura, Peru, 2017.


Disclaimer/Publisher’s Note: The statements, opinions and data contained in all publications are solely those of the individual author(s) and contributor(s) and not of MDPI and/or the editor(s). MDPI and/or the editor(s) disclaim responsibility for any injury to people or property resulting from any ideas, methods, instructions or products referred to in the content. |
© 2026 by the authors. Licensee MDPI, Basel, Switzerland. This article is an open access article distributed under the terms and conditions of the Creative Commons Attribution (CC BY) license.