Abstract
This study investigates the dynamics of carbon flux at the water–air interface during the ecological restoration of eutrophic water bodies. A controlled simulation of the eutrophic aquatic environment was carried out. A series of experiments was established, centered on submerged aquatic plants as key agents for carbon sequestration and enhancement of carbon sink capacity, supplemented by biological manipulation techniques aimed at pollution reduction and algal control. Results show that restoration systems based on submerged plants significantly enhance carbon sequestration, whereas systems relying solely on filter-feeding fish tend to increase the carbon emission burden. The submerged plant-only treatment (HV) exhibited the highest carbon absorption capacity (−72.53 mg·m−2·h−1), followed by submerged plant + fish + snail (HSXB) and submerged plant + fish (HSX) treatments. CH4 emissions were initially higher in the combined biological treatments but were eventually surpassed by the control group as algal cell density increased. Carbon sink potential and CH4 emissions were strongly correlated with algal cell density and chlorophyll a concentration. While combination treatments (HSX and HSXB) effectively suppressed algal proliferation, the submerged plant-only treatment demonstrated superior nutrient removal efficiency. The findings provide theoretical support for ecologically based management strategies that simultaneously address eutrophication control and carbon sequestration in freshwater ecosystems, contributing to both water quality improvement and climate change mitigation.
1. Introduction
Global warming has emerged as a global concern. In September 2020, China officially proposed the “Dual Carbon Goal”, aiming to achieve peak carbon emissions by 2030 and carbon neutrality before 2060 [1]. Studies have shown that freshwater ecosystems play a crucial role in inland carbon emissions [2]. Research indicated that annual carbon emissions from freshwater account for approximately 31% of global annual fossil fuel emissions [3]. In recent years, water ecological restoration projects, particularly those focusing on submerged vegetation restoration, have been extensively implemented across China. These efforts have significantly enhanced the carbon sequestration capacity of inland waters and prolonged the carbon cycling period within these ecosystems [4]. Investigating the carbon storage function of freshwater ecosystems and its synergistic management with eutrophication holds substantial significance for addressing climate change and environmental sustainability.
According to Meyer et al. (2020) [5], the total area of global inland waters is approximately 2.7 × 10⁶ km2. Research by Mendonça et al. (2017) [6] shows that the annual organic carbon burial in these inland waters ranges from 6 × 10¹³ to 25 × 1013 kg. This enormous organic carbon burial highlights the potential significance of inland waters in maintaining carbon balance and mitigating climate change. Lakes receive carbon inputs from rivers, some of which are fixed in sediments while the rest is released into the atmosphere as CH4 and CO2. Therefore, lakes are often regarded as the sources of CO2 rather than the sinks [7]. Raymond et al. (2013) [8] reported that lakes and reservoirs release approximately 0.32 Pg of carbon annually into the atmosphere, with freshwater lakes accounting for up to 73% of this flux. Moreover, lakes are also the major contributors to CH4 emissions, releasing an estimated 159 Tg CH4 per year [9]. Among inland water systems, lake ecosystems exhibit greater complexity compared to river ecosystems, characterized by more pronounced nutrient accumulation (e.g., nitrogen and phosphorus), which frequently leads to severe eutrophication and algal blooms. These processes facilitate the fixation or transformation of more carbon elements.
Currently, numerous studies indicate that carbon emissions from water bodies are influenced by their nutrient status. Some researchers believe that in eutrophic waters, the accumulation of nutrients like nitrogen and phosphorus provides favorable conditions for algal proliferation, thereby enhancing primary productivity levels. This process enables primary producers to absorb substantial amounts of CO2, achieving carbon fixation, which may potentially transform eutrophic waters into CO2 sinks [10,11,12]. Conversely, other research contends that eutrophication primarily promotes the excessive growth of specific phytoplankton species, disrupting aquatic ecosystem health and biodiversity. As a result, the carbon sequestration capacity of originally healthy ecosystems may decline or even vanish entirely [13,14]. For instance, in Lake Taihu, one of China’s most severely eutrophic lakes, the increased primary productivity has not significantly inhibited CO2 emissions [15]. Additionally, it was reported that long-term eutrophication leads to higher CH4 emissions, a greenhouse gas with a warming potential 28 times greater than CO2 [16]. Zhou et al. (2020) [17] found that eutrophic shallow lakes release 48.8% more CH4 than non-eutrophic shallow lakes. Beaulieu et al. (2019) [18] discovered that eutrophic waters emit CH4 at an annual rate of 1.7 × 10¹²–2.6 × 10¹² kg. Notably, when the total primary productivity carbon content in lakes exceeds 25 g/(m2·a), water bodies convert from carbon sinks to carbon sources, causing previously fixed CO2 to diffuse back to the atmosphere [19]. These findings imply that in eutrophic environments, the proliferation of harmful algae alone is insufficient to effectively bury or fix carbon.
The factors influencing carbon emissions in eutrophic waters can be categorized into direct and indirect factors. Direct factors are non-biological factors, including dissolved oxygen concentration, organic matter content, and nutrient concentration [20]. Under anoxic conditions, the presence of sufficient organic carbon in sediments promotes CH4 production, facilitating bubble formation and increasing CH4 flux [21]. Therefore, low dissolved oxygen conditions generally enhance CH4 emissions. Additionally, as oxygen content decreases, CO2 emissions may increase due to the mineralization of organic carbon during oxygen consumption processes [22]. Settled organic substrates provide energy for heterotrophic organism growth, accelerating organic matter decomposition and promoting greenhouse gas production and emission [23]. Indirect factors affecting carbon emissions in eutrophic waters are biological factors, including primary producers and harmful algal blooms (HABs). The unstable growth of HABs precisely meets the microbial stoichiometric requirements, promoting the synergistic decomposition of different organic matters in sediments, and thereby increasing CO2 and CH4 emissions [24]. Dense foam formed by HABs hinders water re-oxygenation, creating hypoxic or anaerobic conditions beneath the foam layer [25]. Changes in primary producers affect CO2 and CH4 emissions in freshwater ecosystems. Submerged plants create aerobic environments that effectively reduce CH4 emissions by enhancing CH4 oxidation [26]. Additionally, abundant submerged plants significantly reduce CH4 ebullition flux, while the loss of macrophytes in eutrophic waters alters carbon greenhouse gas fluxes. Therefore, reconstructing aquatic plant communities represents a critical approach for aquatic ecological restoration.
Pal et al. (2016, 2017) [27,28] conducted a comprehensive study on the carbon sequestration capacity of various aquatic plants and found that aquatic plants can fix up to 1.17 × 10¹⁴ kg of carbon annually. Numerous studies have reported the exceptional carbon sequestration capabilities of aquatic vegetation in lake ecological restoration projects. For instance, research on the Shiyang River Basin (SRB) demonstrated that the ecosystem carbon storage in SRB changed significantly before and after the ecological project implementation, with a decrease of 5.71 Tg in 1986–2000 and an increase of 14.11 Tg in 2000–2016. The proportion of carbon sink enhancement areas was only 7.46% in 1986–2000, which increased to 15.04% in 2000–2016, indicating that the ecological restoration effect of the watershed was obvious as a result of the ecological management [29]. Studies of Poyang Lake revealed that areas dominated by submerged plant species of the genus Hydrilla and Vallisneria, exhibit a notable reduction in CO2 release flux at the water-air interface [30]. Consequently, submerged plant communities represent a substantial carbon pool within aquatic ecosystems. The aquatic ecological restoration processes centered on submerged plants not only reduce nutrient concentrations in water bodies and mitigate eutrophication but also effectively bury and fix carbon elements.
Moreover, the complexity and diversity of food chains in aquatic ecosystems play a significant role in influencing carbon emissions from water bodies [31]. In lake ecosystems, carbon flows from primary producers, including phytoplankton and aquatic plants, to primary consumers such as protozoa and zooplankton, and further to higher trophic levels like benthic animals and fish. Microorganisms act as decomposers throughout the carbon cycle, ultimately returning some carbon to the atmosphere [32]. Yang et al. (2008) [33] reported that benthic animals, such as chironomid larvae, can partially inhibit CH4 emissions from sediments through their disturbance activities, whereas tubificid worms’ disturbance leads to increased system carbon consumption, converting more carbon into CO2 and CH4 for release.
Under the dual-carbon framework, the coordination of pollution reduction with carbon emission mitigation and carbon sequestration holds significant importance [34]. This study focuses on submerged plants as the primary agents for enhancing carbon sequestration and sink capacity, integrating biological manipulation techniques to reduce pollution and control algal blooms. The research investigates changes in carbon flux and identifies environmentally friendly, cost-effective strategies that simultaneously achieve carbon sequestration and sink enhancement while mitigating pollution.
2. Methodology
2.1. Experimental Materials
The primary material utilized in this study was the common freshwater submerged plant Hydrilla verticillata, which was procured from the Gaochun Aquaculture Base in Nanjing, China. Upon acquisition, the roots and stems of the plants were thoroughly washed with clean water to remove surface silt and algae. Small organisms attached to the plants were carefully eliminated. The cleaned submerged plants were then placed in buckets identical to the experimental apparatus for pre-cultivation. Pre-cultivation was conducted using tap water that had been aerated for 24 h to eliminate residual chlorine.
The fish species used in this study were silver carp (Hypophthalmichthys molitrix), bighead carp (Aristichthys nobilis), and Xenocypris (Xenocypris microlepis). The silver carp and bighead carp, both one-year-old juveniles, were procured from a specialized aquaculture farm located in Gaochun District, Nanjing, China. The Xenocypris individuals were obtained from a national-level breeding farm in Liling City, China. Prior to the experiment, fish of uniform size and good health were carefully selected as experimental subjects. To ensure the reliability of the experimental results, the fish were acclimated in clean water and fasting was implemented prior to the experiment to minimize the potential influence of intestinal residues on the outcomes. The specifications of the selected experimental fish were as follows: silver carp (weight 26 ± 2.0 g, length 13.8 ± 2.0 cm); bighead carp (weight 21.5 ± 1.0 g, length 11.8 ± 2.0 cm); Xenocypris individuals (length 13.5 ± 1.0 cm, weight 16.5 ± 1.5 g).
Bellamya aeruginosa snails were purchased from a market in Gaochun District, Nanjing, China. The attachments on the surface of the snails were brushed and rinsed repeatedly with clean water until free of contaminants. Then, these snails were placed in clean water for cultivation without feeding.
Microcystis aeruginosa was selected as a model organism to simulate the algal bloom process in eutrophic water bodies. The M. aeruginosa was obtained from the Institute of Hydrobiology, Chinese Academy of Sciences in Wuhan, China, and subsequently cultured using BG11 medium for population expansion. Prior to the experimental setup, the algal concentration was adjusted according to the specified requirements to ensure consistency and accuracy of experimental conditions. The culture was maintained under controlled conditions of 3000 lx light intensity and 25 °C temperature in a light incubator. Throughout the cultivation period, continuous monitoring of algal growth was conducted, and appropriate measures such as periodic shaking and oxygenation were implemented to ensure the success of the experiment and the reliability of the resulting data.
2.2. Experimental Design
A 1 m3 white polyethylene water tank was utilized. The 1 m3 micro-habitat components included quartz sand and clay as substrates, aerated and dechlorinated tap water, and supplemented nitrogen and phosphorus nutrients. The food web structure consisted of producers such as M. aeruginosa and submerged aquatic plants; consumers, including silver carp, bighead carp, X. microlepis, and B. aeruqinosa; and microorganisms functioning as decomposers. Organic materials such as decaying submerged plant leaves, animal excrement, and biological remains gradually accumulated on the sediment layer at the bottom. Throughout the experimental period, gas exchange between the system and the external atmosphere was permitted.
The experimental period was 30 days. The experimental apparatus consisted of 15 white polyethylene buckets with a volume of 1 m3, a height of 120 cm and a diameter of 100 cm. The buckets were placed in an outdoor environment. A transparent rain shield was installed above each bucket to protect the experimental setup from environmental disturbances such as rainfall. The ambient temperature during the experiment averaged 29 °C (±3 °C). To simulate natural aquatic conditions, a layer of 70–110 mesh quartz sand was first placed at the bottom of each bucket, followed by a thin layer of clay to mimic the sediment found at the bottom of natural water bodies. The water used in the experiment was tap water that had undergone sun exposure and aeration to remove chlorine. After filling the buckets, the water was left to naturally settle for 15 days to allow the simulated sediment to fully stabilize. The concentration of M. aeruginosa in each tank was maintained at 1.2 × 10⁶ cells/L, and nutrients in the form of sodium nitrate (NaNO3) and potassium hydrogen phosphate (K2HPO4) were added to induce eutrophication, 2 g and 1.6 g, respectively. Subsequently, different combinations of organisms were introduced into the respective buckets for further observation.
Five experimental groups were established, each consisting of three parallel experiments. Group 1–3 served as the control group (without fish, plants, or benthic animals, abbreviated as CG); group 4–6 constituted the silver carp and bighead carp + X. microlepis group (comprising 6 silver carps, 4 bighead carps, and 10 X. microlepis individuals, abbreviated as SX); group 7–9 represented the “submerged plant group” (1200 g H. verticillata, abbreviated as HV); group 10–12 formed the “fish + submerged plant group” (including 6 silver carp, 4 bighead carp, 10 Xenocypris individuals, 1200 g H. verticillata, abbreviated as HSX); and group 13–15 were the “submerged plant + fish + snail group” (6 silver carp, 4 bighead carp, 10 Xenocypris individuals, 250 g snails (medium-sized, setting 16 to 17 individuals), 1200 g H. verticillata, abbreviated as HSXB). Water quality nutrients and algal cell density were measured on days 1, 5, 10, 15, 20, 25, and 30 following the initiation of the experiment. Total nitrogen (TN) was determined by alkaline potassium persulfate digestion followed by ultraviolet spectrophotometry (HJ 636-2012) [35]; ammonia nitrogen (NH4+-N) was analyzed using Nessler’s reagent spectrophotometry (HJ 535-2009) [36]; nitrate nitrogen (NO3−-N) was measured by ultraviolet spectrophotometry (HJ/T 346-2007) [37]; total phosphorus (TP) was quantified using the ammonium molybdate spectrophotometric method (GB 11893-89) [38]; chlorophyll-a concentration was determined by spectrophotometry (HJ 897-2017) [39]; and algal cell density was assessed by combining spectrophotometry with microscopic hemocytometer counting method. In addition, carbon flux at the water–gas interface was determined using the static floating chamber method on days 1, 15, and 30 of the experiment.
3. Results and Discussion
3.1. Research on CO2 and CH4 Flux at the Water-Air Interface
3.1.1. CO2 Flux
Figure 1 illustrates the variations in CO2 flux at the water-air interface across each experimental group. Negative values indicate the absorption of CO2 from the atmosphere at the water-air interface, while positive values indicate the release of CO2. Figure 1a shows the changes in CO2 flux for each group throughout the first day of the experiment. All experimental groups exhibited CO2 absorption behavior during most time periods of the day, demonstrating significant carbon sequestration capacity at 12:00 and 18:00. The HV group had the strongest carbon absorption capacity among these groups, with carbon fluxes of −68.49 and −59.63 mg·m−2·h−1 at both 12:00 and 18:00. The HSX group and HSXB group also demonstrated strong carbon absorption capabilities. However, at 6:00 am, all groups functioned as carbon sources and released CO2. Notably, the SX group displayed the strongest carbon emission capacity, with a carbon flux of 12.33 mg·m−2·h−1. Figure 1b depicts the CO2 flux dynamics on the 15th. At this stage, most experimental groups remained in a carbon sink state throughout the day, except for the SX group, which released CO2 at 6:00, with a carbon flux of 6.80 mg·m−2·h−1. This group also showed the lowest carbon absorption capacity during the remaining time periods. In contrast, the three groups with submerged plants continued to demonstrate robust carbon absorption performance during the two daylight periods. Specifically, the HSX group achieved its maximum carbon absorption rate at 18:00, reaching −22.83 mg·m−2·h−1 at 18:00. During the nighttime period, the carbon absorption of the HSX group and HSXB group, which were under biological manipulation, decreased significantly. The carbon absorption of the HV group remained relatively stable during the first three observation periods and only declined notably at 6:00, reaching −11.95 mg·m−2·h−1. The carbon flux of the control group exhibited a gradual downward trend throughout the day, with its carbon absorption level being lower than that of the three groups incorporating submerged plants but higher than that of the SX group. Figure 1c illustrates the variations in CO2 flux among the experimental groups on the 30th day of the experiment. In the later stages of the experiment, the control group functioned as a continuous carbon sink throughout the day, achieving a peak carbon absorption rate of −14.61 mg·m−2·h−1 at 18:00. The silver carp and bighead carp group showed poor stability in carbon flux during this phase. Specifically, CO2 was released at 12:00 and 6:00, with flux values of 1.40 and 7.56 mg·m−2·h−1, respectively, while carbon sinks were observed at 18:00 and 24:00, with fluxes of −2.75 and −2.02 mg·m−2·h−1, respectively. HV group maintained a consistent carbon sink throughout the observation period, with maximum carbon absorption occurring at 12:00 (−35.76 mg·m−2·h−1). Both the HSX group and HSXB group demonstrated sustained carbon sink behavior across the entire experimental period. The carbon fluxes measured on the 1st, 15th, and 30th days were summed cumulatively to calculate the total CO2 flux, as illustrated in Figure 1d. On the first day of the experiment, the cumulative carbon absorption in the groups containing submerged plants was significantly higher than that observed in the control group and the SX group. During the middle and later stages of the experiment, the carbon absorption capacity of these three groups decreased slightly but remained greater than that of the other two groups. At the conclusion of the experiment, the order of carbon absorption capacity among the three plant-containing groups was as follows: HV group > HSXB group > HSX group. The SX group exhibited the lowest carbon absorption capacity, with a gradual decline over time, ultimately acting as a carbon source by releasing CO2 at the end of the experiment. In contrast, the carbon absorption of the control group increased gradually and remained relatively stable during the middle and later stages, showing minimal variation.

Figure 1.
(a–c) depict the changes in CO2 fluxes on the first, fifteenth, and thirtieth days for each experimental group, respectively, and (d) is the cumulative CO2 flux on the thirtieth day for each experimental group. (In the figure, the control group is abbreviated as CG, H. verticillatum group is abbreviated as HV, silver carp, bighead carp, X. microlepis group abbreviated as SX, HV + silver carp, bighead carp, X. microlepis group is abbreviated as HSX, HV + silver carp, bighead carp, X. microlepis, B. aeruginosa group is abbreviated as HSXB).
In the control group, the photosynthesis of M. aeruginosa exhibits a certain degree of CO2 fixation capacity, and the amount of CO2 absorbed increases in the later stages as algal cell density rises. Research has shown that cyanobacterial cells have a high affinity for CO2 during photosynthesis [40], and under high-density conditions, they consume substantial amounts of dissolved CO2 in aquatic environments [41]. In the SX group during the later experimental phase, the reduction in algal cell density led to a decrease in primary producers available for CO2 fixation. Additionally, fish excretion and physical disturbance caused by silver carp and bighead carp accelerated the carbon cycle within the water column, resulting in an elevated carbon load in the system [42] and subsequent CO2 release into the atmosphere. The three groups incorporating submerged plants at the early stage exhibited higher carbon sequestration capacity due to the increased biomass of primary producers. However, as M. aeruginosa biomass declined in the later stages, the overall carbon absorption decreased accordingly. Among these groups, groups with submerged plant species demonstrated the highest carbon absorption capacity. The HSX group showed only marginally improved carbon absorption compared to the control group, potentially due to the metabolic activities of the fish reducing the efficiency of carbon fixation. The HSXB group exhibited greater carbon absorption than the HSX group alone. Previous studies have shown that the grazing activity of copper rust ringed snails on epiphytic algae attached to H. verticillata can enhance the photosynthetic performance of the submerged plants. Snails may also indirectly promote plant growth by influencing sediment nutrient dynamics, with snails and submerged plants maintaining a mutually beneficial ecological relationship [43]. The aforementioned factors may contribute to the enhanced carbon sequestration capacity of the HSXB group compared to that of the HSX group.
3.1.2. CH4 Flux
Figure 2 illustrates the variations in CH4 fluxes within each experimental group. As shown in Figure 2a, the CH4 emissions of all experimental groups were relatively high at 12:00 on the first day and 6:00 on the second day. The peak CH4 emissions for the control group, HSX group, and HSXB group occurred at 6:00, with corresponding fluxes of 0.23, 0.22, and 0.28 mg·m−2·h−1, respectively. In contrast, the SX group and HV group reached their emission peaks at 12:00, with fluxes of 0.29 and 0.22 mg·m−2·h−1, respectively. Figure 2b presents the changes in CH4 emission flux in each experimental group on day 15. The HV group, HSX group, and HSXB group displayed patterns similar to those observed on the first day, with elevated emissions occurring at 12:00 and 6:00. At 12:00, the CH4 emissions from these three groups were highest, measuring 0.29, 0.18, and 0.23 mg·m−2·h−1, respectively. Meanwhile, the CH4 emissions from the control group increased gradually and peaked at 6:00 with a flux of 0.22 mg·m−2·h−1. As illustrated in Figure 2c, during the late stage of the experiment, the CH4 emissions of the control group were significantly higher than other groups across most time periods, with the highest emission of 0.18 mg·m−2·h−1 at 18:00. In contrast, no distinct emission patterns were observed in the remaining groups towards the end of the experiment. To evaluate cumulative methane fluxes over time, data from the 1st, 15th, and 30th days were aggregated, as presented in Figure 2d. The control group demonstrated a steady increase in CH4 emissions, with values of 0.48 and 0.49 mg·m−2·h−1 recorded during the middle and late phases of the experiment, respectively, showing minimal fluctuation. SX group exhibited a gradual decline in CH4 emissions, decreasing from 0.59 mg·m−2·h−1 on the first day to 0.22 mg·m−2·h−1 by the end of the experiment. HV group displayed an initial increase followed by a decrease in emissions, peaking at 0.56 mg·m−2·h−1 on the 15th day before rapidly declining to 0.15 mg·m−2·h−1 at the conclusion of the study. HSX group, as well as HSXB group, followed trends similar to those of the HV group. At the end of the experiment, the ranking of CH4 emissions from highest to lowest was as follows: control group > SX group > HSXB group > HSX group > HV group.

Figure 2.
(a–c) depict the changes in CH4 fluxes on the first, fifteenth, and thirtieth days for each experimental group, respectively, and (d) is the cumulative CH4 flux on the thirtieth day for each experimental group.
Several studies have indicated that CH4 flux in aquatic ecosystems typically increases markedly after sunrise and peaks in the afternoon [44,45]. Consequently, during the early phase of the experiment, CH4 emissions across all groups were significantly higher during these periods compared to others. In the later phase, the CH4 flux in the control group was notably greater than in the other groups, which can be attributed to the uncontrolled proliferation of M. aeruginosa in the control group. Research conducted in Chaohu Lake revealed that the persistent worsening of algal blooms leads to increased CO2 absorption and enhanced CH4 release [46]. It has been reported that the CH4 emission rate from water surfaces covered by M. aeruginosa is more than three times that of uncovered surfaces [18]. The elevated algal cell density in the control group likely enhances the production of endogenous organic matter, which is more readily decomposed by heterotrophic microorganisms, thereby accelerating dissolved oxygen (DO) consumption and promoting CH4 generation [47]. Incorporating submerged macrophytes provides a habitat for methanotrophic bacteria, as the surface of submerged plants serves as a key zone for CH4 oxidation [48]. The increased dissolved oxygen (DO) content resulting from the photosynthetic activity of submerged plants further enhances methane (CH4) oxidation [49]. Consequently, the three groups containing submerged plants exhibited lower CH4 emissions. The application of submerged plants in aquatic ecological restoration within eutrophic environments can effectively mitigate CH4 emissions. However, the HSXB group displayed slightly higher CH4 emissions compared to the other two groups with submerged plants. This may be attributed to the presence of B. aeruqinosa, which likely increased oxygen consumption in the sediment, thereby potentially inhibiting the mineralization process. Several studies have also indicated that freshwater snail activity can elevate CH4 emission rates, with both the emission rate and cumulative emissions increasing significantly as snail density rises [50,51,52].
3.2. Research on Water Quality and Algae
Figure 3 illustrates the variations in water quality, algae, and chlorophyll a of each experimental group. In the control group, total nitrogen concentration exhibited a gradual increase during the early phase of the experiment, eventually stabilizing after the 10th day with a final concentration of 1.93 mg/L. In contrast, the SX group experienced a rapid rise in total nitrogen concentration over the first 20 days, peaking at 3.68 mg/L on the 20th day, followed by a slight decline to a final value of 2.54 mg/L. The other three groups containing submerged plants displayed a similar trend in total nitrogen concentration: an initial transient increase followed by a decrease. The ranking of total nitrogen concentration was as follows: SX group > control group > HSXB group > HSX group > HV group. Ammonia nitrogen concentrations across all experimental groups generally showed an increasing tendency throughout the experiment. In the control group, ammonia nitrogen levels increased steadily and remained lower than those observed in other groups for most of the experimental period. The SX group exhibited the fastest growth rate in ammonia nitrogen concentration, following a pattern similar to that of total nitrogen. It reached a peak of 0.73 mg/L on the 15th day and subsequently declined to 0.57 mg/L in the later stages of the experiment. Regarding nitrate nitrogen concentration, the three submerged plant-containing groups showed a continuous decline, with the HSXB group experiencing a slower reduction after the 10th day. The nitrate nitrogen concentration in the control group increased steadily from day 1 to day 10, followed by a gradual decline after day 10. In the SX group, the nitrate nitrogen concentration started at 0.72 mg/L and continuously rose to 1.43 mg/L by the end of the experimental period. The descending order of nitrate nitrogen concentration was as follows: SX group > control group > HSXB group > HSX group > HV group. This ranking was consistent with the trend observed for total nitrogen concentration. The total phosphorus concentration across all experimental groups generally exhibited a decreasing pattern over time. Among these, HV group demonstrated the most rapid decline in total phosphorus concentration, which remained lower than that of the other groups throughout the experiment. In SX group, total phosphorus concentration rapidly increased to 0.37 mg/L within the first 10 days, followed by a continuous decrease, reaching 0.24 mg/L at the conclusion of the experiment. Except for this group, the remaining four groups showed varying degrees of inhibition in total phosphorus levels. The descending order of total phosphorus concentration was: control group > HSX group > HSXB group > HV group, with corresponding removal rates of 24.52%, 51.96%, 75.38%, and 84.23%, respectively. As demonstrated in Figure 3e, the algal cell density in the control group continued to increase, albeit at a decreasing rate, after the 15th day. HV group and SX group exhibited a similar trend, with algal cell density rising until the 10th day, followed by a continuous decline. However, the rate of decline was more pronounced in the SX group compared to the HV group. The combination treatments, specifically the HSX group and HSXB group, demonstrated the highest efficacy in controlling algal cell density. In both groups, algal cell density began to decrease immediately after the initiation of the experiment, with the HSXB group showing slightly greater removal efficiency. At the end of the experiment, the ranking of algal cell density across the groups was as follows: control group > HV group > SX group > HSX group > HSXB group. As shown in Figure 3f, the Chl a concentration trends across the groups were consistent with those observed for algal cell density. In the control group, Chl a concentration continued to rise during the first 25 days, followed by a slight decline. HV group and SX group displayed similar patterns, characterized by an initial increase followed by a subsequent decrease. Notably, in the last five days of the experiment, Chl a concentration in the grass group rebounded from 22.0 μg/L to 27.68 μg/L. In contrast, the Chl a concentrations in HSX group and HSXB group exhibited a continuous downward trend throughout the experimental period.
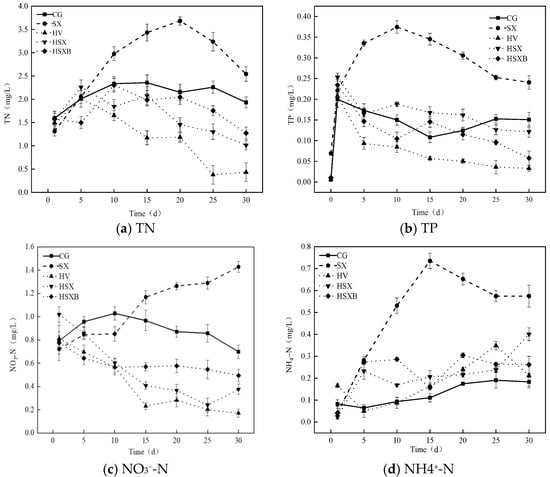
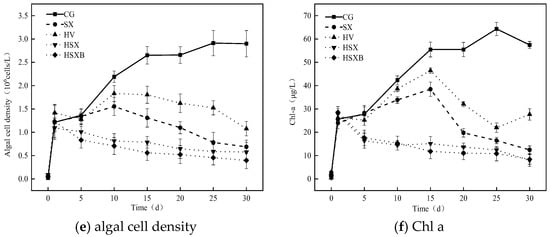
Figure 3.
(a–d) depict the changes in the concentrations of total nitrogen, total phosphorus, nitrate nitrogen, and ammonia nitrogen in each group, respectively, and (e,f) are the changes in the density of algal cells and chlorophyll a concentration in each group, respectively.
Following the stabilization phase of M. aeruginosa, the concentrations of soluble phosphorus and polyphosphorus within its cells reached their peak values [53]. As M. aeruginosa began to die off and decompose, the total phosphorus (TP) concentration increased in the later stages of the experiment. In the SX group, nitrogen and phosphorus levels were not effectively controlled. While silver carp and bighead carp consume algae, they also produce substantial amounts of fecal matter [54], and their digestion efficiency of algae is relatively low, resulting in significant algal residue [55]. This residual algae, together with fecal material, releases greater quantities of nitrogen and phosphorus into the environment during microbial decomposition. During the early phase of the experiment, when M. aeruginosa biomass was abundant, X. microlepis may have been slower in utilizing the feces produced by silver carp and bighead carp. These factors collectively contributed to a rapid increase in nitrogen and phosphorus concentrations during the early and middle stages of the experiment in this group, with nutrient salt concentrations declining only in the later stage. HSX group and HSXB group exhibited better nitrogen and phosphorus removal efficiencies, primarily due to the nutrient uptake by submerged plants. The NH4+-N concentration in the control group was relatively low, which may be attributed to the lower biomass and the absence of humus generated from the growth and metabolic activities of submerged plants and aquatic organisms. Hence, the NH4+-N concentration derived from humus decomposition was also reduced. Among all groups, HV group demonstrated the most effective regulation of nutrient concentrations in the water; however, the algal cell density control efficiency of submerged plants alone was lower compared to other experimental treatments. Submerged plants inhibit algal growth mainly through two mechanisms: competition for nutrients [56] and allelopathic effects [57]. The allelopathic effect of submerged plants on algae is relatively limited, and nutrient competition remains the primary factor influencing algal growth. However, multiple studies investigating the integrated control of algae using submerged plants, filter-feeding fish, and benthic organisms have demonstrated that multi-trophic-level ecological strategies exhibit significantly higher algal control efficiency compared to single-plant approaches [58,59].
3.3. Factors Influencing CO2 and CH4 Flux
To investigate the factors influencing CO2 and CH4 fluxes at the water-air interface, flux measurements were conducted on the 1st, 15th, and 30th days of the experiment. These flux data were then correlated with key water quality parameters, including total nitrogen (TN), total phosphorus (TP), chlorophyll a, dissolved inorganic carbon (DIC), and dissolved organic carbon (DOC). A correlation heatmap was generated to visually illustrate the relationships among these variables. Pearson correlation analysis was performed using p = 0.05 as the significance threshold.
A positive value of the water-air interface carbon flux in this experiment indicates that the experimental group is emitting CO2 into the atmosphere, representing a carbon emission process. Conversely, a negative value suggests that the experimental group is absorbing CO2 from the atmosphere, which corresponds to a carbon sequestration process. If an environmental indicator exhibits a positive correlation with CO2 flux, it implies that this indicator may facilitate the release of carbon and hinder the development of a carbon sink. In contrast, a negative correlation between an environmental indicator and carbon flux suggests that the indicator may support the carbon sequestration process within the experimental context.
Figure 4a presents the correlation heatmap of CO2 and CH4 fluxes in the control group. As shown in the figure, CO2 flux exhibits a highly significant negative correlation with algal cell density, chlorophyll a, and TN (p < 0.05), with Pearson correlation coefficients of −0.99, −1.00, and −0.82, respectively. In contrast, it shows a strong positive correlation with DIC and TP, with coefficients of 1.00 and 0.87, respectively. Variables negatively correlated with CO2 flux may promote CO2 absorption at the water–air interface, whereas those positively correlated may hinder it. Therefore, higher levels of algal cell density, chlorophyll a, and TN are associated with increased CO2 absorption, while elevated DIC and TP concentrations correspond to higher CO2 emission in the control group. For CH4 flux in the control group, a very strong positive correlation is observed with algal cell density, chlorophyll a, TN, and DOC, with Pearson correlation coefficients of 1.00, 1.00, 0.78, and 0.99, respectively. This suggests that increases in these variables are linked to higher CH4 emissions. Additionally, CH4 flux demonstrates a highly significant negative correlation with DIC and TP, with coefficients of −0.99 and −0.84, respectively.
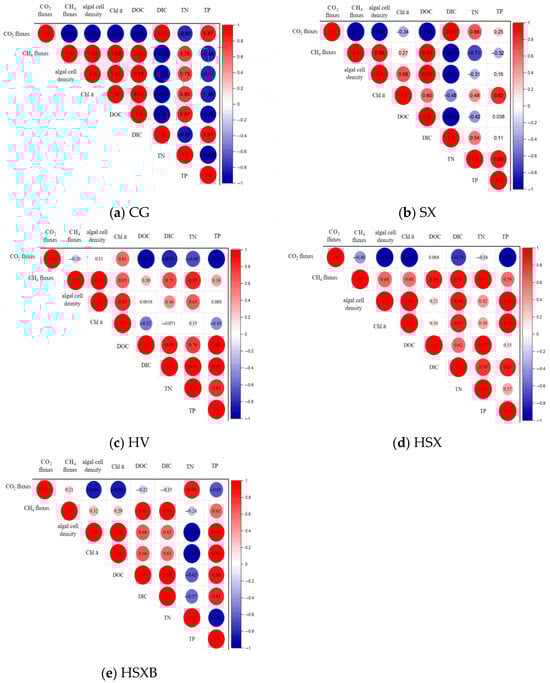
Figure 4.
(a–e) depict the correlation heat maps of CO2 and CH4 fluxes in different experimental groups.
Figure 4b presents the correlation heatmap of CO2 and CH4 fluxes in the SX group. As shown in the figure, within the SX group, CO2 flux exhibits a strong negative correlation with algal cell density and DOC, with Pearson correlation coefficients of −0.92 and −0.96, respectively. Additionally, CO2 flux demonstrates a strong positive correlation with DIC, with a Pearson correlation coefficient of 0.99. These results indicate that higher algal cell density leads to greater CO2 absorption at the water-air interface in the SX group, while increased DIC levels result in higher CO2 emissions. Furthermore, CH4 shows a strong positive correlation with algal cell density and DOC, with Pearson correlation coefficients of 0.89 and 0.93, respectively, as well as a strong negative correlation with DIC and a very strong negative correlation with TN.
Figure 4c illustrates the correlation heatmap of CO2 and CH4 fluxes in HV group. In this group, CO2 flux is strongly negatively correlated with DOC, DIC, and TP, with Pearson correlation coefficients of −0.99, −0.83, and −0.98, respectively. Meanwhile, CH4 flux exhibits a strong positive correlation with algal cell density and TN.
Figure 4d presents the correlation heatmap for HSX group. As shown in the figure, CO2 flux in this group exhibits a very strong negative correlation with algal cell density, chlorophyll a, and TP, with Pearson correlation coefficients of −0.96, −0.97, and −0.98, respectively. In contrast, CH4 flux demonstrates a very strong positive correlation with DOC, DIC, and TN.
Figure 4e displays the correlation heatmap for HSXB group. As illustrated, CO2 flux shows a very strong negative correlation with algal cell density and chlorophyll a, and a very strong positive correlation with TN. Meanwhile, CH4 flux is very strongly positively correlated with DOC and DIC. Overall, algal cell density, chlorophyll a, and TP appear to contribute to CO2 absorption in both HSX group and HSXB group. Conversely, increases in DOC and DIC are associated with greater CH4 emissions in both groups.
Based on the above analysis, it can be observed that the reduction in algal cell density and chlorophyll a concentration leads to a decrease in CO2 absorption at the water-air interface, as well as a reduction in CH4 emissions. The emission of CH4 across all experimental groups shows a positive correlation with dissolved organic carbon (DOC). A high organic carbon load enhances carbon utilization in the sediment, thereby providing the necessary substrate for methane production [60]. Furthermore, it intensifies oxygen consumption through respiration, creating favorable anaerobic conditions for methanogenic bacteria while simultaneously reducing the likelihood of CH4 oxidation [61]. The correlations between CO2 flux and total nitrogen (TN) or total phosphorus (TP) vary across groups, showing both positive and negative trends. This inconsistency may be attributed to the influence of nitrogen-to-phosphorus ratios on the photosynthetic activity of M. aeruginosa and submerged aquatic plants, which exhibit differing rates of photosynthesis and respiration under varying nutrient conditions [62]. In experimental groups containing submerged plants, dissolved CO2 in the water is efficiently utilized and subsequently released into the atmosphere, resulting in an increase in aqueous bicarbonate (HCO3−) concentration. When dissolved CO2 becomes limited, submerged plants are capable of utilizing HCO3− as an alternative inorganic carbon source to support photosynthesis [63].
4. Conclusions
This study investigates the dynamics of carbon flux at the water–air interface during the ecological restoration of eutrophic water bodies through a controlled simulation approach. A series of experiments was established, centered on submerged aquatic plants as key agents for carbon sequestration and carbon sink enhancement. Biological manipulation techniques were integrated into the system to mitigate pollution and regulate algal growth. The research examines variations in the carbon sequestration capacity of submerged plants under different nutrient concentrations and quantifies the carbon flux across the water–air interface within the microcosm environment. These findings offer theoretical support for the management of pollution control and carbon emissions in eutrophic water systems. The main conclusions are summarized as follows:
The water ecological restoration system incorporating submerged plants can significantly enhance carbon sequestration capacity during the ecological restoration process. In contrast, the restoration approach relying solely on filter-feeding fish tends to increase the carbon emission burden within aquatic environments. At the conclusion of the experiment, the order of carbon absorption capacity among the treatment groups was as follows: HV(plant) group > HSXB(submerged plant + fish + snail) group > HSX(fish + submerged plant group) > control group > SX(fish) group, with cumulative CO2 fluxes recorded as −72.53, −59.58, −51.43, −50.38, and 4.20 mg·m−2·h−1, respectively. During the early phase of the experiment, methane (CH4) emissions from the treatment groups involving biological combinations were notably higher than those observed in the control group. However, as algal cell density declined over time, CH4 emissions in the control group eventually surpassed those of other groups. The carbon sink potential and CH4 emissions across all microcosm systems were largely correlated with algal cell density and chlorophyll a concentration. A reduction in algal biomass resulted in decreased CO2 uptake at the water–air interface, accompanied by lower CH4 emissions. The treatment groups HSX and HSXB demonstrated effective algae control, achieving final algal cell densities equivalent to 19.94% and 13.74%, respectively, of that in the control group. The algae control effect of HV (submerged plant only) group was relatively limited; however, its capacity for nitrogen and phosphorus removal was superior to that of the experimental groups containing fish and benthic organisms. In SX (fish only) group, nitrogen and phosphorus concentrations could not be effectively controlled. At the conclusion of the experiment, the concentrations of TN, TP, NH3-N, and NO3−-N were 2.54, 0.24, 0.57, and 1.43 mg/L, respectively, representing 1.3, 1.6, 3.2, and 2 times increases compared to those in the control group. Future studies should aim to evaluate the ecological impacts of each microcosm system. Subsequent experiments should include stoichiometric analyses of carbon (C), nitrogen (N), and phosphorus (P) among submerged plants, aquatic animals, and algae within these systems. Furthermore, carbon isotope labeling techniques can be applied at different stages of the microcosm system to investigate the contribution of various components to carbon emissions.
Author Contributions
R.T.: Conceptualization, Methodology, Formal analysis, Investigation, Data analysis, Writing—original draft. Y.W.: Methodology, Formal analysis, Writing—original draft. Z.Z.: Methodology, Formal analysis, Investigation. T.C.: Formal analysis, Investigation, Data analysis. D.Z.: Supervision, Writing—review and editing. Y.Z.: Supervision, Writing–review and editing. H.Q.: Supervision, Funding acquisition, Writing—review and editing. Y.G.: Supervision, Funding acquisition, Writing—review and editing. All authors have read and agreed to the published version of the manuscript.
Funding
This study was supported by: (1) The funds of The 2024 Annual Project of the Key Special Program on the Comprehensive Management of Water Resources and the Water Environment in Major River Basins, Including the Yangtze River and the Yellow Rive, Key Technologies and Management Platform for the Prevention and Control of Cyanobacterial Blooms in Taihu Lake Driven by Changes in Hydrological Patterns (2024VFC3211700); (2) Nanjing Institute of Environmental Sciences specific fundings for basic scientific research (GYZX240409); (3) Nanjing Institute of Environmental Sciences specific fundings for basic scientific research, Research on the Assessment Technology of Agricultural Non-point Source Pollution Load in Typical Areas of the Yangtze River Delta (ZX2025GYZX00008).
Data Availability Statement
The original contributions presented in this study are included in the article. Further inquiries can be directed to the corresponding authors.
Acknowledgments
We would like to thank the peer reviewers for their valuable suggestions and comments on improving this paper.
Conflicts of Interest
The authors declare no competing financial interests.
References
- Hu, A. China’s goal of achieving carbon peak by 2030 and its main approaches. J. Beijing Univ. Technol. (Soc. Sci. Ed.) 2021, 21, bjutskxb202103001. [Google Scholar]
- Yang, Q.; Chen, S.; Li, Y.; Liu, B.; Ran, L. Carbon emissions from Chinese inland waters: Current progress and future challenges. J. Geophys. Res. Biogeosciences 2024, 129, e2023JG007675. [Google Scholar] [CrossRef]
- Li, Y.; Shang, J.; Zhang, C.; Zhang, W.; Niu, L.; Wang, L.; Zhang, H. The role of freshwater eutrophication in greenhouse gas emissions: A review. Sci. Total Environ. 2021, 768, 144582. [Google Scholar] [CrossRef]
- Guo, Y.; Zhou, Q.H.; Wang, P. Research progress on the mechanism of carbon storage in inland waters. J. Hydroecol. 2023, 44, 141–150. [Google Scholar]
- Meyer, M.F.; Labou, S.G.; Cramer, A.N.; Brousil, M.R.; Luff, B.T. The global lake area, climate, and population dataset. Sci. Data 2020, 7, 174. [Google Scholar] [CrossRef]
- Mendonça, R.; Müller, R.A.; Clow, D.; Verpoorter, C.; Raymond, P.; Tranvik, L.J.; Sobek, S. Organic carbon burial in global lakes and reservoirs. Nat. Commun. 2017, 8, 1694. [Google Scholar] [CrossRef]
- Yuan, X.; Yin, K.; Harrison, P.J.; Cai, W.J.; He, L.; Xu, J. Bacterial production and respiration in subtropical Hong Kong waters: Influence of the Pearl River discharge and sewage effluent. Aquat. Microb. Ecol. 2010, 58, 167–179. [Google Scholar] [CrossRef]
- Raymond, P.A.; Hartmann, J.; Lauerwald, R.; Sobek, S.; McDonald, C.; Hoover, M.; Butman, D.; Striegl, R.; Mayorga, E.; Humborg, C.; et al. Global carbon dioxide emissions from inland waters. Nature 2013, 503, 355–359. [Google Scholar] [CrossRef]
- Niu, X.; Shi, W.; Wu, W.; Liu, S.; Yang, P.; Li, S.; Yan, Z. Research Advances on Ebullitive CH4 Emissions from Inland Waters. Adv. Earth Sci. 2023, 38, 802–814. [Google Scholar]
- Davidson, T.A.; Audet, J.; Jeppesen, E.; Landkildehus, F.; Lauridsen, T.L.; Søndergaard, M.; Syväranta, J. Synergy between nutrients and warming enhances methane ebullition from experimental lakes. Nat. Clim. Change 2018, 8, 156–160. [Google Scholar] [CrossRef]
- Deemer, B.R.; Harrison, J.A.; Li, S.; Beaulieu, J.J.; DelSontro, T.; Barros, N.; Bezerra-Neto, J.F.; Powers, S.M.; dos Santos, M.; Vonk, J.A. Greenhouse gas emissions from reservoir water surfaces: A new global synthesis. BioScience 2016, 66, 949–964. [Google Scholar] [CrossRef] [PubMed]
- DelSontro, T.; Beaulieu, J.J.; Downing, J.A. Greenhouse gas emissions from lakes and impoundments: Upscaling in the face of global change. Limnol. Oceanogr. Lett. 2018, 3, 64–75. [Google Scholar] [CrossRef]
- Balmer, M.B.; Downing, J.A. Carbon dioxide concentrations in eutrophic lakes: Undersaturation implies atmospheric uptake. Inland Waters 2011, 1, 125–132. [Google Scholar] [CrossRef]
- Zagarese, H.E.; Sagrario, M.D.L.Á.G.; Wolf-Gladrow, D.; Nõges, P.; Nõges, T.; Kangur, K.; Matsuzaki, S.-I.S.; Kohzu, A.; Vanni, M.J.; Özkundakci, D.; et al. Patterns of CO2 concentration and inorganic carbon limitation of phytoplankton biomass in agriculturally eutrophic lakes. Water Res. 2021, 190, 116715. [Google Scholar] [CrossRef]
- Xiao, Q.; Xu, X.; Duan, H.; Qi, T.; Qin, B.; Lee, X.; Hu, Z.; Wang, W.; Xiao, W.; Zhang, M. Eutrophic Lake Taihu as a significant CO2 source during 2000–2015. Water Res. 2020, 170, 115331. [Google Scholar] [CrossRef] [PubMed]
- Grasset, C.; Sobek, S.; Scharnweber, K.; Moras, S.; Villwock, H.; Andersson, S.; Hiller, C.; Nydahl, A.C.; Chaguaceda, F.; Colom, W.; et al. The CO2-equivalent balance of freshwater ecosystems is non-linearly related to productivity. Glob. Change Biol. 2020, 26, 5705–5715. [Google Scholar] [CrossRef]
- Zhou, J.; Zhao, Y.; Huang, P.; Zhao, X.; Feng, W.; Li, Q.; Xue, D.; Dou, J.; Shi, W.; Wei, W.; et al. Impacts of ecological restoration projects on the ecosystem carbon storage of inland river basin in arid area, China. Ecol. Indic. 2020, 118, 106803. [Google Scholar] [CrossRef]
- Beaulieu, J.J.; DelSontro, T.; Downing, J.A. Eutrophication will increase methane emissions from lakes and impoundments during the 21st century. Nat. Commun. 2019, 10, 1375. [Google Scholar] [CrossRef] [PubMed]
- Huntley, M.E.; Lopez, M.D.G.; Karl, D.M. Response: Carbon and the antarctic marine food web. Science 1992, 257, 259–260. [Google Scholar] [CrossRef]
- Le Moal, M.; Gascuel-Odoux, C.; Ménesguen, A.; Souchon, Y.; Étrillard, C.; Levain, A.; Moatar, F.; Pannard, A.; Souchu, P.; Lefebvre, A.; et al. Eutrophication: A new wine in an old bottle? Sci. Total Environ. 2019, 651, 1–11. [Google Scholar] [CrossRef]
- West, W.E.; Creamer, K.P.; Jones, S.E. Productivity and depth regulate lake contributions to atmospheric methane. Limnol. Oceanogr. 2016, 61, S51–S61. [Google Scholar] [CrossRef]
- Li, S.; Bush, R.T.; Santos, I.R.; Zhang, Q.; Song, K.; Mao, R.; Wen, Z.; Lu, X.X. Large greenhouse gases emissions from China’s lakes and reservoirs. Water Res. 2018, 147, 13–24. [Google Scholar] [CrossRef] [PubMed]
- Yan, X.; Xu, X.; Ji, M.; Zhang, Z.; Wang, M.; Wu, S.; Wang, G.; Zhang, C.; Liu, H. Cyanobacteria blooms: A neglected facilitator of CH4 production in eutrophic lakes. Sci. Total Environ. 2019, 651, 466–474. [Google Scholar] [CrossRef]
- Ma, J.; Xu, X.; Yu, C.; Liu, H.; Wang, G.; Li, Z.; Xu, B.; Shi, R. Molecular biomarkers reveal co-metabolism effect of organic detritus in eutrophic lacustrine sediments. Sci. Total Environ. 2020, 698, 134328. [Google Scholar] [CrossRef]
- Xing, P.; Guo, L.; Tian, W.; Wu, Q.L. Novel Clostridium populations involved in the anaerobic degradation of Microcystis blooms. ISME J. 2011, 5, 792–800. [Google Scholar] [CrossRef]
- Ai, H.; Qiu, Y.; He, Q.; He, Y.; Yang, C.; Kang, L.; Luo, H.; Li, W.; Mao, Y.; Hu, M.; et al. Turn the potential greenhouse gases into biomass in harmful algal blooms waters: A microcosm study. Sci. Total Environ. 2019, 655, 520–528. [Google Scholar] [CrossRef] [PubMed]
- Pal, S.; Chattopadhyay, B.; Mukhopadhyay, S.K. Spatio-temporal study of carbon sequestration through piscicultural practice at East Kolkata Wetland. J. Environ. Biol. 2016, 37, 965. [Google Scholar]
- Pal, S.; Chattopadhyay, B.; Datta, S.; Mukhopadhyay, S.K. Potential of wetland macrophytes to sequester carbon and assessment of seasonal carbon input into the East Kolkata Wetland Ecosystem. Wetlands 2017, 37, 497–512. [Google Scholar] [CrossRef]
- Zhou, Y.; Song, K.; Han, R.; Riya, S.; Xu, X.; Yeerken, S.; Geng, S.; Ma, Y.; Terada, A. Nonlinear response of methane release to increased trophic state levels coupled with microbial processes in shallow lakes. Environ. Pollut. 2020, 265, 114919. [Google Scholar] [CrossRef]
- Jian, M.; Wang, S.; Yu, H.; Li, L.; Jian, M. Characteristics of Photosynthetic Fluorescence of Dominant Submerged Plants in Nanjishan Wetland of Poyang Lake in Winter. Meteorol. Environ. Res. 2015, 6, 52–59. [Google Scholar]
- Stewart, T.J.; Sprules, W.G. Carbon-based balanced trophic structure and flows in the offshore Lake Ontario food web before (1987–1991) and after (2001–2005) invasion-induced ecosystem change. Ecol. Model. 2011, 222, 692–708. [Google Scholar] [CrossRef]
- Han, L.; Hu, A.; Ren, M.; Meng, F.; Wu, Q.; Wang, J. Lake microbial communities and their mediated carbon cycling processes. Chin. Bull. Life Sci. 2023, 35, 1613–1629. [Google Scholar]
- Yang, H.; Xing, Y.; Xie, P.; Ni, L.; Rong, K. Carbon source/sink function of a subtropical, eutrophic lake determined from an overall mass balance and a gas exchange and carbon burial balance. Environ. Pollut. 2008, 151, 559–568. [Google Scholar] [CrossRef]
- Zeng, Q.H.; He, L.Y. Study on the synergistic effect of air pollution prevention and carbon emission reduction in the context of “dual carbon”: Evidence from China’s transport sector. Energy Policy 2023, 173, 113370. [Google Scholar] [CrossRef]
- HJ 636-2012; Water Quality-Determination of Total Nitrogen-Alkaline Potassium Persulfate Digestion UV Spectrophotometric Method. Ministry of Ecology and Environment of the People’s Republic of China: Beijing, China, 2012.
- HJ 535-2009; Water Quality—Determination of Ammonia Nitrogen—Nessler’s Reagent Spectrophotometry. Ministry of Ecology and Environment of the People’s Republic of China: Beijing, China, 2009.
- HJ/T 346-2007; Water Quality—Determination of Nitrate-Nitrogen—Ultraviolet Spectrophotometry. Ministry of Ecology and Environment of the People’s Republic of China: Beijing, China, 2007.
- GB 11893-89; Water Quality-Determination of Total Phosphorus-Ammonium Molybdate Spectrophotometric Method. Ministry of Ecology and Environment of the People’s Republic of China: Beijing, China, 1989.
- HJ 897-2017; Water Quality—Determination of Chlorophyll a—Spectrophotometric Method. Ministry of Ecology and Environment of the People’s Republic of China: Beijing, China, 2017.
- Liu, X.; Zhang, G. A review of studies on the impact of climate change on cyanobacteria blooms in lakes. Adv. Water Sci. 2022, 33, 316–326. [Google Scholar]
- Badger, M.R.; Price, G.D.; Long, B.M.; Woodger, F.J. The environmental plasticity and ecological genomics of the cyanobacterial CO2 concentrating mechanism. J. Exp. Bot. 2006, 57, 249–265. [Google Scholar] [CrossRef]
- Chen, X.; Zhu, L.; Che, X.; Liu, X.; Liu, H.; Tian, Y.; Li, X.; Chen, X. Study on diurnal variation of greenhouse gases flux in grass carp polyculture and monoculture ponds. Fish. Mod. 2023, 50, 16–24. [Google Scholar]
- Mo, S.; Zhang, X.; Tang, Y.; Liu, Z.; Kettridge, N. Effects of snails, submerged plants and their coexistence on eutrophication in aquatic ecosystems. Knowl. Manag. Aquat. Ecosyst. 2017, 418, 44. [Google Scholar] [CrossRef]
- Chen, S.; Wang, D.; Ding, Y.; Yu, Z.; Liu, L.; Li, Y.; Yang, D.; Gao, Y.; Tian, H.; Cai, R.; et al. Ebullition controls on CH4 emissions in an urban, eutrophic river: A potential time-scale bias in determining the aquatic CH4 flux. Environ. Sci. Technol. 2021, 55, 7287–7298. [Google Scholar] [CrossRef] [PubMed]
- Dando, P.R.; Hovland, M. Environmental effects of submarine seeping natural gas. Cont. Shelf Res. 1992, 12, 1197–1207. [Google Scholar] [CrossRef]
- Zhang, L.; He, K.; Wang, T.; Liu, C.; An, Y.; Zhong, J. Frequent algal blooms dramatically increase methane while decrease carbon dioxide in a shallow lake bay. Environ. Pollut. 2022, 312, 120061. [Google Scholar] [CrossRef]
- Xu, H.; Liu, Y.; Tang, Z.; Li, H.; Li, G.; He, Q. Methane production in harmful algal blooms collapsed water: The contribution of non-toxic Microcystis aeruginosa outweighs that of the toxic variety. J. Clean. Prod. 2020, 276, 124280. [Google Scholar] [CrossRef]
- Martinez, D.; Anderson, M.A. Methane production and ebullition in a shallow, artificially aerated, eutrophic temperate lake (Lake Elsinore, CA). Sci. Total Environ. 2013, 454, 457–465. [Google Scholar] [CrossRef] [PubMed]
- Sawakuchi, H.O.; Bastviken, D.; Sawakuchi, A.O.; Ward, N.D.; Borges, C.D.; Tsai, S.M.; Richey, J.E.; Ballester, M.V.R.; Krusche, A.V. Oxidative mitigation of aquatic methane emissions in large Amazonian rivers. Glob. Change Biol. 2016, 22, 1075–1085. [Google Scholar] [CrossRef] [PubMed]
- Xu, X.; Zhao, W.; Xiao, M.; Huang, J.; Fang, C.; Li, B.; Nie, M. Snails promote methane release from a freshwater lake ecosystem. Front. Environ. Sci. 2014, 2, 12. [Google Scholar] [CrossRef]
- Rietl, A.J.; Nyman, J.A.; Lindau, C.W.; Jackson, C.R. Gulf ribbed mussels (Geukensia granosissima) increase methane emissions from a coastal Spartina alterniflora marsh. Estuaries Coasts 2017, 40, 832–841. [Google Scholar] [CrossRef]
- Ye, W.; Sun, H.; Li, Y.; Zhang, J.; Zhang, M.; Gao, Z.; Yan, J.; Liu, J.; Wen, J.; Yang, H.; et al. Greenhouse gas emissions from fed mollusk mariculture: A case study of a Sinonovacula constricta farming system. Agric. Ecosyst. Environ. 2022, 336, 108029. [Google Scholar] [CrossRef]
- Li, J.; Dittrich, M. Dynamic polyphosphate metabolism in cyanobacteria responding to phosphorus availability. Environ. Microbiol. 2019, 21, 572–583. [Google Scholar] [CrossRef] [PubMed]
- Starling, F.L.D.M. Control of eutrophication by Silver Carp (Hypophthalmichthys molitrix) in the tropical Paranoá Reservoir (Brasília, Brazil): A mesocosm experiment. Hydrobiologia 1993, 257, 143–152. [Google Scholar] [CrossRef]
- Wang, Z.; Wang, Q.; Wang, J.; Wei, H.; Qian, J.; Zhang, Y.; Feng, K.; Chen, Q.; Yuan, J.; Liu, J.; et al. Evaluation of the control effect of bighead carp and silver carp on cyanobacterial blooms based on the analysis of differences in algal digestion processes. J. Clean. Prod. 2022, 375, 134106. [Google Scholar] [CrossRef]
- Liu, X.; Sun, T.; Yang, W.; Li, X.; Ding, J.; Fu, X. Meta-analysis to identify inhibition mechanisms for the effects of submerged plants on algae. J. Environ. Manag. 2024, 355, 120480. [Google Scholar] [CrossRef]
- Tang, P.; Yu, L.J.; Peng, Z.X.; Fan, P.Y.; Li, T.M.; Ren, K.Y. Research progresses on algae inhibition by allelopathy of aquatic plants. J. Biol. 2021, 38, 104–108. [Google Scholar]
- Gettys, L.A.; Haller, W.T.; Petty, D.G. Biology and Control of Aquatic Plants: A Best Management Practices Handbook, 3rd ed.; Aquatic Ecosystem Restoration Foundation: Marietta, Georgia, 2014. [Google Scholar]
- Gao, H.; Qian, X.; Wu, H.; Li, H.; Pan, H.; Han, C. Combined effects of submerged macrophytes and aquatic animals on the restoration of a eutrophic water body—A case study of Gonghu Bay, Lake Taihu. Ecol. Eng. 2017, 102, 15–23. [Google Scholar] [CrossRef]
- Grinham, A.; O’Sullivan, C.; Dunbabin, M.; Sturm, K.; Gale, D.; Clarke, W.; Albert, S. Drivers of anaerobic methanogenesis in sub-tropical reservoir sediments. Front. Environ. Sci. 2022, 10, 852344. [Google Scholar] [CrossRef]
- Caldwell, S.L.; Laidler, J.R.; Brewer, E.A.; Eberly, J.O.; Sandborgh, S.C.; Colwell, F.S. Anaerobic oxidation of methane: Mechanisms, bioenergetics, and the ecology of associated microorganisms. Environ. Sci. Technol. 2008, 42, 6791–6799. [Google Scholar] [CrossRef] [PubMed]
- Peng, G.; Fan, Z.; Wang, X.; Chen, C.H.E.N. Photosynthetic response to nitrogen source and different ratios of nitrogen and phosphorus in toxic cyanobacteria, Microcystis aeruginosa FACHB-905. J. Limnol. 2016, 75, 560–570. [Google Scholar] [CrossRef]
- Wei, S.S.; Li, P.P.; Yuan, L.Y.; Li, W.; Jiang, H.S. Leaf structure and inorganic carbon acquisition strategies of heteroblastic aquatic plants at different stages of development. Plant Sci. J. 2022, 40, 544–552. [Google Scholar]
Disclaimer/Publisher’s Note: The statements, opinions and data contained in all publications are solely those of the individual author(s) and contributor(s) and not of MDPI and/or the editor(s). MDPI and/or the editor(s) disclaim responsibility for any injury to people or property resulting from any ideas, methods, instructions or products referred to in the content. |
© 2025 by the authors. Licensee MDPI, Basel, Switzerland. This article is an open access article distributed under the terms and conditions of the Creative Commons Attribution (CC BY) license.