Abstract
Wetlands store large amounts of soil organic carbon stock (SOCS), making them crucial for global climate regulation. However, climate change, poor management, and weak protection policies threaten these stocks. To assess the contribution of different wetland types for national and international climate targets and to monitor the effectiveness of protection measures, additional research is required. Therefore, we assessed SOCS and disturbances from climate change, land use/land cover (LULC), and soil chemical composition in saline and eutrophic Ramsar sites in Serbia. Analyzing a total of 96 samples, we accounted for soil depth, reference soil group (RSG), and habitat/vegetation type. Mean SOCS in the saline site ranged from approximately 36 t·ha−1 at 0–30 cm to 26 t·ha−1 at 30–60 cm, whereas values were much higher for the eutrophic sites, ranging from 81 to 82 t·ha−1 at 0–30 cm and 47–63 t·ha−1 at 30–60 cm. Differences between groups for the whole soil columns (0–60 cm) were significant at the 0.1% level. While SOCS generally decreases with depth, it showed notable local variability, including occasional instances at deeper layers, indicating complex environmental and anthropogenic influences. Spatial mapping of soil chemistry parameters (pH, humus, P2O5, and K2O) along with land use/land cover (LULC) data revealed nutrient dynamics influenced by agricultural activities. An analysis of regional climate data revealed temperature increases relative to the reference period of 1971–2000 by 0.5 °C for the decade 2001–2010 and of 1.5 °C for 2011–2020. Climate projections under the RCP4.5 and 8.5 scenarios predict further warming trends, as well as increased rainfall variability and drought risks. The results of our study contribute to quantifying the important, though variable, contribution of wetland sites to global climate regulation and show the influence of geogenic, pedogenic, and anthropogenic factors on SOCS. National policies should be adapted to safeguard these stocks and to limit negative effects from surrounding agricultural areas, as well as to develop strategies to cope with expected regional climate change effects.
1. Introduction
Wetlands rank among the most productive ecosystems, functioning as hubs for material exchange and nutrient transformation [1]. They play a crucial role in global climate regulation, as due to their periodical flooding and associated anoxic conditions they are natural SOC sinks with low rates of organic carbon decomposition [2,3].
Accordingly, wetlands have a higher carbon density and larger capacities for carbon sequestration than any other terrestrial ecosystem [4,5]. Estimates of the amount of the world’s soil organic carbon (SOC) stored in wetlands range from 6 to 12% [6] to 20–25% [7] to 20–30% [8], and even >30% [9]. Estimates are complicated by the fact that carbon cycles in wetland ecosystems are multi-dimensional and highly complex [10]. Studies conducted by Teiter and Mander [11], Hernandez and Mitsch [12], and Thiere et al. [13] consistently found that gas exchange with the atmosphere and fluxes within wetlands exhibit significant spatial and temporal variation, not only between different wetlands but also within a single wetland. Moreover, only long-time monitoring can reveal underlying trends, as current conditions of a wetland may not be representative of its future state [14]. Wetlands also emit greenhouse gasses (GHG), particularly methane (CH4) and nitrous oxide (N2O) [15]. However, due to the different half-lives of methane and carbon dioxide in the atmosphere, wetlands are typically GHG sources in the short term, but GHG sinks in the long term [16]. In addition, the amount of GHG that wetlands emit when intact is much smaller than the amount they emit under disturbances [17]. For climate change mitigation, it is therefore crucial to preserve wetlands and to safeguard their existing SOCS [15].
Wetlands are highly threatened ecosystems, with the two main factors of wetlands’ deterioration being climate change and land use. With regard to the effects of climate change, wetlands are particularly vulnerable to changes in rainfall such as prolonged droughts, as these can result in lower water tables, drying up of wetlands, and a subsequent release of stored carbon back to the atmosphere through microbial oxidation or fires [17]. Unsustainable human land use may pose an even larger threat where land governance is insufficient or lacking. Threats include artificial drainage, agricultural intensification, infrastructure development, urbanization or legal and illegal human settlement. These additional and connected threats are excessive use of wetland resources, pollution, or spread of invasive species [18,19]. Artificial drainage, agricultural or urban land use, wildfires, and other disruptions of wetland ecosystems enhance CO2 releases from vegetation and soils [20,21]. Although programs aimed at the conservation of wetlands under the Ramsar Convention on Wetlands, scientific observations have indicated that the effectiveness of present policies has been lacking [22,23]. Furthermore, though such policies could reduce anthropogenic disturbances, they would be unable to control weather extremes [24] or naturally occurring fires [25].
Wetland classifications are mainly determined by parameters such as hydrology, vegetation, soil, etc. [2]. While several classifications exist, the Ramsar classification is perhaps the most widespread and significant one. Currently, more than 2500 wetlands with a total area of approximately 258 million ha are protected under the Ramsar Convention globally [26]. The Ramsar Convention has approved the Ramsar Classification of Wetland Type (§4.3.4) which encompasses 42 types, divided into three categories [27]: (1) Marine and Coastal Wetlands; (2) Inland Wetlands; (3) Human-made Wetlands, as well as various sub-categories.
In order to assess the ecosystem service wetlands provide for climate regulation, it is necessary to understand well the storage of SOC in various wetlands across different conditions [24]. There is an urgent need to measure the current amount of SOCS at Ramsar Sites in order to improve estimations of their climate change impact and to strengthen national and international policies and strategies [28]. A recent review of studies on SOCS in Ramsar Sites identified a lack of studies on both local and global scales [29]. While 11 wetlands with a total surface area of 130.411 ha in Serbia are recognized as Ramsar sites [30], studies assessing their carbon stock are lacking. To contribute to closing this research gap, we analyzed SOCS in eutrophic and saline Serbian Ramsar sites. Our study offers novel insights through a comprehensive assessment of SOCS variability by integrating ecological, geochemical, and climatic parameters crucial for further management and conservation strategies. Our objectives were as follows:
- (1)
- Assess SOCS and its variability within eutrophic and saline sites;
- (2)
- Assess potential ecosystem disturbances by analyzing the spatial distribution of chemical parameters and LULC on SOCS;
- (3)
- Assess the impacts of projected climate change on SOCS.
In this study, we tested whether SOCSs differ significantly among research localities, soil depths, habitat/vegetation types, and RSGs. The hypotheses tested were as follows:
- H0 (Null Hypothesis): There are no statistically significant differences in SOCS among research localities, soil depth, habitat/vegetation type, and RSGs.
- H1 (Alternative Hypothesis): There are statistically significant differences in SOCS among research localities, soil depth, habitat/vegetation type, and RSGs.
2. Materials and Methods
2.1. Study Sites
The study was conducted in the northern region of the Republic of Serbia. Three locations involved in this research are as follows: Ludaš Lake, Palić Lake, and Slano Kopovo (Figure 1; for basic characteristics see Table 1).
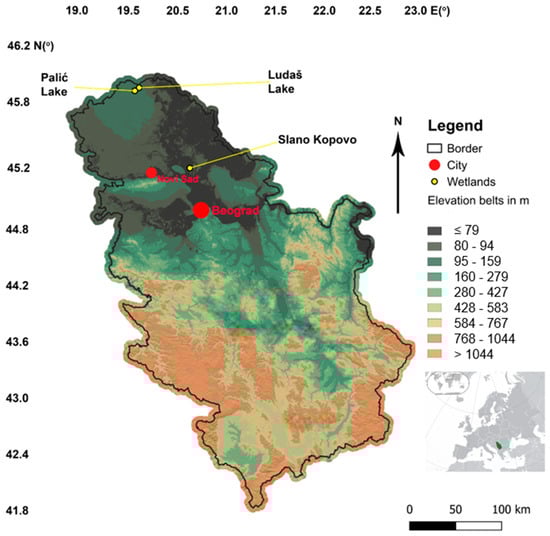
Figure 1.
The geographical position of studied wetlands.

Table 1.
Study site characteristics.
Wetlands have been categorized based on the Ramsar Sites Information Service [31] and the Ramsar wetland type classification [27], which was adopted by Recommendation 4.7 and amended by Resolutions VI.5 and VII.11 of the Conference of the Contracting Parties. Regarding habitat classification, the EUNIS habitat classification [32] was used, which presents an extensive pan-European system for identification of habitat. The classification system is structured hierarchically and encompasses a comprehensive range of habitats. The identification of habitat categories involves the utilization of distinct codes, names, and descriptions, as outlined in the EUNIS habitat classification. Vegetation types were determined based on the classification of natural vegetation as described by [33]. The soil classification was based on the reference soil group (RSG) defined by the World Reference Base for Soil Resources [34].
Ludaš Lake (Ramsar site no. 137) (46°6′ N, 19°49′ E) and Palić Lake (46°02′ N, 19°44′ E) are located in the northern part of Serbia, nearby the Serbia–Hungary border between Danube and Tisa River. These two lakes were joined and from 1982 the area name is Palić–Ludaš regional park, and it belongs to the municipality of Subotica. The region has a typical temperate climate. Geological elements are represented by Pliocene sediments—sand, clay, and boulders, with the groundwater level from 80 to 100 cm, while the terrain is flat (103 to 106 m a.s.l.) [35]. The natural forest steppe vegetation is only found in the remaining portions, as agricultural land covers most of the region extending to the lake [36]. Agriculture is the predominant land use (crops such as corn, sunflower, wheat, and rapeseed, while grazing lands are also present), exerting pressure and causing significant levels of contamination in both lakes [37]. Although Palić Lake is not on the Ramsar list, considering the proximity and hydrological connection to Ludaš Lake, they share similar characteristics and thus contribute to a broader wetland ecosystem. In addition, Palić Lake plays an important role in biodiversity conservation (Table 1). Moreover, some parts of its shoreline and shallow areas exhibit some wetland characteristics, which further confirms its ecological importance and justifies its inclusion in this study as a part of a broader wetland area.
Special Nature Reserve Slano Kopovo (Ramsar Site no. 1392) (45°38′ N 020°13′ E) is located in the northwestern region of the Banat district, near the river Tisa, and belongs to the municipality of Novi Bečej. The climate type seen in the area is classified as continental, specifically a semi-arid continental Pannonian climate type VII—zonal steppe climate. This particular pond is regarded as one of the few remaining bodies of water situated on saline terrain in the region of Vojvodina. Specifically, it is classified as a saline lake located within the paleo meanders. Slano Kopovo serves as a fine example of salt habitats that are currently facing disappearance due to various pressures. The elevation varies between 76 and 91 m a.s.l. The primary geological formations consist of alluvial deposits and terrace loess (partially hydromorphic). Agriculture constitutes the primary human activity, resulting in the widespread coverage of land with crops and pastures [38].
2.2. Data Analysis
2.2.1. Soil Data
Soil sampling was performed on representative areas in accordance with the change in RSG and vegetation. Sampling design was also affected by the fact that the research areas were under protection—especially Ramsar-designated areas, in which case a lower number of samples could be obtained in accordance with regulatory constraints. Nevertheless, sampling points were strategically placed to ensure the most representative data possible given these constraints. In the area of Palić–Ludaš regional park and Slano Kopovo, 96 composite soil samples in the surface (0–30 cm) and subsurface soil layer (30–60 cm) were obtained. Five individual samples were taken for each composite sample. Mixed samples of 500 g were collected from two depths. The soil samples were air-dried, crushed, and sieved using a 2 mm sieve. The granulometric composition of the soil was evaluated utilizing the internationally recognized phosphate B method, while for the distribution of the obtained values, the international Atteberg distribution was used [39]. In accordance with the ISO 10390:2007 standard [40], the pH of the soil was measured by applying a glass electrode in a 1:5 (volume fraction) suspension of soil in water (pH in H2O). The Tyurin method, as outlined in ISO 10694:2005 [41], was employed to ascertain the humus content. The Egner–Riehm AL method ISO 11263:2016 [42] was employed to establish the levels of easily accessible phosphorus and potassium. The laboratory analyses were conducted at the Institute of Soil Science in Belgrade, Serbia (SRPS ISO/IEC 17025:2017, accreditation no.: 01-207).
The calculation of SOCS for each soil profile was conducted in compliance with the “Soil sampling protocol to certify the changes in organic carbon stock in mineral soil of the European Union/EUR21576 EN/2” established by Stolbovoy et al. [43]:
where SOCS—soil organic carbon stock [t/ha]; Ti—soil depth [cm]; BDi—bulk density [g·cm−3]; SOCi—soil organic carbon [%; g·kg−1]; Ci—is the volume of the coarse fragments in the single sampled depth [%].
Regarding the calculation of bulk density (BD), two approaches were evaluated: the MetHyd model as per Adams [44], and the modification of the Adams equation by Chen et al. [45]. The results from both methods were compared with 17 control samples. The ANOVA test indicated no significant differences among the samples; however, the MetHyd model as per Adams [44] demonstrated greater accuracy in more instances compared to the modification of Adams by Chen et al. [45]. Taking this into account, along with the widespread application of the MetHyd model as per Adams [44] in multiple studies for this region, this methodology was selected for bulk density calculation:
where OM—organic matter [%] (percentage of soil carbon divided by 0.58); MBD—mineral bulk density (1.64 according to Mann [46]).
Data regarding SOCS was analyzed through statistical techniques, incorporating descriptive statistics and ANOVA-single factor analysis, commonly referred to as the ANOVA one-way test (alpha level 0.05). In cases where ANOVA single-factor analysis detected a difference between the means of the analyzed groups, an F-Test for two-sample variances and t-test, as well as an ANOVA post hoc test (Bonferroni correction), were performed to determine the significance of the difference. All calculations were conducted using Microsoft Excel. Furthermore, to assess normality, the homogeneity of variances, and the independence of observations, specific tests have been conducted. The Shapiro–Wilk test was used to determine the normality of the data in each group, where sample sizes allowed. For groups with limited sample sizes, the distribution of values was visually evaluated using histograms. Levene’s test was used to evaluate the homogeneity of variances, along with a comparison of group variances. Independence was ensured by the study design, as each sample represented a unique location. In instances of small sample sizes, the efficacy of normality and variance tests was constrained; thus, results were interpreted with necessary caution. All assumption checks supported the use of ANOVA and t-tests for the main analyses.
2.2.2. Spatial Data
The spatial distribution of the measured soil parameters (pH, humus, P2O5 and K2O) across the Palić Lake, Ludaš Lake, and Slano Kopovo localities was visually represented using Geographic Information System (GIS) software. QGIS (version 3.44.4) was used for geospatial processing and visualization. The geographical coordinates recorded for each sampling site were utilized to generate individual point features. The corresponding measured values for each soil parameter were then assigned to these points. An OpenStreetMap standard map served as the basemap to offer geographical context for the study sites and sampling locations. A graduated symbology approach was employed to visualize the spatial variability and distribution patterns of these parameters effectively. Measured values for each parameter were categorized into distinct classes. Each class received a sequential color gradient that used variations of a single color, ranging from light for lower values to dark for higher values, to provide a clear and straightforward visual representation of parameter magnitudes. The value categories in the maps’ legends were chosen based on the range of results obtained, facilitating a clear visual representation of the observed variations within research localities. This point-level geospatial representation depicts the sampling locations and their corresponding parameter values, aiding in the identification of potential hotspots or areas of specific interest within the study sites.
For the analysis of LULC, the Dynamic World application dataset [47] has been used. Dynamic World is a peer-reviewed near-real-time global LULC dataset with a resolution of 10 m, generated by deep learning techniques using Sentinel-2 imagery [48]. This data is produced for the Dynamic World Project by Google in collaboration with National Geographic Society and the World Resources Institute. The dynamic world identifies nine LULC types: water, trees, grass, crops, shrub and scrub, flooded vegetation, build-up area, bare ground, and snow and ice. Utilizing the previously outlined methodology, LULC maps for the three research locations were constructed. The Dynamic World dataset includes maps from 2015 onwards; hence, the chosen dates for map selection corresponded with the soil sample periods (the Ludaš and Palić Lake localities—2019 and the Slano Kopovo locality—2023). This was conducted to ensure period alignment between the LULC context and the SOCS measurements. These maps provided critical contextual information regarding LULC characteristics and potential anthropogenic influences on SOCS in the studied areas.
2.2.3. Climate Data
The Digital Climate and Climate Change Atlas of the Republic of Serbia [49] has been used for the assessment of climate change. It relies on data from CORDEX, an initiative of the World Climate Research Programme, and the Copernicus Climate Change Service, which offers climate-monitoring products for Europe. Surface in situ readings conducted by National Meteorological Services are utilized. In Serbia, data relies on the Republican Hydrometeorological Service and the geospatial information system of the Republic of Serbia. The following data has been used from the previously mentioned platform for Serbia: Observed daily average temperature, precipitation, the SPEI drought index and number of days with temperature above 35 °C changes for the two periods, 2001–2020 and 2011–2020, with a reference period of 1971–2000; Future climate projections (changes) for daily average temperature, precipitation, the SPEI drought index and number of days with temperature above 35 °C for the three periods, 2011–2040, 2041–2070, and 2071–2100 with a reference period of 1971–2000 for the RCP4.5 (mitigation) and RCP8.5 (no mitigation) scenario. RCP4.5 represents a scenario with moderate GHG mitigation with stabilized emissions yet still predicts temperatures exceeding 2 °C by 2100. Conversely, RCP8.5 predicts continued high GHG emissions with no mitigation, projecting temperature increases that could exceed 4 °C by 2100 [15]. In addition, RCPs have been widely used in climate change assessments and future climate scenario projections with further effects on various ecosystems [50]. Including both scenarios supports the assessment of potential climate impacts on wetland ecosystems and SOC dynamics. The aforementioned data has been extracted for the two municipalities, Subotica and Novi Bečej, in which research localities are.
3. Results
3.1. SOCS Distribution
The SOCS was analyzed according to locality, soil depth, habitat/vegetation type, and RSG. SOCS values were measured for the 0–30 cm and 30–60 cm layers, as well as for the entire 0–60 cm depth across three research localities: Ludaš Lake, Palić Lake, and Slano Kopovo. The spatial distribution of each sampling point across the three studied localities is shown in Supplementary Materials Figure S1. Additionally, SOCS values for the sampling points in the three research localities are presented in Supplementary Materials Figures S2–S4.
At 0–30 cm depth, mean SOCS was the highest at the Palić Lake locality (~82 t·ha−1), followed by the Ludaš Lake locality (~81 t·ha−1), and the lowest at the Slano Kopovo locality (~36 t·ha−1) (Figure 2A). The range of values was the broadest at the Palić Lake locality, spanning from approximately 15 to 120 t·ha−1, reflecting heterogeneous soil and vegetation conditions. In the 30–60 cm soil layer, mean SOCS values were generally lower than in the upper layer, with the Palić Lake locality averaging ~63 t·ha−1, the Ludaš Lake locality ~47 t·ha−1, and the Slano Kopovo locality ~26 t·ha−1 (Figure 2B). Some individual samples showed increased SOCS with depth, indicating local variability in carbon distribution. For the integrated 0–60 cm profile, mean SOCS followed a similar pattern, with the Palić Lake locality showing the highest values (~74 t·ha−1), followed by the Ludaš Lake locality (~66 t·ha−1), and the Slano Kopovo locality showing the lowest (~29 t·ha−1) (Figure 2C). Overall, SOCS tended to be higher in the upper soil layer (0–30 cm). However, several sample points exhibited increased SOCS values in the deeper 30–60 cm layer, specifically at the Ludaš Lake locality (L8), the Palić Lake locality (P1, P6, P14, P22), and the Slano Kopovo locality (SK2). Additionally, at several locations, although SOCS decreased with depth, the reduction was less pronounced than expected. These points include the Ludaš Lake locality (L4, L9, L10, L11, L12, L17), the Palić Lake locality (P5, P10, P12, P15, P17, P19, P20), and the Slano Kopovo locality (SK3) (Figure S1).
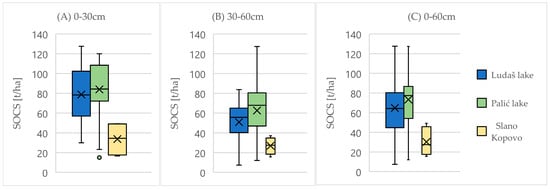
Figure 2.
(A) SOCS for Ludaš Lake, Palić Lake, and Slano Kopovo localities (0–30 cm); (B) SOCS for Ludaš Lake, Palić Lake, and Slano Kopovo localities (30–60 cm); (C) SOCS for Ludaš Lake, Palić Lake, and Slano Kopovo localities (0–60 cm). Box—the interquartile range; horizontal line—median; “X”—mean; whiskers—data within 1.5 × IQR; circles—outliers.
SOCS values from 0 to 60 cm depth differed among the four EUNIS habitat/vegetation types studied at the Ludaš Lake, Palić Lake, and Slano Kopovo localities (Figure 3A). The highest mean SOCS was found in the Pannonian lowland mixed pedunculate oak forests (G4(G1.3)), averaging approximately 76 t·ha−1 with the same median value. Pannonian salt meadows (P32(P.2.2)) exhibited lower mean SOCS values around 44 t·ha−1. The Pannonian sand steppes alternating with oak forests (L11(L.2.1)) showed intermediate SOCS values, averaging roughly 59 t·ha−1, with a broad range of values. The South Pannonian herb-grass steppes alternating with oak forests (L10(L.2.1)) displayed the lowest SOCS among the habitats analyzed, based on limited samples, with a mean of approximately 43 t·ha−1.
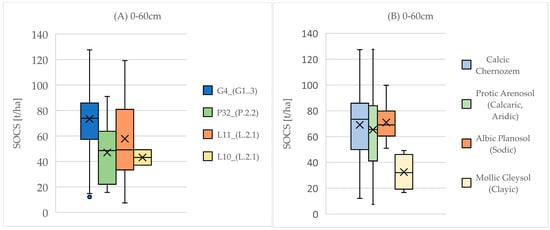
Figure 3.
(A) SOCS for Ludaš Lake, Palić Lake, and Slano Kopovo localities (0–60 cm) shown with regard to habitat/vegetation type (EUNIS code): G4_(G1.3)—Pannonian lowland mixed pedunculate oak forests; P32_(P.2.2)—Pannonian salt meadows; L11_(L.2.1)—Pannonian sand steppes alternating with oak forests (Quercus robur); L10_(L.2.1)—South Pannonian herb-grass steppes alternating with oak forests (Quercus robur, Quercus cerris, Quercus pubescens) with Acer tataricum; (B) SOCS for Ludaš Lake, Palić Lake, and Slano Kopovo localities (0–60 cm) shown with regard to RSG.
The order of SOCS average values from highest to lowest based on RSG is as follows: Albic Planosol (Sodic) > Calcic Chernozem > Protic Arenosol (Calcaric, Aridic) > Mollic Gleysol (Clayic) (Figure 3B). Calcic Chernozem showed a wide range of SOCS values from approximately 12 to 128 t·ha−1, with the mean and median near 75 t·ha−1. The interquartile range reflected moderate variability in SOC content. Protic Arenosol (Calcaric, Aridic): SOCS values ranged broadly from about 7 to 128 t·ha−1, with mean and median values roughly around 75 t·ha−1. This RSG demonstrated considerable variation in SOCS. Albic Planosol (Sodic) SOCS values ranged from approximately 51 to 100 t·ha−1, with an average near 70 t·ha−1. Mollic Gleysol (Clayic) showed lower SOCS values ranging from approximately 16 to 49 t·ha−1, indicating relatively lower SOCS compared to the other RSGs.
Detailed statistical analyses are provided in the Supplementary Materials (Tables S1–S11). ANOVA revealed significant differences in SOCS among the three sites at 0–30 cm depth (p < 0.01); 30–60 cm depth (p < 0.05) and 0–60 cm depth (p < 0.001). Further analysis using the ANOVA Post Hoc Test (Bonferroni Correction) for SOCS among the three sites at 0–30 cm depth shows the significant difference between Slano Kopovo locality compared to both the Ludaš Lake locality and the Palić Lake locality (p < 0.01). Meanwhile, the same test showed no significant difference between the Ludaš and Palić Lake localities (p = 0.5515). At the 30–60 cm depth, the test indicates a significant difference between the Ludaš Lake and Slano Kopovo localities (p < 0.001). However, the same test indicated no significant difference between the Palić Lake locality compared to the Ludaš Lake (p = 0.139) and Slano Kopovo localities (p < 0.05). At the 0–60 cm depth, a significant difference was found between Slano Kopovo compared to both the Ludaš Lake locality (p < 0.001) and the Palić Lake locality (p < 0.001), while no significant difference was found between the Ludaš and Palić Lakes localities (p = 0.1844). ANOVA has shown that there is a significant difference (p < 0.05) between 4 groups for SOCS (0–60 cm) shown in regard to habitat/vegetation type. Further ANOVA Post Hoc Test (Bonferroni Correction) shows the significant difference only between G4_(G1.3) and P32_(P.2.2) habitat/vegetation type (p < 0.01). Nevertheless, in the case of other compared groups, there was no significant difference detected. Furthermore, no significant difference in SOCS (0–60 cm) was observed among the four RSGs (p = 0.1292).
A t-test comparing SOCS at different depths (0–30 cm vs. 30–60 cm) among the three sites showed a significant difference in the case of the Ludaš Lake locality (p < 0.01), and the Palić Lake locality (p < 0.01). Conversely, a significant difference in the case of the Slano Kopovo locality was not recognized (p = 0.5145). In several specific sample points, the SOCS decrease with depth (0–30 cm vs. 30–60 cm) was not as expected. These sample points are L4, L9, L10, L11, L12, L17, P5, P10, P12, P15, P17, P19, P20, and SK3. Therefore, these sample values were separated and tested via t-test to statistically confirm their significance. The performed t-test showed no significant difference between these specific samples (p = 0.4933).
3.2. Soil Chemistry
The spatial analysis of soil chemistry revealed varied characteristics across the Ludaš Lake, Palić Lake (Figure 4A–D), and Slano Kopovo localities (Figure 5A–C). Soils displayed predominantly alkaline conditions, with pH values between 8.3 and 12.1. The soils of the Ludaš Lake locality exhibited pH values ranging from 8.3 to 9.8. The Palić Lake locality revealed a broader range of pH values, from 8.7 to 12.1, with its western parts exhibiting the highest alkalinity. The soils of the Slano Kopovo locality displayed predominantly alkaline conditions, with pH values (H2O) ranging from below 10.1 to above 10.3.
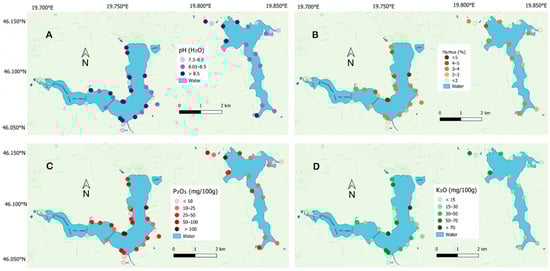
Figure 4.
Palić Lake (left) and Ludaš Lake (right): (A) the distribution of pH (H2O); (B) the distribution of humus (%); (C) the distribution of P2O5 mg·100 g−1; (D) the distribution of K2O mg·100 g−1.
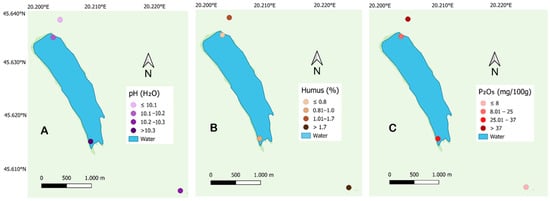
Figure 5.
Slano Kopovo: (A) the distribution of pH (H2O); (B) the distribution of humus (%); (C) the distribution of P2O5 mg·100 g−1.
The humus content ranged from below ≤0.8% to above 4.06% at these three localities. The Ludaš Lake locality exhibited the highest humus levels in the northern zone, whereas the Palić Lake locality demonstrated peak concentrations in the southern and southeastern areas. In the Slano Kopovo locality, the humus concentration is generally greater at points situated farther from the water body.
The content of phosphorus pentoxide (P2O5) exhibited significant variation, ranging from less than 8 mg·100 g−1 to more than 104 mg·100 g−1. The Ludaš Lake locality exhibited significantly elevated P2O5 levels, especially in its southern region, exceeding 104 mg·100 g−1, while Palić Lake’s locality peak concentrations were found in its southern and southeastern parts. The Slano Kopovo locality indicated the highest concentration in the northern part, exceeding 37 mg·100 g−1, whereas the southernmost area recorded values below 8 mg·100 g−1.
Potassium oxide (K2O) levels varied from below 20 mg·100 g−1 to above 57.1 mg·100 g−1. The Ludaš Lake locality exhibited considerably higher K2O concentrations, particularly at its southern tip, in contrast to the Palić Lake locality, where the highest concentrations were found in the eastern and southeastern areas.
3.3. LULC Analysis
The analysis of LULC for the three studied sites is represented in Figure 6 (Palić and Ludaš Lake) and Figure 7 (Slano Kopovo).
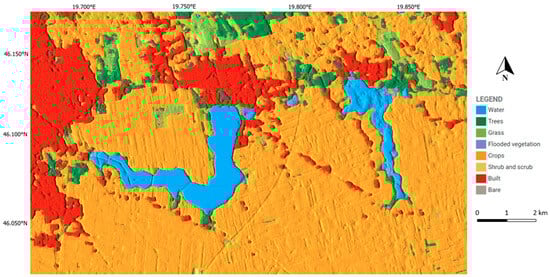
Figure 6.
Palić lake (left) and Ludaš lake (right) LULC map for 2019. Water (blue): ~10%; Trees (dark green): ~2%; Grass (light green): ~2%; Flooded vegetation (purple): ~1%; Crops (orange): ~60%; Shrub and scrub (yellow–beige): ~10%; Built (red): ~15%; Bare (gray): ~0% (Dynamic World [47]).
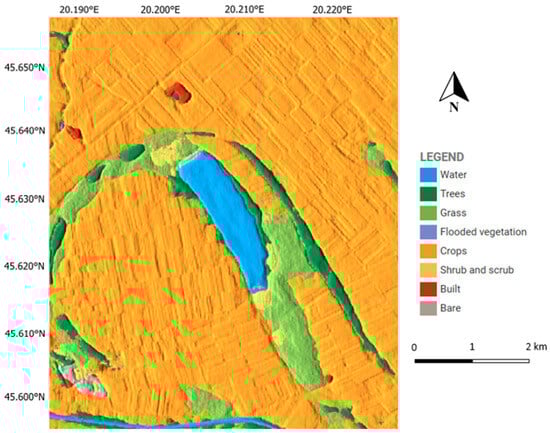
Figure 7.
Slano Kopovo LULC map for 2023. Water (blue): ~10%; Trees (dark green): ~3%; Grass (light green): ~8%; Flooded vegetation (purple): ~0%; Crops (orange): ~75%; Shrub and scrub (yellow–beige): ~2%; Built (red): ~1%; Bare (gray): ~1% (Dynamic World [47]).
LULC map shows that the Palić and Ludaš Lake surroundings area is predominantly agricultural (Figure 6). Agricultural-dominated areas predominantly occupy the western, southern, and eastern peripheries of both lakes, whereas the northern region has signs of anthropogenic development (built). In addition, the western part of the Palić Lake locality is hugely dominated by built (anthropogenic) areas. Other LULC categories, such as trees and grass, are mostly scattered in various parts of these lakes’ surroundings. Flooded vegetation is more characteristic for the Ludaš Lake locality. In the Palić Lake locality, flooded vegetation occurs only in the minor western shoreline part, while in Ludaš Lake it occurs in various zones and is heavily present in the northeastern part of this lake. Shrub and scrub categories are present in some scattered minor parts. Bare land has not been detected.
On the other side, LULC of the Slano Kopovo locality exhibits slightly different surroundings categories (Figure 7). While the agricultural areas are here also dominant, built (anthropogenic) areas are rarely present. Trees, grasses, and shrub and scrub categories are mostly present in the form of buffer zones around the wetland, with predominant appearance in southeastern and northwestern zones. Bare land occupies a minor part of southeastern and northwestern zones near by the water zones of the wetland. Flooded vegetation has not been detected.
3.4. Climate Analysis
Observed daily average temperature changes for the periods 2001–2020 and 2011–2020 indicate an increase of 0.5 to 1.5 °C compared to the reference period of 1971–2000 (Figure 8A). Observed precipitation variations observed between the periods 2001–2020 and 2011–2020, relative to the reference period of 1971–2000, exhibit certain variability. (Figure 8B). During the first decade, a slight increase was observed (up to 10–20%), whereas a slight decline occurred in the second decade (0–10%).
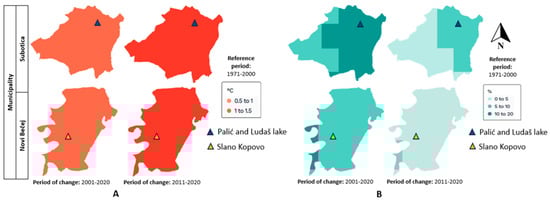
Figure 8.
(A) Observed daily average temperature changes for the two periods, 2001–2020 and 2011–2020, with a reference period of 1971–2000; (B) observed precipitation changes for the two periods, 2001–2020 and 2011–2020, with a reference period of 1971–2000; based on data from the Digital Climate and Climate Change Atlas of the Republic of Serbia [49].
Future climate projections for the daily average temperature (Figure 9A,B) show an increase in the case of both scenarios. However, the RCP4.5 scenario exhibits a lower increase 0.5–2.0 °C compared to the RCP8.5 scenario, which shows an increase of 0.5 up to 4 °C. The peak in the case of both scenarios is projected to be reached in the 2071–2100 period.
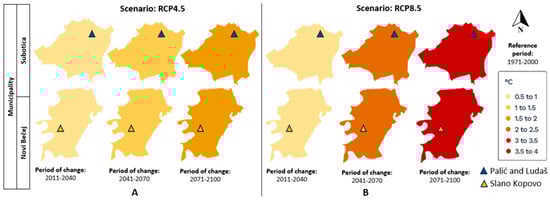
Figure 9.
(A) Future climate projections (changes) for daily average temperature for the three periods, 2011–2040, 2041–2070, and 2071–2100 with a reference period of 1971–2000 for the scenario RCP4.5 (mitigation); (B) future climate projections (changes) for daily average temperature for the three periods, 2011–2040, 2041–2070, and 2071–2100 with a reference period of 1971–2000 for the scenario RCP8.5 (no mitigation); based on data from the Digital Climate and Climate Change Atlas of the Republic of Serbia [49].
In the case of future climate projections (changes) for precipitation parameters (Figure 10A,B), variations among both periods and scenarios are more widespread, ranging from 0% to 20%.
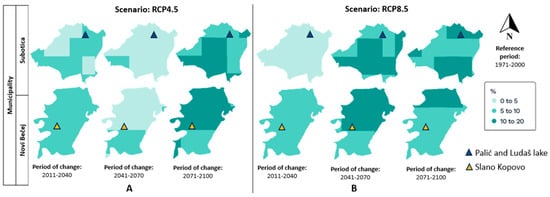
Figure 10.
(A) Future climate projections (changes) for precipitation for the three periods, 2011–2040, 2041–2070, and 2071–2100 with a reference period of 1971–2000 for the scenario RCP4.5 (mitigation); (B) future climate projections (changes) for precipitation for the three periods, 2011–2040, 2041–2070, and 2071–2100 with a reference period of 1971–2000 for the scenario RCP8.5 (mitigation); based on data from the Digital Climate and Climate Change Atlas of the Republic of Serbia [49].
Observed SPEI drought index changes for the two periods, 2001–2020 and 2011–2020, (reference period of 1971–2000), are prone to negative trends (dry events) in both cases (Figure 11A) ranging from −0.3 to <−1. This has been followed by a notable increase in the observed changes in the number of days with temperatures exceeding 35 °C for the periods 2001–2020 and 2011–2020 (reference period of 1971–2000), with variations ranging from 2 to 7 days (Figure 11B). Moreover, future climate projections for the SPEI drought index across three periods (2011–2040, 2041–2070, and 2071–2100) indicate a neutral to negative (dry events) under both scenarios (RCP4.5 and RCP8.5) (Figure 12A,B). The projections indicate that the SPEI index varies from −1 to 0 for the RCP4.5 scenario, while it ranges from −1.5 to 0 for the RCP8.5 scenario. Furthermore, future climate projections regarding the frequency of days over 35 °C throughout the three periods (2011–2040, 2041–2070, and 2071–2100) predict increased regional variability under both scenarios (RCP4.5 and RCP8.5) (Figure 13A,B). Nonetheless, the maximum number of days with temperatures over 35 °C attains up to 15 days under the RCP4.5 scenario and reach up to 25 days under the RCP8.5 scenario, which is considerably greater than previously recorded changes.
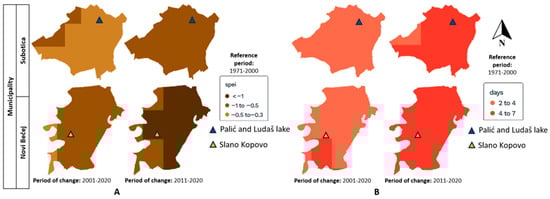
Figure 11.
(A) Observed SPEI drought index changes for the two periods, 2001–2020 and 2011–2020, with a reference period of 1971–2000; (B) observed days with temperatures above 35 °C changes for the two periods, 2001–2020 and 2011–2020, with a reference period of 1971–2000; based on data from the Digital Climate and Climate Change Atlas of the Republic of Serbia [49].
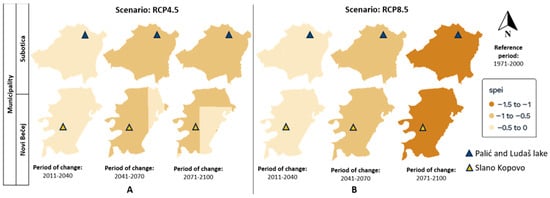
Figure 12.
(A) Future climate projections (changes) for the SPEI drought index for the three periods, 2011–2040, 2041–2070, and 2071–2100 with a reference period of 1971–2000 for the scenario RCP4.5 (mitigation); (B) future climate projections (changes) for the SPEI drought index for the three periods, 2011–2040, 2041–2070, and 2071–2100 with a reference period of 1971–2000 for the scenario RCP8.5 (mitigation); based on data from the Digital Climate and Climate Change Atlas of the Republic of Serbia [49].
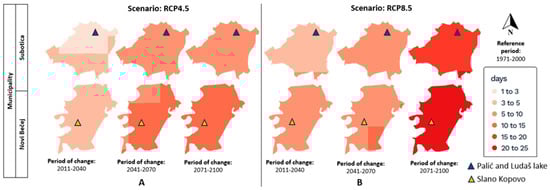
Figure 13.
(A) Future climate projections (changes) for days with temperatures above 35 °C for the three periods, 2011–2040, 2041–2070, and 2071–2100 with a reference period of 1971–2000 for the scenario RCP4.5 (mitigation); (B) future climate projections (changes) for days with temperatures above 35 °C for the three periods, 2011–2040, 2041–2070, and 2071–2100 with a reference period of 1971–2000 for the scenario RCP8.5 (mitigation); based on data from the Digital Climate and Climate Change Atlas of the Republic of Serbia [49].
4. Discussion
4.1. SOCS Patterns
Inland wetlands, particularly Ramsar Sites, have been largely overlooked in terms of carbon storage across various geographic locations, bioclimatic conditions, and human-induced pressures [29]. Distributions in carbon storage differ according to region, position, and wetland type [51]. Similarly, SOCS in researched wetlands showed variable values. Changes in carbon content in wetland habitats are influenced by environmental factors such as temperature, water level, and soil nutrients [52]. A considerable proportion of potential disturbances at Ramsar sites are not being managed in a sustainable manner, with concerning data indicating that management plans is currently lacking in 47–76% of these sites [29]. Elucidating different variations in carbon content is important both for an assessment of the role of wetland ecosystems in global climate change, and for a deep understanding of the mechanisms of changes in carbon accumulation in wetland ecosystems [53]. Prior studies have demonstrated that the vertical distribution of carbon in wetlands diminishes as soil depth increases [54,55,56]. However, our findings indicated that surveyed sites exhibited some variances in this aspect. Although SOCS generally declined with depth at the most sampled locations, there were several situations when SOCS value increased with depth. In addition, the topsoil (0–30 cm) generally contains substantially larger amounts of SOC than the subsoil (30–60 cm) [57]. Conversely, in several samples, SOCS decreased with depth, but not significantly as expected. This suggest that certain areas may have been affected by disturbances such as land use or unauthorized burning (widely practiced in this region). Nevertheless, some natural factors also need to be taken into account. As indicated by Baumgertel et al. [58], the studied region is an extremely susceptible area to wind erosion leading to significant soil losses. This may further partly explain the SOCS vertical distribution at some of the previously mentioned sampling sites, as the top layers of soil are mainly impacted by eolian erosion. However, while natural disturbances influence SOCS dynamics to a certain extent, 91% of carbon dynamics is linked to anthropogenic disturbances [59].
Ludaš and Palić lakes are shallow hypereutrophic lakes, while Slano Kopovo is saline lake (pond). While the Palić Lake locality showed the highest average SOCS values, the Ludaš Lake locality showed a slightly lower average value. Environmental, anthropogenic and possibly biological factors may contribute to this regional variation. In addition, spatial distribution and concentration of analyzed soil chemistry parameters may affect SOCS and cause observed variations in the case of the Palić and Ludaš Lake localities. Eutrophication can influence the development of plant communities and, in turn, impact the SOCS [60]. As recent research conducted by Caković et al. [37] highlights eutrophication trends in both lakes, this may further influence the SOCS. However, compared to these two hypereutrophic lakes, the Slano Kopovo locality has a significantly lower average amount of SOCS. The observed lower level of SOCS may indicate low vegetation growth and organic matter input, surpassing the influence of decreased decomposition rates [61,62]. Additionally, it is projected that salinity will reduce the overall global carbon storage over time [63].
Comparison of SOCS among worldwide wetland ecosystems might be challenging due to various factors. These factors include differences in dataset, different soil depths, different regions, climate, and landscape settings. Taking these factors into account, a recent comprehensive meta-analysis of wetland SOCS (especially for Ramsar sites) by Nath et al. [29] provides a stepping stone for potential comparison by analyzing SOCS at 0–30 cm and 0–100 cm. According to this overview, the mean SOCS values for the Ludaš Lake (approximately 81 t·ha−1) and Palić Lake localities (approximately 82 t·ha−1) are higher than both the European mean (61.2 t·ha−1) and the overall global mean (63.8 t·ha−1) for inland wetlands at 0–30 cm depth. This may indicate that the top layer (0–30 cm) of these two localities could potentially be a more effective carbon sink. On the other hand, the mean SOCS for the Slano Kopovo locality (about 36 t·ha−1) at 0–30 cm is lower than the European and global mean values. This indicates that Slano Kopovo may have a lower capacity for surface SOC accumulation and has been subject to certain factors and disturbances that have reduced its SOCS within the topsoil layer. Due to the lack of a relevant global overview of Ramsar Sites wetlands’ SOCS at 0–60 cm and 30–60 cm, a valid comparison is inadequate in this context, and any attempts at comparison could lead to potentially misleading evaluations. In addition, potential case-to-case comparison might have significant limitations in terms of different settings.
4.1.1. SOCS According to Vegetation/Habitat Type
The observed variation in SOCS across the studied habitats reflects the complex interplay among vegetation composition of three wetlands. The highest SOCS values were found in mixed pedunculate oak forests, where abundant organic matter inputs and favorable conditions for balanced decomposition promote enhanced carbon storage in the soil. In contrast, Pannonian salt meadows exhibited lower SOCS, likely due to saline influences and frequent flooding events that limit primary productivity and alter microbial activity, thereby constraining carbon retention [64]. Intermediate SOCS levels in the Pannonian sand steppes with interspersed oak forests suggest a mosaic of ecological conditions where both grassland and forest elements contribute to soil carbon dynamics. The relatively low SOCS recorded in South Pannonian herb-grass steppes aligns with expectations for more aerated soils, which facilitate faster organic matter decomposition and turnover. Collectively, these patterns underscore the importance of habitat-specific environmental factors in shaping SOCS and highlight the spatial heterogeneity inherent in wetland ecosystems. In addition, while the enhancement of vegetation cover may be beneficial for increasing SOC [65], hydrological regime serves as the significant driver of carbon storage in wetlands [66]. Thus, management strategies should incorporate both vegetation and hydrological factors in order to preserve and aid sustainable carbon storage while maintaining ecological integrity in wetland ecosystems.
4.1.2. SOCS According to RSG
The observed variation in SOCS among different RSGs across the three wetlands highlights the significant role of soil physical properties and moisture regimes in carbon stabilization and accumulation [67]. Soils classified as Calcic Chernozems tended to have higher SOCS, likely due to their fertile and well-structured profiles that facilitate organic matter retention. These SOCS patterns across the three wetlands align with trends, as Chernozem-type soils have been identified as significant reservoirs of SOC in Serbia [68]. In contrast, Protic Arenosols exhibited greater variability in SOCS, which may be attributed to their coarse texture and fluctuating moisture conditions that can accelerate organic matter decomposition. This variability aligns with findings reported by Vidojević et al. [68], indicating that Arenosols exhibited the lowest mean SOC among the main RSGs in Serbia. In addition, the capacity of soils to store SOC is significantly affected by their clay content, as clay particles safeguard organic matter from decomposition and boost carbon stability [69]. This point is reflected in the higher SOCS found in Chernozems, which are characterized by a higher proportion of clay and silt. In contrast, Arenosols, characterized by sand-sized particles and low clay content, exhibited lower and more variable SOCS.
Albic Planosol (Sodic) showed intermediate SOCS values, possibly reflecting the influence of restricted drainage and resulting anaerobic conditions that favor the preservation of SOC [70]. Lower SOCS levels observed in Mollic Gleysols could be linked to specific hydrological patterns and land management practices that impact carbon inputs and losses. Overall, these patterns underscore the complex interplay between soil texture, hydrology, and land use in shaping soil carbon dynamics across diverse RSGs.
4.2. Spatial Analysis and Assessment
This study presents a comprehensive spatial analysis of soil chemistry parameters (pH, humus, P2O5, and K2O), offering valuable insights into the environmental status and anthropogenic pressures shaping the soil chemistry. Each of these parameters serve as a geochemical indicator of nutrient cycling, pollution levels, and hydrological dynamics.
The findings indicate significant spatial heterogeneity across both lakes’ localities, with clear zonation patterns aligned with lakes’ hydrodynamic activity, and land use impacts. The pH distribution demonstrates the predominantly alkaline nature of both localities, with the Palić Lake locality exhibiting extreme alkalinity in western zones. This suggests the influence of evaporative concentration, agricultural lime input, or industrial discharge, which can affect nutrient solubility and metal mobility. Meanwhile, humus content varies strongly with organic inflows, hydrodynamics, and microbial activity, revealing ecological gradients critical for soil fertility and carbon cycling. In both localities, the southern and southeastern sectors exhibit elevated levels of P2O5 and K2O, pointing to intensive agricultural runoff, sediment trapping, and organic matter accumulation. These areas function as nutrient sinks and are particularly vulnerable to eutrophication and ecological degradation if unmanaged. Conversely, central localities of lake corridors reveal transitional geochemical conditions, likely shaped by dynamic water flow that inhibits long-term sedimentation and nutrient retention.
For the Slano Kopovo locality, the analysis reveals spatial soil chemistry patterns. Sampling points that are closer to the water body usually have higher pH values. This trend indicates the impact from the saline water body, which may enhance alkalinity, in accordance with findings in other salt-influenced regions [71]. The humus content has an increasing pattern with increased distance from the water body. The observed pattern indicates that the accumulation of organic matter in soils near the saline water body may be less pronounced. This may be attributed to factors such as periodic drought, flooding, increased salinity, and diminished vegetation cover, which can all restrict the input of organic matter. The distribution of P2O5 content exhibits lower concentrations near the water body. The observed spatial variation in P2O5 could be shaped by the changes during land use histories, which affect the cycling and retention of phosphorus in the soil [72].
The distribution and dynamics of SOC in wetland soils are closely linked to spatial variations in soil chemical parameters, such as pH, organic matter, and nutrient availability [73]. Alterations in these parameters impact microbial activity, plant productivity, and organic matter decomposition, hence affecting SOC accumulation and further dynamics [74]. Through the mapping of these variations, this study emphasizes the chemical influences on SOC stocks, which are important for predicting carbon sequestration potential and advising soil management approaches. Importantly, this research highlights the critical value of GIS-based analysis [75] in understanding soil dynamics and environmental vulnerability in wetland ecosystems, reinforcing its applicability for ongoing environmental monitoring, conservation planning, and policy-making. Moreover, continuous soil sampling and temporal monitoring using remote sensing and in situ data should be integrated into future studies to detect trends and improve predictive models.
The spatial patterns of LULC surrounding the studied wetlands reveal landscapes predominantly shaped by agricultural activities. These LULC characteristics likely influence SOC dynamics through their effects on vegetation inputs, soil disturbance regimes, and hydrological conditions. Intensive agriculture and urbanization associated with higher built-up and cropland percentages can lead to reduced carbon inputs and increased soil disturbance; factors generally linked to lower SOCS [76,77]. Conversely, the greater presence of natural vegetation buffers may promote organic matter accumulation and preserve SOC stocks, which would be particularly beneficial in the case of the Slano Kopovo locality considering the saline character of this wetland. Overall, these findings underscore the importance of incorporating detailed LULC information when interpreting soil carbon distribution patterns in wetland landscapes. Despite the protection of these wetlands, agricultural influence is apparent, requiring specific strategies for reducing its impact. Recent findings by Mavsar et al. [21], which analyze the impact of different LULC on SOC, may provide valuable insights for adjusting land use management practices to enhance SOC dynamics.
4.3. Climate Observations and Climate Change Projections Assessment
The observed climate data demonstrate a clear warming trend in the study region over recent periods, accompanied by variable precipitation patterns. Future projections under both RCP4.5 and RCP8.5 scenarios indicate continued temperature increases and uncertain precipitation changes, which together suggest heightened climatic stress for the wetlands. Drying trends indicated by the SPEI drought index, particularly under the RCP8.5 scenario, suggest increasing frequency and intensity of drought events. Additionally, the projected rise in the number of days with temperatures exceeding 35 °C is likely to impose stress on wetland ecosystems. Furthermore, these climatic changes may have important implications for SOCS in these wetlands. Higher temperatures and increased drought conditions can accelerate organic matter decomposition by reducing soil moisture and increasing aerobic activity, potentially leading to SOC losses [78,79]. Warmer temperatures, longer periods of days with temperatures exceeding 35 °C along with drought events may particularly affect SOC not just directly, but also indirectly. Indirect effects include a higher probability of wildfires often linked to human-induced disturbances, and even illegal prescribed burning. This may further lead carbon emissions back to the atmosphere and reduce SOC in these wetlands. This could be particularly important as a recent study by Li et al. [80] indicates a substantial loss of SOC due to the wildfire in wetlands, highlighting the necessity for monitoring of post-fire methane emissions. In addition, assessment of fuel loads should be considered in wildfire management and for understanding the dynamics of carbon release [81]. Furthermore, variability in precipitation may also disrupt hydrological regimes crucial for maintaining wetland carbon sequestration capacity. Overall, the combination of warming, variable precipitation patterns, drought events, and increased heat extremes poses significant risks to wetland ecosystems function and carbon storage. This highlights the necessity for adaptive management to maintain SOC in these ecosystems amidst changing climate conditions.
The outcomes of this study have significance for informing wetland conservation and policy at both local and global levels. These findings advocate for the incorporation of SOCS monitoring and climate adaption strategies into national wetland management frameworks to enhance ecosystem resilience and comply to international conservation commitments.
4.4. Integrated Assessment
The integrated examination of SOCS at various depths, soil chemistry parameters, LULC, and climate demonstrates complex and spatially variable soil processes. This integrated viewpoint facilitates a profound comprehension of the factors influencing SOC storage and distribution, along with the identification of disturbed spots within these ecosystems. Landscapes characterized by natural vegetation cover, including forests, shrubs, and grasslands, consistently demonstrate higher humus content and improved soil chemical properties, such as moderate pH, and sufficient nutrient levels. These factors combined lead to increased SOCS, especially in the upper soil layers. The prevalence of cropland and urban areas correlates with indicators of soil disturbance, increased alkalinity or salinity, and decreased humus content [82]. These factors combined lead to reduced SOCS and, in certain instances, unexpected profiles characterized by higher carbon content at deeper soil layers compared to the top layers. Such patterns frequently indicate recent surface disturbances, erosion, or management-induced mixing, highlighting the susceptibility of agricultural and anthropogenically influenced areas to SOCS degradation. The integration of these factors indicates that landscape-scale SOCS dynamics are closely associated with the preservation of natural vegetation patches and the maintenance of conducive soil chemical conditions. Land use and climate factors have a significant influence on SOCS in the upper layers (especially 0–30 cm) [83], with SOCS in these layers being perceived as the most vulnerable [84]. Effective carbon management in heterogeneous systems necessitates the protection of existing high-carbon areas alongside targeted interventions, especially in regions where climate effect and land use intensity might jeopardize surface SOC pools.
4.5. Potential Study Limitations and Future Perspectives
Estimating SOCS in protected Ramsar Sites involves challenges, particularly regarding the estimation of bulk density. Different observations have come to various conclusions: not measuring bulk density and rock fragments—potential SOCS overestimation [85]; not accounting that rock fragments contain carbon—potential SOCS underestimation [86]. In addition, recent research by Panagos et al. [87] related to soil bulk density assessment in Europe also highlights various advantages and limitations of different methodologies. This could further imply that in either case, some errors are expected. Moreover, there is no universally agreed upon method to determine the bulk density [88].
Despite the perceived precision of field-measured bulk density, numerous studies have revealed its significant limitations. These limitations include high cost, labor intensity, time consumption, proneness to disturbance, destructiveness, placing pressure on the operator, and challenges in controlling the quality of collected data [89,90]. Among the aforementioned limitations, the disturbance and destructiveness of this methodology were the major reasons why its use was discouraged and not applied in our research, given that the study sites were protected areas. However, to ensure reliability, we validated the Adams [44] model in our study using 17 control samples, as previously described in methodology. In addition, in a detailed review by De Vos et al. [91], it was concluded that the model developed by Adams [44] exhibited the highest predictive capacity. Our approach is further supported by the findings of Kabała & Gałka [92], which indicate that organic carbon alone can reliably predict soil bulk density. In our study, the sampled soils exhibit a low content of rock fragments, suggesting that the potential overestimation of SOC may be low.
The approach strategies were influenced by site-specific constraints and the most suitable available techniques. Future research will require the development of innovative, non-destructive (environmentally friendly), cost-effective, and sufficiently precise methods for assessing bulk density and SOCS, especially in protected ecosystems such as Ramsar sites.
5. Conclusions
This study reveals significant spatial variability in SOCS and key soil chemistry parameters within the eutrophic and saline wetlands. The findings indicated significant variation in mean SOCS across different sites and depths, with Palić Lake presenting the highest values and Slano Kopovo the lowest. Regional increases in SOCS at deeper layers indicate past disturbances, while spatial analysis reveals predominantly alkaline conditions, with extreme alkalinity observed in certain areas of Palić Lake. Increased concentrations of P2O5 and K2O in certain regions of Palić and Ludaš Lakes were linked to agricultural runoff, indicating susceptibility to eutrophication.
SOCS was highest in mixed pedunculate oak forests and Calcic Chernozem soils, in contrast to lower values observed in Pannonian salt meadows and Protic Arenosols, highlighting the significant impact of vegetation and RSG. The integrated assessment showed that natural vegetation is linked to higher SOCS, while croplands are linked to lower SOCS. This implies that human-induced disturbances play a significant role in carbon dynamics. Additionally, climatic trends such as warming, varying precipitation, and heightened drought frequency in the region, alongside recognized anthropogenic pressures, highlight the increased vulnerability of wetland SOCS.
This multidisciplinary study offers novel insights into various factors influencing SOCS in inland wetlands. This research integrates ecological, geochemical, and climatic aspects to demonstrate how land use effects in the vicinity of wetlands, along with projected climate stressors such as warming and variable precipitation, increase vulnerabilities for SOCS. The findings enhance wetland carbon science through an integrated assessment focused on saline-eutrophic systems, highlighting the importance of a cross-disciplinary approach for the effective preservation of SOCS. The findings provide significant, spatially specific insights for conservation, decision-making, and future research on SOCS evaluation in these and other wetland ecosystems.
Supplementary Materials
The following supporting information can be downloaded at https://www.mdpi.com/article/10.3390/w18010016/s1, Table S1: ANOVA single factor analysis for SOCS for Ludaš lake, Palić lake and Slano Kopovo localities (0–30 cm); Table S2: ANOVA Post-Hoc Test (Bonferroni Correction) for SOCS for Ludaš lake, Palić lake and Slano Kopovo localities (0–30 cm); Table S3: ANOVA single factor analysis for SOCS for Ludaš lake, Palić lake and Slano Kopovo localities (30–60 cm); Table S4: ANOVA Post-Hoc Test (Bonferroni Correction) for SOCS for Ludaš lake, Palić lake and Slano Kopovo localities (30–60 cm); Table S5: ANOVA single factor analysis for SOCS for Ludaš lake, Palić lake and Slano Kopovo localities (0–60 cm); Table S6: ANOVA Post-Hoc Test (Bonferroni Correction) for SOCS for Ludaš lake, Palić lake and Slano Kopovo localities (0–60 cm); Table S7: ANOVA single factor analysis for SOCS (0–60 cm) shown in regard to habitat/vegetation type (EUNIS code); Table S8: ANOVA Post-Hoc Test (Bonferroni Correction) for SOCS shown in regard to habitat/vegetation type (EUNIS code); Table S9: ANOVA single factor analysis for SOCS (0–60 cm) shown in regard to RSG (WRB classification); Table S10: T-test analysis for SOCS for Ludaš lake, Palić lake, and Slano Kopovo localities (0–30 cm vs. 30–60 cm); Table S11: T-test analysis for SOCS for 14 specific sample points (L4, L9, L10, L11, L12, L17, P5, P10, P12, P15, P17, P19, P20, and SK3) from Ludaš lake, Palić lake, and Slano Kopovo localities (0–30 cm vs. 30–60 cm) in which SOCS decrease with depth was not as expected; Figure S1: Study site locations with marked soil sampling points: Blue points—SOCS decreases with depth; Yellow points—SOCS decreases with depth but not as significant as expected; Red points—SOCS increases with depth; Figure S2: SOCS for Palić lake locality (0–30 cm and 30–60 cm); Figure S3: SOCS for Ludaš lake locality (0–30 cm and 30–60 cm); Figure S4: SOCS for Slano Kopovo locality (0–30 cm and 30–60 cm).
Author Contributions
Conceptualization, F.V., S.B.-S., J.B., D.Č., and P.M.; methodology, F.V., S.B.-S., J.B., D.Č., and P.M.; software, F.V.; investigation, F.V.; resources, F.V., S.B.-S., J.B., D.Č., and P.M.; data curation, F.V., J.B., D.Č., and P.M.; writing—original draft preparation, F.V.; writing—review and editing, S.B.-S., J.B., D.Č., J.K., C.P., C.D., N.J., and P.M.; visualization, F.V., J.B., C.P., and C.D.; supervision, S.B.-S., J.B., D.Č., J.K., and P.M. All authors have read and agreed to the published version of the manuscript.
Funding
This research was funded by the project “Biodiversity and Water Protection Lake Palić and Lake Ludaš” from KfW Entwicklungsbank, under BMZ-No 2015 67 098 and 2015 70 043. The results were supported by The Ministry of Science, Technological Development and Innovation of the Republic of Serbia (grant no. 451-03-137/2025-03/200169 and 451-03-136/2025-03/200169).
Data Availability Statement
Climate data was obtained from the Digital Climate Atlas of Serbia (https://atlas-klime.eko.gov.rs/, accessed on 2 December 2025). Land use/land cover (LULC) data was obtained from the Dynamic World dataset (https://dynamicworld.app/, accessed on 2 December 2025). Other data from this study can be obtained upon request from the authors.
Acknowledgments
We would like to express our gratitude to Alevtina Evgrafova, Milica Caković, Aleksandar Valjarević, and Palaiologos Palaiologou for their insightful comments and suggestions. In addition, we acknowledge the use of QuillBot for English editing and text polishing, following responsible principles in scientific writing.
Conflicts of Interest
Filip Vasić and Nikola Jovanović are employees of MDPI but did not work for the journal Water during the preparation, submission, or publication of this article.
References
- Marton, J.M.; Creed, I.F.; Lewis, D.B.; Lane, C.R.; Basu, N.B.; Cohen, M.J.; Craft, C.B. Geographically Isolated Wetlands Are Important Biogeochemical Reactors on the Landscape. BioScience 2015, 65, 408–418. [Google Scholar] [CrossRef]
- Bernal, B.; Mitsch, W.J. Comparing Carbon Sequestration in Temperate Freshwater Wetland Communities. Glob. Change Biol. 2012, 18, 1636–1647. [Google Scholar] [CrossRef]
- Helbig, M.; Chasmer, L.E.; Kljun, N.; Quinton, W.L.; Treat, C.C.; Sonnentag, O. The Positive Net Radiative Greenhouse Gas Forcing of Increasing Methane Emissions from a Thawing Boreal Forest-wetland Landscape. Glob. Change Biol. 2017, 23, 2413–2427. [Google Scholar] [CrossRef] [PubMed]
- Zeng, Y.; Wang, K.; Yao, J.; Wang, H. Hollow Carbon Beads for Significant Water Evaporation Enhancement. Chem. Eng. Sci. 2014, 116, 704–709. [Google Scholar] [CrossRef]
- Villa, J.A.; Bernal, B. Carbon Sequestration in Wetlands, from Science to Practice: An Overview of the Biogeochemical Process, Measurement Methods, and Policy Framework. Ecol. Eng. 2018, 114, 115–128. [Google Scholar] [CrossRef]
- Köchy, M.; Don, A.; Van Der Molen, M.K.; Freibauer, A. Global Distribution of Soil Organic Carbon–Part 2: Certainty of Changes Related to Land Use and Climate. Soil 2015, 1, 367–380. [Google Scholar] [CrossRef]
- Yu, Z.C. Northern Peatland Carbon Stocks and Dynamics: A Review. Biogeosciences 2012, 9, 4071–4085. [Google Scholar] [CrossRef]
- Lane, R.R.; Mack, S.K.; Day, J.W.; DeLaune, R.D.; Madison, M.J.; Precht, P.R. Fate of Soil Organic Carbon During Wetland Loss. Wetlands 2016, 36, 1167–1181. [Google Scholar] [CrossRef]
- Stewart, A.J.; Halabisky, M.; Babcock, C.; Butman, D.E.; D’Amore, D.V.; Moskal, L.M. Revealing the Hidden Carbon in Forested Wetland Soils. Nat. Commun. 2024, 15, 726. [Google Scholar] [CrossRef]
- Brix, H.; Sorrell, B.K.; Lorenzen, B. Are Phragmites-Dominated Wetlands a Net Source or Net Sink of Greenhouse Gases? Aquat. Bot. 2001, 69, 313–324. [Google Scholar] [CrossRef]
- Teiter, S.; Mander, Ü. Emission of N2O, N2, CH4, and CO2 from Constructed Wetlands for Wastewater Treatment and from Riparian Buffer Zones. Ecol. Eng. 2005, 25, 528–541. [Google Scholar] [CrossRef]
- Hernandez, M.E.; Mitsch, W.J. Denitrification Potential and Organic Matter as Affected by Vegetation Community, Wetland Age, and Plant Introduction in Created Wetlands. J. Environ. Qual. 2007, 36, 333–342. [Google Scholar] [CrossRef] [PubMed]
- Thiere, G.; Stadmark, J.; Weisner, S.E.B. Nitrogen Retention versus Methane Emission: Environmental Benefits and Risks of Large-Scale Wetland Creation. Ecol. Eng. 2011, 37, 6–15. [Google Scholar] [CrossRef]
- Mitsch, W.J.; Gosselink, J.G. Wetlands, 5th ed.; John Wiley and Sons, Inc.: Hoboken, NJ, USA, 2015; ISBN 978-1-119-01978-7. [Google Scholar]
- IPCC. 2023: Summary for Policymakers. In Climate Change 2023: Synthesis Report; Contribution of Working Groups I, II and III to the Sixth Assessment Report of the Intergovernmental Panel on Climate Change; Lee, H., Romero, J., Eds.; IPCC: Geneva, Switzerland, 2023; pp. 1–34. [Google Scholar] [CrossRef]
- Paul, C.; Fealy, R.; Fenton, O.; Lanigan, G.; O’Sullivan, L.; Schulte, R.P.O. Assessing the Role of Artificially Drained Agricultural Land for Climate Change Mitigation in Ireland. Environ. Sci. Policy 2018, 80, 95–104. [Google Scholar] [CrossRef]
- Mitsch, W.J.; Bernal, B.; Nahlik, A.M.; Mander, Ü.; Zhang, L.; Anderson, C.J.; Jørgensen, S.E.; Brix, H. Wetlands, Carbon, and Climate Change. Landsc. Ecol. 2013, 28, 583–597. [Google Scholar] [CrossRef]
- Bassi, N.; Kumar, M.D.; Sharma, A.; Pardha-Saradhi, P. Status of Wetlands in India: A Review of Extent, Ecosystem Benefits, Threats and Management Strategies. J. Hydrol. Reg. Stud. 2014, 2, 1–19. [Google Scholar] [CrossRef]
- Sarkar, U.K.; Bakshi, S.; Lianthuamluaia, L.; Mishal, P.; Das Ghosh, B.; Saha, S.; Karnatak, G. Understanding Enviro-Climatological Impact on Fish Biodiversity of the Tropical Floodplain Wetlands for Their Sustainable Management. Sustain. Water Resour. Manag. 2020, 6, 96. [Google Scholar] [CrossRef]
- Lu, M.; Zou, Y.; Xun, Q.; Yu, Z.; Jiang, M.; Sheng, L.; Lu, X.; Wang, D. Anthropogenic Disturbances Caused Declines in the Wetland Area and Carbon Pool in China during the Last Four Decades. Glob. Change Biol. 2021, 27, 3837–3845. [Google Scholar] [CrossRef]
- Mavsar, S.; Grčman, H.; Turniški, R.; Mihelič, R. Organic Carbon Sequestration Potential of Slovenian Agricultural Soil and the Impact of Management Practices on SOC Stock. Cogent Food Agric. 2025, 11, 2437574. [Google Scholar] [CrossRef]
- Finlayson, C. Forty Years of Wetland Conservation and Wise Use. Aquat. Conserv. 2012, 22, 139–143. [Google Scholar] [CrossRef]
- Finlayson, C.M.; Capon, S.J.; Rissik, D.; Pittock, J.; Fisk, G.; Davidson, N.C.; Bodmin, K.A.; Papas, P.; Robertson, H.A.; Schallenberg, M.; et al. Policy Considerations for Managing Wetlands under a Changing Climate. Mar. Freshw. Res. 2017, 68, 1803. [Google Scholar] [CrossRef]
- Milentijević, N.; Valjarević, A.; Bačević, N.R.; Ristić, D.; Kalkan, K.; Cimbaljević, M.; Dragojlović, J.; Savić, S.; Pantelić, M. Assessment of Observed and Projected Climate Changes in Bačka (Serbia) Using Trend Analysis and Climate Modeling. Időjárás 2022, 126, 47–68. [Google Scholar] [CrossRef]
- Were, D.; Kansiime, F.; Fetahi, T.; Cooper, A.; Jjuuko, C. Carbon Sequestration by Wetlands: A Critical Review of Enhancement Measures for Climate Change Mitigation. Earth Syst. Environ. 2019, 3, 327–340. [Google Scholar] [CrossRef]
- Ramsar Convention Secretariat. The Convention on Wetlands. Available online: https://www.ramsar.org/ (accessed on 12 December 2025).
- Ramsar Convention Secretariat. Appendix 7. Ramsar Wetland Definition, Classification and Criteria for Internationally Important Wetlands. Available online: https://rmi-data.sprep.org/system/files/RMI%20Ramsar%20Sites_appendix7.pdf (accessed on 28 September 2025).
- Ermolieva, T.; Havlik, P.; Lessa-Derci-Augustynczik, A.; Frank, S.; Balkovic, J.; Skalsky, R.; Deppermann, A.; Nakhavali, M.A.; Komendantova, N.; Kahil, T.; et al. Tracking the Dynamics and Uncertainties of Soil Organic Carbon in Agricultural Soils Based on a Novel Robust Meta-Model Framework Using Multisource Data. Sustainability 2024, 16, 6849. [Google Scholar] [CrossRef]
- Nath, A.J.; Sileshi, G.W.; Bania, J.K.; Nath, A. Threats to Inland Wetlands and Uncertainty around Global Soil Carbon Stocks and Sequestration Rates. Sci. Total Environ. 2024, 955, 177190. [Google Scholar] [CrossRef]
- Ramsar Convention Secretariat. Country Profile: Serbia. Available online: https://www.Ramsar.Org/Country-Profile/Serbia (accessed on 28 September 2025).
- Ramsar Sites Information Service. Available online: https://rsis.ramsar.org/ (accessed on 28 September 2025).
- European Environment Agency. EUNIS Habitat Classification. Available online: https://www.eea.europa.eu/en/datahub/datahubitem-view/ce3e4bf4-e929-404a-88c7-37f2c614fd1d (accessed on 28 September 2025).
- Bohn, U.; Neuhäusl, R.; Gollub, G.; Hettwer, C.; Neuhäuslová, Z.; Raus, T.; Schlüter, H.; Weber, H. Karte der Natürlichen Vegetation Europas/Map of the Natural Vegetation of Europe; Scale 1:2,500,000; Landwirtschaftsverlag: Münster, Germany, 2000. [Google Scholar]
- IUSS Working Group WRB. World Reference Base for Soil Resources, 4th ed.; International Soil Classification System for Naming Soils and Creating Legends for Soil Maps; International Union of Soil Sciences (IUSS): Vienna, Austria, 2022. [Google Scholar]
- Janković, M. Study on Geotechnical Conditions of Construction Bicycle Trails around Palić Lake; Vuma Studio: Kraljevo, Serbia, 2019; (phase: Part of Project documentation; project “Biodiversity and Water Protection Lake Palić and Lake Ludaš”). [Google Scholar]
- Nature Park “Palić”. Proposal for Protection as a Protected Area of III Category—Protection Study; Institute for Nature Conservation of Vojvodina Province: Novi Sad, Serbia, 2011.
- Caković, M.; Beloica, J.; Baumgertel, A.; Stojčić, M.; Vasić, F.; Schwaiger, F. Eutrophication Assessment in Pannonian Basin (the Case of Ludaš Lake Special Nature Reserve and Palić Nature Park). Environ. Monit. Assess. 2023, 195, 694. [Google Scholar] [CrossRef] [PubMed]
- Ramsar Convention Secretariat. Ramsar Information Sheet: Slano Kopovo (RS1392). Available online: https://rsis.ramsar.org/ris/1392?__goaway_challenge=resource-load&__goaway_id=eed5d69bea7a2179b679a360d47ac67e&__goaway_referer=https%3A%2F%2Fwww.google.com%2F (accessed on 28 September 2025).
- Yugoslav Society for Soil Research. Study Methods for Soil Physical Properties; Yugoslav Society for Soil Research: Belgrade, Serbia, 1997. [Google Scholar]
- ISO 10390:2007; Soil Quality—Determination of pH. International Organization for Standardization: Vernier, Switzerland, 2007.
- ISO 10694:2005; Soil Quality—Determination of Organic and Total Carbon After Dry Combustion (Elementary Analysis). International Organization for Standardization: Vernier, Switzerland, 2005.
- ISO 11263:2016; Soil Quality—Determination of Phosphorus—Spectrometric Determination of Phosphorus Soluble in Sodium Hydrogen Carbonate Solution. International Organization for Standardization: Vernier, Switzerland, 2016.
- Stolbovoy, V.; Filippi, N.; Montanarella, L. Soil Sampling Protocol to Certify the Changes of Organic Carbon Stock in Mineral Soil of the European Union: Version 2; Publications Office: Luxembourg, 2007. [Google Scholar]
- Adams, W.A. The Effect of Organic Matter on the Bulk and True Densities of Some Uncultivated Podzolic Soils. J. Soil Sci. 1973, 24, 10–17. [Google Scholar] [CrossRef]
- Chen, Y.; Huang, Y.; Sun, W. Using Organic Matter and pH to Estimate the Bulk Density of Afforested/Reforested Soils in Northwest and Northeast China. Pedosphere 2017, 27, 890–900. [Google Scholar] [CrossRef]
- Mann, L.K. Changes in Soil Carbon Storage After Cultivation. Soil Sci. 1986, 142, 279–288. [Google Scholar] [CrossRef]
- Dynamic World Platform. Google; World Resources Institute. Available online: https://Dynamicworld.App/ (accessed on 28 September 2025).
- Brown, C.F.; Brumby, S.P.; Guzder-Williams, B.; Birch, T.; Hyde, S.B.; Mazzariello, J.; Czerwinski, W.; Pasquarella, V.J.; Haertel, R.; Ilyushchenko, S.; et al. Dynamic World, Near Real-Time Global 10 m Land Use Land Cover Mapping. Sci. Data 2022, 9, 251. [Google Scholar] [CrossRef]
- Ministry for Environmental Protection. Digital Climate and Climate Change Atlas of the Republic of Serbia. Project Advancing Medium and Long-Term Adaptation Planning in the Republic of Serbia. 2022. Available online: https://Atlas-Klime.Eko.Gov.Rs (accessed on 1 December 2025).
- Donmez, C.; Berberoglu, S.; Cilek, A.; Krause, P. Basin-Wide Hydrological System Assessment under Climate Change Scenarios through Conceptual Modelling. Int. J. Digit. Earth 2019, 13, 915–938. [Google Scholar] [CrossRef]
- Nahlik, A.M.; Fennessy, M.S. Carbon Storage in US Wetlands. Nat. Commun. 2016, 7, 13835. [Google Scholar] [CrossRef]
- Wilkinson, G.M.; Besterman, A.; Buelo, C.; Gephart, J.; Pace, M.L. A Synthesis of Modern Organic Carbon Accumulation Rates in Coastal and Aquatic Inland Ecosystems. Sci. Rep. 2018, 8, 15736. [Google Scholar] [CrossRef]
- Comer-Warner, S.A.; Nguyen, A.T.Q.; Nguyen, M.N.; Wang, M.; Turner, A.; Le, H.; Sgouridis, F.; Krause, S.; Kettridge, N.; Nguyen, N.; et al. Restoration Impacts on Rates of Denitrification and Greenhouse Gas Fluxes from Tropical Coastal Wetlands. Sci. Total Environ. 2022, 803, 149577. [Google Scholar] [CrossRef]
- Yang, Y.; Mou, X.; Wen, B.; Liu, X. Soil Carbon, Nitrogen and Phosphorus Concentrations and Stoichiometries Across a Chronosequence of Restored Inland Soda Saline- Alkali Wetlands, Western Songnen Plain, Northeast China. Chin. Geogr. Sci. 2020, 30, 934–946. [Google Scholar] [CrossRef]
- Qi, Q.; Zhang, D.; Zhang, M.; Tong, S.; Wang, W.; An, Y. Spatial Distribution of Soil Organic Carbon and Total Nitrogen in Disturbed Carex Tussock Wetland. Ecol. Indic. 2021, 120, 106930. [Google Scholar] [CrossRef]
- Lei, D.; Jiang, L.; Wu, X.; Liu, W.; Huang, R. Soil Organic Carbon and Its Controlling Factors in the Lakeside of West Mauri Lake along the Wetland Vegetation Types. Processes 2022, 10, 765. [Google Scholar] [CrossRef]
- Wu, Y.; Wang, F.; Zhu, S. Vertical Distribution Characteristics of Soil Organic Carbon Content in Caohai Wetland Ecosystem of Guizhou Plateau, China. J. For. Res. 2016, 27, 551–556. [Google Scholar] [CrossRef]
- Baumgertel, A.; Lukić, S.; Belanović Simić, S.; Kadović, R. Identifying Areas Sensitive to Wind Erosion—A Case Study of the AP Vojvodina (Serbia). Appl. Sci. 2019, 9, 5106. [Google Scholar] [CrossRef]
- Chen, B.; Zhang, M.; Yang, R.; Tang, W. Spatiotemporal Variations in the Carbon Sequestration Capacity of Plateau Lake Wetlands Regulated by Land Use Control under Policy Guidance. Land 2023, 12, 1695. [Google Scholar] [CrossRef]
- Luo, H.; Liu, S.; Ren, Y.; Jiang, Z.; Wu, Y.; Zhang, X.; Li, J.; Huang, X. Eutrophication Decreases Halophila Beccarii Plant Organic Carbon Contribution to Sequestration Potential. Front. Mar. Sci. 2022, 9, 986415. [Google Scholar] [CrossRef]
- Zhao, Q.; Bai, J.; Lu, Q.; Zhang, G. Effects of Salinity on Dynamics of Soil Carbon in Degraded Coastal Wetlands: Implications on Wetland Restoration. Phys. Chem. Earth Parts A/B/C 2017, 97, 12–18. [Google Scholar] [CrossRef]
- Lekka, C.; Petropoulos, G.P.; Triantakonstantis, D.; Detsikas, S.E.; Chalkias, C. Exploring the Spatial Patterns of Soil Salinity and Organic Carbon in Agricultural Areas of Lesvos Island, Greece, Using Geoinformation Technologies. Environ. Monit. Assess. 2023, 195, 391. [Google Scholar] [CrossRef]
- Setia, R.; Gottschalk, P.; Smith, P.; Marschner, P.; Baldock, J.; Setia, D.; Smith, J. Soil Salinity Decreases Global Soil Organic Carbon Stocks. Sci. Total Environ. 2013, 465, 267–272. [Google Scholar] [CrossRef]
- Zhang, W.; Zhang, W.; Liu, Y.; Zhang, J.; Yang, L.; Wang, Z.; Mao, Z.; Qi, S.; Zhang, C.; Yin, Z. The Role of Soil Salinization in Shaping the Spatio-Temporal Patterns of Soil Organic Carbon Stock. Remote Sens. 2022, 14, 3204. [Google Scholar] [CrossRef]
- Razzaghi, S. Unraveling the Impact of Diverse Vegetative Covers on Soil Carbon Fractions. Sustainability 2025, 17, 1080. [Google Scholar] [CrossRef]
- Feng, J.; Liang, J.; Li, Q.; Zhang, X.; Yue, Y.; Gao, J. Effect of Hydrological Connectivity on Soil Carbon Storage in the Yellow River Delta Wetlands of China. Chin. Geogr. Sci. 2021, 31, 197–208. [Google Scholar] [CrossRef]
- Guo, M.; Yang, L.; Zhang, L.; Shen, F.; Meadows, M.E.; Zhou, C. Hydrology, Vegetation, and Soil Properties as Key Drivers of Soil Organic Carbon in Coastal Wetlands: A High-Resolution Study. Environ. Sci. Ecotechnol. 2025, 23, 100482. [Google Scholar] [CrossRef]
- Vidojević, D.; Manojlović, M.; Ðorđević, A.; Nešić, L.; Dimić, B. Spatial Distribution of Soil Organic Carbon Stocks in Serbia. In Proceedings of the Global Symposium on Soil Organic Carbon 2017, Rome, Italy, 21 March 2017; Food and Agriculture Organization of the United Nations (FAO): Rome, Italy; pp. 195–198. [Google Scholar]
- Nizbat, Z.; Solaiman, Z.M.; O’Connor, J.; Siddique, K.H.M.; Bolan, N. Clay-Based Carbon Stabilisation of Organic Amendments for Enhanced Soil Organic Carbon Sequestration in Agricultural Soils. In Advances in Agronomy; Elsevier: Amsterdam, The Netherlands, 2025; Volume 193, pp. 79–145. [Google Scholar]
- Wang, Y.; Zhao, M.; Pei, W.; Guan, Q.; Liu, J.; Chen, Y.; Liu, J.; Zhang, Q. Research Overview on Isolated Wetlands. Water 2025, 17, 2013. [Google Scholar] [CrossRef]
- Bai, Y.; Qin, Y.; Lu, X.; Zhang, J.; Chen, G.; Li, X. Fractal Dimension of Particle-Size Distribution and Their Relationships with Alkalinity Properties of Soils in the Western Songnen Plain, China. Sci. Rep. 2020, 10, 20603. [Google Scholar] [CrossRef]
- Couic, E.; Gruau, G.; Gu, S.; Casquin, A. Variability of Phosphorus Sorption Properties in Hydromorphic Soils: Consequences for P Losses in Agricultural Landscapes. Eur. J. Soil Sci. 2022, 73, e13326. [Google Scholar] [CrossRef]
- Liu, X.; Lu, X.; Yu, R.; Sun, H.; Li, X.; Li, X.; Qi, Z.; Liu, T.; Lu, C. Distribution and Storage of Soil Organic and Inorganic Carbon in Steppe Riparian Wetlands under Human Activity Pressure. Ecol. Indic. 2022, 139, 108945. [Google Scholar] [CrossRef]
- Ji, H.; Han, J.; Xue, J.; Hatten, J.A.; Wang, M.; Guo, Y.; Li, P. Soil Organic Carbon Pool and Chemical Composition under Different Types of Land Use in Wetland: Implication for Carbon Sequestration in Wetlands. Sci. Total Environ. 2020, 716, 136996. [Google Scholar] [CrossRef] [PubMed]
- Valjarević, A.; Šiljeg, A.; Šiljeg, S.; Vujović, F.; Sahay, A. GIS-Based Water Stress Analysis in North African Drylands. J. Arid Environ. 2025, 230, 105427. [Google Scholar] [CrossRef]
- He, H.; Li, X.; Li, T. The Sustainable Development of Wetlands and Agriculture: A Literature Review. Agronomy 2025, 15, 746. [Google Scholar] [CrossRef]
- Macicasan, V.; Ocrain, A.; Balc, R.; Dicu, T.; Bodmer, M.D.V.; Roba, C. How Can Land Use Management in Traditional Cultural Landscapes Become a Policy Instrument for Soil Organic Carbon Sequestration and Climate Change Mitigation? A Transylvanian Case Study. Appl. Sci. 2024, 14, 9851. [Google Scholar] [CrossRef]
- Guan, Y.; Jin, S.; Zhang, Z.; Chen, S.; Chen, Y.; Liu, S.; Fan, M.; Ding, Y.; Yuan, X. A Comprehensive Review of Climate Warming and Carbon Dynamics in Wetland Ecosystems. Discov. Sustain. 2025, 6, 672. [Google Scholar] [CrossRef]
- Enache, N.; Deák, G.; Laslo, L.; Matei, M.; Holban, E.; Boboc, M.; Harabagiu, A. Modelling the Impact of Soil and Meteorological Parameters on Carbon Dynamics in Wetland Ecosystems. Int. J. Conserv. Sci. 2024, 15, 1523–1532. [Google Scholar] [CrossRef]
- Li, X.; Jin, H.; He, R.; Wang, H.; Sun, L.; Luo, D.; Huang, Y.; Li, Y.; Chang, X.; Wang, L.; et al. Impact of Wildfire on Soil Carbon and Nitrogen Storage and Vegetation Succession in the Nanweng’he National Natural Wetlands Reserve, Northeast China. Catena 2023, 221, 106797. [Google Scholar] [CrossRef]
- Bakšić, N.; Bakšić, D. Estimation of Fuel Loads and Carbon Stocks of Forest Floor in Endemic Dalmatian Black Pine Forests. iForest 2020, 13, 382–388. [Google Scholar] [CrossRef]
- Skalský, R.; Koco, Š.; Barančíková, G.; Tarasovičová, Z.; Halas, J.; Koleda, P.; Makovníková, J.; Gutteková, M.; Tobiášová, E.; Gömöryová, E.; et al. Land Cover and Land Use Change-Driven Dynamics of Soil Organic Carbon in North-East Slovakian Croplands and Grasslands Between 1970 and 2013. Ekológia 2020, 39, 159–173. [Google Scholar] [CrossRef]
- Jobbágy, E.G.; Jackson, R.B. The Vertical Distribution of Soil Organic Carbon and Its Relation to Climate and Vegetation. Ecol. Appl. 2000, 10, 423–436. [Google Scholar] [CrossRef]
- Man, W.; Mao, D.; Wang, Z.; Li, L.; Liu, M.; Jia, M.; Ren, C.; Ogashawara, I. Spatial and Vertical Variations in the Soil Organic Carbon Concentration and Its Controlling Factors in Boreal Wetlands in the Greater Khingan Mountains, China. J. Soils Sediments 2019, 19, 1201–1214. [Google Scholar] [CrossRef]
- Harbo, L.S.; Olesen, J.E.; Liang, Z.; Christensen, B.T.; Elsgaard, L. Estimating Organic Carbon Stocks of Mineral Soils in Denmark: Impact of Bulk Density and Content of Rock Fragments. Geoderma Reg. 2022, 30, e00560. [Google Scholar] [CrossRef]
- Corti, G.; Ugolini, F.C.; Agnelli, A.; Certini, G.; Cuniglio, R.; Berna, F.; Fernández Sanjurjo, M.J. The Soil Skeleton, a Forgotten Pool of Carbon and Nitrogen in Soil. Eur. J. Soil Sci. 2002, 53, 283–298. [Google Scholar] [CrossRef]
- Panagos, P.; De Rosa, D.; Liakos, L.; Labouyrie, M.; Borrelli, P.; Ballabio, C. Soil Bulk Density Assessment in Europe. Agric. Ecosyst. Environ. 2024, 364, 108907. [Google Scholar] [CrossRef]
- Lin, Z.; Dai, Y.; Mishra, U.; Wang, G.; Shangguan, W.; Zhang, W.; Qin, Z. Global and Regional Soil Organic Carbon Estimates: Magnitude and Uncertainties. Pedosphere 2024, 34, 685–698. [Google Scholar] [CrossRef]
- Al-Shammary, A.A.G.; Kouzani, A.Z.; Kaynak, A.; Khoo, S.Y.; Norton, M.; Gates, W. Soil Bulk Density Estimation Methods: A Review. Pedosphere 2018, 28, 581–596. [Google Scholar] [CrossRef]
- Chai, H.; He, N. Soil Bulk Density in Chinese Terrestrial Ecosystems and Its Significance for the Evaluation of Soil Carbon Storage on a Regional Scale. Acta Ecol. Sin. 2016, 36, 3903–3910. (In Chinese) [Google Scholar] [CrossRef]
- De Vos, B.; Van Meirvenne, M.; Quataert, P.; Deckers, J.; Muys, B. Predictive Quality of Pedotransfer Functions for Estimating Bulk Density of Forest Soils. Soil Sci. Soc. Am. J. 2005, 69, 500–510. [Google Scholar] [CrossRef]
- Kabała, C.; Gałka, B. Szacowanie gęstości objętościowej gleb górskich na podstawie zawartości węgla organicznego. Sylwan 2019, 163, 320–327. [Google Scholar] [CrossRef]
Disclaimer/Publisher’s Note: The statements, opinions and data contained in all publications are solely those of the individual author(s) and contributor(s) and not of MDPI and/or the editor(s). MDPI and/or the editor(s) disclaim responsibility for any injury to people or property resulting from any ideas, methods, instructions or products referred to in the content. |
© 2025 by the authors. Licensee MDPI, Basel, Switzerland. This article is an open access article distributed under the terms and conditions of the Creative Commons Attribution (CC BY) license.